


- Protocols

- Articles and Issues
- For Authors
- About
- Become a Reviewer


Determining the Age of Every Cell Within Each Budding Yeast Microcolony Combining Single-Cell Microencapsulation With Confocal Microscopy

Published: Vol 16, Iss 17, Sep 5, 2026 DOI: 10.21769/BioProtoc.5813 Views: 224
Reviewed by: Joyce ChiuAnonymous reviewer(s)
 PDF
PDF  Ask a question
Original research article
The authors used this protocol in:

Jan 2026

Protocol Collections
Comprehensive collections of detailed, peer-reviewed protocols focusing on specific topics




Abstract
Isogenic populations of Saccharomyces cerevisiae exhibit significant proliferative heterogeneity, with individual cells within a clonal culture displaying divergent growth rates and metabolic states. Investigating the origins of this variation requires a method to reconstruct the individual histories of cells within the population. This protocol describes a method for single-cell microencapsulation in alginate microspheres to create a physically stable, traceable, three-dimensional genealogical environment. By utilizing the alginate matrix to prevent daughter cell migration, the replicative history of a founder cell can be mathematically reconstructed. This is achieved by correlating the total cell count (N) within a developed microcolony with the total number of accumulated bud scars (n) visualized via confocal microscopy.
Key features
• Enables non-destructive 3D reconstruction of yeast genealogies, preserving spatial architecture and mapping all division events from a single founder cell.
• Implements a robust mathematical formula to determine the founder's replicative age, linking past mitotic history to current microcolony growth dynamics.
• Combines Flow Focusing® microencapsulation with precise confocal Z-stack analysis to review lineage-specific phenotypic heterogeneity in isogenic populations.
• Ideal for studying transgenerational inheritance and growth-rate diversification, providing a traceable, three-dimensional genealogical ecosystem for single-cell research.
Keywords: Saccharomyces cerevisiae Microencapsulation
Bud scars
Replicative age
Confocal microscopy
Microencapsulation
Bud scars
Replicative age
Confocal microscopy
Graphical overview
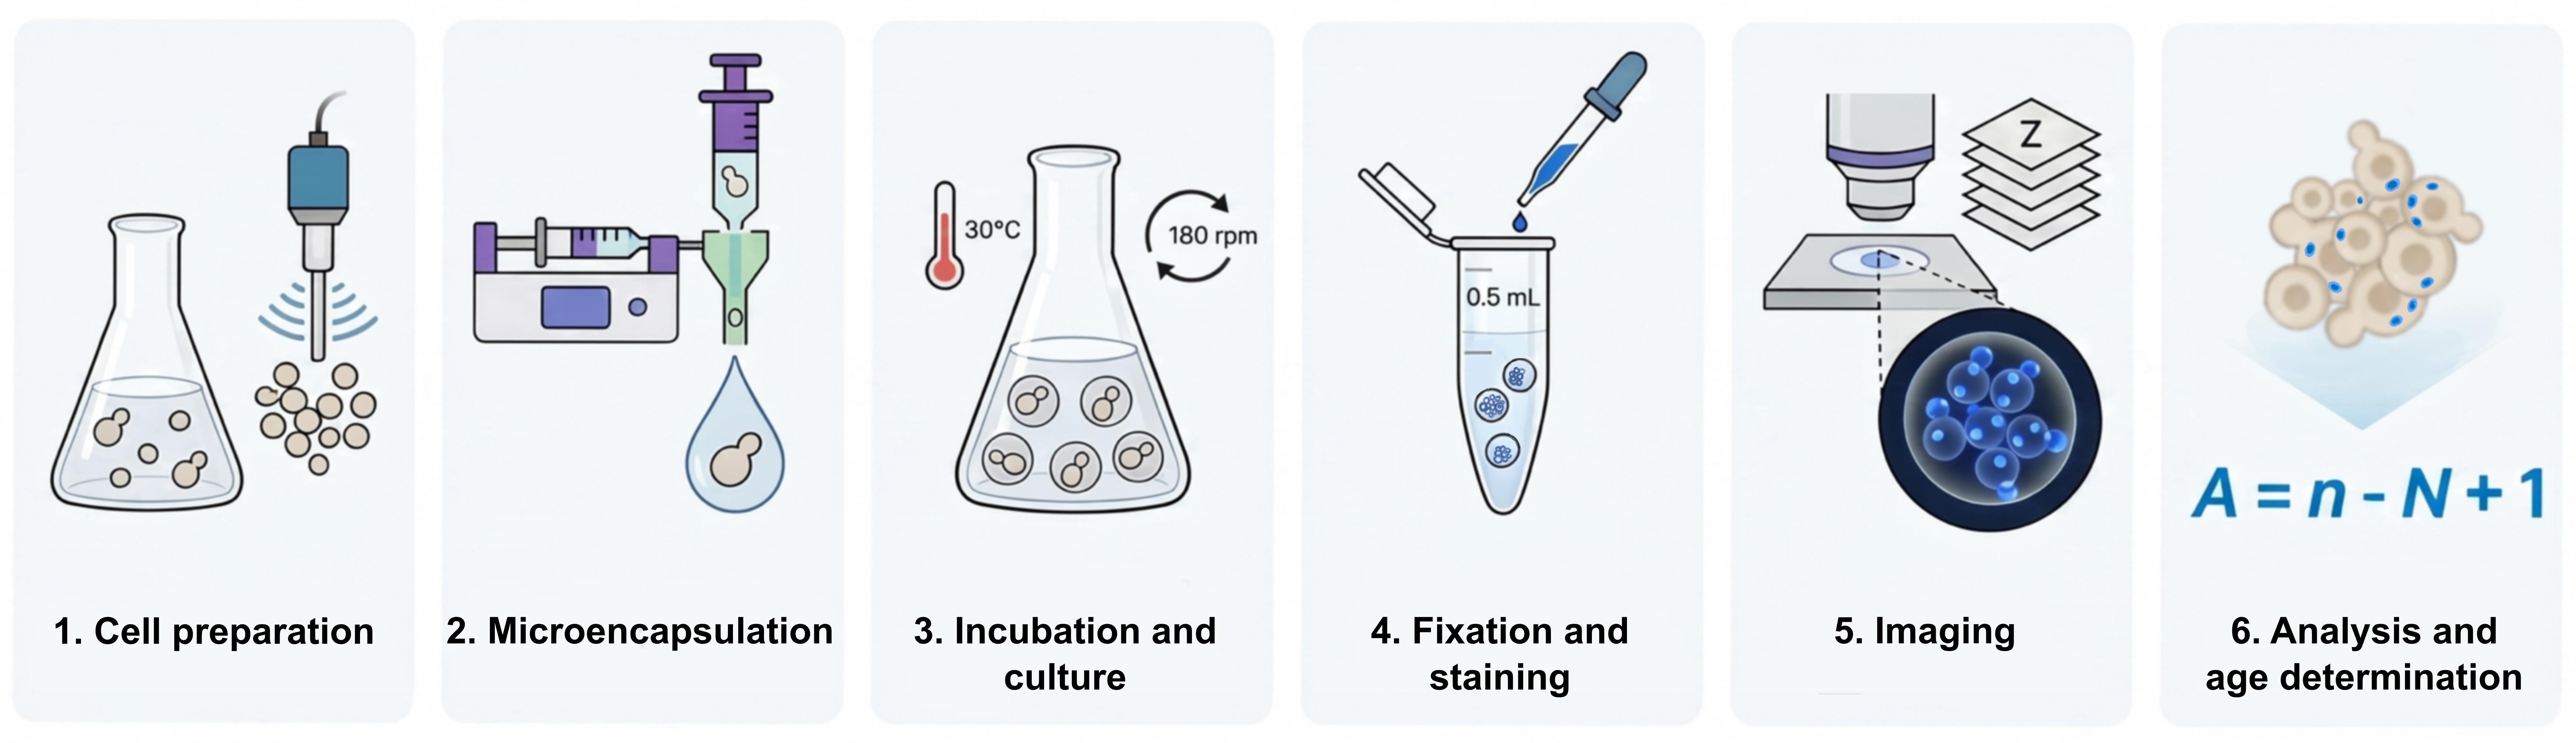
3D reconstructive genealogy and replicative age determination process
Background
Phenotypic and proliferative heterogeneity in yeast manifests as variations in cell size, cycle duration, and fitness, even in the absence of genetic or environmental flux. To study these phenomena, it is essential to determine the replicative age (A), the number of divisions a cell has undergone, of the ancestor, or founder cell, that initiated a specific lineage.
Single-cell microencapsulation in alginate provides a critical advantage over traditional liquid or agar cultures by transforming a microcolony into a traceable 3D ecosystem. The alginate scaffold ensures the physical stability of the lineage, preventing the drift of daughter cells and ensuring that every cell counted within the volume is a direct descendant of the original encapsulated founder. Because bud and birth scars are permanent chitinous markers left on the cell surface after every division, they provide a physical record of reproductive history. By calculating the total number of scars in a 3D volume relative to the total number of cells, the initial age of the founder cell can be accurately back-calculated.
Materials and reagents
Biological materials
1. Yeast strain BY4741 (EUROSCARF, Y00000) [1]
Reagents
1. D(+)-glucose anhydrous (VWR BDH Chemicals, catalog number: 24379.363)
2. Yeast extract (Condalab, catalog number: 1702.00)
3. Bacteriological peptone (Condalab, catalog number: 1616.05)
4. Adenine (adenine hemisulfate salt) (Sigma, catalog number: A9126-100G)
5. Alginate, alginic acid sodium salt from brown algae (Sigma, catalog number: 71238-250G)
6. Tri-sodium citrate dihydrate (Na3C6H5O7·2H2O) (VWR BDH Chemicals, catalog number: 27833.294)
7. CaCl2·2H2O (Sigma, catalog number: 223506-2.5KG)
8. Calcofluor White M2R (Fluorescent Brightener 28) (Sigma, catalog number: F3543)
9. Ethanol 96% (VWR BDH Chemicals, catalog number: 20823.327_T)
10. Tris base (Sigma, catalog number: T1503)
11. HCl 37% (PanReac AppliChem, catalog number: 131020.1211)
Solutions
1. Glucose 20% (w/v) (see Recipes)
2. Adenine 0.2% (w/v) (see Recipes)
3. YPAD (see Recipes)
4. Alginate 1.66% (w/v) (see Recipes)
5. CaCl2 3% (w/v) (see Recipes)
6. Citrate 10% (w/v) (see Recipes)
7. Calcofluor stock solution 1 μg/μL (see Recipes)
8. Ethanol 70% (see Recipes)
9. 1 M Tris-HCl pH 7.5. (see Recipes)
10. Tris-HCl-CaCl2 buffer solution (see Recipes)
11. Calcofluor working solution 0.1 μg/μL (see Recipes)
Recipes
1. Glucose 20% (w/v)
| Reagent | Final concentration | Quantity or volume |
|---|---|---|
| Glucose | 200 g/L | 20 g |
| Distilled water | - | Up to 100 mL |
| Total | - | 100 mL |
2. Adenine 0.2% (w/v)
| Reagent | Final concentration | Quantity or volume |
|---|---|---|
| Adenine | 2 g/L | 0.2 g |
| Distilled water | - | 100 mL |
| Total | - | 100 mL |
3. YPAD
| Reagent | Final concentration | Quantity or volume |
|---|---|---|
| Yeast extract | 10 g/L | 1 g |
| Bacterial peptone | 20 g/L | 2 g |
| Adenine (0.2% w/v) | 0.002 g/L | 8 mL |
| Glucose (20% w/v) | 20 g/L | 10 mL |
| Distilled water | - | 82 mL |
| Total | - | 100 mL |
4. Alginate 1.66% (w/v)
| Reagent | Final concentration | Quantity or volume |
|---|---|---|
| Alginate | 16.6 g/L | 0.166 g |
| Distilled water | - | 10 mL |
| Total | - | 10 mL |
5. CaCl2 3% (w/v)
| Reagent | Final concentration | Quantity or volume |
|---|---|---|
| CaCl2·2H2O | 30 g/L (anhydrous CaCl2) | 7.95 g |
| Distilled water | - | Up to 200 mL |
| Total | - | 200 mL |
6. Citrate 10% (w/v)
| Reagent | Final concentration | Quantity or volume |
|---|---|---|
| Na3C6H5O7·2H2O | 100 g/L (anhydrous Na3 citrate) | 56.98 g |
| Distilled water | - | Up to 500 mL |
| Total | - | 500 mL |
7. Calcofluor stock solution
| Reagent | Final concentration | Quantity or volume |
|---|---|---|
| Fluorescent Brightener 28 | 1 mg/mL | 1 mg |
| Distilled water | - | 1 mL |
| Total | - | 1 mL |
8. Ethanol 70% (v/v)
| Reagent | Final concentration | Quantity or volume |
|---|---|---|
| Ethanol 96% | 70% (v/v) | 364.6 mL |
| Distilled water | - | 135.4 mL |
| Total | - | 500 mL |
9. 1 M Tris-HCl pH7.5
| Reagent | Final concentration | Quantity or volume |
|---|---|---|
| Tris base | 1 M | 12.11 g |
| Distilled water | - | 70 mL |
| HCl 37% | - | Variable |
| Total | - | 100 mL (complete after pH adjustment with HCl) |
Sterilize by autoclaving.
10. Tris-HCl-CaCl2 buffer solution (2:1)
| Reagent | Final concentration | Quantity or volume |
|---|---|---|
| 1 M Tris-HCl pH 7.5 | 0.67 M | 60 mL |
| CaCl2 3% | 1% | 30 mL |
| Total | - | 90 mL |
11. Calcofluor working solution
| Reagent | Final concentration | Quantity or volume |
|---|---|---|
| Calcofluor stock solution (1 mg/mL) | 0.1 mg/mL | 50 μL |
| Tris-HCl-CaCl2 buffer solution (2:1) | - | 450 μL |
| Total | - | 500 μL |
Laboratory supplies
1. Microcentrifuge tubes 1.5 mL
2. Conical tubes 50 mL
3. Conical tubes 15 mL
4. Glass bottles (different sizes)
5. Nebulizers (Ingeniatrics®, catalog number: CLNEB002000)
6. Sterilization filters 0.2 μm (Corning, catalog number: 431219) for connection to the nebulizer inlet and sterilization of small-volume solutions
7. Sterilization filters 0.22 μm (Millipore® Express PLUS, Steritop® 45 mm Neck Size, 0.22 μm PES, 500 mL, catalog number: S2GPT05RE) for filter-sterilization of large-volume solutions
8. Cell strainer 40 μm (Corning, Falcon® 40 μm Cell Strainer, catalog number: CLS352340)
9. Syringe 5 mL (BD, EmeraldTM, catalog number: 307731)
10. Syringe 50 mL (BD, PlastipakTM, catalog number: 300866)
11. Micropipette tips 5–200 μL (DeltaLab, Daslab, catalog number: 162001)
12. Micropipette tips 100–1,000 μL (DeltaLab, Daslab, catalog number: 162222)
13. Glass beaker 50 mL (Schott Duran)
14. Microscope slides
15. Coverslips
16. Fluorescence immersion oil
Equipment
1. Bioencapsulation device (Ingeniatrics®, model: Cellena® Flow Focusing®)
2. Shaker (Eppendorf, model: New BrunswickTM Innova® 2300 Open Air Shaker)
3. Spectrophotometer (Eppendorf® 6135, Model Basic)
4. Sonicator (Diagenode, model: Bioruptor UCD-200TM-EX)
5. Centrifuge (Eppendorf, model: 5424)
6. Optical microscope (Leica, model: ICC50 HD)
7. Confocal microscope (Nikon, model: A1R+)
8. Bunsen burner
9. Micropipettes 0.2–2 μL, 100–1,000 μL, 2–20 μL, 20–200 μL (Gilson, PIPETMAN G, catalog number: 15664077)
10. Spoon
11. Autoclave
12. pH meter
13. Portable UV lamp (see General notes)
Software and datasets
1. Software Leica LAS Application Suite Version 3.0.0
2. Software Nikon NIS Elements Version 4.15
3. Microsoft® Excel Version 16.109.3
4. Fiji-ImageJ Version 2.16.0
5. All confocal microscopy images used to validate this protocol and perform the bud scar and microcolony genealogy analyses were deposited in the BioStudies database (http://www.ebi.ac.uk/biostudies/) and are available under the accession number S-BSST1071.
Procedure
A. Sample preparation and pre-processing by sonication
1. Prepare and filter-sterilize the alginate solution.
2. Prepare a culture of Saccharomyces cerevisiae in YPAD. It is mandatory to use an exponentially growing culture (approximately OD600 = 0.5) to minimize the presence of stationary-phase cells, which would otherwise introduce confounding artifacts into the proliferative data.
3. Cell dissociation (critical step for aggregation-prone strains): Before encapsulation, inspect the exponentially growing culture under an optical microscope to assess the presence of cell aggregates or doublets. For strains with a low tendency to aggregate, such as BY- background strains, sonication is usually not required. For aggregation-prone strains, such as W303-background strains, sonicate the exponentially growing culture in a Bioruptor device using the following settings: high power, 2.5 min total sonication time, with 30 s ON/30 s OFF cycles. Keep the samples in an ice-water bath throughout the sonication step to minimize sample heating. The mathematical reconstruction of the founder cell's age (A) is only valid if the microcolony originates from a true single-cell event. Insufficient dissociation may result in the encapsulation of more than one cell per capsule, leading to inaccurate cell number (N) values and invalidation of the founder-cell age calculation.
B. Microencapsulation system assembly and device setup
Caution: To maintain system integrity and avoid clogging by small particles, all solutions must be processed through 0.22 μm filters.
1. Connect a 0.2 μm sterilization filter to both the air inlet and the nebulizer of the Cellena® Flow Focusing® device (Figure 1A).
2. Clean the nebulizer with 5 mL of sterile distilled water to remove any possible residue in the system.
3. Dry the system by passing pressurized air through the nebulizer.
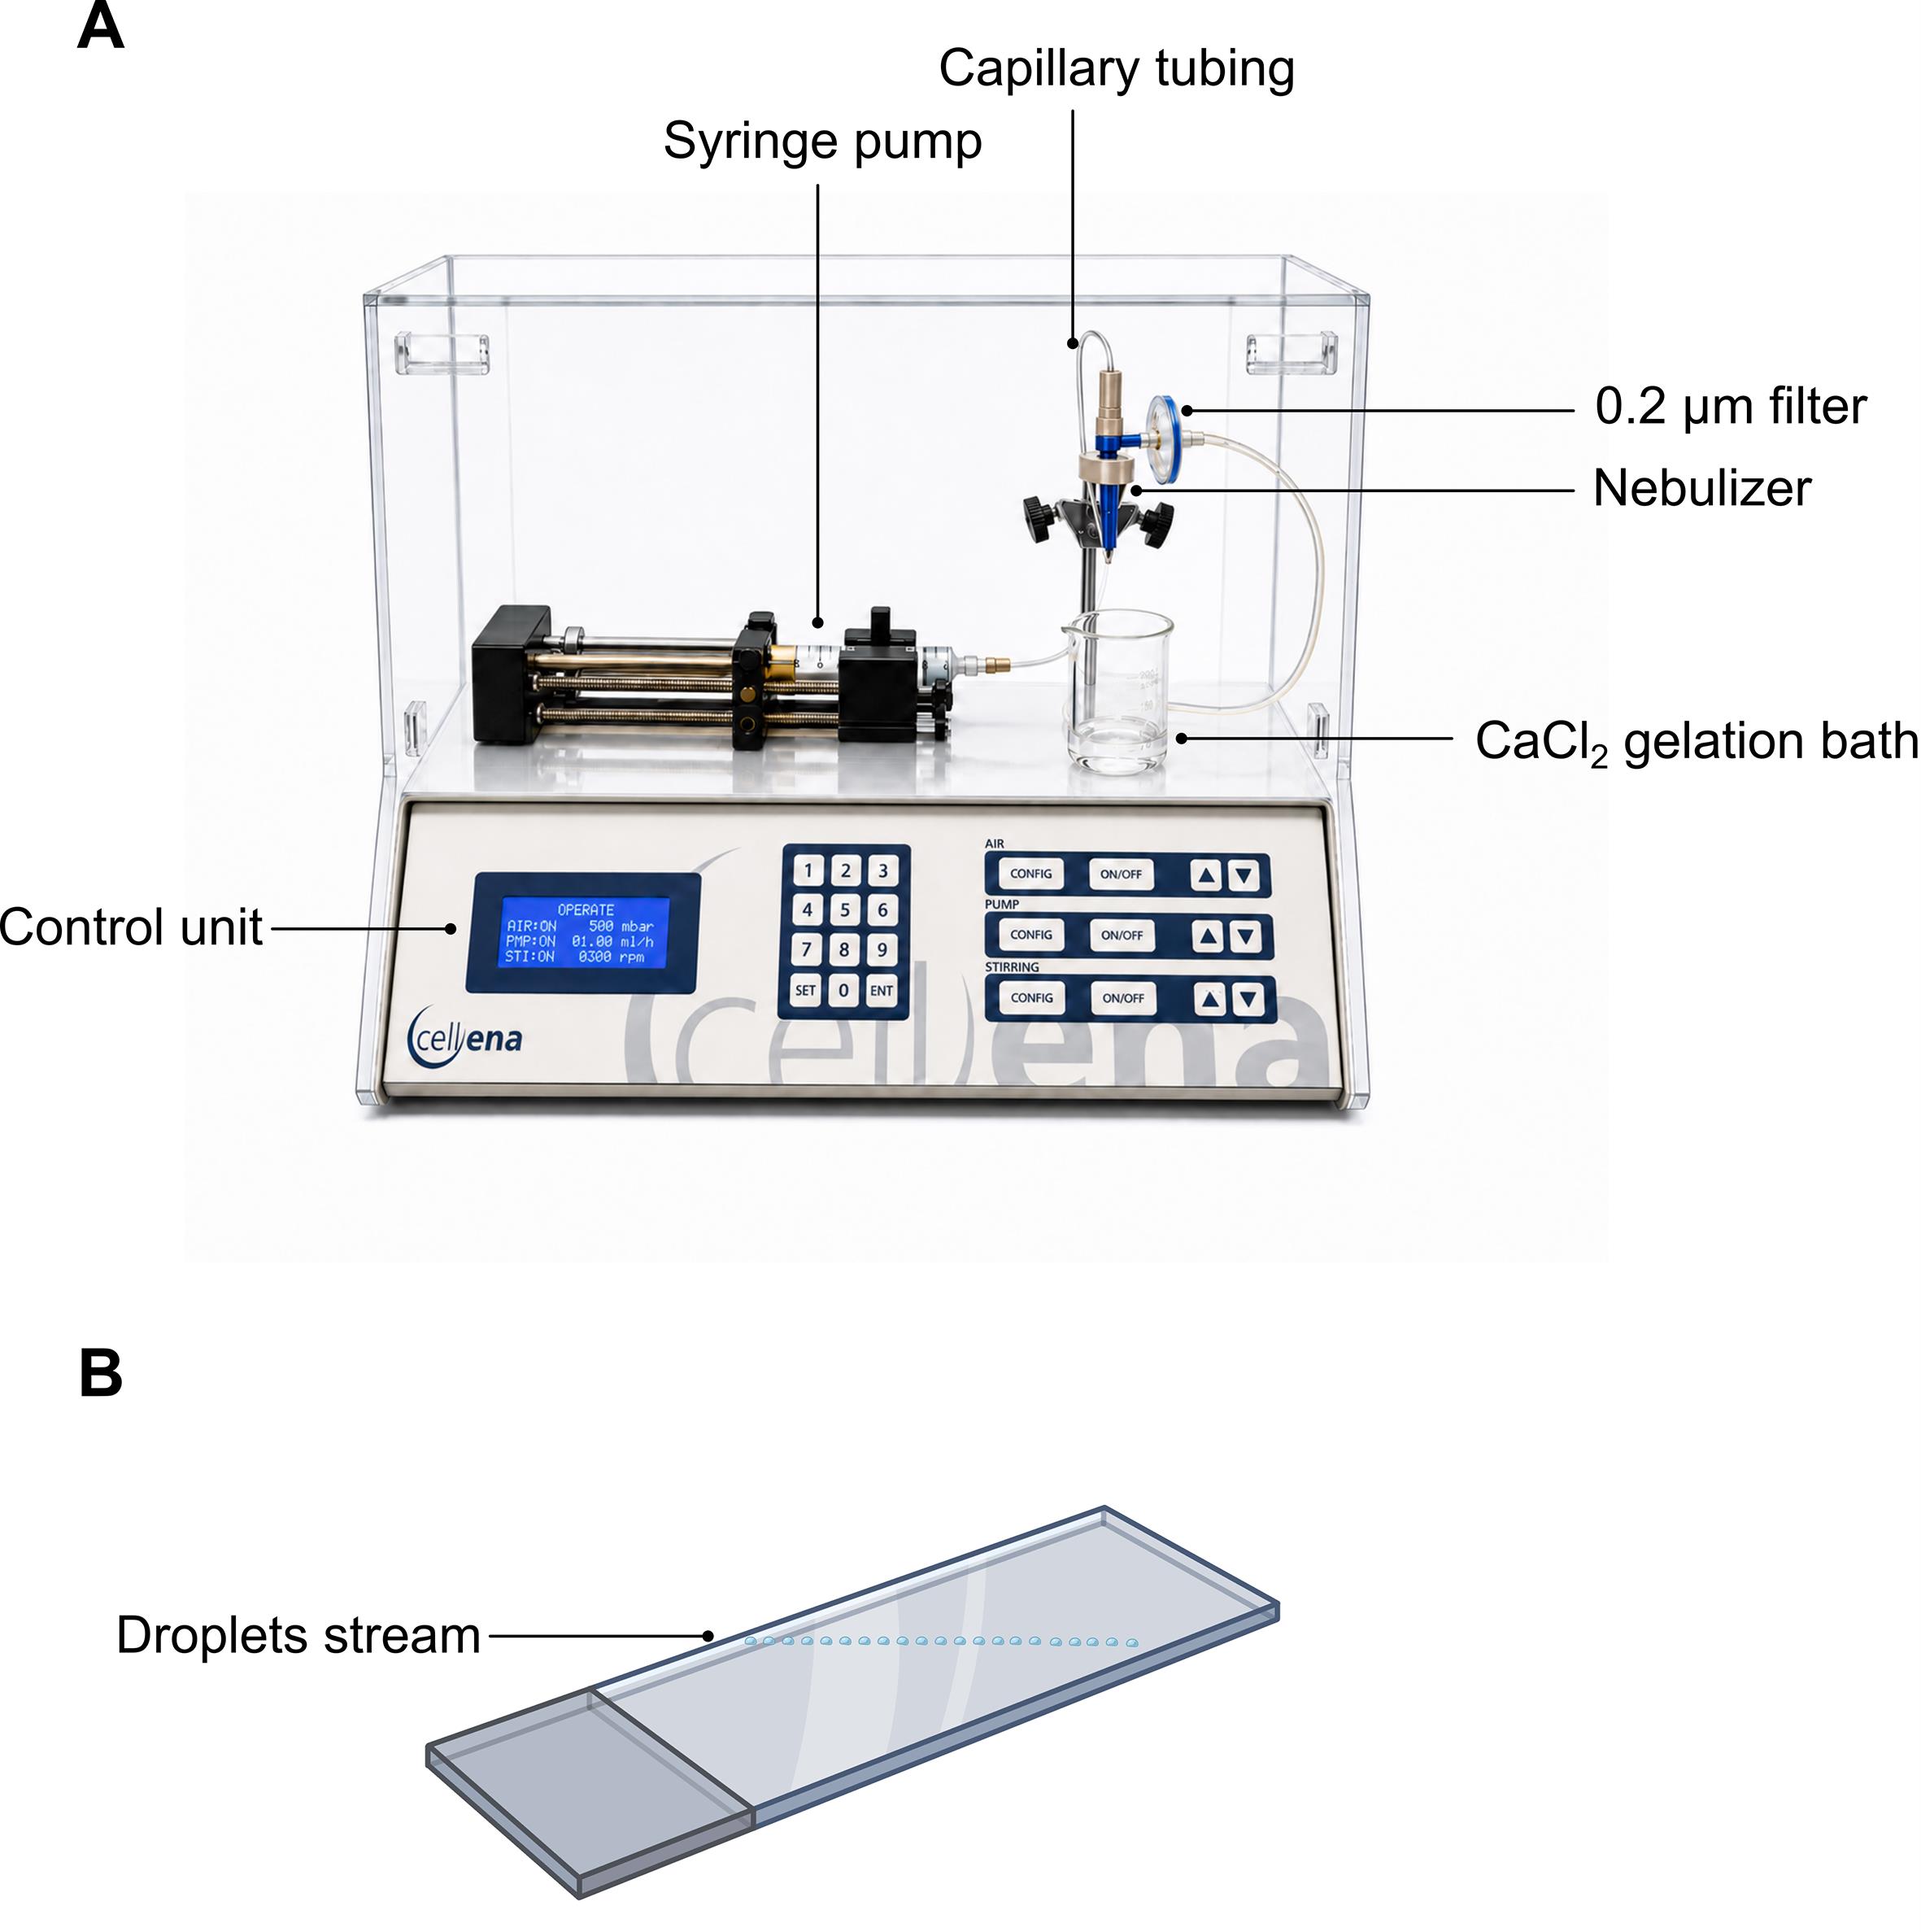
Figure 1. Cellena® microencapsulation system setup and assessment of alginate droplet uniformity. (A) Schematic representation of the Cellena® Flow Focusing® microencapsulation system, showing the main components required for alginate capsule generation, including the syringe pump, cell-alginate suspension capillary tubing, sterile air filter, nebulizer, and CaCl2 gelation bath under magnetic stirring. (B) Representative microscope slide test used to assess droplet uniformity before starting encapsulation. A brief passage of the slide beneath the nebulizer outlet should produce evenly distributed alginate droplets of similar size, indicating a single, stable, and uniform droplet stream.
4. Switch on the air pump and set the following Cellena® parameters: air flow, 1.234 mbar; pressure, 50 mbar.
5. Set the syringe pump parameters: syringe diameter, 12.06 mm (standard for a 5 mL syringe); flow rate, 21 mL/h.
6. Adjust the beaker height so that the distance between the nebulizer outlet and the upper edge of the beaker is 4.5 cm; set the magnetic stirring to 300 rpm.
C. Sample preparation and microencapsulation
1. Prepare the encapsulation mixture in a sterile container: mix 2.7 mL of 1.66% filtered sodium alginate, 20 μL of the sonicated cellular suspension, and 280 μL of filtered YPAD medium.
2. Stir the mixture at 300 rpm for 10 min using a magnetic stirring bar previously sterilized.
3. Place a 50 mL beaker containing 15 mL of 3% calcium chloride solution beneath the nebulizer.
4. Load the sample into a sterile 5 mL syringe and connect it to the nebulizer through a capillary feed tube.
Critical: Carefully remove all air bubbles from the syringe to prevent flow disruption and capsule damage.
5. Initiate the flow and monitor droplet formation at the nebulizer outlet. Start at 21 mL/h to prime the system and establish a stable flow. Once a continuous and uniform droplet stream is observed, reduce the flow rate to the final encapsulation rate of 1 mL/h.
Note: Verify droplet uniformity by passing a microscope slide briefly under the nebulizer flow (Figure 1B).
See Troubleshooting: If the nebulizer becomes clogged, perform a cleaning step with 10% citrate solution.
Caution: Ensure the flow does not hit the beaker walls or the stirring bar to avoid the formation of artifacts.
Caution: Do not maintain the 21 mL/h flow rate longer than necessary. Prolonged operation at high flow rates may generate excessive internal pressure and compromise the internal components of the nebulizer.
6. Monitor the process every 15–20 min. Ensure that the flow is constant in direction and there are no artifacts in the gelation solution.
D. Incubation and microcolony growth
1. After the sample syringe is empty, allow the capsules to stir in the solution for an additional 15 min to ensure complete gelation.
2. Place a 10 μL aliquot on a glass slide and verify proper encapsulation of a single cell per microcapsule by optical microscopy observation with a 40× objective.
3. Filter the capsules using a sterile 40 μm cell strainer under sterile conditions (Bunsen burner) to recover the capsules after gelation and separate them from the CaCl2 gelation solution (Figure 2).
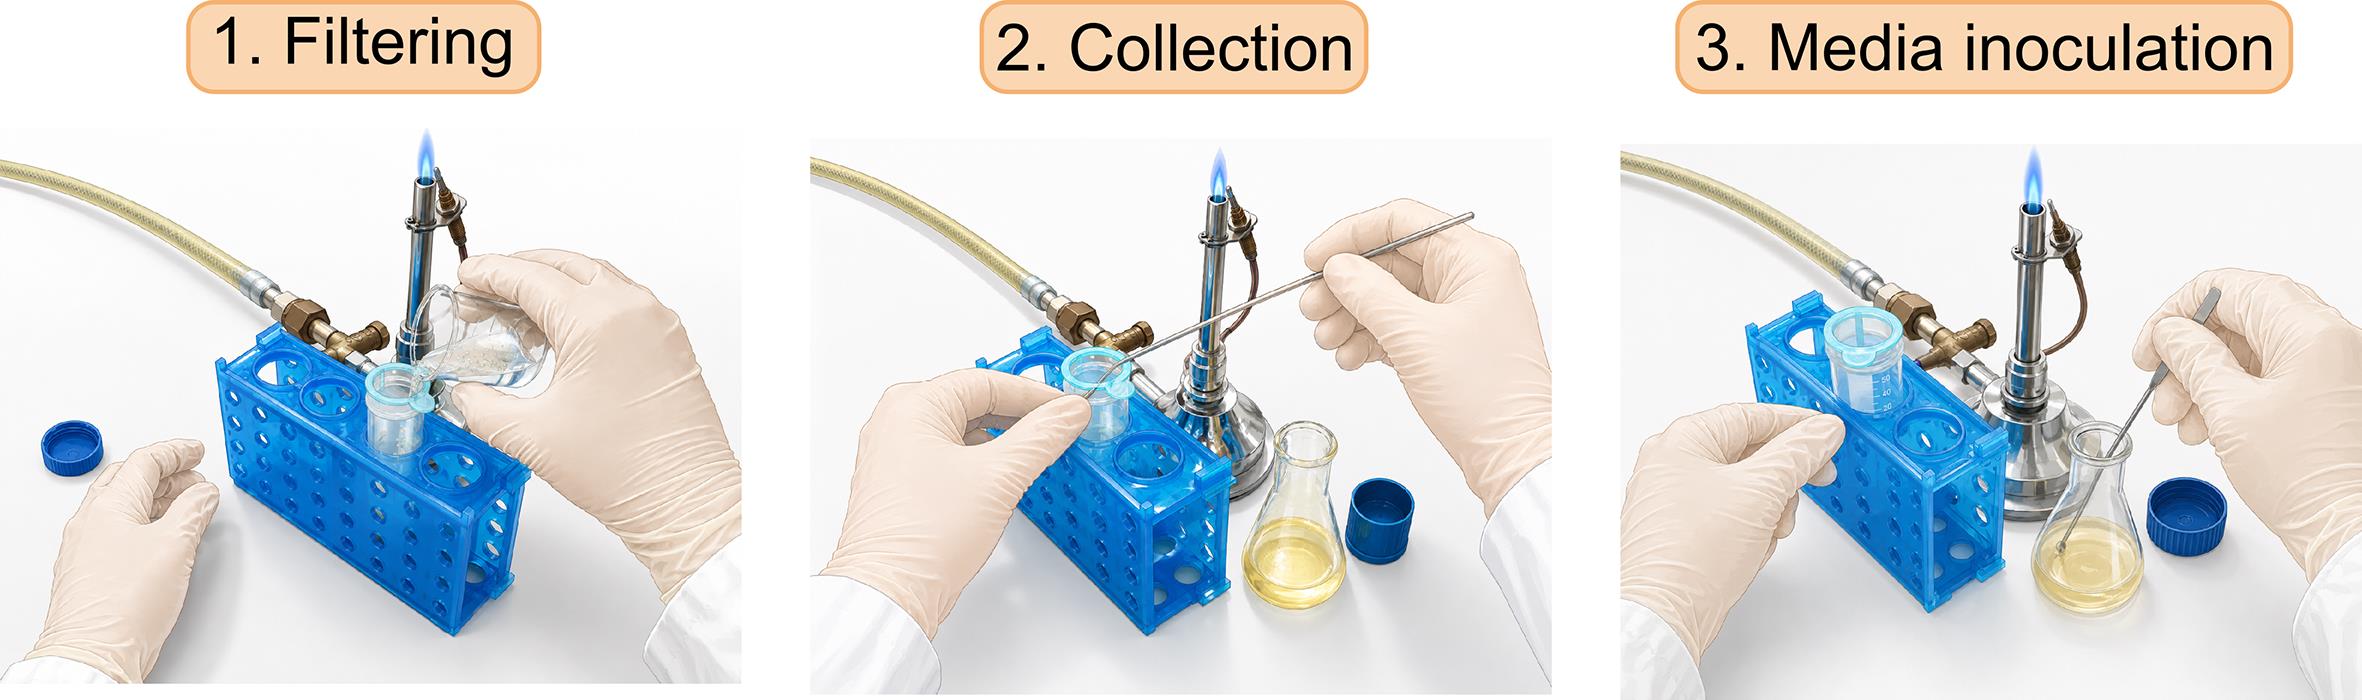
Figure 2. Recovery of alginate capsules after gelation and inoculation into fresh culture medium. The workflow comprises three sequential steps. (1) Filtering: Following capsule formation, the suspension is passed through a sterile 40 μm cell strainer to retain the alginate capsules and remove the CaCl2 gelation solution. (2) Collection: The retained capsules are gently recovered from the cell strainer under sterile conditions using a sterile spoon. (3) Media inoculation: The collected capsules are transferred into a flask containing fresh, filtered YPAD medium for incubation and microcolony growth.
4. Transfer the collected gel/capsules into 10 mL of fresh, filtered YPAD medium.
5. Incubate the culture at 30 °C with constant agitation at 180 rpm for 13–15 h.
Note: 13–15 h is the optimal time to observe maximum growth before the colonies of BY strains cause the capsules to collapse.
6. Place a 10 μL aliquot on a glass slide and verify microcolony growth and capsule integrity by optical microscopy inspection with a 40× objective.
See Troubleshooting if capsules are disaggregated or collapsed.
Pause point: Add an equal volume of 70% ethanol (10 mL, 1:1 ratio with the medium) to the capsule suspension to stop cell growth, resulting in a final ethanol concentration of approximately 35%. Store at 4 °C for at least 2 h.
E. Calcofluor staining and confocal acquisition
1. Filter the fixed microcolonies using a 40 μm cell strainer to retain the capsules during washing and remove excess staining or washing solution before imaging. Wash them twice with 5 mL of a Tris-HCl-CaCl2 (2:1) buffer solution.
2. Resuspend the capsules in 0.5 mL of a 0.1 mg/mL calcofluor solution.
3. Incubate for 5–10 min at room temperature in complete darkness.
4. Filter and wash the capsules again with 5 mL of Tris-HCl-CaCl2 buffer to remove excess dye.
5. Place the capsules on a glass slide and visualize using a Nikon A1R+ laser scanning confocal microscope with a Plan Apo 60×/1.40 NA oil-immersion objective and a DAPI-compatible excitation and detection configuration filter.
Critical: Capture Z-axis slices every 0.5 μm to ensure the entire volume of the microcolony is recorded for accurate counting.
F. Bud scar and cell counting
1. Open the complete confocal Z-stack of each microcolony using NIS Elements software or any other suitable image-analysis software, such as Fiji or ImageJ (both open source).
2. Examine the optical sections sequentially from the upper to the lower limit of the microcolony. Do not perform the analysis using only a maximum-intensity projection, as overlapping cells and bud scars may not be distinguishable.
3. Count the total number of cells in the microcolony and record this value as N:
a. Track each cell throughout consecutive Z-sections to avoid counting the same cell more than once.
b. Include only cells that can be unambiguously assigned to the microcolony.
c. Exclude microcolonies in which individual cells cannot be reliably resolved.
4. Count the number of bud scars present on each individual cell by examining all Z-sections in which that cell is visible.
a. A bud scar should be counted only when it can be clearly distinguished from diffuse cell-wall staining and from the bud neck.
b. Scars appearing in consecutive Z-sections should be considered the same scar.
c. Record the number of bud scars for every cell in the microcolony.
5. Calculate the total number of bud scars in the microcolony by adding the bud scars counted in all individual cells. Record this value as n.
6. Organize the cells according to their number of bud scars and record for each bud scar category the corresponding number of cells (see Figure 3). A recommended data-recording table is shown in Table 1.
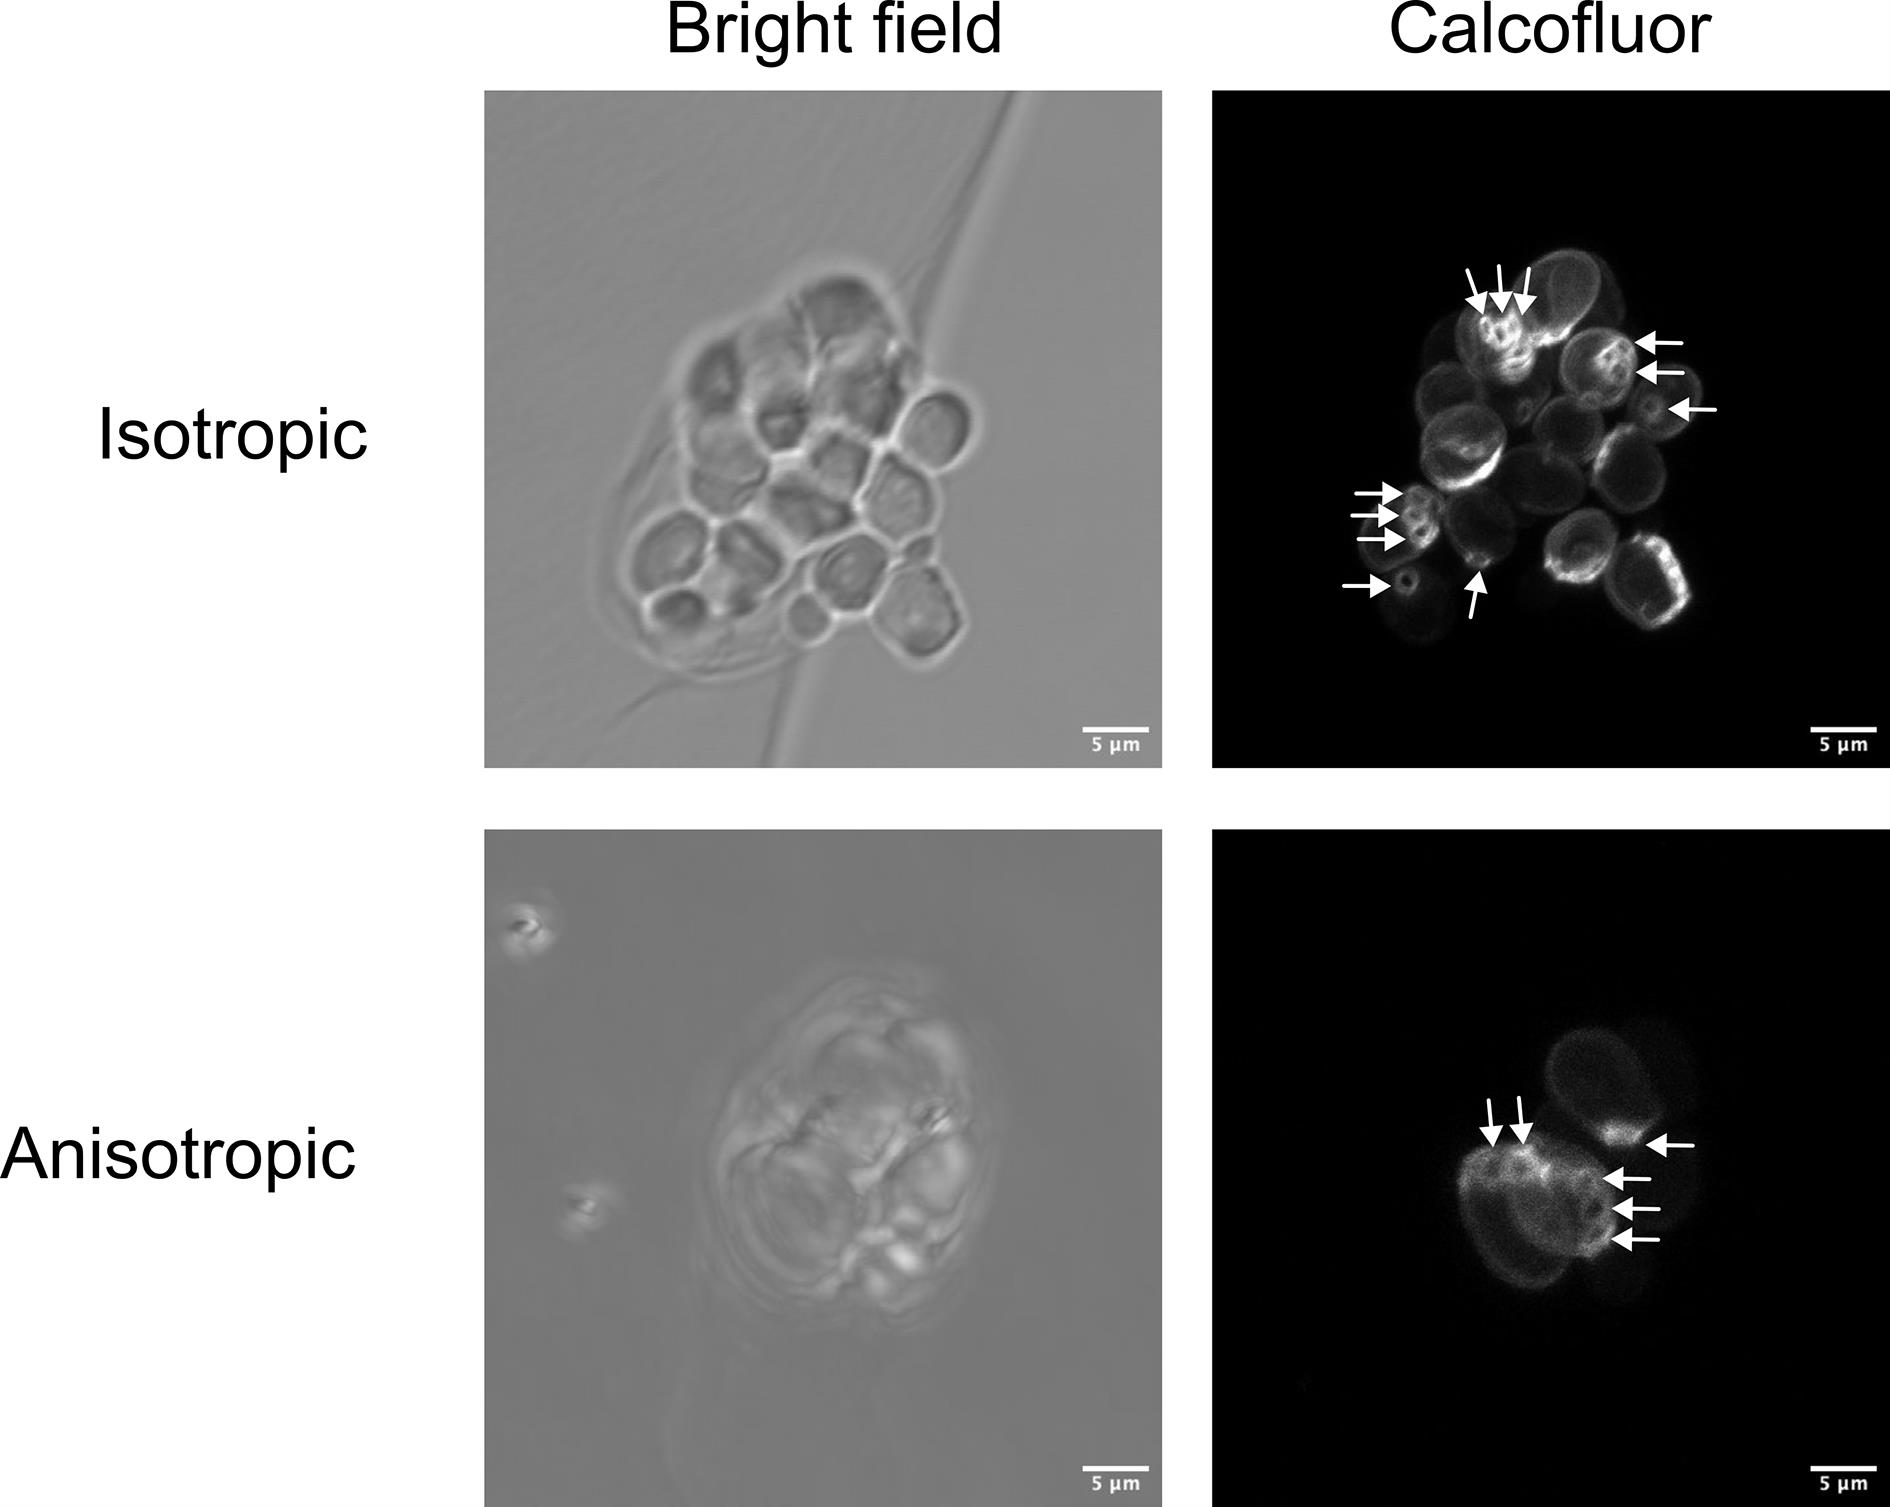
Figure 3. Representative examples of isotropic and anisotropic microcolony growth patterns and bud scar visualization. Representative Z-projections of calcofluor white–stained microcolonies are shown together with the corresponding brightfield images. The upper row shows an isotropic microcolony, in which bud scars are distributed among several cells, indicating that multiple cells contributed to microcolony expansion. The lower row shows an anisotropic microcolony, in which most bud scars are concentrated in one or two cells, whereas the remaining cells contain few or no bud scars, indicating that one cell accounted for most division events. Brightfield images show the morphology and spatial organization of the cells within the microcolony, whereas calcofluor fluorescence images show bud scars. White arrows indicate representative bud scars; not all bud scars present in the microcolonies are labeled. Z-projections are shown only for visualization purposes. Bud scar counting and genealogy reconstruction should be performed by examining the complete confocal Z-stack. Scale bars, 5 μm.
Table 1. Recommended data-recording table for bud scar counting. For each microcolony, cells are grouped according to the number of bud scars detected per cell after examination of the complete confocal Z-stack. The number of cells in each bud scar category should be recorded and used to calculate the total number of cells (N) and the total number of bud scars (n) in the microcolony. Additional rows can be added where more than four bud scars are detected, if desired.
| Bud scars per cell | Number of cells |
|---|---|
| 0 | xxx |
| 1 | xxx |
| 2 | xxx |
| 3 | xxx |
| >4 | xxx |
| Total | N cells; n bud scars |
7. Identify the cell with the highest number of bud scars as the most likely founder cell. Confirm that its identification is compatible with the overall bud scar distribution and the reconstructed genealogy of the microcolony.
8. Perform the following quality control checks:
a. Confirm that the complete microcolony was included in the Z-stack.
b. Verify that the total number of bud scars satisfies the condition n > N-2.
c. Review the counting if an inconsistent or negative founder-cell age is obtained during data analysis. See Troubleshooting.
d. Exclude microcolonies containing more than one independently growing cell cluster or for which single-cell origin, cell number, or bud scar number cannot be reliably established.
e. Save the original Z-stack, the complete counting table, and any annotations used for cell and bud scar identification.
Data analysis
1. For each microcolony, collect the following values:
a. Total number of cells, N.
b. Total number of bud scars, n.
c. Number of bud scars assigned to each cell.
d. Number of cells in each bud scar category.
e. Identity of the most likely founder cell.
f. Relevant experimental information, including strain, condition, incubation time, and biological replicate.
2. Estimate the replicative age of the founder cell at the time of encapsulation using the following formula:
A = n - N + 1
Where:
A is the replicative age of the founder cell at the time of the encapsulation.
n is the total number of bud scars counted in the microcolony.
N is the total number of cells in the microcolony.
This calculation is based on the assumption that the microcolony originated from a single encapsulated cell. Starting from the founder cell, the formation of a microcolony containing N cells requires N - 1 division events. Therefore, bud scars exceeding N - 1 correspond to a division already completed by the founder cell before encapsulation.
3. Classify the founder cell according to its estimated replicative age:
a. A = 0: newborn founder cell.
b. A ≥ 1: mother founder cell.
c. Additional age categories may be established according to the experimental question, for example, 0, 1–2, and ≥3 previous divisions.
4. Apply the following quality control criterion: n > N-2. Microcolonies that do not meet this criterion must be recounted. If the discrepancy cannot be resolved, exclude that microcolony from further analysis.
5. Exclude a microcolony from the final dataset when any of the following conditions apply:
a. More than one cell was present in the capsule at the beginning of the experiment.
b. More than one independent microcolony is observed within the same capsule.
c. The complete microcolony is not included in the Z-stack.
d. Individual cells or bud scars cannot be reliably resolved.
e. The total cell or bud-scar count remains inconsistent after recounting.
f. The calculated founder cell age is negative.
g. A single biologically coherent genealogy cannot be reconstructed.
6. When required, reconstruct the likely genealogy of the microcolony from the distribution of bud scars among individual cells. Each division event produces one new daughter cell and adds a bud scar to the corresponding mother cell.
7. Classify the microcolony growth pattern as:
a. Isotropic growth: Division events are distributed among several cells in the microcolony, indicating that most cells contribute to microcolony expansion.
b. Anisotropic growth: One cell, usually the founder or one of its early descendants, accounts for most of the division events, whereas the remaining cells undergo few or no further divisions.
8. Analyze the distribution of founder cell replicative ages and, when applicable, compare it with the replicative age distribution of the initial exponential culture.
9. Report the total number of microcolonies analyzed, the number excluded, and the reason for each exclusion. Treat individual microcolonies as observational units, while biological replicates should correspond to independent cultures and encapsulation experiments.
10. Select the statistical analysis according to the comparison performed. Distributions of founder cell age, growth pattern, or microcolony categories may be compared using a Chi-squared test, provided that the assumptions of the test are met. Report the statistical test, sample size, number of independent biological replicates, and exact p-value whenever possible.
Validation of protocol
This protocol was validated in Delgado-Román et al. [2], where single-cell microencapsulation was combined with calcofluor white staining and confocal microscopy to analyze the genealogy and replicative age of cells within S. cerevisiae microcolonies. In the original study, the encapsulation conditions were optimized to obtain single-cell-derived microcolonies, with fewer than 1% microcapsules containing more than one founder cell. These capsules were excluded from downstream analyses.
For each experiment or condition, at least 100 valid capsules or microcolonies should be counted after applying the exclusion criteria described in the Data Analysis section. Depending on the experimental question, the resulting categorical distributions, such as founder-cell replicative age categories or growth-pattern classes, can be compared using a Chi-square test. When comparing quantitative measurements or cell-cycle phase distributions across replicative-age groups, ANOVA can be applied as long as its assumptions are met. The statistical tests used, the number of biological replicates, the total number of valid capsules or microcolonies analyzed, and the exclusion criteria applied should be reported for each experiment.
General notes and troubleshooting
General notes
1. Ensure that nebulizers, tubing, magnetic stir bars, cell strainers, and glass beakers are sterilized by autoclaving before starting the protocol.
2. Use one nebulizer per strain or experimental condition whenever possible. If the number of available nebulizers is limited, clean the nebulizer between uses following the protocol described in the Troubleshooting section.
3. Nebulizers can be reused up to three additional times after the initial use, if they have been thoroughly cleaned with 10% citrate solution, rinsed with sterile distilled water, and autoclaved before reuse.
4. Whenever possible, place the Cellena® Flow Focusing® system inside a laminar flow cabinet to minimize the risk of microbial contamination. If this is not feasible, the system may be protected with a methacrylate enclosure. Before starting the procedure, thoroughly clean the device, enclosure, and working surfaces with 70% ethanol. Then, place a portable UV lamp inside the enclosure and irradiate the enclosed workspace for the time specified by the lamp manufacturer and in accordance with safety procedures. UV irradiation must be performed before introducing the samples and with no personnel exposed to the UV light. A methacrylate compartment and UV treatment (together with the sterilization of all components) reduce the risk of contamination but do not provide the same level of environmental control as a laminar flow cabinet. Therefore, all subsequent manipulations must be performed using strict aseptic technique.
5. Unless otherwise stated, all solutions that come into contact with the nebulizer must be filter-sterilized to prevent small particles from entering and clogging the system.
6. Phosphate-, EDTA-, and citrate-containing solutions can interfere with alginate crosslinking and capsule stability. Avoid their use in culture media and washing solutions. Citrate solution should only be used for the nebulizer cleaning protocol and must be thoroughly removed by flushing and rinsing with sterile distilled water before capsule formation.
7. A high proportion of empty capsules is expected under these conditions. The cell concentration was optimized to maximize the probability of encapsulating a single yeast cell per capsule while minimizing the occurrence of capsules containing multiple cells.
8. The encapsulation time is approximately 2.5–3 h per strain or experimental condition. When several samples are processed in parallel, two strategies can be used depending on the experimental design. First, all cultures can be grown to approximately OD600 = 0.5, mixed with alginate, loaded into syringes, and kept at 4 °C until encapsulation. In this case, capsules from the samples processed first can be kept in the CaCl2 gelation solution at 4 °C while the remaining samples are being encapsulated. Once all samples have been processed, capsules can be collected and inoculated into fresh culture medium at the same time. Alternatively, cultures can be staggered so that each strain or condition reaches the proper OD600 at the time of encapsulation. The most appropriate strategy should be selected according to the biological question, the number of samples, and the need to synchronize the start of post-encapsulation growth across conditions.
Troubleshooting
Problem 1: Capsules do not form.
Possible cause: Insufficient Ca2+ concentration in the gelation solution.
Solution: Ensure that the gelation solution contains 3% (w/v) CaCl2. Consider the reagent's hydration state when preparing the solution, as many manufacturers supply calcium chloride as CaCl2·2H2O rather than anhydrous CaCl2.
Problem 2: Formation of non-uniform droplet stream (double streams, inconsistent distance between droplets, stream unaligned with the nebulizer).
Possible cause: Partial or complete clogging of the nebulizer.
Solution: Perform the following cleaning protocol:
a. Disconnect the syringe containing the cell-alginate suspension and keep it under sterile conditions.
b. Connect a separate syringe and slowly flush the microfluidic channels with 5 mL of sterile 10% citrate solution. Apply gentle, steady pressure to avoid damaging the nebulizer’s internal components.
c. Using a syringe, slowly flush the system with 5 mL of sterile distilled water to remove citrate and residual salts. Avoid applying excessive pressure, as this may damage the nebulizer.
d. Ensure that the citrate solution is completely removed, as residual citrate may chelate Ca2+ and interfere with alginate crosslinking and capsule formation.
e. Reconnect the syringe containing cell-alginate suspension and resume encapsulation only after confirming the formation of a continuous and uniform stream of fine alginate droplets (see Figure 1B).
Problem 3: Formation of oversized and irregular capsules.
Possible cause: Partial clogging of the nebulizer, leading to alginate accumulation and foaming at the nebulizer outlet instead of the formation of a uniform droplet stream.
Solution: Stop the encapsulation process and disconnect the syringe containing the cell-alginate suspension. Keep the syringe aside under sterile conditions while cleaning the nebulizer. Connect a separate syringe and clean the nebulizer following the protocol described for Problem 2. Before reconnecting the cell-alginate syringe and resuming the procedure, verify that a continuous and uniform stream of fine droplets can be generated (Figure 1B).
Problem 4: Capsules aggregate or fuse during gelation.
Possible causes: Insufficient mixing of the gelation solution or capsules falling repeatedly onto the same area.
Solution: Maintain gentle and homogeneous agitation of the CaCl2 solution during capsule formation. Avoid vigorous agitation, as this may deform or damage newly formed capsules.
Problem 5: More than one cell per capsule immediately after encapsulation.
Possible cause: Cell aggregation before encapsulation. This is particularly common when cells are grown in peptone-containing media.
Solution: Subject the cell suspension to the validated sonication procedure before mixing it with alginate. If cell aggregates remain, perform additional sonication cycles while using the minimum number of cycles required to obtain a homogeneous single-cell suspension. Avoid excessive sonication, as it may reduce cell viability.
Problem 6: Heterogeneous capsule size.
Possible causes: Air bubbles in the tubing system that create an uneven flux of cell suspension, incorrect position of the syringe in the syringe pump, unstable airflow, or partial clogging of the nebulizer.
Solutions: Check the syringe and tubing and remove any air bubbles before starting encapsulation. Confirm that the syringe is correctly positioned and secured in the syringe pump and that the programmed flow rate and airflow remain stable. Check all tubing connections. If the problem persists, clean the nebulizer following the protocol described for Problem 2.
Problem 7: Capsules are no longer visible after 13–15 h of growth.
Possible cause: The pH of the culture medium is incompatible with capsule stability.
Solution: Check and adjust the pH of the culture medium before use. Prepare the medium according to the specified formulation and avoid phosphate-, citrate-, or EDTA-containing solutions, as these may interfere with alginate crosslinking and capsule stability.
Problem 8: Capsules break after 13–15 h of growth.
Possible cause: Excessive cell proliferation inside the capsules, resulting in capsule rupture.
Solution: Optimize incubation time for each strain and experimental condition. Reduce the growth period if capsules rupture before the intended endpoint.
Problem 9: Capsules break during collection, washing, or transfer.
Possible causes: Excessive mechanical stress during handling or incomplete alginate crosslinking.
Solutions: Handle capsules gently. Verify the CaCl2 concentration and ensure that the capsules remain in the gelation solution for the complete incubation time indicated in the protocol.
Problem 10: Weak or absent calcofluor staining.
Possible causes: Incorrect calcofluor concentration, insufficient staining time, deterioration or precipitation of the staining solution, or incorrect microscope acquisition settings.
Solution: Prepare the calcofluor white working solution at the concentration specified in the protocol and protect it from light. Check the solution for precipitates before use and prepare a fresh working solution if necessary. Verify the excitation wavelength, emission detection range, laser power, and detector gain before acquiring the complete set of samples. If required, optimize the staining time within the range indicated in the protocol.
Problem 11: High fluorescence background after calcofluor staining.
Possible causes: Excess of calcofluor remaining in the sample, insufficient washing, or excessive calcofluor concentration.
Solution: Filter the capsules after staining and wash them gently but thoroughly with the Tris-HCl-CaCl2 washing buffer. If background remains high, reduce staining time or calcofluor concentration while confirming that bud scars remain clearly detectable.
Problem 12: Uneven calcofluor staining within a microcolony.
Possible causes: Incomplete penetration of the dye into large or densely packed microcolonies, capsule aggregation during staining, or insufficient mixing of the staining suspension.
Solution: Ensure that the capsules are fully resuspended in the calcofluor solution and are not aggregated. Gently mix during staining without damaging the capsules. If necessary, increase the staining time slightly and apply the same conditions to all samples.
Problem 13: Incoherent high replicative age of a microcolony.
Possible cause: More than one cell was initially encapsulated in the same capsule.
Solution: Review the initial images to determine whether the capsule contained more than one founder cell. Exclude the microcolony from the analysis if single-cell encapsulation cannot be ensured.
Problem 14: A negative value is obtained when calculating the replicative age of a microcolony.
Possible causes: The number of bud scars was underestimated, or an error occurred during the reconstruction of the microcolony genealogy.
Solution: Recount the bud scars and repeat the genealogy reconstruction and replicative age calculation.
Acknowledgments
This publication is part of the project PID2023-148037NB-C21, funded by MICIU/AEI/10.13039/501100011033 and by ERDF/EU, to S.C. and M.M.C. This work has also been supported by grants from the Ministerio de Ciencia e Innovación-Agencia Estatal de Investigación (BFU2016-77728-C3-1-P to M.M.C. and S.C. and PID2020-112853GB-C32 to M.M.C.), Andalusian Government and European Union funds (FEDER) (US-1256285 to M.M.C. and BIO271 to S.C.). This protocol was described and validated in our original paper: Delgado-Roman et al. [2] Open Biol 1 January 2026; 16 (1): 250249. https://doi.org/10.1098/rsob.250249. We thank all the people of the IBiS Gene Expression lab for helpful discussion and all technicians from IBiS and CITIUS facilities. We also thank our colleagues from IBiS and the Genetics Department of Universidad de Sevilla for their support.
Author contributions
Conceptualization, S.C. and M.M.C.; Investigation, C.R.H., I.D.R., and M.G.M.; Writing—Original Draft, C.R.H.; Writing—Review & Editing, C.R.H., S.C., and M.M.C; Funding acquisition, S.C. and M.M.C.; Supervision, S.C. and M.M.C.
Competing interests
The authors declare no conflicts of interest
Ethical considerations
This work did not require ethical approval from a human subject or animal welfare committee.
References
- Baker Brachmann, C., Davies, A., Cost, G. J., Caputo, E., Li, J., Hieter, P. and Boeke, J. D. (1998). Designer deletion strains derived from Saccharomyces cerevisiae S288C: A useful set of strains and plasmids for PCR-mediated gene disruption and other applications. Yeast. 14(2): 115–132. https://doi.org/10.1002/(sici)1097-0061(19980130)14:2<115::aid-yea204>3.0.co;2-2
- Delgado-Román, I., García-Marcelo, M. J., Ruger-Herreros, C., Delgado-Ramos, L., Singh, A., Chávez, S. and Munoz-Centeno, M. C. (2026). Mother cells can establish slow-growing lineages in clonal populations since their earliest division cycles. Open Biol. 16(1): e250249. https://doi.org/10.1098/rsob.250249
Article Information
Publication history
Received: Jun 25, 2026
Accepted: Jul 27, 2026
Available online: Aug 24, 2026
Published: Sep 5, 2026
Copyright
© 2026 The Author(s); This is an open access article under the CC BY-NC license (https://creativecommons.org/licenses/by-nc/4.0/).
How to cite
Ruger-Herreros, C., Delgado-Román, I., García-Marcelo, M. J., Chávez, S. and Muñoz-Centeno, M. C. (2026). Determining the Age of Every Cell Within Each Budding Yeast Microcolony Combining Single-Cell Microencapsulation With Confocal Microscopy. Bio-protocol 16(17): e5813. DOI: 10.21769/BioProtoc.5813.

 Download Citation in RIS Format
Category
Microbiology > Microbial cell biology > Cell staining
Cell Biology > Cell imaging > Confocal microscopy
Cell Biology > Single cell analysis > Cell carrier
Do you have any questions about this protocol?
Post your question to gather feedback from the community. We will also invite the authors of this article to respond.
 Post a Question


