


- Protocols

- Articles and Issues
- For Authors
- About
- Become a Reviewer


Construction and Functional Evaluation of Cyclic Peptide-Based CAR T Cells in Tumor Models

Published: Vol 16, Iss 13, Jul 5, 2026 DOI: 10.21769/BioProtoc.5715 Views: 289
Reviewed by: Navnita DuttaRan ChenMichael Enos
 PDF
PDF  Ask a question
Original research article
The authors used this protocol in:
Jan 2026
Advertisement


Protocol Collections
Comprehensive collections of detailed, peer-reviewed protocols focusing on specific topics




Related protocols
Abstract
Cyclic peptides are emerging as a promising class of recognition modules for chimeric antigen receptor (CAR) engineering. Compared with single-chain variable fragment (scFv)-based CARs, disulfide-directed multicyclic peptides (DDMPs) represent a novel alternative, offering a markedly smaller molecular size (<5 kDa), enhanced structural stability through disulfide-directed cyclization, and broad tolerance to sequence diversification that supports systematic affinity and specificity optimization. DDMP-based CAR T cells leverage these properties to mediate antigen-dependent cytotoxicity while exhibiting an attenuated cytokine secretion profile, supporting the development of potentially safer immunotherapies for solid tumors. Here, we present a comprehensive workflow spanning CAR construct design and generation through in vitro and in vivo functional evaluation. While DDMPs are used as the exemplar recognition module, sections A and C–L of the protocol are directly applicable to any CAR format, including scFv- and nanobody-based designs with minimal modifications, making the workflow accessible to the broader CAR T-cell research community. The protocol includes the generation of Jurkat NFAT reporter cell lines and luciferase-expressing tumor target lines, which are widely used in different assays. Together, these standardized readouts enable rigorous, objective comparison of CAR T-cell efficacy and safety across tumor models.
Key features
• DDMPs (<5 kDa) are compact, disulfide-cyclized antigen recognition modules that tolerate extensive sequence diversification, enabling affinity and specificity optimization beyond conventional scFv-based CARs.
• An integrated pipeline normalizes all functional comparisons to CAR-positive cell numbers, eliminating transduction efficiency as a confounding variable across construct designs.
• Complementary readouts cross-validate efficacy and specificity: NFAT activation, luminescence-based killing, flow cytometry–based cytolysis, and ELISA-based cytokine secretion.
• Xenograft imaging via the in vivo imaging system (IVIS) validates DDMP-CAR T-cell antitumor activity, extending cross-validation to preclinical tumor models.
Keywords: Chimeric antigen receptor Autologous CAR T
Disulfide-directed multicyclic peptide
DDMP
NFAT reporter
Cyclic peptide
HER2
Xenograft
Preclinical CAR T evaluation
Autologous CAR T
Disulfide-directed multicyclic peptide
DDMP
NFAT reporter
Cyclic peptide
HER2
Xenograft
Preclinical CAR T evaluation
Graphical overview
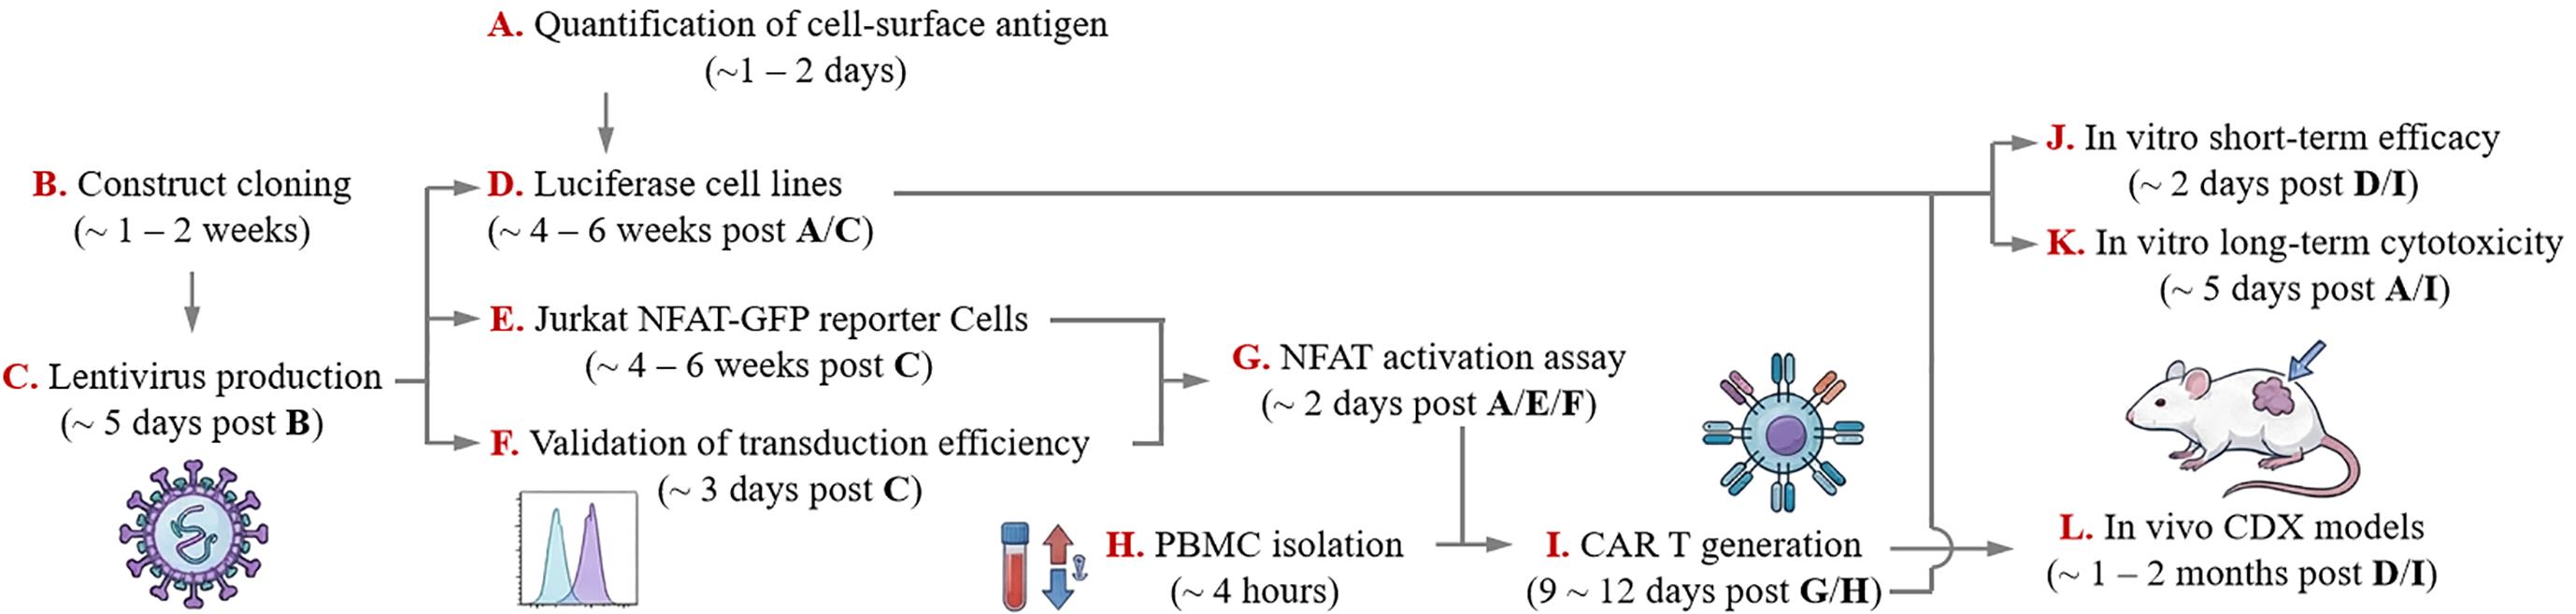
Experimental workflow. Schematic illustration of the experimental pipeline described in this protocol, from construct design to functional evaluation in vitro and in vivo. Arrows indicate the logical progression of the workflow. NFAT, nuclear factor of activated T cells; GFP, green fluorescent protein; PBMC, peripheral blood mononuclear cell; CAR, chimeric antigen receptor; CDX, cell line–derived xenograft; IVIS, in vivo imaging system. A detailed timeline of the experimental workflow is shown in Table 1.
Background
Standardized workflows for chimeric antigen receptor (CAR) T-cell manufacturing and functional testing are widely used to benchmark receptor designs across diverse tumor models and experimental readouts. Building on reported procedures for T-cell isolation/activation, viral gene transfer, and downstream in vitro/in vivo assays [1–6], this protocol provides a beginner-friendly, end-to-end pipeline for preclinical evaluation of autologous CAR T therapy. The workflow includes (i) quantitative profiling of target-antigen density on tumor cells, (ii) generation of reporter cell lines for functional readouts, and (iii) multi-assay validation spanning reporter activation, cytolysis/cytokine secretion, and xenograft efficacy. A key principle for comparing efficacy between different constructs is to normalize by the number of CAR-positive T cells, enabling functional comparisons that are independent of transduction efficiency.
This protocol is exemplified using disulfide-directed multicyclic peptides (DDMPs) as compact, engineerable antigen-recognition modules. DDMPs are disulfide-rich multicyclic peptides whose oxidative folding is guided by disulfide-directing motifs, such as biscysteine motifs CXC, CPPC, and CPXXC [7]. In conventional disulfide-rich peptides, a sequence containing 2n cysteine residues can theoretically form (2n)!/(2ⁿ n!) distinct isomers (e.g., 105 for n = 4), yielding complex mixtures. In contrast, incorporation of disulfide-directing motifs can drive highly efficient folding to a dominant product, which substantially simplifies isolation and characterization. Because DDMP folding is largely determined by these motifs, DDMP scaffolds also exhibit greater tolerance to extensive sequence manipulation, enabling highly diversified display libraries and systematic ligand discovery against a broad range of cell-surface receptors, including tumor-associated antigens and immune receptors [8–16]. While sections A and C–L are fully generalizable to any CAR format regardless of antigen-recognition module, section B (molecular cloning) includes DDMP-specific considerations, particularly sequence design principles that are specific to the DDMP CAR construct. Users employing single-chain variable fragment (scFv)- or nanobody-based CARs may adapt the cloning strategy accordingly. Thus, the integrated workflow described here is well suited for iterative optimization and head-to-head benchmarking of DDMP-based CAR designs, linking molecular construction to rigorous functional evaluation across complementary in vitro and in vivo tumor models [17,18].
Materials and reagents
Biological materials
1. HEK293T cells (Cell Bank of the Chinese Academy of Sciences, catalog number: GNHu17)
2. A549 cells (Cell Bank of the Chinese Academy of Sciences, catalog number: SCSP-503)
3. SK-OV-3 cells (Cell Bank of the Chinese Academy of Sciences, catalog number: SCSP-5214)
4. NCI-N87 cells (Procell, catalog number: CL-0169)
5. OE19 cells (Procell, catalog number: CL-0754)
Note: Users can use alternative HER2-positive tumor cell lines or any other cell line expressing the specific target antigen for their assays.
6. Jurkat E6–1 cells (Cell Bank of the Chinese Academy of Sciences, catalog number: SCSP-513)
7. Human peripheral blood (MileCell Bio; healthy donors; origin as supplied)
8. NCG mice, 6–8 weeks (GemPharmatech, catalog number: T001475)
Reagents
1. DMEM (Gibco, catalog number: 21063029)
2. RPMI 1640 (Gibco, catalog number: 11875093)
3. Click’s medium (Sigma, catalog number: C5572)
4. Opti-MEM (Gibco, catalog number: 31985-070)
5. FBS (TransGen Biotech, catalog number: FS401-02)
6. FBS (Gibco, catalog number: 10099141)
7. FBS (Sigma, catalog number: F8687)
Note: FBS was used as follows to balance performance and cost: Premium FBS (e.g., Gibco, Sigma) was used for all primary T cell and Jurkat cell cultures because these cells require low-endotoxin, high-consistency formulations; a single pre-screened lot was used for all related functional assays to ensure reproducibility. Economical domestic FBS (e.g., TransGen Biotech), was used for the routine maintenance of established tumor cell lines (e.g., HEK293T, A549, SK-OV-3, NCI-N87, and OE19), which are less sensitive to serum variations.
8. Penicillin/streptomycin (Gibco, catalog number: 15140122)
9. Lentiviral packaging plasmid: psPAX2 (Addgene, catalog number: 12260)
10. Lentiviral envelope plasmid: pMD2.G (Addgene, catalog number: 12259)
11. Lentiviral transfer plasmid backbone: pCDH (Addgene, catalog number: 72265/72266)
12. Lentiviral transfer plasmid for generating luciferase-expressing stable Luc-GFP cell lines: pCCLc-MNDU3-Luciferase-PGK-EGFP-WPRE (Addgene, catalog number: 89608)
13. Lentiviral transfer plasmid for generating NFAT-GFP reporter cell line: FLX1.8NFATGFPpd2HS4 (Addgene, catalog number: 169096)
14. PEI (Polysciences, catalog number: 24765) (linear polyethyleneimine MW 40,000; prepare as 1 μg/μL solution in sterile water, pH 7.0)
15. Ficoll (Cytiva, catalog number: 17544203) [1.077 g/mL at 20 °C, for human peripheral blood mononuclear cell (PBMC) isolation]
16. CryoStor CS10 (Stemcell, catalog number: 100-1061)
17. Dynabeads human T-Expander CD3/CD28 (Invitrogen, catalog number: 11141D)
18. Recombinant human IL-2 (Proteintech, catalog number: HZ-1015)
19. Retronectin (Takara, catalog number: T100A)
20. Polybrene (10 mg/mL) (Solarbio, catalog number: H8761-5), store at -20 °C and keep one tube as working solution at 4 °C
21. Violet 450 (Tonbo, catalog number: 13-0863)
22. PE anti-human HER2 (BioLegend, catalog number: 324406, clone 24D2)
23. FITC anti-human CD3 (4A Biotech, catalog number: FHF003-01-100, clone OKT3)
24. APC-Cy7 anti-human CD3 (BD, catalog number: 557832, clone SK7)
25. PE anti-V5 tag antibody (eBioscience, catalog number: 12-6796-42, clone TCM5)
26. PE anti-human TROP2 antibody (Invitrogen, catalog number: 12-6024-42, clone MR54)
27. Cell stimulation cocktail (Invitrogen, catalog number: 00-4970)
28. Counting beads (eBioscience, catalog number: 01-1234-42)
29. D-luciferin sodium salt (MedChemExpress, catalog number: HY-12591)
30. IVISbrite D-luciferin potassium salt (PerkinElmer, catalog number: 122799)
Note: D-luciferin sodium salt (MedChemExpress, catalog number: HY-12591) is used for in vitro bioluminescence assays on the plate reader (sections D and J). IVISbrite D-luciferin potassium salt (PerkinElmer, catalog number: 122799) is used for in vivo imaging system (IVIS) imaging (section L).
31. ELISA kits for IL-2 (Invitrogen, catalog number: 88-7025-88), TNF-α (Invitrogen, catalog number: 88-7346-77), IFN-γ (Invitrogen, catalog number: 88-7316-86), and GM-CSF (Invitrogen, catalog number: 88-8337-88) detection
32. Matrigel (Corning, catalog number: 356237)
33. PBS (Goonie Bio, catalog number: 251222)
34. Trypsin-EDTA (Gibco, catalog number: 25200072)
Solutions
1. 10% FBS in DMEM (see Recipes)
2. 10% FBS in RPMI 1640 (see Recipes)
3. 20% FBS in RPMI 1640 (see Recipes)
4. T-cell culture medium (see Recipes)
5. 10 mM D-luciferin (see Recipes)
6. 2% BSA (w/v) (see Recipes)
Recipes
1. 10% FBS in DMEM
89% DMEM + 10% FBS (TransGen) + 1% penicillin/streptomycin
2. 10% FBS in RPMI 1640
89% RPMI 1640 + 10% FBS (TransGen) + 1% penicillin/streptomycin
3. 20% FBS in RPMI 1640
79% RPMI 1640 + 20% FBS (Gibco) + 1% penicillin/streptomycin. This is used for culturing Jurkat cells.
4. T-cell culture medium
44.5% RPMI 1640 + 44.5% Click’s medium + 10% FBS (Sigma) + 1% penicillin/streptomycin
5. 10 mM D-luciferin
Dissolve 4.53 mg of D-luciferin in ddH2O to a final volume of 1.5 mL. Filter-sterilize through a 0.22 μm filter, aliquot 300 μL per tube, and store at -80 °C.
6. 2% BSA (w/v)
Dissolve 10 g of BSA in 1× PBS to a final volume of 500 mL. Filter-sterilize through a 0.22 μm filter. Store at 4 °C for up to 4 weeks. Discard if turbidity or precipitate is observed.
Laboratory supplies
1. 1.5 mL microcentrifuge tube (Axygen, catalog number: MCT-200-C)
2. 15 mL centrifuge tube (LabSelect, catalog number: CT-002-15A)
3. 50 mL conical tube (LabSelect, catalog number: CT-002-50A)
4. 5 mL tube for flow cytometry applications (Falcon, catalog number: 352235)
5. 300-mesh cell strainer (Solarbio, catalog number: YA0950)
6. Cryovials (ThermoFisher, catalog number: 377267)
7. Mr. Frosty freezing container (ThermoFisher, catalog number: 5100-0001)
8. 96-well cell culture plate (LabSelect, catalog number: 11510)
9. 96-well plate, white bottom (Biosharp, catalog number: BS-MP-96W-CL)
10. 12-well plate, non-TC treated (LabSelect, catalog number: 11220)
11. 24-well plate, non-TC treated (LabSelect, catalog number: 11320)
12. 24-well cell culture plates (LabSelect, catalog number: 11310)
13. 0.45 μm PES filter (Biosharp, catalog number: BS-PES-45)
14. 0.22 μm syringe filters (PES membrane; Millipore, catalog number: SLGP033RS)
Equipment
1. Class II biosafety cabinet (Haier, model: HR40-IIA2)
2. CO2 incubator (Haier, model: HCB-168)
3. 3D rotating mixer (Crystal, model: TR-02U)
4. Microcentrifuge (ThermoFisher, model: Pico 21)
5. High-speed centrifuge with a swinging-bucket rotor for 50 mL tubes (Eppendorf, model: 5910Ri)
6. Cell counter (DeNovix, model: CellDrop BF)
7. Flow cytometer (Beckman Coulter, model: CytoFLEX LX)
8. Cell sorter (Beckman Coulter, model: CytoFLEX SRT)
9. Microplate reader for bioluminescence detection (BioTek, model: Synergy Neo2)
10. In vivo imaging system (PerkinElmer, model: IVIS Spectrum)
Software and datasets
1. FlowJo (FlowJo, version 10.7)
2. Living Image (PerkinElmer, version 4.7.4)
Procedure
A. Quantification of cell-surface antigen expression
1. For each sample, prepare the staining solution by mixing 98 μL of DMEM, 1 μL of PE anti-HER2 antibody (1:100 dilution as per manufacturer’s recommendation), and 1 μL of Violet 450 viability dye (1:100 dilution as per manufacturer’s recommendation). For example, to measure cell-surface HER2 on A549, NCI-N87, OE19, and SK-OV-3 in parallel, prepare 400 μL of staining solution in total.
Note: HER2 (target antigen) is used here as an example; the same workflow applies to other cell-surface antigens by substituting the appropriate antibody.
2. Harvest 1.5 × 10⁵ target cells into a 1.5-mL microcentrifuge tube, centrifuge at 140 rcf for 5 min at room temperature to pellet the cells, and discard the supernatant. Resuspend the pellet in 100 μL of staining solution by gentle pipetting. Mix gently and incubate for 15–30 min at room temperature in the dark.
3. Add 1 mL of DMEM and centrifuge at 400 rcf for 5 min at room temperature. Discard the supernatant. Resuspend the cell pellet in 200 μL of DMEM by gentle pipetting.
4. To remove cell clumps, place a small piece of 300-mesh cell strainer over a new 1.5 mL microcentrifuge tube. Slowly pipette the suspension onto the center of the mesh and allow it to pass through by gravity assisted by gentle pipette pressure—do not centrifuge. Collect the flowthrough (typically ~150 μL) for acquisition.
5. Acquire samples on a flow cytometer (Violet 450, Ex 405 nm/Em 425–475 nm; PE, Ex 561 nm/Em 585 nm). Quantify HER2 expression as mean fluorescence intensity (MFI) using unstained cells to set the gates. See the Data analysis section for an example.
Note: For comparing HER2 levels across different cell lines (e.g., A549, OE19, and SK-OV-3), keep the photomultiplier tube (PMT) voltages and acquisition settings identical across samples.
B. Molecular cloning of reporter (NFAT-GFP, Luc) and CAR constructs
1. Choose a suitable lentiviral transfer plasmid backbone (e.g., pCDH) and clone the gene of interest into the vector. In our workflow, inserts for Luc-GFP, NFAT-GFP, and CAR constructs are obtained by custom gene synthesis. Alternatively, transfer plasmids for Luc-GFP and NFAT-GFP can be sourced directly from Addgene.
2. As an example, the HER2(DDMP)-CAR coding sequence encodes (from N- to C-terminus) a signal peptide (1–19 aa), HER2(DDMP) (22–48 aa), a V5 tag (54–67 aa, for quantifying CAR expression), a CD8 hinge (70–117 aa), a CD28 transmembrane domain (122–148 aa), a CD28 costimulatory domain (149–189 aa), and the CD3ζ signaling domain (190–303 aa). For cloning convenience, restriction sites are embedded at defined junctions, and their corresponding amino acid sequences are underlined (GS: BamHI, AAA: NotI, AS: NheI, GQKS: BoxI).
MEFGLSWLFLVAILKGVQCGSCPWFCIYPCKVEPRCSEVYAEQCPQTCGSAAAGKPIPNPLLGLDSTASAKPTTTPAPRPPTPAPTIASQPLSLRPEACRPAAGGAVHTRGLDFACDGQKSFWVLVVVGGVLACYSLLVTVAFIIFWVRSKRSRLLHSDYMNMTPRRPGPTRKHYQPYAPPRDFAAYRSRVKFSRSADAPAYQQGQNQLYNELNLGRREEYDVLDKRRGRDPEMGGKPRRKNPQEGLYNELQKDKMAEAYSEIGMKGERRRGKGHDGLYQGLSTATKDTYDALHMQALPPRDI*
Note: Alternative sequences can also be used for individual CAR components. Examples include a signal peptide from human CD8 (MALPVTALLLPLALLLHAARP) or mouse immunoglobulin κ light chain (METDTLLLWVLLLWVPGSTGD); a hinge from CD28 (IEVMYPPPYLDNEKSNGTIIHVKGKHLCPSPLFPGPSKP) or IgG-Fc (ESKYGPPCPPCPAP EFEGGPSVFLFPPKPKDTLMISRTPEVTCVVVDVSQEDPEVQFNWYVDGVEVHNAKTKPREEQFQSTYRVVSVLTVLHQDWLNGKEYKCKVSNKGLPSSIEKTISKAKGQPREPQVYTLPPSQEEMTKNQVSLTCLVKGFYPSDIAVEWESNGQPENNYKTTPPVLDSDGSFFLYSRLTVDKSRWQEGNVFSCSVMHEALHNHYTQKSLSLSLGK); a transmembrane domain from CD8 (IYIWAPLAGTCGVLLLSLVIT); and a costimulatory domain from 4–1BB (KRGRKKLLYIFKQPFMRPVQTTQEEDG CSCRFPEEEEGGCEL).
3. Confirm each construct by Sanger sequencing across the full insert and all junctions. Archive plasmid maps, annotated sequences, and primer lists for ordering and reproducibility.
Note: We recommend verifying the full insert by Sanger sequencing using the following primers: forward primer (5’-CGCAAATGGGCGGTAGGCGTG-3’) and reverse primer (5’-TCATGCTATTGCTTCCCGTA-3’). Confirm that all cysteine codons, disulfide-directing motifs, and all domain junctions are correct before proceeding to virus production.
C. Preparation of lentivirus for transduction
1. Plate 6.5 × 10⁶ HEK293T cells in 10 mL of 10% FBS in DMEM per 10 cm dish.
Note: Use mycoplasma-free cells to prevent mycoplasma contamination of the lentiviral suspension. We concentrate the lentivirus from a 10 cm dish into 500 μL and use it for transducing 5 × 10⁵ primary T cells. For difficult-to-transduce constructs, we perform a second transduction using 250 μL of lentivirus. Thus, for 5 × 10⁵ T cells, virus from approximately 1.5 dishes is required. For new constructs, we initially produce virus from two dishes for validation. After validation, the production scale is adjusted according to experimental needs.
2. Approximately 18 h after plating, prepare the transfection mix for each 10 cm dish as follows: In tube A, mix 500 μL of Opti-MEM with 60 μL of PEI by pipetting up and down. In tube B, mix 500 μL of Opti-MEM with 12 μg of transfer plasmid, 7.2 μg of packaging plasmid psPAX2, and 6 μg of envelope plasmid pMD2.G by pipetting up and down. Add the contents of tube A to tube B, mix thoroughly by pipetting up and down, and incubate at room temperature for 15 min.
Note: For validation of a new construct, prepare the transfection mix for two 10-cm dishes by doubling all components (tube A: 1 mL of Opti-MEM + 120 μL of PEI; tube B: 1 mL of Opti-MEM + 24 μg of transfer plasmid + 14.4 μg of psPAX2 packaging plasmid + 12 μg of pMD2.G envelope plasmid).
3. Add the transfection mix dropwise across the dish, distributing it as evenly as possible over multiple locations.
Note: If using a master mix for multiple dishes, add the same volume to each dish.
4. After 6–8 h, replace the medium in each dish with 10 mL of prewarmed 10% FBS in DMEM.
5. After an additional 72 h, collect the virus-containing supernatant into a 15 or 50 mL centrifuge tube. Centrifuge at 860 rcf for 10 min at 4 °C to remove cell debris, then filter the clarified supernatant through a 0.45 μm PES filter. Concentrate lentiviral particles by centrifugation at 30,910 rcf for 2 h at 4 °C. Resuspend the viral pellet from each dish in 500 μL of RPMI 1640 and store at -80 °C.
Note: Using the protocol described above, we typically obtain viral supernatant titers of 106–107 TU/mL prior to concentration. After ultracentrifugation and resuspension in 500 μL of RPMI 1640, the concentrated viral stock typically reaches 107–108 TU/mL (measured by functional transduction into Jurkat cells using serial dilution). Using 500 μL of concentrated virus for transduction of 5 × 10⁵ primary T cells typically yields CAR-positive fractions of 30%–80% by day 4 post-activation, depending on the construct and donor. Note that these are indicative ranges; actual titers may vary with plasmid quality, HEK293T passage number, and handling. Each new viral batch should be functionally validated using Jurkat cells (section F) before use in primary T-cell experiments.
D. Generation of stable luciferase-expressing target cell lines
1. Plate 8 × 10⁴ SK-OV-3 cells per well in 500 μL of 10% FBS in DMEM in a 24-well plate.
Note: SK-OV-3 is used here as an example. The same workflow can be adapted to other cells.
2. Approximately 18 h after plating, prepare a transduction mix by adding 12.5 μL of 10 mg/mL polybrene to 10.6 mL of 10% FBS in DMEM. Aspirate the plating medium from each well and then add 850 μL of this transduction mix to each well, so that each well contains 849 μL of 10% FBS in DMEM and 1 μL of 10 mg/mL polybrene (i.e., a final concentration of 10 μg/mL polybrene).
Note: The plating medium from the previous step should be fully removed before this addition—do not add the transduction mix on top of existing medium, as this would exceed the intended final volume of 1 mL and dilute the polybrene concentration below the effective range.
3. Test a virus dose range by adding 150, 100, 50, 25, 10, or 5 μL of concentrated Luc-GFP lentivirus to each well. Gently pipette up and down to mix evenly. Use duplicate wells for each condition. Top up each well with 10% FBS in DMEM to a final volume of 1 mL, yielding a final polybrene concentration of 10 μg/mL.
4. Incubate overnight. The next day, carefully remove 0.5 mL of transduction medium from each well and replace it with 0.5 mL of prewarmed 10% FBS in DMEM, maintaining a total volume of 1 mL per well.
5. At approximately 48 h post-transduction, harvest cells from one well per condition for flow cytometry. Transfer the well contents to a 1.5 mL microcentrifuge tube and centrifuge at 400 rcf for 5 min at room temperature. Discard the supernatant and resuspend the pellet in 100 μL of staining solution prepared by mixing 99 μL of DMEM and 1 μL of Violet 450 viability dye (1:100). For multiple samples, prepare a master mix and aliquot 100 μL per sample. Mix gently and incubate for 15–30 min at room temperature in the dark. Add 1 mL of DMEM and centrifuge at 400 rcf for 5 min at room temperature. Discard the supernatant and resuspend the pellet in 200 μL of DMEM by gentle pipetting. To remove clumps, place a small piece of a 300-mesh cell strainer over a new 1.5 mL microcentrifuge tube and slowly pipette the suspension onto the center of the mesh, allowing it to pass through, assisted by gentle pipette pressure. Collect the flowthrough (typically ~150 μL) for acquisition. Record the percentage of live cells, the percentage of GFP-positive cells, and the MFI of the GFP-positive population.
6. Select the condition that uses the lowest virus input satisfying both of the following criteria: (1) cell viability ≥ 70% and (2) GFP positivity ≥ 50% with an MFI at least one order of magnitude above the untransduced control. Expand cells from the remaining replicate well of the selected condition into a T25 flask, then scale to a T75 flask as cells proliferate.
Note: Higher virus inputs will increase GFP levels but progressively reduce viability. The objective is not to maximize either parameter independently but to identify the lowest dose at which both thresholds are met simultaneously. Minimizing virus input reduces lentiviral copy number per cell, which in turn limits insertional mutagenesis risk and inter-clone expression variability during subsequent single-cell expansion.
7. When the T75 reaches near confluence, harvest cells and resuspend in ~300 μL of DMEM for cell sorting.
8. Sort the cells in the top 5% of GFP expression as single cells into 96-well plates containing 200 μL of prewarmed 10% FBS in DMEM per well. Typically, sort at least three 96-well plates. For each plate, designate one well as the focus/control well and deposit ~100 cells from the same top 5% GFP-high gate into it; sort single cells from the same gate into all remaining wells.
Note: The focus/control well receives ~100 cells from the same top 5% GFP-high gate as the single-cell wells. The higher cell density ensures that a visible, fluorescent colony forms within a few days—earlier than individual clones—providing a reliable reference for locating and focusing the plate under a fluorescence microscope during early screening. Do not use this well for downstream validation, as it contains a mixed-clone population rather than a single cell–derived clone.
9. Monitor single-cell clones by fluorescence microscopy every 3–4 days. When a clone reaches approximately 50%–70% confluence in its original sorting well (typically 7–14 days post-sorting), trypsinize the cells, resuspend them in 200 μL of prewarmed 10% FBS in DMEM, centrifuge, and transfer the cell pellet to one well of a fresh 96-well plate containing 100 μL of prewarmed 10% FBS in DMEM. This intermediate step reseeds the clone at sub-confluent density to support continued expansion without growth limitation. When the clone reaches 70%–80% confluence in the fresh 96-well plate, centrifuge and transfer cell pellets to one well of a 24-well plate containing 500 μL of prewarmed 10% FBS in DMEM using the same trypsinization procedure. If many clones are available at this stage, prioritize the top three with the highest GFP fluorescence by fluorescence microscopy for continued expansion into a 6-well plate. Transfer cells from the 24-well to a 6-well plate containing 1.5 mL of prewarmed 10% FBS in DMEM, again at 70%–80% confluence.
10. When cells in the 6-well plate reach confluence, validate luciferase signal linearity. For each clone, seed 1,000, 5,000, or 10,000 cells per well (in triplicate, 100 μL) into a white-bottom 96-well plate.
11. After ~18 h, aspirate the medium. Dilute 10 mM luciferin stock to 1 mM in PBS. Add 100 μL of 1 mM luciferin to each well and incubate for 1–2 min at room temperature.
12. Measure bioluminescence using a plate reader. Confirm that luminescence scales linearly with cell number. Retain up to three clones with the highest luminescence signals (and good growth characteristics).
13. Expand the selected clones for cryopreservation and subsequent experiments.
E. Generation of Jurkat NFAT-GFP reporter cells
Note: Before beginning section E, prepare NFAT-GFP lentivirus using the NFAT-GFP transfer plasmid (section B) and the lentivirus production protocol described in section C (steps C1–C5), with the following modification: do not concentrate the viral supernatant. After clarification by centrifugation (860 rcf, 10 min, 4 °C) and filtration through a 0.45 μm PES filter, collect the full unconcentrated supernatant (~10 mL per 10 cm dish) and store in 2.0 mL aliquots at -80 °C. Use after no more than three freeze-thaw cycles.
1. Plate 3.5 × 10⁵ Jurkat E6–1 cells per well in a non-TC-treated 12-well plate. Prepare three wells. For each well, resuspend the cells in 0.5 mL of 20% FBS in RPMI 1640 containing 2.5 μL of 10 mg/mL polybrene.
Note: Prepare a master mix of 20% FBS in RPMI 1640 containing polybrene at the required concentration; then, aliquot 0.5 mL per well to resuspend 3.5 × 10⁵ Jurkat E6–1 cells.
2. Add unconcentrated NFAT-GFP lentivirus to each well at different doses (e.g., 2.0, 1.5, or 0.5 mL per well; as a reference, an unconcentrated virus harvest from a 10 cm dish is typically 10 mL total). Top up each well with 20% FBS in RPMI 1640 to a final volume of 2.5 mL, yielding a final polybrene concentration of 10 μg/mL.
Note: Unconcentrated virus is used deliberately for Jurkat NFAT-GFP transduction. Jurkat cells are highly susceptible to lentiviral transduction, and low multiplicity of infection (MOI) conditions achieved with unconcentrated virus are necessary to obtain the weakly GFP-positive integration profile required for NFAT reporter function. Concentrating the virus as in section C will result in excessive transgene copy number per cell, causing tonic GFP activation independent of CAR signaling and rendering the reporter non-functional. The weakly GFP-positive population sorted in step E4 is specifically selected to minimize baseline reporter activity while preserving inducible NFAT-driven GFP expression upon CAR activation.
3. At approximately 48 h post-transduction, harvest cells from one well per condition for flow cytometry. Transfer the well contents to a 1.5 mL microcentrifuge tube and centrifuge at 400 rcf for 5 min at room temperature. Discard the supernatant and resuspend the pellet in 100 μL of staining solution prepared by mixing 99 μL of DMEM and 1 μL of Violet 450 viability dye (1:100). For multiple samples, prepare a master mix and aliquot 100 μL per sample. Mix gently and incubate for 15–30 min at room temperature in the dark. Add 1 mL of DMEM and centrifuge at 400 rcf for 5 min at room temperature. Discard the supernatant and resuspend the pellet in 200 μL of DMEM by gentle pipetting. To remove clumps, place a small piece of 300-mesh cell strainer over a new 1.5 mL microcentrifuge tube and slowly pipette the suspension onto the center of the mesh, allowing it to pass through, assisted by gentle pipette pressure. Collect the flowthrough (typically ~150 μL) for acquisition. Record the percentage of live cells, the percentage of GFP-positive cells, and the MFI of the GFP-positive population.
4. Sort the cells in the lowest 10%–20% of GFP expression as single cells into 96-well plates containing 200 μL of prewarmed 20% FBS in RPMI 1640 per well. Typically, sort at least three 96-well plates. For each plate, designate one well as the focus/control well and deposit ~100 cells from the same lowest 10%–20% GFP-positive gate into it; sort single cells from the same gate into all remaining wells.
Notes:
1. The weakly GFP-positive sorting strategy is the inverse of the top 5% GFP-high strategy used in section D and is intentional. For the NFAT-GFP reporter, GFP is driven by an NFAT-responsive promoter rather than a constitutive promoter; basal GFP expression in unstimulated cells therefore reflects tonic NFAT activity, which scales with transgene copy number. Sorting the lowest 10%–20% of the GFP-positive fraction selects for low-copy-number integrants that minimize basal reporter activity, thereby maximizing the signal-to-background ratio upon CAR-mediated NFAT activation. Clones are subsequently screened in steps E7 and E8 by comparing stimulated versus unstimulated GFP induction; clones with the highest fold-induction and lowest unstimulated baseline are selected for expansion.
2. The focus/control well receives ~100 cells from the same lowest 10%–20% GFP gate as the single-cell wells. The higher cell density ensures that a visible, fluorescent colony forms within a few days—earlier than individual clones—providing a reliable reference for locating and focusing the plate under a fluorescence microscope during early screening. Do not use this well for downstream validation, as it contains a mixed-clone population rather than a single cell–derived clone.
5. Monitor single-cell clones by fluorescence microscopy every 3–4 days. When a clone reaches approximately 50%–70% confluence in its original sorting well (typically 7–14 days post-sorting), trypsinize the entire well, resuspend in 200 μL of prewarmed 20% FBS in RPMI 1640, centrifuge, and transfer cell pellets to one well of a fresh 96-well plate containing 100 μL of prewarmed 20% FBS in RPMI 1640. This intermediate step reseeds the clone at sub-confluent density to support continued expansion without growth limitation. When the clone reaches 70%–80% confluence in the fresh 96-well plate, centrifuge and transfer cell pellets to one well of a 24-well plate containing 500 μL of prewarmed 20% FBS in RPMI 1640. Centrifuge and transfer cell pellets from the 24-well to a 6-well plate containing 1.5 mL of prewarmed 20% FBS in RPMI 1640, again at 70%–80% confluence.
6. When clones in the 24-well plate reach near confluence, split each clone into three portions: one portion for continued culture/backup, and two portions for functional testing (stimulated vs. unstimulated).
7. For functional induction, collect approximately 1 ×10⁵ cells from each portion designated for stimulation by centrifugation at 400 rcf for 5 min at room temperature. Discard the supernatant. Prepare the stimulation mix by adding 1 μL of 500× cell stimulation cocktail to 499 μL of 20% FBS in RPMI 1640 (1× final working concentration). Resuspend the cell pellet in the full 500 μL stimulation mix and transfer to one well of a 24-well plate. Incubate for 5–18 h at 37 °C. For the unstimulated control, resuspend the corresponding cell pellet in 500 μL of 20% FBS in RPMI 1640 without cocktail and culture under identical conditions.
8. Analyze stimulated and unstimulated samples by flow cytometry. Select clones that exhibit strong GFP induction upon stimulation but minimal basal GFP in the unstimulated condition (i.e., the highest signal-to-background ratio). Expand the selected clones for cryopreservation and subsequent experiments.
F. Validation of lentiviral transduction efficiency using Jurkat cells
1. Plate 1.8 × 10⁵ Jurkat E6–1 cells per well in a non-TC-treated 24-well plate. Prepare one well per lentiviral construct for validation. For each well, resuspend the cells in 0.8 mL of 20% FBS in RPMI 1640 containing 1 μL of 10 mg/mL polybrene.
Note: Prepare a master mix of 20% FBS in RPMI 1640 containing polybrene at the required concentration, then aliquot 0.8 mL per well to resuspend 1.8 × 10⁵ Jurkat E6–1 cells.
2. Add 200 μL of concentrated CAR-encoding lentivirus to each well.
Note: A concentrated virus harvest from a 10 cm dish is typically 500 μL total.
3. Incubate overnight. The next day, carefully remove 0.5 mL of medium from each well using a pipette (avoid aspirating cells) and replace with 0.5 mL of prewarmed 20% FBS in RPMI 1640, to restore a final volume of 1.0 mL per well.
4. At approximately 48 h post-transduction, collect cells for flow cytometry analysis.
5. Transfer each well’s suspension to a 1.5 mL microcentrifuge tube and centrifuge at 400 rcf for 5 min at room temperature. Discard the supernatant and resuspend the pellet in 100 μL of staining solution. Mix gently and incubate for 15–30 min at room temperature in the dark. For each sample, prepare the staining solution by mixing 98 μL of DMEM, 1 μL of PE anti-V5 tag antibody (1:100 dilution as per manufacturer’s recommendation), and 1 μL of Violet 450 viability dye (1:100 dilution as per manufacturer’s recommendation). If staining multiple samples, prepare a master mix and aliquot 100 μL per sample.
Note: Anti-V5 is used because the CAR constructs include an extracellular V5 tag. If a different tag or reporter is used, substitute the appropriate detection reagent.
6. Add 1 mL of DMEM and centrifuge at 400 rcf for 5 min at room temperature. Discard the supernatant and resuspend the pellet in 200 μL of DMEM by gentle pipetting (or gentle flicking of the tube).
7. To remove cell clumps, place a small piece of 300-mesh cell strainer over a new 1.5 mL microcentrifuge tube. Slowly pipette the suspension onto the center of the mesh and allow it to pass through by gravity, assisted by gentle pipette pressure—do not centrifuge. Collect the flowthrough (typically ~150 μL) for acquisition.
8. Acquire the samples on a flow cytometer. As a benchmark for batch quality, ~100% V5-positive cells are typically achieved under these conditions. If V5 positivity is lower, prepare a new viral batch or troubleshoot the transduction conditions. Ideally, the V5 signal should be ~2 orders of magnitude above the background signal from untransduced Jurkat cells stained with anti-V5 under identical settings.
G. Validation of CAR function using Jurkat NFAT-GFP reporter cells
1. Plate Jurkat NFAT-GFP cells in a non-TC-treated 24-well plate. Prepare a master cell suspension in prewarmed 20% FBS in RPMI 1640 and polybrene such that each well receives 1.8 × 10⁵ cells in a total volume of 900 μL (899 μL of medium + 1 μL of 10 mg/mL polybrene). Set up two wells for each construct.
2. Add 100 μL of concentrated CAR-encoding lentivirus to each well.
Note: A typical concentrated harvest from one 10 cm dish yields ~500 μL in total.
3. After 18 h, collect cells of the same construct into a 15 mL centrifuge tube. Centrifuge at 400 rcf for 5 min at room temperature. Discard the supernatant. Resuspend in 1 mL of 20% FBS in RPMI 1640. Measure the cell density.
4. Seed 1.5 × 10⁵ SK-OV-3 cells in 500 μL of 10% FBS in DMEM per well in a TC-treated 24-well plate. Then, add 1.5 × 10⁵ transduced Jurkat NFAT-GFP in 500 μL of 20% FBS in RPMI 1640 to the same well (final volume 1 mL; E:T = 1:1).
Note: SK-OV-3 cells, which express high levels of HER2, are used to validate HER2(DDMP)-CAR function. For CARs targeting other antigens, use an appropriate antigen-high target cell line. Because activation of Jurkat NFAT-GFP cells induces GFP expression, we avoid using SK-OV-3-Luc-GFP in this assay to minimize potential fluorescence interference.
5. After 24 h, gently pipette the culture up and down 5–10 times to preferentially resuspend Jurkat NFAT-GFP cells while leaving the majority of adherent SK-OV-3 cells attached to the well. Transfer the supernatant to a 1.5 mL microcentrifuge tube, centrifuge at 400 rcf for 5 min, and discard the supernatant. Avoid excessive pipetting force to minimize SK-OV-3 detachment.
6. While centrifuging (step G5), prepare a staining solution containing PE anti-V5 tag antibody (final 1:100) and Violet 450 viability dye (final 1:100) in DMEM. Prepare 100 μL per sample. For example, for 10 samples, prepare at least 1 mL of staining solution.
7. Resuspend each cell pellet in 100 μL of staining solution, mix gently, and incubate for 15–30 min at room temperature in the dark.
8. Add 1 mL of DMEM and centrifuge at 400 rcf for 5 min at room temperature. Discard the supernatant and resuspend the pellet in 200 μL of DMEM by gentle pipetting (or gentle flicking of the tube).
9. To remove cell clumps, place a small piece of 300-mesh cell strainer over a new 1.5 mL microcentrifuge tube. Slowly pipette the suspension onto the center of the mesh and allow it to pass through by gravity, assisted by gentle pipette pressure—do not centrifuge. Collect the flowthrough (typically ~150 μL) for acquisition.
10. Acquire samples on a flow cytometer. Because gentle pipetting at the harvest step preferentially recovers Jurkat NFAT-GFP cells, most samples will contain predominantly Jurkat NFAT-GFP cells with minimal SK-OV-3 contamination. However, if SK-OV-3 cells are present, use the GFP channel to distinguish the two populations and gate exclusively on Jurkat NFAT-GFP cells for all downstream analysis. Quantify the fraction of V5 (PE) and GFP double-positive Jurkat cells after co-culture with target cells. A functional CAR should produce a clear increase in the V5 and GFP double-positive population compared to the no-target control. If the no-target control already shows a high double-positive fraction (often due to tonic signaling/self-activation), repeat the transduction using a lower virus input.
Note: (Methodological) The Jurkat NFAT-GFP reporter assay provides a rapid and cost-effective initial readout for CAR-mediated activation. However, as this simplified system does not fully recapitulate the functional complexity of primary T cells, results should be interpreted as a screening/validation tool. Key findings must be confirmed using primary CAR T cells in downstream functional assays, such as cytotoxicity (section J) and cytokine secretion (section K).
H. PBMC isolation and assessment of CD3+ cells in PBMCs
1. Transfer peripheral blood (approximately 17 mL of red solution containing 1 × 10⁹ white blood cells) from the collection bag into a 50 mL centrifuge tube.
2. Rinse the bag with sterile, room-temperature PBS to recover residual blood, and combine the rinse with the transferred blood. Adjust the volume to achieve approximately a 1:1 (v/v) ratio of blood:PBS. Mix gently by inversion or slow pipetting to avoid foaming.
3. Aliquot the diluted blood into six 50 mL centrifuge tubes (typically 5–6 mL per tube).
4. Bring each tube to 25 mL with PBS and mix gently.
5. In a separate set of six 50 mL centrifuge tubes, add 25 mL of Ficoll per tube. Carefully layer 25 mL of the diluted blood (from step H4) on top of the Ficoll.
Critical: The Ficoll used has a density of 1.077 g/mL at 20 °C, which is the standard density recommended for PBMC isolation from human blood. Add the first ~5 mL dropwise along the tube wall (e.g., using a P1000 tip), then slowly add the remaining volume using a serological pipette, maintaining a clear interface.
6. Centrifuge at 400 rcf for 30 min at 18 °C with low acceleration (speed up = 1) and no brake (speed down = 0).
7. After centrifugation, the sample should separate into three layers: plasma (top, light yellow), a buffy coat/PBMC layer at the interface (middle, whitish), and erythrocytes/granulocytes (bottom, red). Using a 10 mL pipette, remove most of the plasma layer. Using a 2.5 mL pipette, carefully collect the PBMC layer and transfer it to a new 50 mL tube, avoiding carryover of the Ficoll and the red cell layer.
8. Fill each PBMC tube to 50 mL with PBS and centrifuge at 550 rcf for 20 min at 18 °C (speed up = 5, speed down = 4). Discard the supernatant and repeat the PBS wash for a total of three washes. Before the final wash, take an aliquot of 2 × 10⁵ cells for T-cell fraction quantification. Transfer the aliquot to a 1.5 mL microcentrifuge tube and centrifuge at 400 rcf for 5 min at room temperature. Discard the supernatant and resuspend the pellet in 100 μL of staining solution prepared by mixing 98 μL of PBS, 1 μL of APC-Cy7 anti-human CD3 antibody (1:100 dilution), and 1 μL of Violet 450 viability dye (1:100 dilution). Mix gently and incubate for 15–30 min at room temperature in the dark. Add 1 mL of DMEM and centrifuge at 400 rcf for 5 min at room temperature. Discard the supernatant and resuspend the pellet in 200 μL of DMEM by gentle pipetting. To remove clumps, place a small piece of 300-mesh cell strainer over a new 1.5 mL microcentrifuge tube and pass the suspension through the mesh. Collect the flowthrough (typically ~150 μL) for acquisition. Gate on the lymphocyte population (FSC-A vs. SSC-A) and singlets (FSC-A vs. FSC-H) and then quantify the CD3-positive fraction within the live cell gate. Values vary across donors; as a general guide, CD3+ T cells typically comprise ~50%–80% of the lymphocyte gate.
9. Resuspend PBMCs in CryoStor CS10 to a final density of 2.5 × 10⁷ cells/mL. Aliquot 1 mL per cryovial. Freeze overnight at -80 °C in a Mr. Frosty container and then transfer vials to liquid nitrogen for long-term storage.
I. Generation of CAR T
1. Calculate the number of CAR-positive T cells required for downstream experiments. For example, for an in vivo study with CAR T injection on day 9 post-activation, one cryovial containing 2.5 × 10⁷ PBMCs would yield an estimated CAR-positive output of 2.5 × 107 × 0.2 (CD3-positive fraction, donor dependent) × 0.5 (post-thaw recovery rate) × 20 (typical fold expansion by day 9) × 0.3 (CAR-positive fraction on day 9, construct and lentiviral batch dependent) ≈ 1.5 × 10⁷ CAR-positive cells. Adjust these factors based on donor- and construct-dependent parameters.
2. Thaw one vial of cryopreserved PBMCs in a 37 °C water bath. Immediately transfer the contents into a 15 mL centrifuge tube containing 7 mL of prewarmed T-cell culture medium. Determine the total cell number and estimate the T-cell input using the CD3% measured during PBMC isolation. For example, if counting shows 3 × 10⁷ total PBMCs and 20% CD3-positive cells, then the vial contains ~6 × 10⁶ T cells.
3. Prepare CD3/CD28 Dynabeads at a 1:1 bead:CD3-positive cell ratio. For 6 × 10⁶ T cells, add 60 μL of Dynabeads (1 × 10⁸ beads/mL) to 2 mL of T-cell culture medium. Mix, place on a magnetic stand for ~1 min, and remove the supernatant. Resuspend the beads in ~0.5 mL of the PBMC suspension and return the bead-containing suspension to the main tube.
4. Incubate the tube on a 3D rotating mixer at room temperature (10 rpm) for 30 min to promote bead–cell contact.
5. Place the tube on a magnetic stand for 5 min and remove the supernatant.
6. Resuspend the bead-bound cells in 2 mL of T-cell culture medium supplemented with 100 U/mL IL-2. Take a small aliquot (e.g., 10 μL) for counting. At this stage, the majority of recovered cells should be T cells; from an initial 6 × 10⁶ T cells, ~3 × 10⁶ cells are typically recovered after bead enrichment.
7. Plate activated T cells in a non-TC-treated 24-well plate at 1.5 × 10⁶ cells per well. Add prewarmed T-cell culture medium supplemented with 100 U/mL IL-2 to a final volume of 2 mL per well.
8. After 18 h, carefully remove 1 mL of medium per well and replace with 1 mL of fresh, prewarmed T-cell culture medium supplemented with 100 U/mL IL-2.
9. At 48 h after bead stimulation, transfer cells to a 15 mL tube. Place the tube on a magnetic stand for 5 min to remove beads, then transfer the supernatant (cells) to a fresh tube and count. A modest expansion is typically observed at this stage (e.g., ~1.2-fold).
Note: During 48 h of culture, proliferating T cells progressively dissociate from the activation beads as daughter cells are released into suspension. Before magnetic separation, pipette the suspension thoroughly up and down to mechanically disrupt any residual bead–cell contacts and maximize cell recovery into the suspension fraction. Magnetic separation then removes beads along with any remaining tightly bound cells; the supernatant contains the majority of viable, activated, bead-free T cells available for transduction. Trace residual beads that carry over into the suspension at this density do not significantly impair lentiviral transduction efficiency.
10. Prepare a Retronectin-coated non-TC-treated 24-well plate for transduction. Make 8 μg/mL Retronectin in PBS (e.g., 8 μL Retronectin at 1 μg/μL + 992 μL of PBS). Add 1 mL of 8 μg/mL Retronectin solution per well and incubate for at least 4 h at 37 °C. Remove the Retronectin solution, block with 1 mL of 2% (w/v) BSA per well for 20 min at room temperature, discard the BSA, and add 500 μL of concentrated lentivirus per well. Centrifuge the virus-coated plate at 2,630 rcf for 1.5 h at 32 °C (speed up = 3, speed down = 0). Plan this step so that virus loading and spin occur before adding cells (typically start ≥ 6 h before step I11).
Note: Retronectin (supplied at 1 μg/μL) is used at a final coating concentration of 8 μg/mL in PBS. This coating concentration has been validated for the lentiviral transduction conditions described in this protocol; deviations in source or concentration may affect transduction efficiency and should be revalidated.
11. Near the end of the 1.5 h centrifugation, resuspend activated T cells at 5 × 10⁵ cells/mL in T-cell culture medium supplemented with 100 U/mL IL-2. Immediately after the virus spin, add 1 mL of cell suspension (5 × 10⁵ cells) to each well. Centrifuge at 135 rcf for 5 min at 32 °C (speed up = 3, speed down = 0), then transfer the plate to a CO2 incubator.
12. For constructs with low transduction efficiency, perform a second transduction the next morning. Remove 250 μL of medium per well and add 250 μL of concentrated virus. Incubate for 6 h, then remove 750 μL of medium per well and replace with 750 μL of prewarmed T-cell culture medium supplemented with 100 U/mL IL-2. If a second transduction is not required, skip the virus addition and proceed with the routine medium change.
13. At 48 h after the first transduction (day 4 post-activation), pool wells transduced with the same lentivirus in a 15 mL tube. Remove 100 μL per well (or an equivalent aliquot) for flow cytometry. Stain the cell pellet using the protocol described in steps F5–8, with the following modification: include both FITC anti-human CD3 (1:100) to identify T cells and PE anti-V5 (1:100) to identify CAR-positive cells, and retain the Violet 450 viability dye (1:100). Incubate for 30 min at room temperature in the dark, wash, and resuspend as described in steps F5–7. Centrifuge the remaining cells at 400 rcf for 5 min at room temperature (speed up = 9, speed down = 9), resuspend in T-cell culture medium supplemented with 100 U/mL IL-2 to 1 × 10⁶ cells/mL, and re-plate 1.5 mL per well in a fresh non-TC-treated 24-well plate.
14. Passage the cells every 48 h using the same dilution strategy, maintaining IL-2 at 100 U/mL, until the desired time point (e.g., day 9) for downstream assays.
J. In vitro cytotoxicity and cytokine secretion
1. For short-term cytotoxicity and cytokine profiling, seed 1 × 10⁴ SK-OV-3-Luc-GFP cells per well in 100 μL of 10% FBS in DMEM in a white-bottom 96-well plate.
Note: SK-OV-3 is used here as an example HER2-high target cell to evaluate antigen-specific cytotoxicity of DDMP(HER2)-CAR T cells. Parental SK-OV-3 cells without luciferase/GFP can be used in the flow cytometry–based cytolysis assay described in section K, provided that target cells can be distinguished by fluorescence gating, for example, using a constitutive fluorescent marker or surface staining. For a more systematic assessment, we recommend including at least one HER2-low/negative control line (e.g., A549) and additional HER2-high targets (e.g., NCI-N87 or OE19), provided they are suitably labeled for detection in the respective assay format.
2. Measure the CAR-positive fraction of each CAR T sample by flow cytometry (e.g., V5 staining) and use this value to calculate the total T-cell number required to deliver the desired number of CAR-positive effector cells. Prepare effector cells at E:T (i.e., effector-to-target) ratios of 0.5:1, 1:1, and 2:1, where E refers to CAR-positive cells (not total T cells), and T refers to the luciferase-expressing target cells. Include untransduced T cells at the same total cell numbers as controls and include a target-only condition (SK-OV-3-Luc-GFP only). Prepare all conditions in triplicate.
Note: If a CAR T preparation is 40% CAR-positive and the desired E:T is 0.5:1 with 1 × 10⁴ targets, each well requires 5,000 CAR-positive cells, corresponding to 12,500 total T cells. To set up triplicate wells with sufficient volume, prepare 400 μL of effector (i.e., CAR T) suspension containing 5 × 10⁴ total T cells in T-cell culture medium, then add 100 μL per well, corresponding to 12,500 total T cells per well.
3. After 18 h of co-culture, remove all 200 μL of supernatant from each well. Split the supernatant into two portions and transfer to two new 96-well plates, then store at -80 °C for subsequent ELISA assays.
Pause point: Supernatants can be stored at -80 °C for a few weeks before ELISA.
4. To quantify cytotoxicity by bioluminescence, dilute 10 mM D-luciferin stock to 1 mM in PBS. Add 100 μL of 1 mM D-luciferin to each well, incubate for 1–2 min at room temperature, and measure luminescence on a plate reader.
5. Calculate specific lysis by subtracting the empty-well background and normalizing to the target-only control, as described in the Data analysis section.
6. Perform ELISA to quantify the levels of secreted cytokines (IL-2, IFN-γ, TNF-α, and GM-CSF) in the co-culture supernatants, following the manufacturer’s instructions for each ELISA kit. We typically use 10 μL of supernatant per well. If cytokine concentrations are below the detection limit, increase the input volume to 50 μL (i.e., lower dilution) to improve sensitivity.
Note: Our ELISA workflow starts with plate coating on the day before the assay and typically requires approximately one full day to complete, with several incubation steps. In practice, it is efficient to run two ELISA plates in parallel, either testing different sample sets for the same cytokine or testing the same samples for two different cytokines.
K. Flow cytometry–based cytolysis assay
1. For long-term cytotoxicity, we typically use an E:T ratio of 1:20 (E = effector, CAR-positive T cells here; T = target, SK-OV-3 in the following description). Seed 1 × 10⁵ SK-OV-3-Luc-GFP cells per well in 1 mL of 10% FBS in DMEM in a 24-well plate.
Note: SK-OV-3 is used here as an example HER2-high target cell to evaluate antigen-specific cytotoxicity of DDMP(HER2)-CAR T cells. Parental SK-OV-3 cells without luciferase/GFP can also be used, but GFP-positive targets simplify gating. For a more systematic assessment, we recommend including at least one HER2-low/negative control line (e.g., A549) and additional HER2-high targets (e.g., NCI-N87 or OE19).
2. Determine the CAR-positive fraction of each CAR T sample by flow cytometry and calculate the total T-cell input required to deliver the desired number of CAR-positive effector cells. Add effector cells in 1 mL of T-cell culture medium to each target well. Include the following controls: (i) target-only wells supplemented with 1 mL of T-cell culture medium and (ii) untransduced T cells at the same total cell number as the CAR T condition.
Note: If the CAR T product is 40% CAR-positive and the desired E:T is 1:20 with 1 × 10⁵ targets, each well requires 5,000 CAR-positive cells, corresponding to 12,500 total T cells.
3. Incubate the co-cultures at 37 °C in 5% CO2 for 4 days.
4. To harvest all cells (including adherent targets), carefully remove 1 mL of medium from each well and retain the remaining volume (~800 μL) to resuspend cells by gentle pipetting. Transfer the suspension to a 15 mL centrifuge tube. Rinse the well with 200 μL of PBS and combine with the same tube. Add 150 μL of trypsin to the well and incubate at 37 °C for 5 min to detach adherent cells. Use ~400 μL of the collected suspension to wash the well thoroughly and recover the detached cells, then combine all fractions in the same tube. Centrifuge at 400 rcf for 5 min at room temperature and discard the supernatant.
5. Stain the cell pellet using the protocol described in steps F5–8, with the following modification: replace PE anti-V5 with APC-Cy7 anti-human CD3 (1:100) to identify T cells, and retain the Violet 450 viability dye (1:100). Incubate for 30 min at room temperature in the dark, wash, and resuspend as described. Add 1 mL of DMEM and centrifuge at 400 rcf for 5 min at room temperature. Discard the supernatant and resuspend the pellet in 110 μL of DMEM. Add 20 μL of counting beads (1 × 10⁶/mL) and mix gently.
6. To remove clumps, pass the suspension through a small piece of 300-mesh cell strainer placed over a new 1.5 mL microcentrifuge tube. Collect the flowthrough (typically ~120 μL) for flow cytometry analysis. Acquire samples on a flow cytometer. Use the following sequential gating strategy: (i) on an FSC-A vs. SSC-A plot, identify the cell population (excluding debris) and the counting bead population; (ii) select singlets on an FSC-A vs. FSC-H plot; (iii) on a GFP vs. APC-Cy7 plot, define the SK-OV-3-Luc-GFP target cell gate (GFP+, CD3-) and the T-cell gate (GFP-, CD3+); and (iv) record the bead event count and sample volume for absolute quantification. See the Data analysis section for calculation examples.
L. In vivo cytotoxicity (xenograft models with IVIS monitoring)
Note: Section L assumes basic competence in rodent handling, subcutaneous injection, and intravenous injection, or access to an institutional core facility or animal care unit that can provide these services. Specific training in tumor inoculation, CAR T-cell injection, caliper measurement, and IVIS imaging is strongly recommended before initiating experiments. Users without prior experience in animal experimentation should consult their institutional animal care program for training and guidance. General husbandry for NCG mice (an immunodeficient strain) requires sterile-technique barrier housing and careful monitoring for welfare indicators.
1. Obtain ethical approval before initiating any animal experiments.
Note: Depending on institutional procedures, approval may take days to weeks to obtain.
2. For the SK-OV-3 CDX model, use female NCG mice (6–8 weeks old). SK-OV-3 is an ovarian cancer cell line, so female mice are used. For each mouse, prepare 2 × 10⁶ SK-OV-3-Luc-GFP cells in a total volume of 150 μL by mixing 75 μL of PBS with 75 μL of Matrigel. Matrigel should be kept cold to prevent gelling; thaw it in advance and keep it on ice. For example, for 10 mice, prepare 10 tubes containing 2 × 10⁶ SK-OV-3-Luc-GFP cells in 75 μL of PBS on ice. Immediately before injection, mix the cell suspension with 75 μL of Matrigel by pipetting up and down with a P200 tip, then perform subcutaneous injection using a 1 mL syringe with a 26G needle (0.45 × 12 mm).
3. On day 3 (72 h post-tumor implantation), inject CAR T cells (corresponding to day 9 post-activation in the example timeline). Measure the CAR-positive fraction by flow cytometry (typically ~30%) and use this value to calculate the total cell number required. For example, to inject 5 × 10⁵ CAR-positive cells per mouse from a product that is 30% CAR-positive, prepare 1.67 × 10⁶ total cells in 100 μL of PBS per mouse. Add 40 μL of 30 mg/mL (200×) IVISbrite to the cell suspension. The final luciferin concentration in the 140 μL injection volume is approximately 8.6 mg/mL. Then, perform intravenous injection using a 1 mL syringe with a 26G needle (0.45 × 12 mm).
4. Monitor the mouse body weight regularly. Measure tumor size with calipers and assess tumor burden by IVIS bioluminescence imaging at defined time points. Calculate tumor volume as follows:
5. Normalize IVIS images using a consisitent radiance scale bar with fixed minimum and maximum values across all groups and time points.
Data analysis
A. Quantification of cell-surface antigen expression
Flow cytometry data were analyzed in FlowJo. Events were gated sequentially to obtain a clean and comparable population for antigen quantification: (i) cells were identified on an FSC-A vs. SSC-A plot to exclude debris, (ii) singlets were selected on an FSC-A vs. FSC-H plot to remove doublets and aggregates, and, if a viability dye was included, (iii) live cells were gated by excluding Violet 450–high events (dead cells). Figure 1A illustrates the gating strategies described in steps (i) and (ii). HER2 expression was quantified as the mean fluorescence intensity (MFI) in the PE channel for the final gated population. Unstained cells acquired using identical PMT voltages and acquisition settings were used to define the PE gate and establish background fluorescence (Figure 1B). For comparisons across cell lines, all samples were acquired with the same instrument settings; if desired, background-corrected HER2 signal can be reported as ΔMFI = MFI(stained) − MFI(unstained). In the exemplar dataset, HER2 staining of SK-OV-3 cells produced a clear rightward shift in PE signal relative to the unstained control.
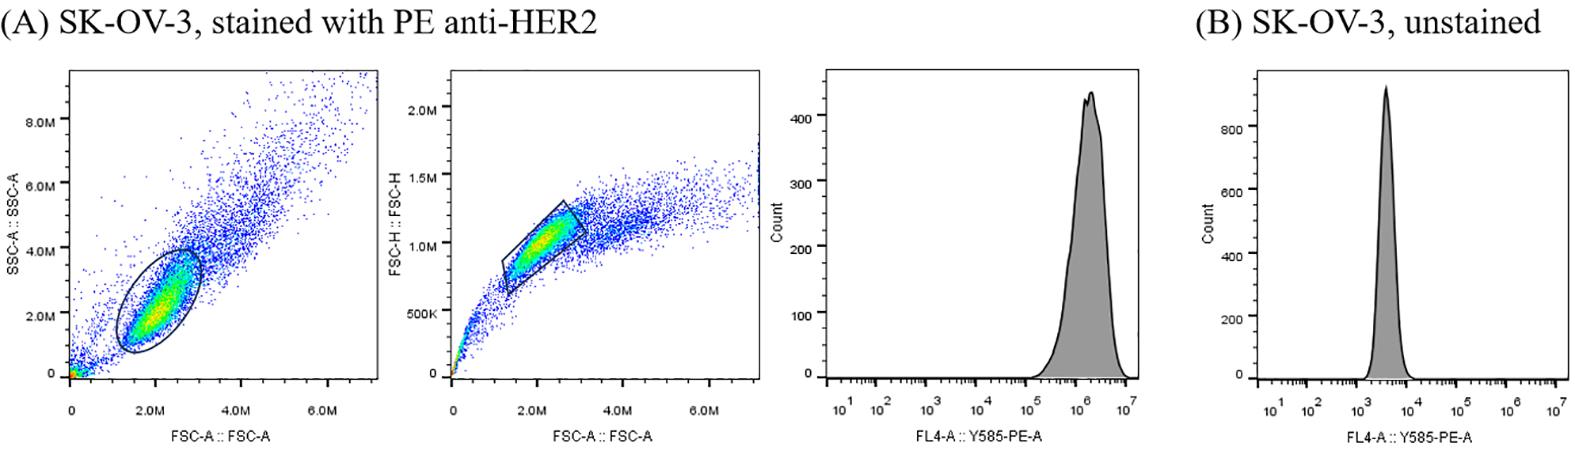
Figure 1. Representative gating strategy and exemplar HER2 staining for quantification of cell-surface antigen expression by flow cytometry. (A) SK-OV-3 cells stained with PE anti-HER2 were first gated on FSC-A vs. SSC-A to exclude debris (64% of total events), followed by singlet gating on FSC-A vs. FSC-H (89% of events within the “cells” gate). HER2 expression was then quantified as the mean fluorescence intensity (MFI) of the PE channel. (B) Unstained SK-OV-3 cells acquired with identical instrument settings were used to define the PE gate and background fluorescence for MFI calculation.
B. Quantification of the T-cell fraction
Flow cytometry data were analyzed to estimate the T-cell fraction in isolated PBMCs (section H). Events were first gated on FSC-A vs. SSC-A to define the lymphocyte population and exclude debris and non-lymphoid cells. Singlets were then selected on FSC-A vs. FSC-H to remove doublets and aggregates. The CD3 gate was defined using an unstained sample acquired under identical instrument settings, and the percentage of CD3+ cells (i.e., T cells) was quantified within the gated lymphocyte singlet population.
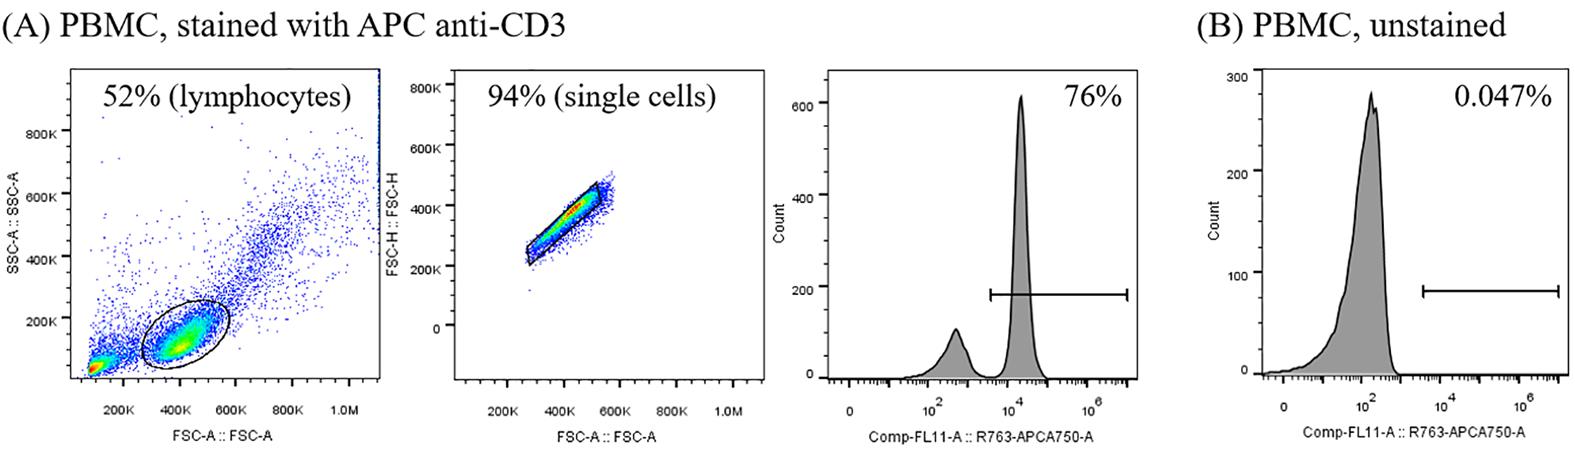
Figure 2. Representative flow-cytometry gating and exemplar CD3 analysis for estimating T-cell frequency in peripheral blood mononuclear cell (PBMC) preparations. (A) PBMC stained with APC-Cy7 anti-CD3 were first gated on FSC-A vs. SSC-A for lymphocytes (52% of total events), followed by singlet gating on FSC-A vs. FSC-H (94% of events within the “lymphocytes” gate). T cells were identified as CD3-positive events (76%). (B) Unstained PBMC acquired with identical instrument settings were used to define the APC-Cy7 gate.
In the exemplar dataset (Figure 2), lymphocytes comprised ~52% of total events, and singlets accounted for ~94% of the lymphocyte gate. Within this final gate, CD3 staining identified a dominant CD3+ population (76%), while the unstained control showed minimal background in the CD3 gate (0.047%). Therefore, the estimated T-cell fraction in this PBMC preparation was 0.52 × 0.94 × 0.76 ≈ 37%, corresponding to ~9.3 × 10⁶ T cells in a cryovial containing 2.5 × 10⁷ total PBMCs. This value was used to calculate the required number of CD3/CD28 activation beads for downstream activation.
C. CAR expression in primary T cells
As a representative example, Figure 3 shows CAR surface expression in primary T cells transduced with HER2(DDMP)-CAR lentivirus under the conditions described in section I. Transduction efficiency at D4 was 88.2%, decreasing to 51.1% at D9. Users should expect D4 values in the range of ~70%–100% and D9 values in the range of ~30%–60% under standard conditions, with variation across donors and construct designs. If D4 efficiency falls below ~30%, prepare a fresh lentiviral batch and troubleshoot transduction conditions before proceeding.
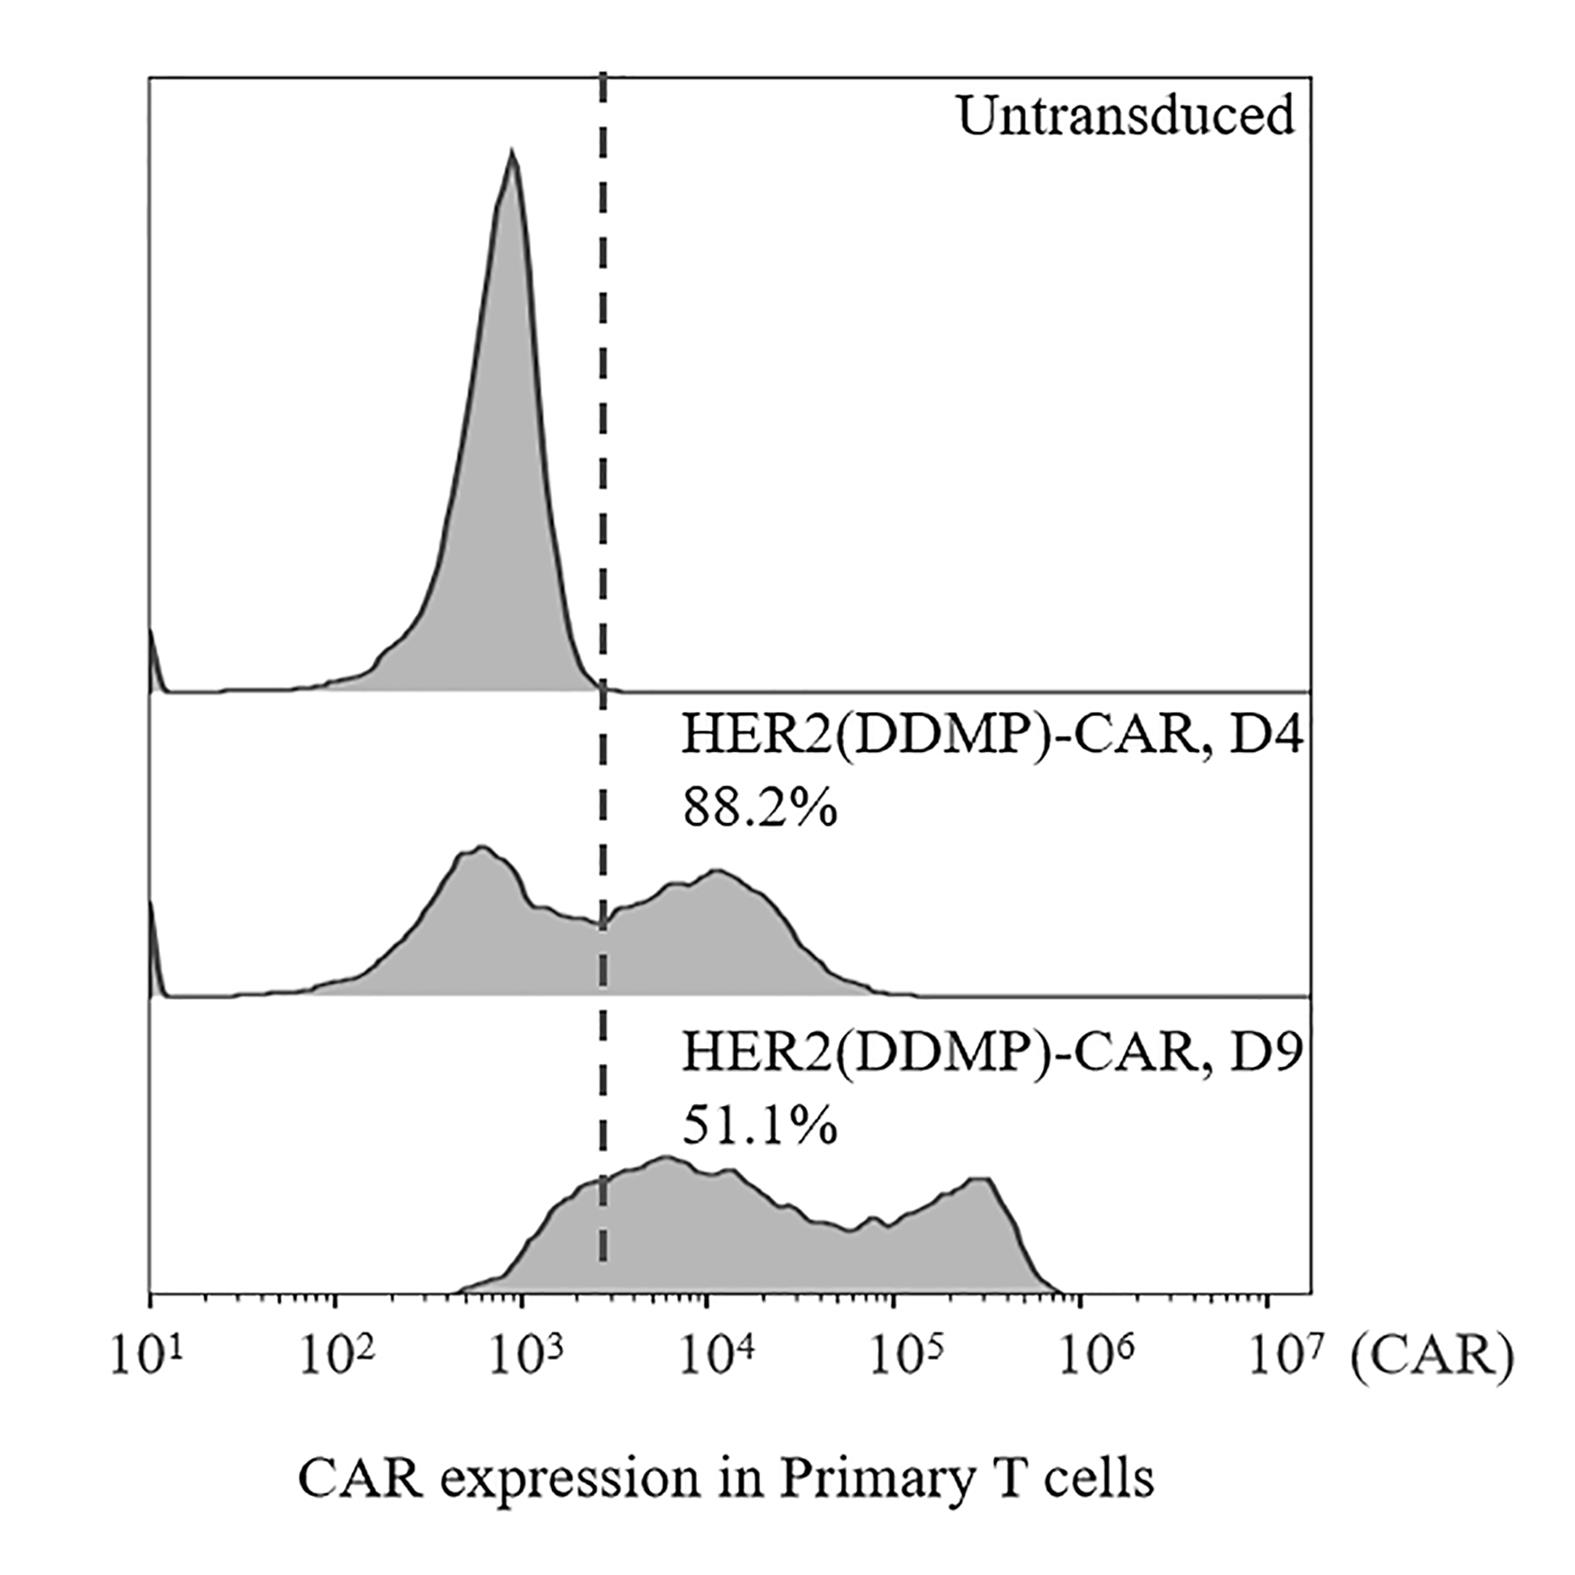
Figure 3. CAR surface expression in primary T cells at different time points post-activation. Flow cytometry histograms showing HER2(DDMP)-CAR surface expression (anti-V5-PE staining) in primary T cells at day 4 (D4) and day 9 (D9) post-activation. Untransduced T cells serve as the negative control; the dashed vertical line indicates the CAR-positive gating threshold. X-axis: V5-PE signal intensity (log scale). Y-axis: normalized cell count. Gate set on untransduced control.
D. In vitro cytotoxicity
Short-term cytotoxicity was quantified using the luciferase-based killing assay described in section J. Luminescence was measured after adding D-luciferin, and percent lysis was calculated using background subtraction and normalization to the target-only control. Specifically, the background signal (RLUbackground) was defined as the mean luminescence of at least three empty wells containing the same culture medium composition and D-luciferin but no cells. The target-only control (RLUmax) was defined as the mean luminescence of at least three wells containing luciferase-expressing target tumor cells without effector T cells. After subtracting RLUbackground from all wells, the background-corrected target-only signal (RLUmax − RLUbackground) was set as 0% lysis, and decreased luminescence in test wells was interpreted as target cell killing. Specific lysis was calculated as follows:
where RLUsample is the luminescence measured in each CAR T or control co-culture condition.
Long-term cytotoxicity was quantified using flow cytometry with counting beads, as described in section K. Events were gated sequentially to obtain clean, comparable populations for absolute counting: (i) cells and counting beads were identified on an FSC-A vs. SSC-A plot, allowing exclusion of debris while retaining both the “cells” and “beads” populations for downstream calculations; in the exemplar target-only sample (Figure 4A-i), 45% of events fell within the cell gate and 5.9% within the bead gate. (ii) Singlets were selected on an FSC-A vs. FSC-H plot to remove doublets and aggregates (94% singlets in Figure 4A-ii). (iii) Target cells and effector T cells were then separated on a two-parameter fluorescence plot (e.g., FITC channel for SK-OV-3-Luc-GFP targets and by APC-Cy7 anti-CD3 for T cells); in the target-only control, 98% of events were assigned to the SK-OV-3 gate and 0% to the T-cell gate (Figure 4A-iii), confirming gate specificity. These same gates were applied to co-culture samples to determine the absolute numbers of remaining target cells and T cells.
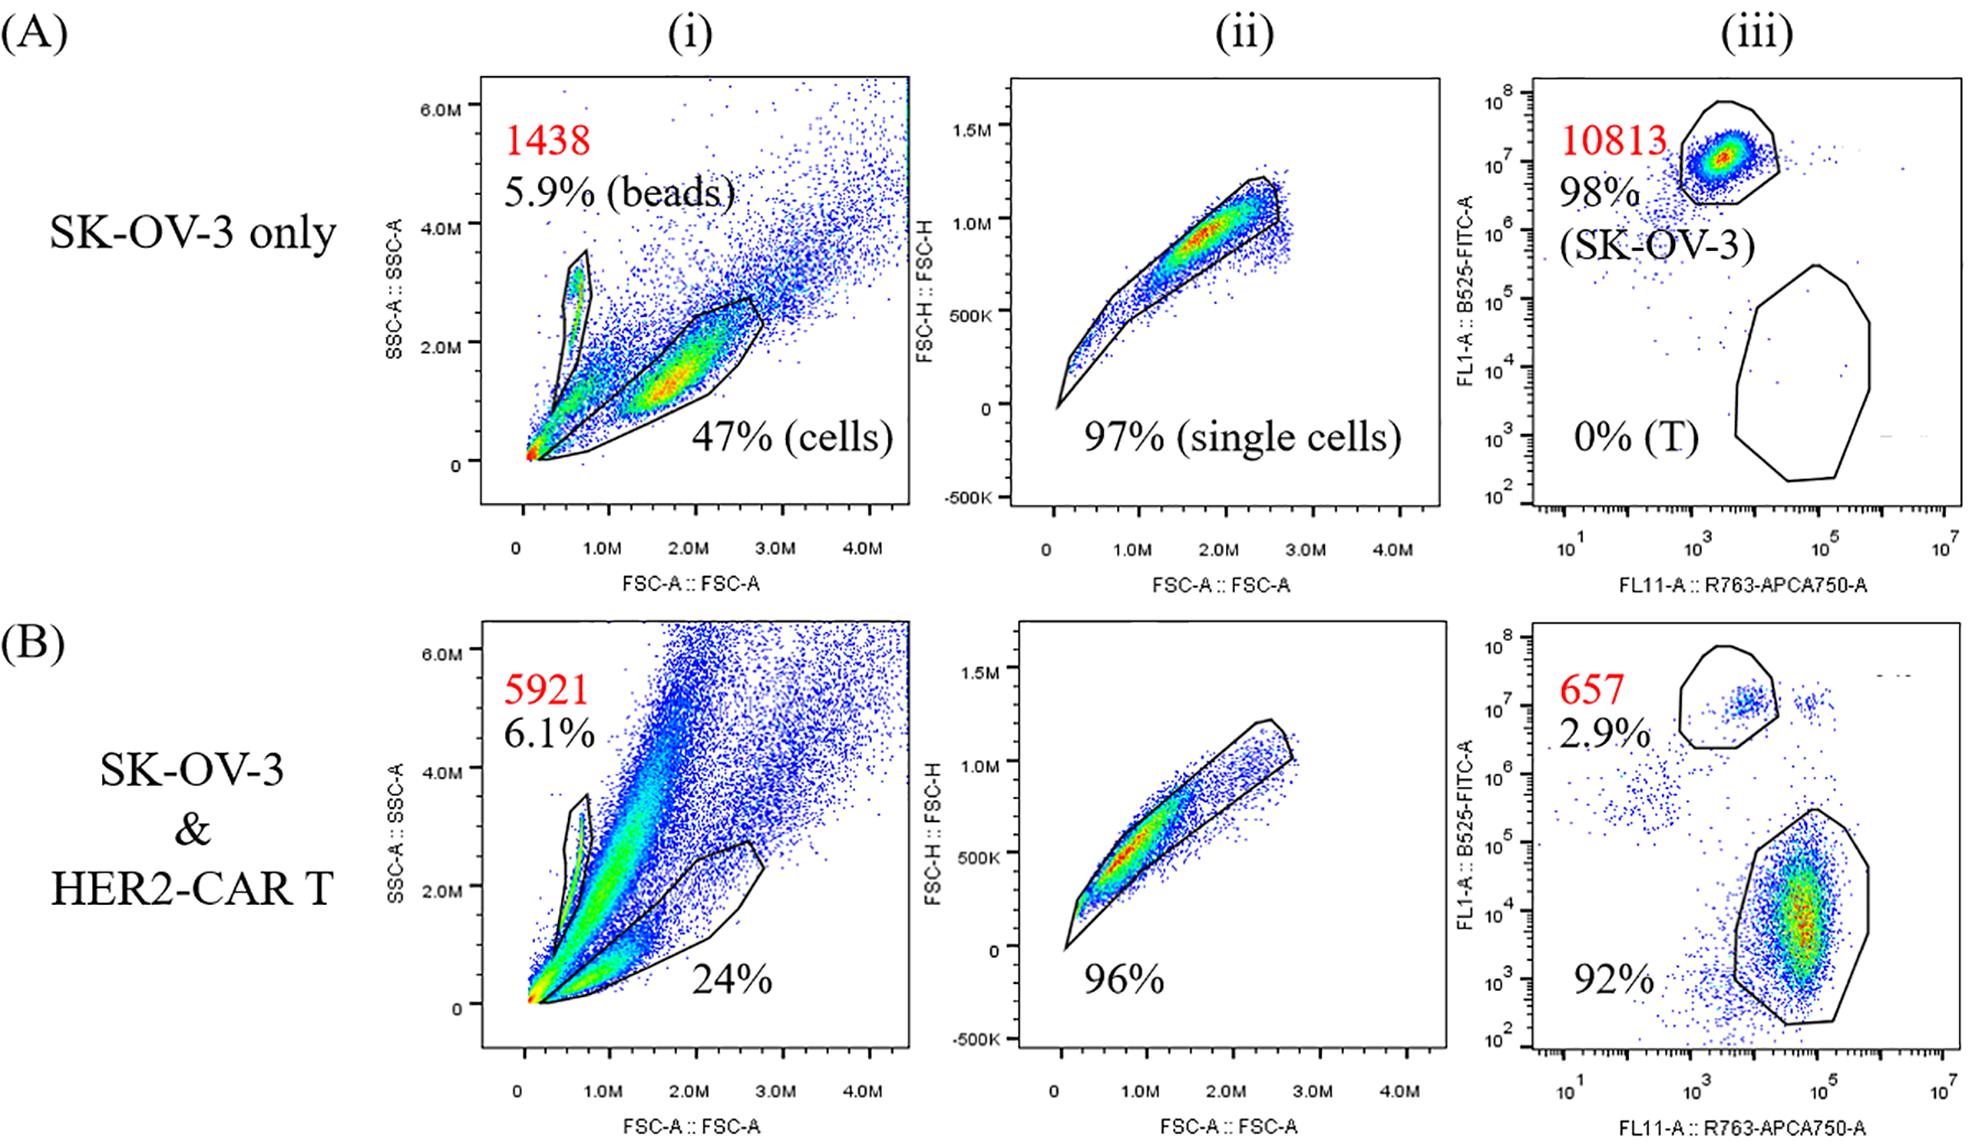
Figure 4. Representative flow-cytometry gating strategy for quantifying long-term cytotoxicity using counting beads. Left panels: FSC-A vs. SSC-A was used to identify the main “cells” population and the “beads” population. Middle panels: singlets were selected using FSC-A vs. FSC-H to exclude doublets and aggregates. Right panels: target tumor cells and effector T cells were separated based on marker expression (e.g., GFP-positive target tumor cells and CD3-positive T cells), enabling calculation of absolute counts for each population using the bead-based counting approach. Percentages shown in the plots indicate representative gate frequencies for the exemplar dataset (e.g., beads and cells in the FSC/SSC gate, singlets, and marker-defined populations). The event numbers required for the calculation are shown in red.
Absolute cell numbers are calculated using the manufacturer-provided bead concentration (103 beads/μL) and the recorded bead and sample volumes according to:
For Figure 4A,
For Figure 4B,
Specific lysis for HER2-CAR T cells in Figure 4B =
Validation of protocol
This protocol has been used and validated in the following research articles:
Meng et al. [17] Disulfide-directed multicyclic peptides for chimeric antigen receptors targeting solid tumors. J Am Chem Soc. (Figures 2–6, S1–S6, and S8–S14).
Liu et al. [18] Proline-mediated enhancement in evolvability of disulfide-rich peptides for discovering protein binders. J Am Chem Soc. (Figures 6 and S15).
General notes and troubleshooting
General notes
1. Biosafety and contamination control: Perform all lentiviral work under approved institutional biosafety procedures. Use mycoplasma-free producer and target cells to avoid contaminating viral stocks and downstream cultures.
2. Normalization by CAR-positive dose: For comparisons across CAR designs, normalize functional assays by the number of CAR-positive T cells, not total T cells. Determine the CAR-positive fraction by flow cytometry (e.g., V5 staining) at the time of each assay and adjust cell inputs accordingly.
3. Target antigen stability: Surface antigen levels can vary with passage number and culture conditions. Quantify antigen expression by flow cytometry before key experiments and keep passage numbers consistent across comparisons.
4. Reporter and target line selection: Use well-validated Jurkat NFAT-GFP reporter clones with low basal GFP and high inducible GFP. For target cells, luciferase/GFP-expressing lines simplify quantification and gating, but consider potential fluorescence overlap with reporter readouts when designing co-culture assays.
5. Controls: Include target-only wells, untransduced T-cell controls, and at least one antigen-low/negative target line for specificity assessment. For in vivo studies, predefine inclusion/exclusion criteria (e.g., engraftment threshold by IVIS on day 3).
6. Donor variability: PBMC yield, CD3-positive fraction, activation kinetics, and expansion rates vary across donors. Plan cell numbers conservatively and record donor-dependent parameters (CD3%, recovery after thaw, fold expansion) for reproducibility.
7. Cell clumping and acquisition quality: Clumping can distort flow cytometry quantification and sorting outcomes. Use gentle pipetting, filter suspensions before acquisition, and keep staining conditions consistent across samples.
8. Timeline: Approximate durations are based on standard laboratory conditions. Parallel execution of independent sections (D, E, G) is recommended to minimize total elapsed time.
Table 1. Protocol timeline: Cyclic peptide-based CAR T-cell construction and evaluation
| Section | Phase | Duration | Notes |
|---|---|---|---|
| A | Quantification of cell-surface antigen | 1–2 days | Can be done early; requires only target cell lines |
| B | Construct cloning | 1–2 weeks | Gene synthesis: add 1–2 weeks if outsourced |
| C | Lentivirus production | ~5 days | 72 h post-transfection harvest; concentrate same day |
| D | Luciferase cell lines | 4–6 weeks | Includes single-cell cloning (~2–3 weeks) and luciferase validation |
| E | Jurkat NFAT-GFP reporter cells | 4–6 weeks | Can be run in parallel with section D; single-cell cloning dominates the timeline |
| F | CAR transduction validation (Jurkat) | ~3 days | Validates lentiviral batch before use in primary T cells |
| G | NFAT activation assay | ~2 days | Co-culture with Jurkat NFAT-GFP cells; 18 h |
| H | PBMC isolation | ~4 h | Plan blood draw; process same day |
| I | CAR T-cell generation | 9–12 days | Activation (day 0), transduction (day 2), expansion to day 9 |
| J1 | Luciferase killing assay (in vitro short-term efficacy) | ~2 days | 18 h co-culture; normalized to CAR+ cell count |
| J2 | Cytokine secretion (ELISA) | 1 day | Supernatant from section J1 co-cultures |
| K | Flow cytometry cytolysis (in vitro long-term cytotoxicity) | ~5 days | 4-day co-culture; can run in parallel with section J |
| L | In vivo xenograft (IVIS) | ~1–2 months | Tumor implantation (day 0), CAR T injection (day 3); IVIS imaging weekly |
Key scheduling notes:
Sections D (luciferase target cells) and E (Jurkat NFAT-GFP reporter cells) are independent of each other and of section I (CAR T generation) and should be initiated in parallel immediately after lentivirus production (section C) to minimize total elapsed time. These sections are rate-limiting steps (~4–6 weeks each) and will determine the earliest possible start date for downstream functional assays.
Section F (CAR transduction validation in Jurkat cells) requires only ~3 days and should be completed before using primary T cells in section I, to confirm lentiviral batch quality.
PBMC isolation (section H) and CAR T cell generation (section I) should be scheduled only after lentiviral batch validation (section F) is complete and cell lines (sections D and E) are ready, to avoid having CAR T cells ready before target/reporter lines are available.
Total elapsed time from construct cloning to completion of all in vitro assays is approximately 9–11 weeks under parallel execution; completion of in vivo xenograft studies (section L) extends the total timeline to approximately 13–16 weeks.
Troubleshooting
Problem 1: Low transduction efficiency in Jurkat cells.
Possible causes: Viral titer is low, or viral activity has decreased due to repeated freeze–thaw cycles.
Solution: Use freshly thawed aliquots and avoid repeated freeze–thaw. If a batch consistently underperforms, prepare a new viral stock. When preparing new stocks, first verify the quality and relative concentration of the required plasmids by agarose gel electrophoresis. For example, load ~200 ng of each plasmid; samples should show comparable band intensity and the expected supercoiled plasmid pattern. If plasmid quality is poor or concentrations are inconsistent, re-prepare the plasmids before repeating virus production. In some cases, changing the lentiviral transfer vector backbone or the signal peptide sequence can also affect CAR surface expression and apparent transduction performance.
Problem 2: Poor surface expression of the DDMP-based CAR.
Possible causes: Poor surface expression of DDMP-CARs may arise from several DDMP-specific factors distinct from those seen in conventional scFv-based CARs. First, the compact DDMP domain (<5 kDa) sits in close proximity to the cell membrane when short hinges are used, potentially hindering V5 antibody access and causing underestimation of true surface density. Second, signal peptides poorly matched to the DDMP N-terminus can reduce ER translocation efficiency and impair surface trafficking.
Solutions: If V5 staining is weak despite confirmed transduction, we recommend hinge optimization. Start with the standard CD8α hinge; if expression remains poor, replace it with the CD28 hinge or IgG-Fc hinge (sequences in the note in section B). These longer hinges increase membrane extension and are suitable for compact extracellular domains. Avoid short or rigid linkers, as they can compress the DDMP and impair antigen binding. For signal peptide selection, the human CD8α or mouse Igκ signal peptides (see note in section B) generally work well. If surface expression is still low, systematically test these alternatives, as signal peptide efficacy is context-dependent.
Note: In our experience, no significant loss of DDMP structural integrity or CAR surface expression is observed over the standard 9-day culture period described in this protocol. For extended cultures beyond day 9 (e.g., repeated stimulation or persistence studies), monitor V5 surface expression every 3–4 days, as prolonged culture may introduce reductive stress or metalloprotease activity that could compromise surface DDMP integrity.
Problem 3: High background (tonic) activation in Jurkat NFAT-GFP cells (high GFP in the no-target control).
Possible causes: Tonic signaling due to high CAR expression, CAR design (e.g., signaling domain configuration), or excessive virus input leading to very high CAR density.
Solution: Reduce the virus dose during transduction. If tonic activation persists, test alternative hinge, transmembrane, and/or costimulatory domain configurations.
Problem 4: Poor single-cell outgrowth after sorting (luciferase target lines or NFAT reporter clones).
Possible causes: Sorting stress, suboptimal post-sort culture conditions, or overly stringent gating.
Solutions: Use gentle sort settings, include a 100-cell “focus/control” well per plate, and expand from an early polyclonal GFP-high population before single-cell cloning. Sort cells in log-phase growth whenever possible.
Problem 5: Luciferase signal is not linear with cell number.
Possible causes: Uneven cell attachment, insufficient equilibration after luciferin addition, or signal saturation due to plate reader settings.
Solutions: Standardize seeding density and attachment time, keep luciferin concentration and incubation time constant, and adjust integration time/gain to avoid saturation.
Problem 6: Low cytokine signal in ELISA.
Possible causes: Insufficient effector activation (low CAR-positive fraction, low antigen density, or suboptimal E:T ratio) and/or excessive dilution of supernatant.
Solutions: Confirm CAR-positive fraction and antigen expression, increase the E:T ratio or co-culture duration, and reduce dilution by increasing the supernatant input volume per well (within kit limits).
Problem 7: Inconsistent tumor growth or weak IVIS signal in vivo.
Possible causes: Variable tumor cell viability at implantation, Matrigel handling issues (premature gelling), or inconsistent injection technique.
Solutions: Keep Matrigel cold, mix immediately before injection, standardize injection volume and site, confirm engraftment by IVIS before randomization, and exclude non-engrafted mice using predefined criteria. Using a single-clone reporter line can also reduce variability in IVIS signal and tumor growth kinetics.
Acknowledgments
Conceptualization, X.M. and Y.H.T.; Investigation, X.M. and Q.W.; Writing—Original Draft, X.M., Q.W., and Y.H.T.; Writing—Review & Editing, X.M. and Y.H.T.; Funding acquisition, X.M. and Y.H.T.; Supervision, X.M. and Y.H.T. We thank Shenzhen Bay Laboratory, Shenzhen Medical Research Fund (D2501002 to Y.H.T.), National Natural Science Foundation of China (22107076 to Y.H.T.), and China Postdoctoral Science Foundation (2024M752146 to X.M.) for financial support. The protocol was described and validated in Meng et al. J. Am. Chem. Soc. 2026, 148, 400 [17] and Liu et al. J. Am. Chem. Soc. 2025, 147, 24870 [18]. During the preparation of this manuscript, ChatGPT and Claude were used to assist with language editing, including grammar checking, identification of typographical errors, and assessment of consistency, clarity, coherence, and formatting. Google NotebookLM was used to generate the icons included in the graphical overview. All AI-assisted text and graphical elements were carefully reviewed, edited, and verified by the authors, who take full responsibility for the accuracy, integrity, and final content of the manuscript.
Supplementary information
The following supporting information can be downloaded here:
1. Supplementary Data File S1: Detailed, annotated plasmid map for the HER2(DDMP)-CAR lentiviral transfer vector.
The map, provided in a standard annotated plasmid map file (.dna format, e.g., compatible with SnapGene Viewer), clearly labels all key features: promoter, signal peptide, HER2(DDMP), V5 tag, CD8 hinge, CD28 transmembrane domain, CD28 costimulatory domain, and CD3ζ signaling domain.
Competing interests
The authors declare the following competing financial interest(s): X.M. and Y.H.T.
Ethical considerations
Human peripheral blood from healthy donors was obtained from MileCell Bio with appropriate informed consent and ethics approval (LL-KT-2022055). Mouse experiments were approved by the Institutional Animal Care and Use Committee of Shenzhen Bay Laboratory (AECYX202301).
References
- Xiao, Q. and Su, X. (2023). Anti-tumor Efficacy of CD19 CAR-T in a Raji B Cell Xenografted Mouse Model. Bio Protoc. 13(8): e4655. https://doi.org/10.21769/bioprotoc.4655
- Prommersberger, S., Hudecek, M. and Nerreter, T. (2020). Antibody‐Based CAR T Cells Produced by Lentiviral Transduction. Curr Protoc Immunol. 128(1): e93. https://doi.org/10.1002/cpim.93
- Safont, M. M., Leitch, C., Popa, M., Gjerstad, M. E., Caulier, B., Inderberg, E. M., Wälchli, S., Gelebart, P. and McCormack, E. (2024). Protocol for the development of a bioluminescent AML-PDX mouse model for the evaluation of CAR T cell therapy. STAR Protoc. 5(4): 103522. https://doi.org/10.1016/j.xpro.2024.103522
- Zhang, D., Krimitza, E., Han, K., Su, R., Xu, D. J., Xu, J. R., Gong, Y. and Fan, Y. (2024). Protocol to generate traceable CAR T cells for syngeneic mouse cancer models. STAR Protoc. 5(1): 102898. https://doi.org/10.1016/j.xpro.2024.102898
- Selli, M. E., Landmann, J. H., Arveseth, C. and Singh, N. (2023). Inducing T cell dysfunction by chronic stimulation of CAR-engineered T cells targeting cancer cells in suspension cultures. STAR Protoc. 4(1): 101954. https://doi.org/10.1016/j.xpro.2022.101954
- Tatari, N., Maich, W. T., Salim, S. K., Mckenna, D., Venugopal, C. and Singh, S. (2020). Preclinical Testing of CAR T Cells in a Patient-Derived Xenograft Model of Glioblastoma. STAR Protoc. 1(3): 100174. https://doi.org/10.1016/j.xpro.2020.100174
- Wu, C., Leroux, J. C. and Gauthier, M. A. (2012). Twin disulfides for orthogonal disulfide pairing and the directed folding of multicyclic peptides. Nat Chem. 4(12): 1044–1049. https://doi.org/10.1038/nchem.1487
- Wu, C. (2025). Motif-Directed Oxidative Folding to Design and Discover Multicyclic Peptides for Protein Recognition. Acc Chem Res. 58(10): 1620–1631. https://doi.org/10.1021/acs.accounts.5c00060
- Xu, C., Meng, X., Chai, P., Liu, H., Duan, Z., Tsai, Y. H. and Wu, C. (2025). Directed Evolution of Multicyclic Peptides Using Yeast Display for Sensitive and Selective Fluorescent Analysis of CD28 on the Cell Surface. Anal Chem. 97(7): 4031–4040. https://doi.org/10.1021/acs.analchem.4c05681
- Duan, Z., Kong, C., Fan, S. and Wu, C. (2024). Triscysteine disulfide-directing motifs enabling design and discovery of multicyclic peptide binders. Nat Commun. 15: 7799. https://doi.org/10.1038/s41467-024-51723-w
- Lu, S., Fan, S., Xiao, S., Li, J., Zhang, S., Wu, Y., Kong, C., Zhuang, J., Liu, H., Zhao, Y., et al. (2023). Disulfide-Directed Multicyclic Peptide Libraries for the Discovery of Peptide Ligands and Drugs. J Am Chem Soc. 145(3): 1964–1972. https://doi.org/10.1021/jacs.2c12462
- Li, J., Liu, H., Xiao, S., Fan, S., Cheng, X. and Wu, C. (2023). De Novo Discovery of Cysteine Frameworks for Developing Multicyclic Peptide Libraries for Ligand Discovery. J Am Chem Soc. 145(51): 28264–28275. https://doi.org/10.1021/jacs.3c11856
- Yao, S., Moyer, A., Zheng, Y., Shen, Y., Meng, X., Yuan, C., Zhao, Y., Yao, H., Baker, D., Wu, C., et al. (2022). De novo design and directed folding of disulfide-bridged peptide heterodimers. Nat Commun. 13: 1539. https://doi.org/10.1038/s41467-022-29210-x
- Wu, Y., Fan, S., Dong, M., Li, J., Kong, C., Zhuang, J., Meng, X., Lu, S., Zhao, Y., Wu, C., et al. (2022). Structure-guided design of CPPC-paired disulfide-rich peptide libraries for ligand and drug discovery. Chem Sci. 13(26): 7780–7789. https://doi.org/10.1039/d2sc00924b
- Lu, S., Wu, Y., Li, J., Meng, X., Hu, C., Zhao, Y. and Wu, C. (2020). Directed Disulfide Pairing and Folding of Peptides for the De Novo Development of Multicyclic Peptide Libraries. J Am Chem Soc. 142(38): 16285–16291. https://doi.org/10.1021/jacs.0c06044
- Zheng, Y., Li, Z., Ren, J., Liu, W., Wu, Y., Zhao, Y. and Wu, C. (2017). Artificial disulfide-rich peptide scaffolds with precisely defined disulfide patterns and a minimized number of isomers. Chem Sci. 8(4): 2547–2552. https://doi.org/10.1039/c6sc05710a
- Meng, X., Fu, K., Liu, Y., Liu, Y., Zhang, J. Z., Kang, X., Wu, C. and Tsai, Y. H. (2026). Disulfide-Directed Multicyclic Peptides for Chimeric Antigen Receptors Targeting Solid Tumors. J Am Chem Soc. 148(1): 400–413. https://doi.org/10.1021/jacs.5c13642
- Liu, H., Song, L., Meng, X., Li, J., Fan, S., Dong, H., Wang, X., Li, M., Yu, H., Tsai, Y. H., et al. (2025). Proline-Mediated Enhancement in Evolvability of Disulfide-Rich Peptides for Discovering Protein Binders. J Am Chem Soc. 147(28): 24870–24883. https://doi.org/10.1021/jacs.5c07075
Article Information
Publication history
Received: Mar 23, 2026
Accepted: May 6, 2026
Available online: May 21, 2026
Published: Jul 5, 2026
Copyright
© 2026 The Author(s); This is an open access article under the CC BY-NC license (https://creativecommons.org/licenses/by-nc/4.0/).
How to cite
Meng, X., Wu, Q. and Tsai, Y. (2026). Construction and Functional Evaluation of Cyclic Peptide-Based CAR T Cells in Tumor Models. Bio-protocol 16(13): e5715. DOI: 10.21769/BioProtoc.5715.

 Download Citation in RIS Format
Category
Cancer Biology > Tumor immunology > Cancer therapy > Cell transfer therapy
Cell Biology > Cell engineering > Lentiviral delivery
Immunology > Immunotherapy > CAR-T
Do you have any questions about this protocol?
Post your question to gather feedback from the community. We will also invite the authors of this article to respond.
 Post a Question


