- Protocols

- Articles and Issues
- For Authors
- About
- Become a Reviewer

Production, Purification, and Fluorometric Activity Assay of Human Aldehyde Dehydrogenases
Published: Vol 12, Iss 17, Sep 5, 2022 DOI: 10.21769/BioProtoc.4505 Views: 2583
Reviewed by: ASWAD KHADILKARMario ValentinoKomuraiah Myakala
Original research article
The authors used this protocol in:

Apr 2022

Protocol Collections
Comprehensive collections of detailed, peer-reviewed protocols focusing on specific topics


Related protocols
Abstract
Human aldehyde dehydrogenase (ALDH) isoforms are NAD(P)+-dependent enzymes catalyzing the oxidation of a wide spectrum of aldehydes to their corresponding carboxylic acids. ALDH families 1 and 3 are associated with stemness, chemoresistance, and tumor progression across multiple tumor types. ALDH2 is involved in ethanol metabolism, and its deficiency is associated with a wide range of diseases. This protocol includes a method for recombinant protein production and affinity purification under reducing conditions that apply to ALDH family 1 and 3 isoforms, to produce high yields of pure, catalytically active protein (10–30 mg/L of culture). It also includes their respective enzymatic activity assays, optimized and based on the fluorescence emission of NAD(P)H at 460 nm, using hexanal (for ALDH1A1, 1A2, 1A3, and 2) or p-nitrobenzaldehyde (for ALDH3A1) as a substrate. These assays offer higher sensitivity than common UV-visible spectrophotometry and avoid interference of compounds that mask NAD(P)H absorption at 340 nm. The protocol could be adapted to high-throughput screenings using a fluorescent microplate reader. Not a single protocol existed in the literature that comprehensively addressed the methodology entailed in the production, purification, and fluorometric activity assays of the five isoforms. This standardized protocol, allowing a side-by-side comparison between the various isoforms and studies, is filling the gap and supersedes previously partial and scattered methodological information, representing an important contribution to the field. Here, high amounts of pure, soluble, stable, and catalytically active protein are obtained, which are suitable for crystallization trials and for the identification and characterization of substrates and inhibitors with therapeutic potential in the diagnostic and treatment of cancer and other diseases.
Keywords: Aldehyde dehydrogenaseBackground
The aldehyde dehydrogenase (ALDH) superfamily consists of a cluster of evolutionarily related NAD(P)+-dependent enzymes catalyzing the oxidation of a wide spectrum of aldehydic substrates, generated from various endogenous and exogenous precursors to their corresponding carboxylic acids. Accordingly, ALDHs participate in several cellular processes, including the detoxification of endobiotic and xenobiotic compounds. The ALDHs comprise 19 isoforms that are active in most mammalian tissues, with the highest level in the liver, followed by the kidney, uterus, and brain (Koppaka et al., 2012). The different isoforms present different subcellular localization (cytoplasm, mitochondria, endoplasmic reticulum, and nucleus) and assemble into dimers or tetramers to form the active protein (Marchitti et al., 2008).
Among the ALDH isoforms, ALDH members from families 1 and 3 have received increased attention as potential therapeutic targets in the treatment of cancer and other pathological conditions. The enzymatic activities of members from ALDH family 1 (e.g., ALDH1A1, ALDH1A2, and ALDH1A3) and family 3 (e.g., ALDH3A1) are commonly used as cancer stem cell markers, and are reported as involved in proliferation, drug resistance, and metastasis, which together contribute to cancer aggressiveness and poor prognosis (Feng et al., 2009; Greco et al., 2014; Li et al., 2014; Rebollido-Rios et al., 2020). Additionally, ALDH family 1 participates in the regulation of hundreds of genes during early developmental stages, via the production of retinoic acid (Iturbide et al., 2021). ALDH2, which is actually an ALDH family 1 member when considering sequence identity (Vasiliou et al., 2013), is the major enzyme involved in the oxidation of acetaldehyde during ethanol metabolism (Klyosov et al., 1996). The functional inactivation of ALDH2 is robustly associated with the development of certain types of cancers, including oropharyngolaryngeal, esophageal, stomach, colon, lung, head, and neck cancers (Muto, 2000; Yokoyama et al., 2001). Altogether, ALDH families 1 and 3 are considered promising targets for the diagnosis and treatment of cancer and other diseases (Duan et al., 2016). In addition, ALDH enzymes metabolize toxic aldehydes from lipid peroxidation to counterbalance the effects of reactive oxygen species (Singh et al., 2014).
With the aim to find novel, potent, and selective inhibitors against ALDH1A1, ALDH1A2, ALDH1A3, ALDH2, and ALDH3A1, the overexpression, purification, and determination of the specific enzyme activity of these five isoforms become essential procedures for structure-function studies and the identification and characterization of putative inhibitory molecules (Jiménez et al., 2019; Pequerul et al., 2020; Ibrahim et al., 2021, 2022; Castellví et al., 2022). Thus, it is of prime importance to tackle and optimize reproducible methodologies to obtain recombinant ALDH isoforms, as well as to develop side-by-side protocols for determining the standard enzymatic activity of members of human ALDH families 1 and 3. Only if the standard conditions are perfectly established, could we obtain high protein amounts for crystallization trials and structure-based drug design, as well as for developing screening procedures for novel inhibitors against ALDH isoforms.
Since ALDH1A1, ALDH1A2, ALDH1A3, and ALDH2 exhibit a role in the physiological oxidation of alkanals such as hexanal, this aldehyde was used as a substrate to measure the standard activity of these isoforms. Hexanal is a product of lipid peroxidation, and its concentration is increased in cancer (Janfaza et al., 2019). ALDH3A1 participates actively in the metabolism of exogenous aromatic aldehydes, such as cinnamaldehyde, anisaldehyde, vanillin, and benzaldehyde, which are usually found in food components (Laskar and Younus, 2019). Accordingly, p-nitrobenzaldehyde, which is chemically more reactive than benzaldehyde, was used as a standard substrate for this isoform.
Materials and Reagents
1.5 mL sterile tube (Sudelab, catalog number: 1002208)
250 mL Beckman tubes (Beckman Coulter, catalog number: 356011)
0.45-µm filters (ACEFESA, Whatman, catalog number: GE10462100)
1-mL quartz cuvettes (Teknokroma, Starna, catalog number: ST-29-F/Q/10)
96-well microplates (Sarstedt, catalog number: 82.1581.100)
E. coli BL21 (DE3) pLysS competent cells (Sigma-Aldrich, Novagen, catalog number: 69451-M)
pET-30 Xa/LIC expression vector kit (Sigma-Aldrich, Novagen, catalog number: 70073)
ALDH/pET-30 Xa/LIC constructs (Proteogenix, custom order catalog number: GS-GS002—Gene Synthesis Service—and GS-SBG03—Subcloning into expression vector for gene <3,000 bp; https://www.proteogenix.science/custom-gene-synthesis/)
Kanamycin (Kn) (Sigma-Aldrich, catalog number: 60615)
Chloramphenicol (Cm) (Sigma-Aldrich, catalog number: C0378)
Glycerol (Sigma-Aldrich, catalog number: G5516)
Kolle handle loop (Auxilab, P. SELECTA, catalog number: BRG501)
Tryptone (Sigma-Aldrich, catalog number: 95039)
Yeast extract (Thermo Fisher Scientific, catalog number: 212750)
Sodium chloride (NaCl) (Sigma-Aldrich, catalog number: S9625)
Isopropyl β-d-1-thiogalactopyranoside (IPTG) (Sigma-Aldrich, catalog number: I6758)
Trizma base (Sigma-Aldrich, catalog number: T6066)
Imidazole (Sigma-Aldrich, catalog number: I202)
Lysozyme (Roche, catalog number: 10837059001)
DNase (Roche, catalog number: 10104159001)
Triton-X 100 (Sigma-Aldrich, catalog number: X-100)
Phenylmethanesulfonyl fluoride solution (PMSF) (Sigma-Aldrich, catalog number: 93482)
DL-Dithiothreitol (DTT) (ACEFESA, Panreac AppliChem, catalog number: A1101)
PD 10 desalting column (GE Healthcare, catalog number: 17-0851-01)
Coomassie Brilliant Blue R 250 (Sigma-Aldrich, catalog number: 1.12553)
Bovine serum albumin (BSA) (Roche, catalog number: 10711454001)
Bradford reagent (ACEFESA, Panreac AppliChem, catalog number: A6932,0500)
Sodium dodecyl sulfate (SDS) (Sigma-Aldrich, catalog number: L3771)
BenchMarkTM protein ladder (Thermo Fisher Scientific, catalog number: 10747012)
Sucrose (Sigma-Aldrich, catalog number: S0389)
Bromophenol blue sodium salt (Sigma-Aldrich, catalog number: B5525)
Glycine (Sigma-Aldrich, catalog number: W328707)
Methanol (MetOH) (ACEFESA, LABKEM, catalog number: MTOL-0GH-2K5)
Acetic acid (VWR, catalog number: 20103.295)
HEPES (Sigma-Aldrich, catalog number: H3375)
Ethylenediaminetetraacetic acid (EDTA) (Sigma-Aldrich, catalog number: E5134)
Nicotinamide adenine dinucleotide (NAD+) (Apollo Scientific, catalog number: BIB3011)
Nicotinamide adenine dinucleotide (reduced form) (NADH) (Apollo Scientific, catalog number: BIB3012)
Hexanal (Sigma-Aldrich, catalog number: H9008)
Magnesium chloride (Sigma-Aldrich, catalog number: M-2670)
Nicotinamide adenine dinucleotide phosphate (NADP+) (Apollo Scientific, catalog number: BIB3013)
Nicotinamide adenine dinucleotide phosphate (reduced form) (NADPH) (Apollo Scientific, catalog number: BIB3014)
p-Nitrobenzaldehyde (Sigma-Aldrich, catalog number: 72800)
LB culture medium (see Recipes)
2× YT culture medium (see Recipes)
Bind buffer (see Recipes)
Elution buffer (see Recipes)
Equilibration buffer (see Recipes)
5× TMR charge buffer (see Recipes)
Running buffer (see Recipes)
Coomassie Blue colorant (see Recipes)
De-stain solution (see Recipes)
Reaction buffer A (see Recipes)
Reaction buffer B (see Recipes)
Reaction buffer C (see Recipes)
20 mM NAD+ stock solution (see Recipes)
500 µM NADH stock solution (see Recipes)
40 mM NADP+ stock solution (see Recipes)
500 µM NADPH stock solution (see Recipes)
2 mM hexanal (see Recipes)
2 mM p-nitrobenzaldehyde (see Recipes)
Equipment
Bibby ScientificTM StuartTM block heater (Fisher Scientific, catalog number: 10489438)
Incubator shaker (VWR, New Brunswick, model: Innova® 43)
UV-Vis spectrophotometer (Agilent Technologies, model: Cary 60)
Centrifuge (Beckman Coulter, model: Avanti® J-26 XP)
Fixed-angle rotor (Beckman Coulter, model: JA-14)
Fixed-angle rotor (Beckman Coulter, model: JA-25.50)
Sonic dismembrator (Fisher Scientific, model: FisherbrandTM Model 705)
ÄKTATM start FPLC (Fast Protein Liquid Chromatography) purification system (Cytiva, catalog number: 29022094)
Multiplate reader (Tecan, model: Tecan® Spark)
Bransonic cleaner (Fisher Scientific, model: B200)
PowerPacTM basic power supply (Bio-Rad, catalog number: 1645050)
Cary Eclipse fluorescence spectrometer (Agilent Technologies)
Software
Unicorn 7 (GE Healthcare/Cytiva, https://www.cytivalifesciences.com/en/us/shop/chromatography/software/unicorn-7-p-05649)
Spark ControlTM (Tecan, https://lifesciences.tecan.es/multimode-plate-reader?p=tab--3)
Cary WINUV (Agilent Technologies, https://www.agilent.com/en/product/molecular-spectroscopy/uv-vis-uv-vis-nir-spectroscopy/uv-vis-uv-vis-nir-software/cary-winuv-software)
Procedure
Transformation of E. coli BL21 (DE3) pLysS competent cells with ALDH/pET-30 Xa/LIC constructs using the regular heat-shock method
Thaw E. coli BL21 (DE3) pLysS competent cells on an ice bath. Transfer 100 µL of cell suspension into a 1 mL sterile tube.
Add 1 ng of ALDH/pET-30 Xa/LIC construct to the cells.
Mix gently by pipetting up and down, and incubate on an ice bath for 5 min.
Heat-shock cells at 42 °C for 30 s using a block heater.
Note: Do not heat shock for more than 45 s.
Incubate on an ice bath for 2 min.
Immediately add 1 mL of LB media to the cells.
Incubate tubes for 1 h at 37 °C with agitation at 250 rpm.
Centrifuge at 16,100 × g for 5 min.
Remove 1 mL of supernatant and resuspend the pellet in the remaining LB media.
Spread 100 µL of cells onto LB plates containing 50 µg/mL kanamycin (Kn) and 34 µg/mL chloramphenicol (Cm).
Incubate overnight (O/N) at 37 °C.
Pick colonies and prepare an O/N culture in 5 mL of LB media containing 50 µg/mL Kn and 34 µg/mL Cm.
Prepare a bacterial glycerol stock with 400 µL of O/N culture and 100 µL of 80% glycerol.
Vortex.
Store the glycerol stock at -80 °C.
Expression and purification of recombinant human ALDH enzymes
Prepare an overnight (O/N) cell culture (25 mL of LB media) using the E. coli BL21 (DE3) pLysS cells containing ALDH/pET-30 Xa/LIC constructs in glycerol stock stored at -80 °C, with 50 µg/mL Kn and 34 µg/mL Cm (add 25 µL of each antibiotic using 50 mg/mL Kn and 34 mg/mL Cm solutions).
Inoculate the cells using a Kolle handle loop under sterile conditions.
Incubate O/N at 37 °C with agitation at 250 rpm, using an Innova 43 Incubator Shaker.
Measure the optical density (O.D.) at 595 nm using a spectrophotometer and inoculate the 25 mL of O/N culture in 1 L of 2× YT with 50 µg/mL Kn and 34 µg/mL Cm (add 1 mL of each antibiotic using 50 mg/mL Kn and 34 mg/mL Cm solutions).
Incubate until O.D.595 is 0.8.
Collect a 1 mL aliquot of pre-induction cell culture and keep it at -20 °C for further electrophoretic analysis (pre-induction aliquot). Induce the remaining culture with 1 mM IPTG.
Incubate O/N at 22 °C in an orbital shaker with agitation at 250 rpm.
Collect a 1 mL aliquot of IPTG post-induction cell culture and keep it at -20 °C for further electrophoretic analysis (post-induction aliquot).
Dispense the culture in 250 mL Beckman tubes.
Centrifuge at 12,400 × g (JA-14 rotor) and 4 °C for 10 min.
Discard the supernatant and resuspend the pellet with 35 mL of 20 mM Tris/HCl, 0.5 M NaCl, and 5 mM imidazole, pH 8.0 (bind buffer).
Lyse by freeze-thawing; keep the cell extracts O/N at -20 °C.
Thaw the cell extract at room temperature (RT).
Add 1 mg/mL lysozyme (700 μL of 50 mg/mL stock solution), 20 μg/mL DNase (350 μL of 2 mg/mL stock solution), 1% Triton-X 100 (1.5 mL of 20% stock solution), 1 mM PMSF (350 μL of 0.1 M stock solution), and 5 mM DTT (175 μL of 1 M stock solution).
Incubate on ice in an orbital shaker with agitation at 250 rpm for 20 min to obtain a less viscous sample.
Sonicate at 35% amplitude for 2 min (2 s ON – 1 s OFF) to obtain a homogeneous sample solution.
Collect a 1 mL aliquot of sonicated sample, centrifuge at 16,100 × g for 20 min, and keep the soluble fraction and the pellet separately at -20 °C, for further electrophoretic analysis (soluble and insoluble fraction after sonication aliquots, respectively). Proceed to the purification step.
Centrifuge the sonicated sample at 15,000 × g (JA-25.50 rotor) and 4 °C for 20 min.
Filtrate the supernatant through 0.45 µm filters.
Collect a 1 mL aliquot of supernatant and keep it at -20 °C for further electrophoretic tests. Proceed to the purification step.
Set the purification by affinity chromatography on a nickel-charged chelating SepharoseTM Fast Flow 5 mL column (HisTrap), using an ÄKTATM FPLC purification system.
After loading the sample, apply an increasing stepwise gradient of imidazole (5, 60, 100, and 250 mM) in 20 mM Tris/HCl, 0.5 M NaCl, 1 M imidazole, pH 8.0 (elution buffer) to enzyme elution (Figure 1):
1% imidazole, 10 column volumes (CV), 10 mL fractions
5.5% imidazole, 10 CV, 10 mL fractions
9.5% imidazole, 10 CV, 10 mL fractions
24.5% imidazole, 5 CV, 1 mL fractions
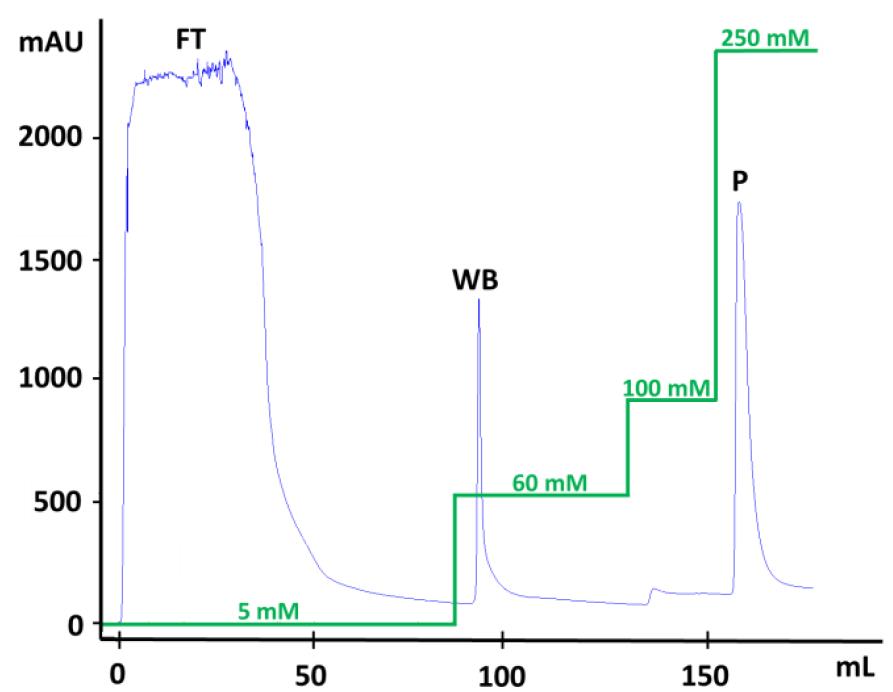
Figure 1. FPLC elution profile of a (His)6-ALDH on a nickel-charged chelating SepharoseTM Fast Flow 5 mL column (HisTrap) using an ÄKTATM FPLC purification system. The blue line represents the amount of eluted protein measured by the absorbance at 280 nm and the green line represents the stepwise imidazole gradient. FT: flowthrough or unbound protein fraction. WB: weakly bound protein fraction. P: peak with protein of interest.Collect 1 mL aliquots of flowthrough (FT) and weakly bound (WB) protein fractions for further electrophoretic analysis.
Add 2.5 mL of eluted protein sample (24.5% imidazole fraction) in the PD 10 desalting column and remove imidazole with 3.5 mL of 50 mM mM Tris/HCl, 0.5 M NaCl, pH 8.0 (equilibration buffer).
Add 5 mM DTT, and prepare 200 μL protein aliquots by snap freezing in liquid nitrogen and storing at -20 °C.
Preparation and analysis of samples by SDS-PAGE
Prepare eight dilutions of bovine serum albumin (BSA) as a calibration curve (Bradford, 1976) with a range of 2.5 to 40 µg/mL in a 96-well plate.
Add 5 µL of each BSA dilution in a 96-well plate (duplicates).
Add 5 µL of pure recombinant protein to a 96-well plate (duplicates).
Add 245 µL of Bradford reagent to each well and mix.
Incubate at RT for at least 5 min and for no more than 1 h (He, 2011).
Measure absorbance at 595 nm using a spectrophotometer.
Centrifuge pre- and post-induction aliquots at 16,100 × g and 4 °C for 20 min.
Discard the supernatant and add 400 µL of bind buffer to thoroughly resuspend the pellet.
Add 1 mg/mL lysozyme (8 μL of 50 mg/mL stock solution), 20 μg/mL DNase (4 μL of 2 mg/mL stock solution), 1% Triton-X 100 (20 µL of 20% stock solution), and 1 mM PMSF (4 μL of 0.1 M stock solution).
Incubate on an ice bath for 20 min to obtain a less viscous sample.
Sonicate pre- and post-induction lysates in an ultrasonic bath for 10 min.
Note: For small volumes, it is recommended to use an ultrasonic bath instead of the sonic dismembrator instrument (used to obtain the cell homogenate, step B.16).
Add 400 µL of bind buffer to the insoluble fraction after sonication (step A.16).
Prepare seven samples containing 50 µL to be analyzed by SDS-PAGE as follows:
Add 25 µL of each purification step sample (pre-induction, post-induction, insoluble fraction after sonication, soluble fraction after sonication, FT, and WB).
Add 15 µL of Milli-Q water.
Add 10 µL of TMR charge buffer 5×.
For pure recombinant protein, load 2 μg onto SDS-PAGE according to the Bradford method of protein quantification (include Milli-Q water up to 40 µL and add 10 µL TMR charging buffer 5×).
Denature the samples at 95 °C for 10 min in a block heater.
Load 10 µL of BenchMarkTM protein ladder and 25 µL of each sample on an SDS-PAGE gel (Figure 2), and apply 100 V for 90 min using an electrophoresis PowerpacTM basic power supply through an SDS-PAGE assembly in running buffer.
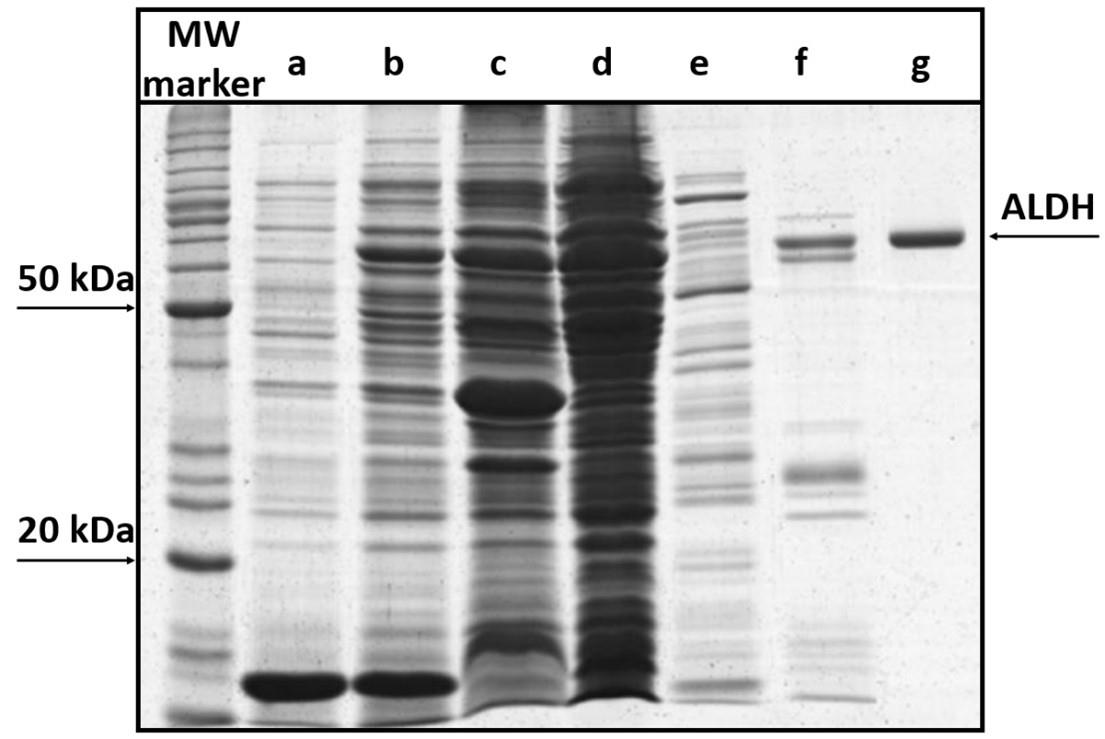
Figure 2. SDS-PAGE analysis of ALDH expression and purification steps. MW marker: BenchMarkTM protein ladder; a) soluble fraction before induction; b) soluble fraction after IPTG induction; c) insoluble fraction after sonication; d) soluble fraction after sonication; e) affinity chromatography flowthrough; f) weakly bound protein fraction; g) 2 μg peak P (protein of interest—the ALDH band is marked with an arrow and corresponds to approximately 60 kDa, that is 55 kDa corresponding to the ALDH subunit plus 5 kDa from the His tag).Stain the SDS-PAGE gel with 20 mL of Coomassie Blue in a staining vessel, at RT, with agitation for 20 min.
De-stain the SDS-PAGE gel O/N with 50 mL of de-stain solution at RT with agitation.
Enzymatic methodology for the determination of specific activity of ALDH
Determination of standard activity of ALDH1A1, ALDH1A2, and ALDH2 using hexanal as a substrate (Table 1)
Prepare three different enzyme dilutions from the corresponding enzyme stock solution in reaction buffer A (see Recipes) to reach a suitable activity for steady-state kinetics.
Note: It is essential to obtain a range of enzyme concentrations in which the substrate oxidation occurs under initial rate conditions.
Add 830 µL (805 µL for ALDH1A1 assay) of reaction buffer A into a 1 mL quartz cuvette.
Prepare an internal standard control containing 840 µL (815 µL for ALDH1A1 assay) of reaction buffer A.
Note: The internal standard control cuvette contains all compounds included in the assay mixture, except for enzyme.
Load 10 µL of each enzyme dilution in every single 1 mL quartz cuvette, except for the internal standard control cuvette.
Dilute NAD+ cofactor to 500 µM in reaction assay by adding 25 µL of 20 mM NAD+ stock.
Dilute NADH internal standard to 5 µM in reaction assay by adding 10 µL of NADH stock at 500 µM.
Note: The NADH internal standard is added to all cuvettes to establish a basal detection signal. Besides, in the internal standard control cuvette, 5 µM NADH enables the obtention of the absolute enzymatic rates from the units of relative fluorescence (see Data analysis section).
Mix by gentle inversion.
Start the reaction by adding 125 µL of 2 mM hexanal substrate stock solution into the cuvettes at a final saturating concentration of 250 µM (for ALDH1A1, add 150 µL of 0.2 mM hexanal substrate stock solution, and work at a final saturating concentration of 30 µM).
Note: The saturating concentration of hexanal is different for ALDH1A1 (30 µM) and for ALDH1A2 and ALDH2 (250 µM) (Pequerul et al., 2020).
Read the samples at excitation wavelength of 340 nm and collect the emission fluorescence at 460 nm for at least 600 s at 25 °C, using a Cary Eclipse fluorescence spectrometer.
Determination of standard activity of ALDH1A3 using hexanal as a substrate (Table 1)
Prepare three different enzyme dilutions from the corresponding enzyme stock solution in reaction buffer B (see Recipes) to reach a suitable activity for steady-state kinetics.
Add 830 µL of reaction buffer B into a 1 mL quartz cuvette.
Prepare an internal standard control containing 840 µL of reaction buffer B.
Load 10 µL of each enzyme dilution in every single 1 mL quartz cuvette, except for the internal standard control cuvette.
Dilute NAD+ cofactor to 500 µM in reaction assay by adding 25 µL of 20 mM NAD+ stock.
Dilute NADH internal standard to 5 µM in reaction assay by adding 10 µL of 500 µM NADH stock.
Mix by gentle inversion.
Start the reaction by adding 125 µL of 2 mM hexanal substrate stock solution into the cuvettes, at a final saturating concentration of 250 µM.
Read the samples at excitation wavelength of 340 nm and collect the emission fluorescence at 460 nm for at least 600 s at 25 °C, using a Cary Eclipse fluorescence spectrometer.
Determination of standard activity of ALDH3A1 using p-nitrobenzaldehyde as a substrate (Table 1)
Prepare three different enzyme dilutions from the corresponding enzyme stock solution in reaction buffer C (see Recipes) to reach a suitable activity for steady-state kinetics.
Add 830 µL of reaction buffer C into a 1 mL quartz cuvette.
Prepare an internal standard control containing 840 µL of reaction buffer C.
Load 10 µL of each enzyme dilution in every single 1 mL quartz cuvette, except for the internal standard control cuvette.
Dilute NADP+ cofactor to 1 mM in reaction assay by adding 25 µL of 40 mM NADP+ stock.
Dilute NADPH internal standard to 5 µM in reaction assay by adding 10 µL of 500 µM NADPH stock.
Mix by gentle inversion.
Start the reaction by adding 125 µL of 2 mM p-nitrobenzaldehyde substrate stock solution into the cuvettes, at a final saturating concentration of 250 µM.
Read the samples at an excitation wavelength of 340 nm and collect the emission fluorescence at 460 nm for at least 600 s at 25 °C, using a Cary Eclipse fluorescence spectrometer.
Table 1. Composition of the reaction mixture for the different ALDH enzymatic assays
Component ALDH1A1, 1A2, 2 ALDH1A3 ALDH3A1 Buffer 50 mM HEPES, pH 8 50 mM HEPES, pH 8 50 mM Tris/HCl, pH 8 Mg2+ − 30 mM − EDTA 0.5 mM − − DTT 0.5 mM 5 mM 5 mM NAD+ 0.5 mM 0.5 mM − NADP+ − − 1 mM NADH 5 µM 5 µM − NADPH − − 5 µM Substrate 30 µM hexanal for 1A1 250 µM hexanal for 1A2 and 2
250 µM hexanal 250 µM pnitrobenzaldehyde
Data analysis
Calculation of specific enzymatic activity in µmol/min·mg (U/mg) (Solobodowska et al., 2012)
Adjust the slope for reaction assay cuvettes and obtain the units of relative fluorescence (UF) corresponding to the internal standard control cuvette (5 µM NAD(P)H internal standard),
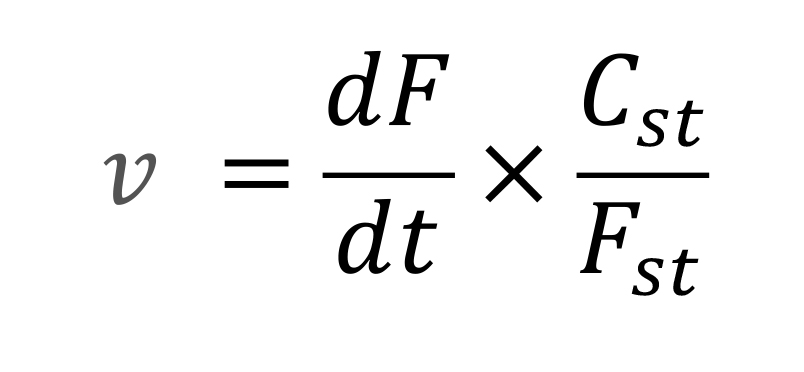
where dF/dt is the slope of the time dependent fluorescence, Cst is the NAD(P)H concentration, and Fst is the standard fluorescence.

Obtain the absolute rates in U/mg (Figure 3 and Table 2), according to eq. 1

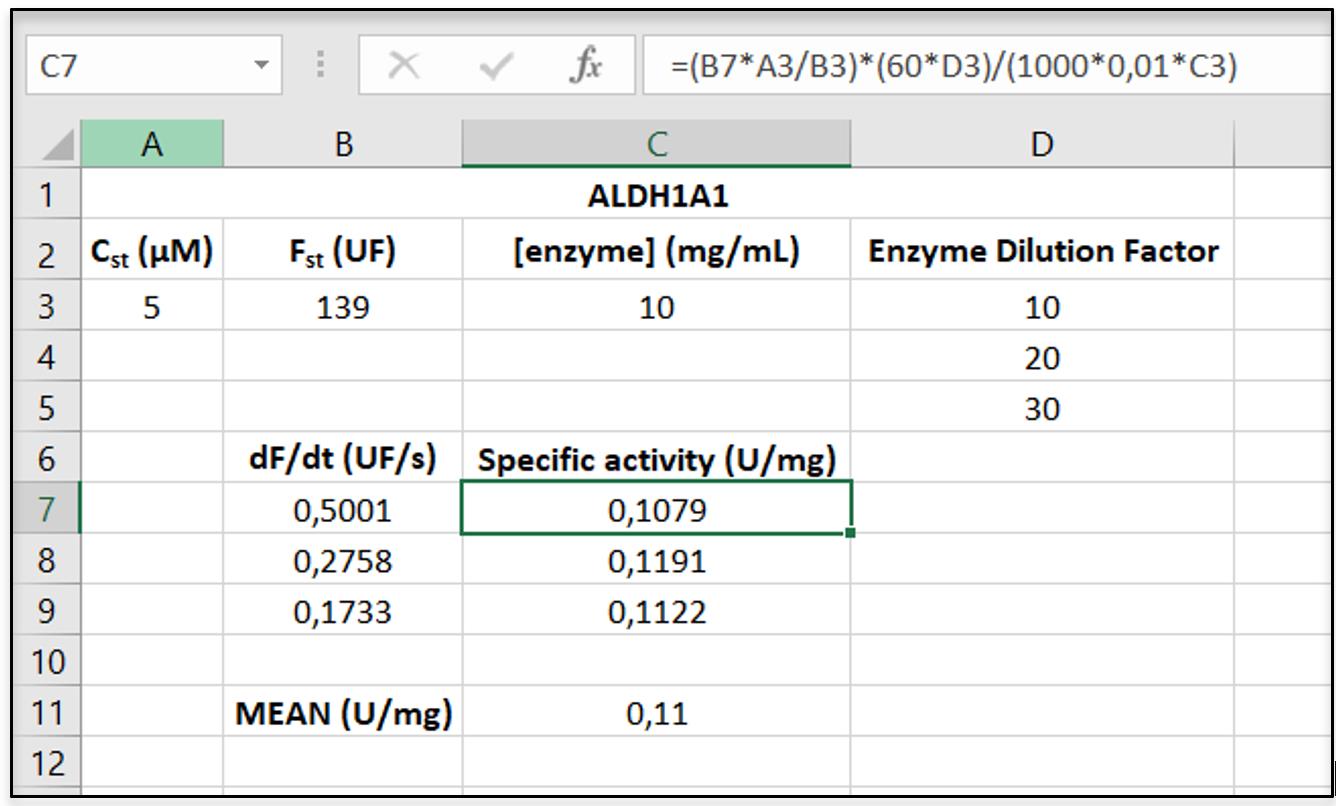
Figure 3. Screenshot of an Excel sheet showing representative raw data for the calculation of specific activity of ALDH1A1 using eq. 1.
Table 2. Specific activity (in U/mg) of ALDH1A1, ALDH1A2, ALDH1A3, ALDH2, and ALDH3A1
| ALDH1A1 | ALDH1A2 | ALDH1A3 | ALDH2 | ALDH3A1 |
| 0.11 | 1.08 | 0.35 | 0.48 | 3.21 |
Enzymatic activity was measured at 25 °C using a Cary Eclipse spectrometer. ALDH1A1, ALDH1A2, and ALDH2 were assayed in reaction buffer A. ALDH1A3 assays were performed in reaction buffer B. NAD+ concentration was 500 μM, and hexanal was used as a substrate at saturating concentration. ALDH3A1 experiments were measured in reaction buffer C. NADP+ concentration was 1 mM, and a saturating concentration of p-nitrobenzaldehyde was used as a substrate.
Notes
The human ALDH1A1, 1A2, 1A3, 2, and 3A1 isoforms have been recombinantly expressed in a heterologous system and purified in soluble and enzymatically stable active forms.
Among the three ALDH1A enzymes, ALDH1A1 showed the lowest specific activity (0.11 U/mg) at a saturating concentration of hexanal, while ALDH1A2 exhibited the highest (1.1 U/mg). ALDH1A3 and ALDH2 showed intermediate rates of 0.35 and 0.48 U/mg, respectively. The specific activity of ALDH3A1 using a saturating concentration of p-nitrobenzaldehyde was 3.21 U/mg, the highest activity measured among these five ALDH isoforms.
ALDH1A3 is the ALDH1A isoform most dependent on DTT. The enzyme activity decreases when DTT is removed from the reaction buffer. The specific activity is 4-fold higher when 5 mM DTT is added to ALDH1A3 reaction buffer. Consequently, the ALDH1A3 reaction buffer contains a DTT concentration 10-fold higher when compared to those of ALDH1A1 and ALDH1A2 reaction buffers.
Related to the reaction buffer composition, a quite distinct pattern was observed for each enzyme when the effect of magnesium ions was studied in the presence of hexanal as a substrate (Pequerul et al., 2020). The highest activity of ALDH1A3 is shown at 30 mM MgCl2; thus, this Mg2+ concentration is present in the ALDH1A3 reaction buffer. In contrast, the chelating agent EDTA is included in the reaction buffer of ALDH1A1, ALDH1A2, and ALDH2.
It is essential to use a range of concentrations of active enzyme in which the substrate oxidation occurs under initial rate conditions (see step D1a).
The internal standard control cuvette contains all compounds included in the assay mixture except for enzyme (see step D1c).
The NADH internal standard is added to all cuvettes to establish a basal detection signal. Additionally, in the internal standard control cuvette, 5 µM NADH enables us to obtain the absolute enzymatic rates from the units of relative fluorescence (see step D1f).
The saturating concentration of hexanal is different for ALDH1A1 (30 µM) and for ALDH1A2 and ALDH2 (250 µM) (see step D1h).
Routinely, the N-terminal (His)6 tag is not removed after the affinity purification step, and it is kept for subsequent biochemical and structural studies. The N-terminal extension is located in the external part of the monomer structure and does not affect the stability, the oligomerization state, or the enzymatic activity of ALDHs (Pequerul et al., 2020; Castellví et al., 2022).
Summary of the statement
The protocol includes a method of recombinant protein production and affinity purification under reducing conditions that have been applied to ALDH family 1 and 3 isoforms to produce high yields of pure, soluble, stable, and catalytically active protein (10–30 mg/L of culture). It also includes their respective enzymatic activity assays, optimized and based on the fluorescence emission of NAD(P)H at 460 nm, using hexanal (for ALDH1A1, 1A2, 1A3, and 2) or pnitrobenzaldehyde (for ALDH3A1) as a substrate. The methodology is suitable for protein crystallography, and for the identification and characterization of substrates and inhibitors with diagnostic and therapeutic potential in the treatment of cancer and other diseases.
The urgent need for robust protocols to study ALDHs is well supported by the increasing interest of the scientific community in ALDH isoforms as cancer biomarkers, with more than 700 indexed publications only in the last five years (data extracted from the PubMed database, using as search terms ALDH and cancer). In addition, fluorogenic ALDH substrates combined with the pan-inhibitor N,N’-diethylaminobenzaldehyde (e.g., AldefluorTM assay) are widely used to identify ALDH isoforms in cancer stem cells. This is often a misleading factor that draws incorrect conclusions about the identity of particular ALDH isoforms, thus warranting the search for more selective inhibitors to improve the assay accuracy (Zhou et al., 2019, Ibrahim et al., 2022). Finally, despite the suitability of ALDH isoforms as drug targets for cancer therapy, there is a lack of potent and selective enzyme inhibitors to be developed for in vivo administration and translated to the clinical context. Our manuscript makes a step forward to establish and disseminate a fully optimized and validated protocol for ALDHs.
Recipes
LB culture medium
Dilute 10 g of tryptone, 10 g of NaCl, and 5 g of yeast extract in 1 L of Milli-Q water. Adjust pH to 7.0 using NaOH.
2× YT culture medium
Dilute 16 g of tryptone, 5 g of NaCl, and 10 g of yeast extract in 1 L of Milli-Q water. Adjust pH to 7.0 using NaOH.
Bind buffer
Dilute 0.34 g of imidazole (5 mM), 29.22 g of NaCl (0.5 M), and 2.4 g of Tris (20 mM) in 1 L of Milli-Q water. Adjust pH to 8.0 using HCl.
Elution buffer
Dilute 13.61 g of imidazole (1 M), 5.8 g of NaCl (0.5 M), and 0.48 g of Tris (20 mM) in 200 mL of Milli-Q water. Adjust pH to 8.0 using HCl.
Equilibration buffer
Dilute 29.22 g of NaCl (0.5 M) and 2.4 g of Tris (20 mM) in 1 L of Milli-Q water. Adjust pH to 8.0 using HCl.
5× TMR charging buffer
Dilute 8.55 g of sucrose (0.5 M), 5 g of SDS (10%), 1.89 g of Tris (312.5 mM), 0.14 g of EDTA (10 mM), and 1.92 g of DTT (250 mM) in 50 mL of Milli-Q water. Adjust pH to 6.9 and add 25 mg bromophenol blue.
Running buffer
Dilute 30.2 g of Tris (250 mM), 10 g of SDS (10%), and 140.3 g of glycine (1.87 M) in 1 L of Milli-Q water. Do not adjust pH.
Coomassie Blue colorant
Dilute 2.5 g/L Coomassie Brilliant Blue R 250 in 45% Milli-Q water, 45% MetOH, and 10% acetic acid.
De-stain solution
Prepare 60 mL of Milli-Q water, 30 mL of MetOH, and 10 mL of acetic acid.
Reaction buffer A (for ALDH1A1, ALDH1A2, and ALDH2 activity assays)
Dilute 11.92 g of HEPES (50 mM), 0.19 g of EDTA (0.5 mM), and 0.077 g of DTT (0.5 mM) in 1 L of Milli-Q water. Adjust pH to 8.0.
Reaction buffer B (for ALDH1A3 activity assays)
Dilute 11.92 g of HEPES (50 mM), 6.1 g of MgCl2 (30 mM), and 0.77 g of DTT (5 mM) in 1 L of Milli-Q water. Adjust pH to 8.0.
Reaction buffer C (for ALDH3A1 activity assays)
Dilute 6.06 g of Tris (50 mM) and 0.77 g of DTT (5 mM) in 1 L of Milli-Q water. Adjust pH to 8.0 using HCl.
20 mM NAD+ stock solution
Dilute 0.014 g of NAD+ in 1 mL of the corresponding reaction buffer.
500 µM NADH stock solution
Dilute a small amount of NADH (approximately a spatula tip) in 1 mL of the corresponding reaction buffer and measure the absorbance using a spectrophotometer. Calculate the concentration by the Lambert-Beer equation (Abs = ϵ·c·l), where ϵ is the molar absorptivity of NADH (6.22 mM−1·cm−1), c is the concentration of NADH, and l is the path length of the cuvette. For baseline, add 995 µL of the corresponding buffer in a 1 mL quartz cuvette and establish the zero. Then, add 5 µL of NADH stock and mix by inversion. Set up the spectrophotometer to scan the sample and obtain the absorbance of NADH at 340 nm. Obtain the stock concentration of NADH and prepare a work solution of 500 µM NADH in a 1 mL final volume (C1·V1 = C2·V2).
40 mM NADP+ stock solution
Dilute 0.014 g in 1 mL of reaction buffer C.
500 µM NADPH stock solution
Prepare an NADPH stock solution in reaction buffer C, as it was explained for 500 µM NADH stock solution (see Recipe 14).
2 mM Hexanal
Dilute 9.84 µL of hexanal in 40 mL of the corresponding reaction buffer.
2 mM p-nitrobenzaldehyde
Dilute 0.012 g p-nitrobenzaldehyde in 40 mL of reaction buffer C.
Acknowledgments
This research was funded by the Spanish Ministerio de Ciencia e Innovación (Agencia Estatal de Investigación, grant number PID2020-119424RB-I00 / AEI / 10.13039/501100011033). Raquel Pequerul obtained financial support from the company Advanced BioDesign through a research contract agreement with Universitat Autònoma de Barcelona.
Competing interests
The authors declare that there are no competing interests.
References
- Bradford, M. M. (1976). A rapid and sensitive method for the quantitation of microgram quantities of protein utilizing the principle of protein-dye binding. Anal Biochem 72: 248-254.
- Castellví, A., Pequerul, R., Barracco, V., Juanhuix, J., Parés, X. and Farrés, J. (2022). Structural and biochemical evidence that ATP inhibits the cancer biomarker human aldehyde dehydrogenase 1A3. Commun Biol 5(1): 354.
- Duan, J. J., Cai, J., Guo, Y. F., Bian, X. W. and Yu, S. C. (2016). ALDH1A3, a metabolic target for cancer diagnosis and therapy. Int J Cancer 139(5): 965-975.
- Feng, J., Qiu, Q., Khanna, A., Todd, N. W., Deepak, J., Xing, L., Wang, H., Liu, Z., Su, Y., Stass, S. A., et al. (2009). Aldehyde dehydrogenase 1 is a tumor stem cell-associated marker in lung cancer. Mol Cancer Res 7(3): 330-338.
- Greco, N., Schott, T., Mu, X., Rothenberg, A., Voigt, C., McGough, R. L., 3rd, Goodman, M., Huard, J. and Weiss, K. R. (2014). ALDH Activity Correlates with Metastatic Potential in Primary Sarcomas of Bone. J Cancer Ther 5(4): 331-338.
- He, F. (2011). Bradford Protein Assay. Bio-101: e45.
- Ibrahim, A. I. M., Ikhmais, B., Batlle, E., AbuHarb, W. K., Jha, V., Jaradat, K. T., Jimenez, R., Pequerul, R., Pares, X., Farres, J., et al. (2021). Design, Synthesis, Biological Evaluation and In Silico Study of Benzyloxybenzaldehyde Derivatives as Selective ALDH1A3 Inhibitors. Molecules 26(19).
- Ibrahim, A. I. M., Batlle, E., Sneha, S., Jimenez, R., Pequerul, R., Pares, X., Rungeler, T., Jha, V., Tuccinardi, T., Sadiq, M., et al. (2022). Expansion of the 4-(Diethylamino)benzaldehyde Scaffold to Explore the Impact on Aldehyde Dehydrogenase Activity and Antiproliferative Activity in Prostate Cancer. J Med Chem 65(5): 3833-3848.
- Iturbide, A., Ruiz Tejeda Segura, M. L., Noll, C., Schorpp, K., Rothenaigner, I., Ruiz-Morales, E. R., Lubatti, G., Agami, A., Hadian, K., Scialdone, A., et al. (2021).Retinoic acid signaling is critical during the totipotency window in early mammalian development. Nat Struct Mol Biol 28(6): 521-532.
- Janfaza, S., Banan Nojavani, M., Nikkhah, M., Alizadeh, T., Esfandiar, A. and Ganjali, M. R. (2019). A selective chemiresistive sensor for the cancer-related volatile organic compound hexanal by using molecularly imprinted polymers and multiwalled carbon nanotubes. Microchim Acta 186(3): 137.
- Jiménez, R., Pequerul, R., Amor, A., Lorenzo, J., Metwally, K., Aviles, F. X., Pares, X. and Farres, J. (2019). Inhibitors of aldehyde dehydrogenases of the 1A subfamily as putative anticancer agents: Kinetic characterization and effect on human cancer cells. Chem Biol Interact 306: 123-130.
- Klyosov, A. A., Rashkovetsky, L. G., Tahir, M. K. and Keung, W. M. (1996). Possible role of liver cytosolic and mitochondrial aldehyde dehydrogenases in acetaldehyde metabolism. Biochemistry 35(14): 4445-4456.
- Koppaka, V., Thompson, D. C., Chen, Y., Ellermann, M., Nicolaou, K. C., Juvonen, R. O., Petersen, D., Deitrich, R. A., Hurley, T. D. and Vasiliou, V. (2012). Aldehyde dehydrogenase inhibitors: a comprehensive review of the pharmacology, mechanism of action, substrate specificity, and clinical application. Pharmacol Rev 64(3): 520-539.
- Laskar, A. and Younus, H. (2019). Aldehyde toxicity and metabolism: the role of aldehyde dehydrogenases in detoxification, drug resistance and carcinogenesis. Drug Metab Rev 51(1):42-64.
- Li, Z., Xiang, Y., Xiang, L., Xiao, Y., Li, F. and Hao, P. (2014). ALDH maintains the stemness of lung adenoma stem cells by suppressing the Notch/CDK2/CCNE pathway. PLoS One 9(3): e92669.
- Marchitti, S. A., Brocker, C., Stagos, D. and Vasiliou, V. (2008). Non-P450 aldehyde oxidizing enzymes: the aldehyde dehydrogenase superfamily. Expert Opin Drug Metab Toxicol 4(6): 697-720.
- Muto, M., Hitomi, Y., Ohtsu, A., Ebihara, S., Yoshida, S. and Esumi, H. (2000). Association of aldehyde dehydrogenase 2 gene polymorphism with multiple oesophageal dysplasia in head and neck cancer patients. Gut 47(2): 256-261.
- Pequerul, R., Vera, J., Gimenez-Dejoz, J., Crespo, I., Coines, J., Porte, S., Rovira, C., Pares, X. and Farres, J. (2020). Structural and kinetic features of aldehyde dehydrogenase 1A (ALDH1A) subfamily members, cancer stem cell markers active in retinoic acid biosynthesis. Arch Biochem Biophys 681: 108256.
- Rebollido-Rios, R., Venton, G., Sanchez-Redondo, S., Iglesias, I. F. C., Fournet, G., Gonzalez, E., Romero Fernandez, W., Borroto Escuela, D. O., Di Stefano, B., Penarroche-Diaz, R., et al. (2020). Dual disruption of aldehyde dehydrogenases 1 and 3 promotes functional changes in the glutathione redox system and enhances chemosensitivity in nonsmall cell lung cancer. Oncogene 39(13): 2756-2771.
- Singh, S., Brocker, C., Koppaka, V., Chen, Y., Jackson, B. C., Matsumoto, A., Thompson, D. C. and Vasiliou, V. (2013). Aldehyde dehydrogenases in cellular responses to oxidative/electrophilic stress. Free Radic Biol Med 56: 89-101.
- Solobodowska, S., Giebultowicz, J., Wolinowska, R. and Wroczynski, P. (2012). Contribution of ALDH1A1 isozyme to detoxification of aldehydes present in food products. Acta Pol Pharm 69(6): 1380-1383.
- Vasiliou, V., Thompson, D. C., Smith, C., Fujita, M. and Chen, Y. (2013). Aldehyde dehydrogenases: from eye crystallins to metabolic disease and cancer stem cells. Chem Biol Interact 202(1-3): 2-10.
- Yokoyama, A., Muramatsu, T., Omori, T., Yokoyama, T., Matsushita, S., Higuchi, S., Maruyama, K. and Ishii, H. (2001). Alcohol and aldehyde dehydrogenase gene polymorphisms and oropharyngolaryngeal, esophageal and stomach cancers in Japanese alcoholics. Carcinogenesis 22(3): 433-439.
- Zhou, L., Sheng, D., Wang, D., Ma, W., Deng, Q., Deng, L. and Liu, S. (2019). Identification of cancer-type specific expression patterns for active aldehyde dehydrogenase (ALDH) isoforms in ALDEFLUOR assay. Cell Biol Toxicol 35(2): 161-177.
Article Information
Copyright
© 2022 The Authors; exclusive licensee Bio-protocol LLC.
How to cite
Pequerul, R., Porté, S., Parés, X., Pérez-Alea, M. and Farrés, J. (2022). Production, Purification, and Fluorometric Activity Assay of Human Aldehyde Dehydrogenases. Bio-protocol 12(17): e4505. DOI: 10.21769/BioProtoc.4505.
Category
Biochemistry > Protein > Activity
Do you have any questions about this protocol?
Post your question to gather feedback from the community. We will also invite the authors of this article to respond.