
- Home
- Protocols

-

Assay protocols
Last updated date: Nov 5, 2020 Views: 1266 Forks: 0
Drug sensitivity assays
- 100 μL of culture media (HMI-9 +10% FBS for Trypanosoma brucei) was added to all wells of an opaque 96-well plate except the first well of rows A, C, E and G (Figure 1a).
- 200 μL of a test compound or control drug (typically at 200 µM, i.e. double the final concentration) was added to each of the empty wells A1, C1, E1 and G1 (Figure 1b).
- Drugs were serially diluted in 100 μL of complete HMI-9 media across two rows of the plate, by transferring 100 µL well-to-well, starting with 100 µL from A1 to A2 and mixing thoroughly by pipetting up-and-down at least 5 times in the receiving well before taking 100 µL to the next well (Figure 1c). From the 23rd well, 100 µL is discarded instead of passed on to the last well (B1 for the first serial dilution), leaving a control well with only culture media.
- 100 mL of cell suspension, at a density of a 2×10⁵ cells/mL, was added to each well (resulting in a final volume of 200 mL per well), to give a final cell density 1×10⁵ cells/mL in each well.
- The plate was then incubated for exactly 48 h at 37 °C in an atmosphere containing 5% CO2. The incubator should have a tray of water to provide humidity, preventing excessive evaporation from the wells at the edge of the plate. [Note: different cell types may require different densities, temperatures and/or incubation times for optimal reproducibility]
- 20 µL of a sterile solution of 5 mM resazurin sodium salt (Sigma-Aldrich, Gillingham, UK) in PBS (pH 7.4) was added to all wells.
- The plate was incubated for a further 24 h under the same conditions as before.
- Fluorescence output was measured based on a FLUOstar Optima plate reader (BMG Labtech) at an excitation/emission wavelength of 544/590 nm. [Note: other fluorimeter plate readers will do equally well, the signal is strong and does not require particularly high sensitivity]
- EC50 values were obtained by fitting to sigmoidal dose response curve of fluorescence against 10Log(test compound concentration, M), using Prism 7.04 software (GraphPad). It is important to choose an equation with a variable slope as different drugs can give very different dose-response curves. Extrapolation from incomplete graphs may be possible on a case-by- case basis if substantially more than half the curve is obtained and the bottom value is fixed at the level of complete cell death obtained by the (known positive control.
- Experiments were performed in at least three independent biological replicates on different days, with different starter cultures.
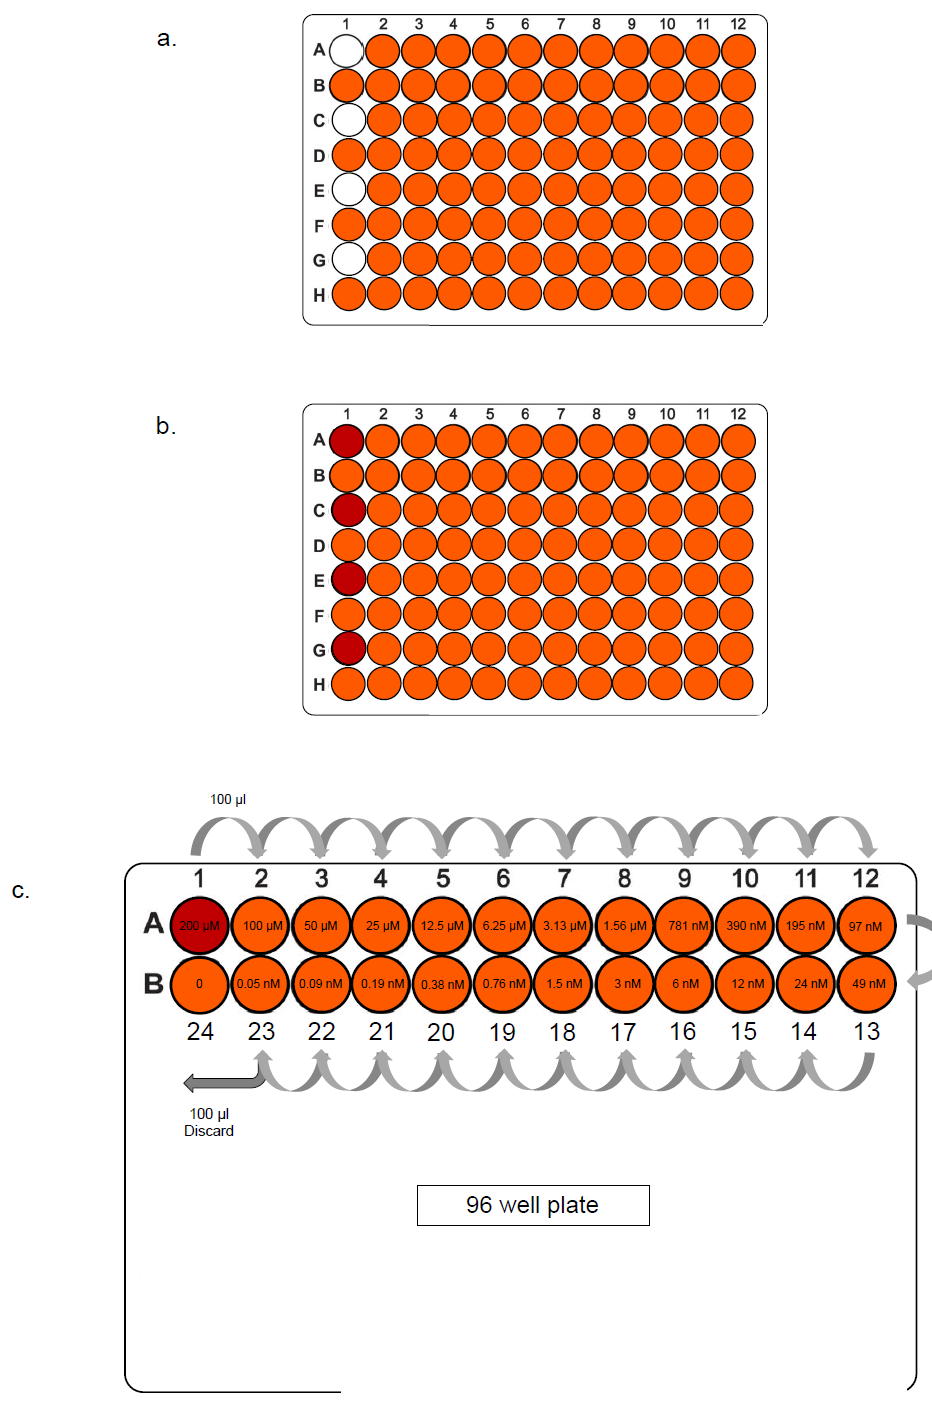
Figure 1. Preparation of two-fold serial dilutions of drugs. Two rows of a white-96 well plate are shown to demonstrate. (a) 100 μl culture media was added to all wells highlighted in orange. (b) 100 μl of drug in the same media (at 200 µM) was added to the first well of the top row, highlighted in red. (c) 100 μl of which was then added to the next well. The transfer of 100 μl in each well was continued to half the drug concentration. From the penultimate well, 100 μl was discarded, leaving a control well (24) with only culture media. The same was done for serial dilution in rows C/D, E/F and G/H.
Uptake assay using radiolabelled substrate
- Cultures at the mid-log phase (with expression of a construct induced by 1 μg/ml of tetracycline for 24 h prior to the assay when necessary) were centrifuged for 10 min at 2,500 rpm in a standard table-top centrifuge.
- Following centrifugation, cells were washed twice in a defined assay buffer (AB) (33 mM HEPES, 98 mM NaCl, 4.6 mM KCl, 0.55 mM CaCl2, 0.07 mM MgSO4, 5.8 mM NaH2PO4, 0.3 mM MgCl2, 23 mM NaHCO3, 14 mM glucose, pH 7.3) .
- Supernatants were discarded, and the final cell pellet was resuspended at a density of 108 cells/ml in AB, and left to recover from centrifugation stress at room temperature for 30 min.
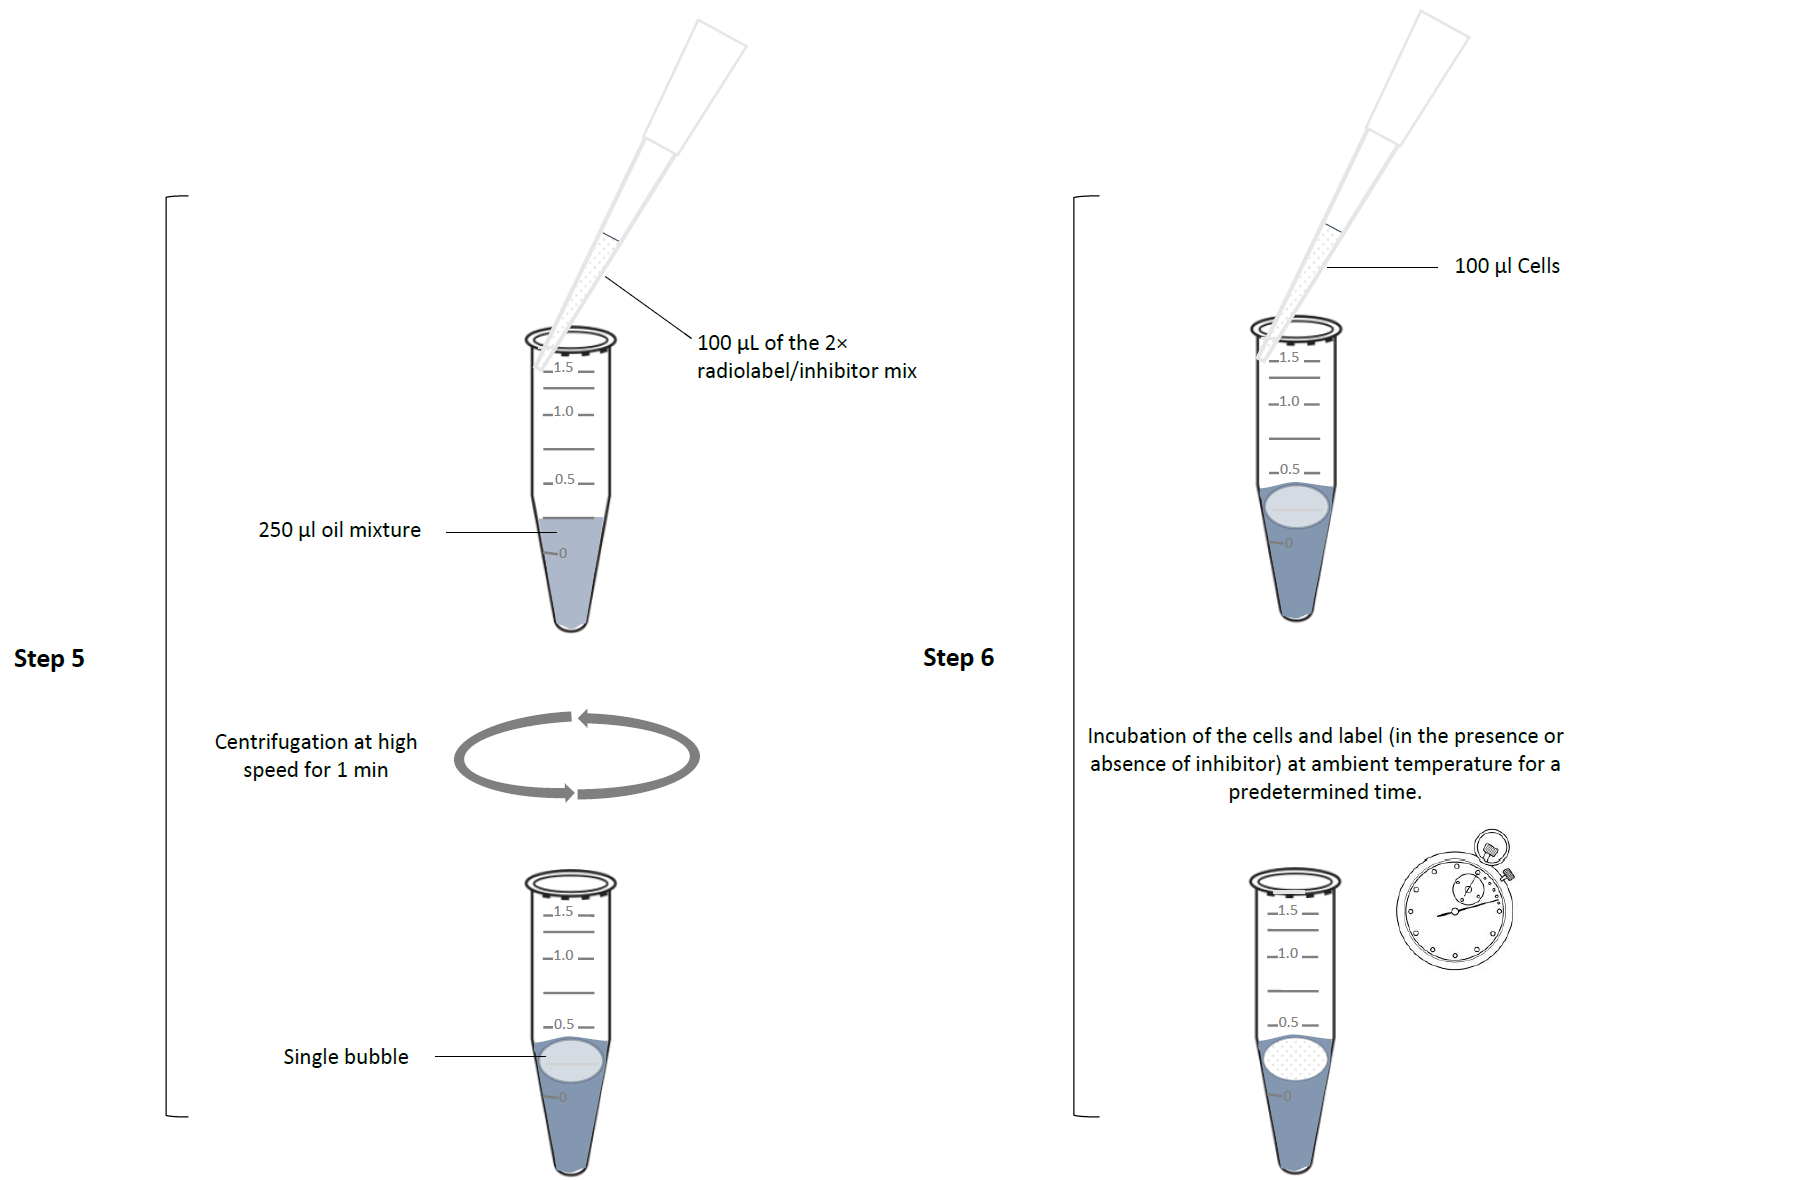
- Radiolabelled substrate was prepared in AB at 4× the final concentration and aliquots were mixed with the same volume of appropriate concentrations (depending on IC50 values) of competitive inhibitor, also in AB. This creates separate mixtures of inhibitor (different concentrations) and radiolabel (exact same concentration always) at 2× the final concentration. In cases where no test compound was to be added, AB was added instead; this included zero- inhibitor controls in every competition assay, and assays where radiolabel was monitored over time as the variable, rather than an inhibitor (time courses).
- 100 µL of the 2× radiolabel/inhibitor mix was carefully layered over 250 μl of an oil mixture (1:7 mineral oil and di-n-butyl phthalate; Sigma-Aldrich) in a 1.5- mL microfuge tube. Care must be taken that the label solution does not disperse as multiple bubbles slightly suspended in the oil layer. It is recommended to briefly centrifuge each tube with oil-and-label at high speed in a microfuge to make sure that the label is gathered as a layer on top of the oil, or at most as a single bubble only very slightly suspended within the oil.
- Uptake was initiated by adding 100 µL of the cell suspension to the microfuge tube with label over oil, taking care that the cells mix well with the radio label, i.e. form a single layer or bubble on top of the oil. For this, hold the pipet at an angle (~30º) against the side of the microfuge tube and squeeze out the entire 100 µL volume in one firm, but not overly strong, push. The addition should be timed perfectly using a stopwatch, as the incubation times are typically short and reproducibility depends on the exact timing. This starts an incubation of the cells and label (in the presence or absence of inhibitor) at ambient temperature for a predetermined time. It is possible to perform the incubation at a different temperature if needed, but we have rarely found this necessary. If required, it would easiest to do this in a temperature-controlled room; alternatively, the cells can be incubated in a temperature-controlled water bath and mixed with radiolabel kept at the same temperature.
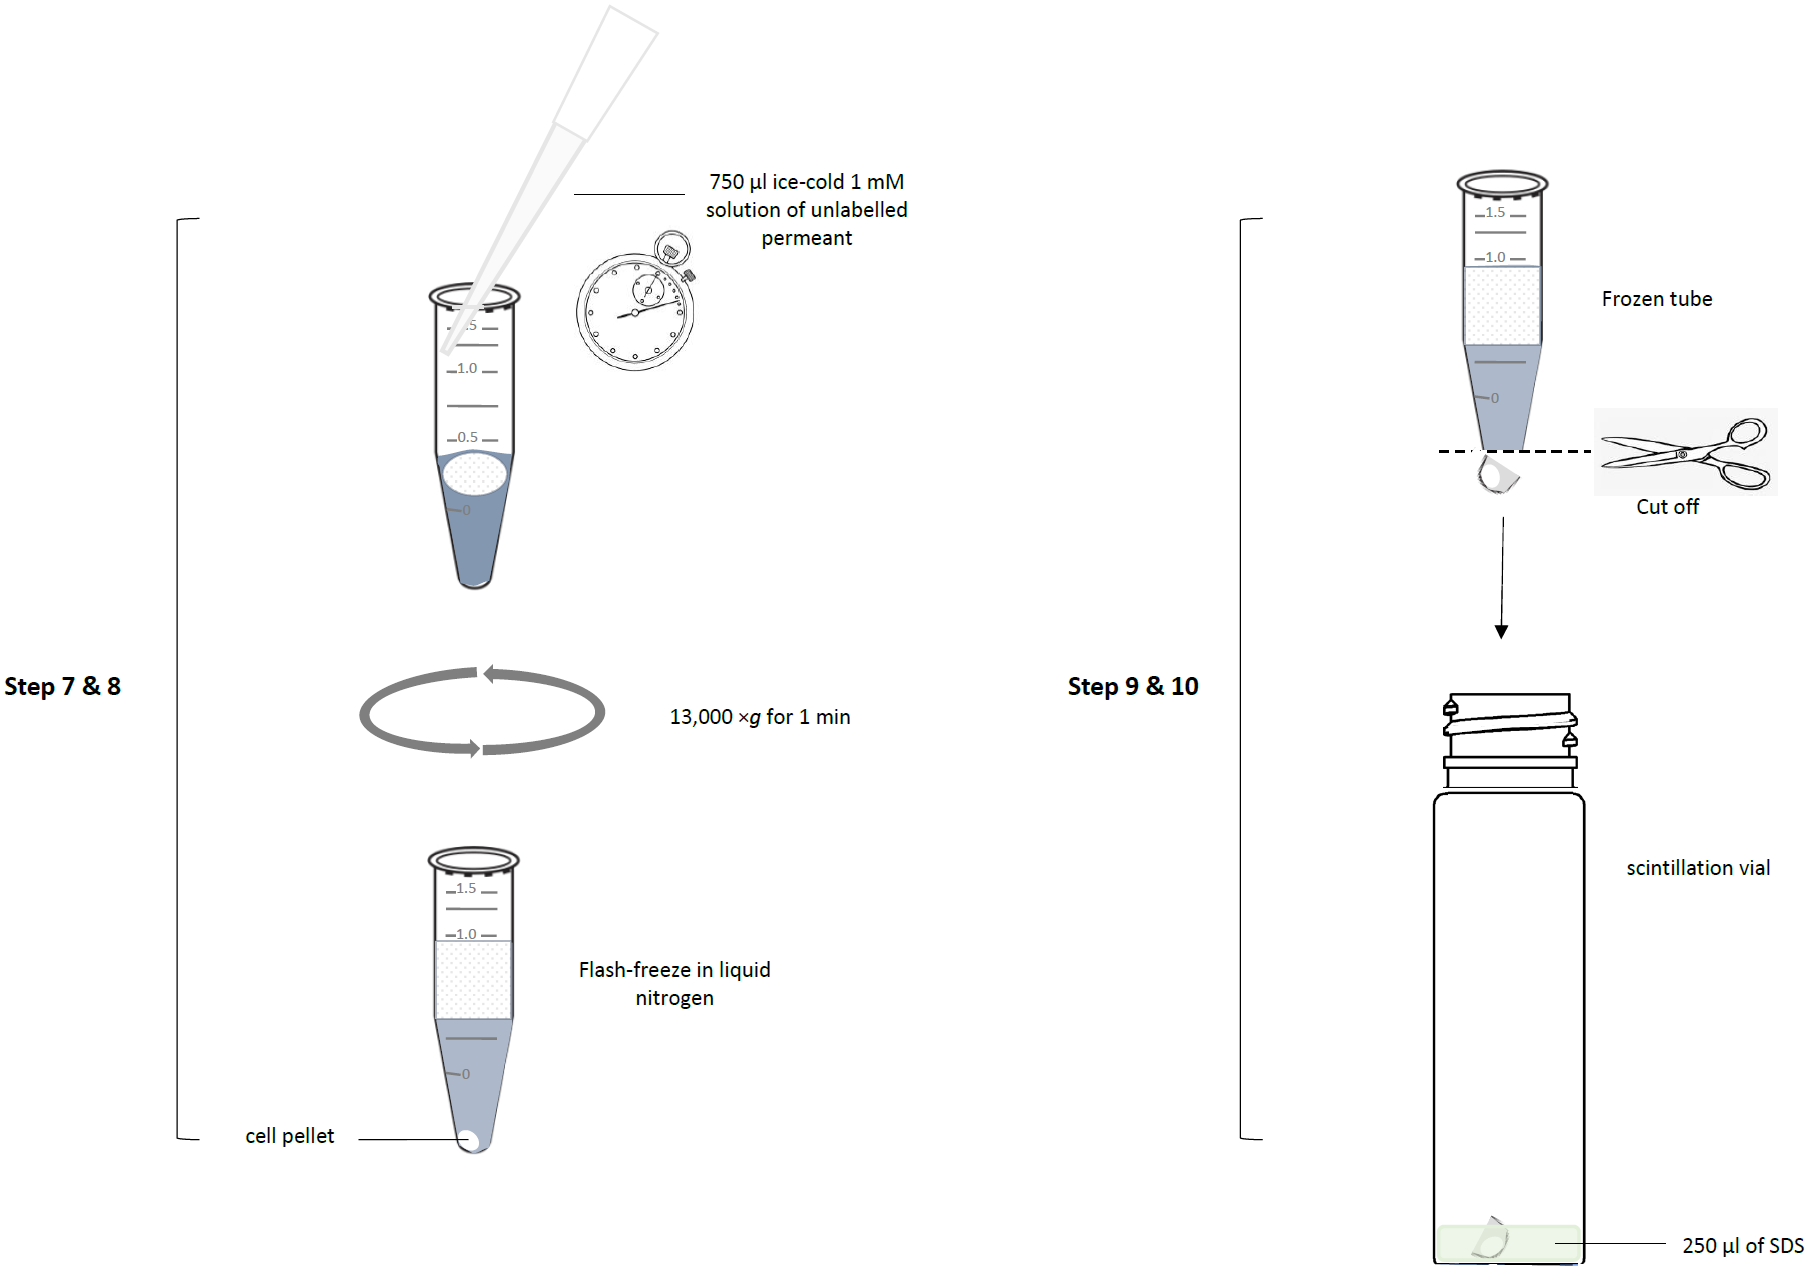
- The reaction was stopped at the exact time (stopwatch) by the addition of 750 μl of an ice-cold 1 mM solution of unlabelled permeant. This stops the uptake by (1) drastically lowering the temperature; (2) saturating the transporter with unlabelled substrate, vastly outcompeting the radiolabel, which we typically use at concentrations below 0.25 µM; and (3) by dilution, reducing the radiolabel concentration.
- The tubes were centrifuged though the oil layer at 13,000 ×g for 1 min in a microfuge, separating the cells from the aqueous buffer with substrate not yet taken up. It creates a cell pellet under the oil layer. To save time between adding the ice-cold permeant solution (‘stop solution’) and the centrifugation step the microfuge tubes are usually already placed in the microfuge when the stop solution is added and the lids of the microfuge tubes have been cut off prior to the experiment. Thus, the lid of the microfuge can be quickly closed after addition of stop solution, immediately followed by the centrifugation. The centrifugation collects the cells under the oil layer, thereby separating them from the radiolabel not yet taken up, left behind in the aqueous layer over the oil.
- After thus processing all the tubes (samples) in the experiment (which is always performed in triplicate, at a minimum), the tubes were placed in liquid nitrogen for flash freezing; the bottom of the frozen tubes, containing the cell pellet, was cut off with a tube clipper and collected in a scintillation vial. The rest is discarded as radioactive waste.
- To each scintillation vial, 250 µL of 2% sodium dodecyl sulphate (SDS) in water was added.
- The scintillation vials with cell pellets and SDS were left at room temperature with shaking (50 rpm) for at least 30 min to solubilise the pellets.
- A volume of 3 ml scintillation fluid (Optiphase HiSafe III) was added to each vial, and the vials were then incubated overnight at room temperature, preferably in a dark place. The next day, the vials were shaken vigorously, and then allowed to stand in the dark for at least 30 minutes. Radioactivity was determined by liquid scintillation counting in a Beckman LS6000 TA scintillation counter.
- It is inevitable that a small amount of extracellular radiolabel, some of it bound non-specifically to the cell surface, migrates with the cells through the oil layer, elevating background. This trapped extracellular radioactivity was determined as the amount of radiolabel associated with the cell pellet in the presence of 1 mM permeant (i.e. saturation of all high affinity transport activities), and subtracted from all other experimental samples. 10 µL samples of the 4× radiolabel solution (known concentration of radio-permeant) were also counted to allow the conversion of dpm to pmol substrate taken up.
- Saturation data, inhibition data, and time courses were plotted to equations for linear or non-linear regression (hyperbolic or sigmoid curves as appropriate) using Prism (GraphPad) software. When using sigmoid curves, use an equation with variable slope, as the Hill slope is informative, especially if more than 1 transporter for the substrate could be present in the cells used. The sigmoid curve should yield an IC50 value for the inhibitor used (50% effective concentration).
- The Ki (Inhibition constant) was calculated using the Cheng- Prusoff equation: Ki = IC50/[1+(L/Km)], where L is the permeant concentration (Cheng and Prusoff, 1973). The Gibbs free energy of interaction for an inhibitor (ΔG0) was calculated using: ΔG0= –RTln(Ki), in which R is the gas constant and T the absolute temperature. These equations are only valid in the event of competitive inhibition.
All experiments were performed in at least triplicate and on at least three independent occasions.
- Alghamdi, A H and De Koning, H P(2020). Assay protocols. Bio-protocol Preprint. bio-protocol.org/prep605.
- Alghamdi, A. H., Munday, J. C., Campagnaro, G. D., Gurvic, D., Svensson, F., Okpara, C. E., Kumar, A., Quintana, J., Martin Abril, M. E., Milić, P., Watson, L., Paape, D., Settimo, L., Dimitriou, A., Wielinska, J., Smart, G., Anderson, L. F., Woodley, C. M., Kelly, S. P. Y., Ibrahim, H. M., Hulpia, F., Al-Salabi, M. I., Eze, A. A., Sprenger, T., Teka, I. A., Gudin, S., Weyand, S., Field, M., Dardonville, C., Tidwell, R. R., Carrington, M., O'Neill, P., Boykin, D. W., Zachariae, U. and De Koning, H. P.(2020). Positively selected modifications in the pore of TbAQP2 allow pentamidine to enter Trypanosoma brucei. eLife. DOI: 10.7554/eLife.56416
Category
Do you have any questions about this protocol?
Post your question to gather feedback from the community. We will also invite the authors of this article to respond.