
- Protocols

- About
-


Multi-channel STED super-resolution imaging for studying extracellular vesicle release

Last updated date: Oct 12, 2026 DOI: 10.21769/p3009 Views: 75 Forks: 0

 Download PDF
 Ask a
question
Ask a
question
 How to
cite
How to
cite
 Favorite


Abstract
Exosomes are a subtype of extracellular vesicles (EVs), that originate from the endosomal pathway, making the endo-lysosomal compartment a central regulator of their biogenesis. Detailed characterization of EV interactions with intracellular particles therefore requires imaging below the diffraction limit of conventional light microscopy. Various techniques, including confocal microscopy, electron microscopy and flow cytometry, have been employed to study intracellular particles and EVs. However, these methods are often limited by insufficient spatial resolution, restricted molecular specificity or complex sample preparation requirements.
Here, we present a protocol for the visualization of cells, their intracellular particles and the released EVs in their microenvironment using stimulated emission depletion (STED) microscopy. The protocol includes in situ fixation and fluorescent labeling methods, sample preparation, image acquisition and analysis optimized for STED microscopy. Furthermore, it provides guidance for minimizing imaging artefacts, and ensuring reliable image quality. The protocol enables high-resolution examination of intracellular particle trafficking events and spatial relationships between intracellular particles and EVs.
The presented protocol offers improved resolution compared with conventional fluorescence microscopy, allowing reliable visualization of nanoscale particles, including intracellular particles and EVs. Combining molecular specificity with super-resolution imaging, STED microscopy provides a robust approach for investigating the endo-lysosomal compartment and its role in EV biogenesis and release.
Key features
- Optimized immunocytochemical labeling protocol for STED and confocal microscopy for investigating in situ fixed cells and their environment.
- Preserves cells together with EV structures in their immediate microenvironment, avoiding EV isolation before imaging.
- Combines confocal detection of membrane-associated Palm-GFP with two-channel STED imaging of immunolabeled vesicular structures.
- Enables nanoscale assessment of the spatial relationship between conventional EV-associated markers and autophagy-associated markers.
Keywords: stimulated emission depletion, super-resolution microscopy, intracellular particles, extracellular vesicles, immunocytochemistry
This protocol is used in: eLife (2025), DOI: 10.7554/eLife.95828.3
Tamás Visnovitz, Dorina Lenzinger, Anna Koncz, Péter M Vizi, Tünde Bárkai, Krisztina V Vukman, Alicia Galinsoga, Krisztina Németh, Kelsey Fletcher, Zsolt I Komlósi, Csaba Cserép, Ádám Dénes, Péter Lőrincz, Gábor Valcz, Edit I Buzas (2025) A ‘torn bag mechanism’ of small extracellular vesicle release via limiting membrane rupture of en bloc released amphisomes (amphiectosomes) eLife 13:RP95828. https://doi.org/10.7554/eLife.95828.3
Graphical overview
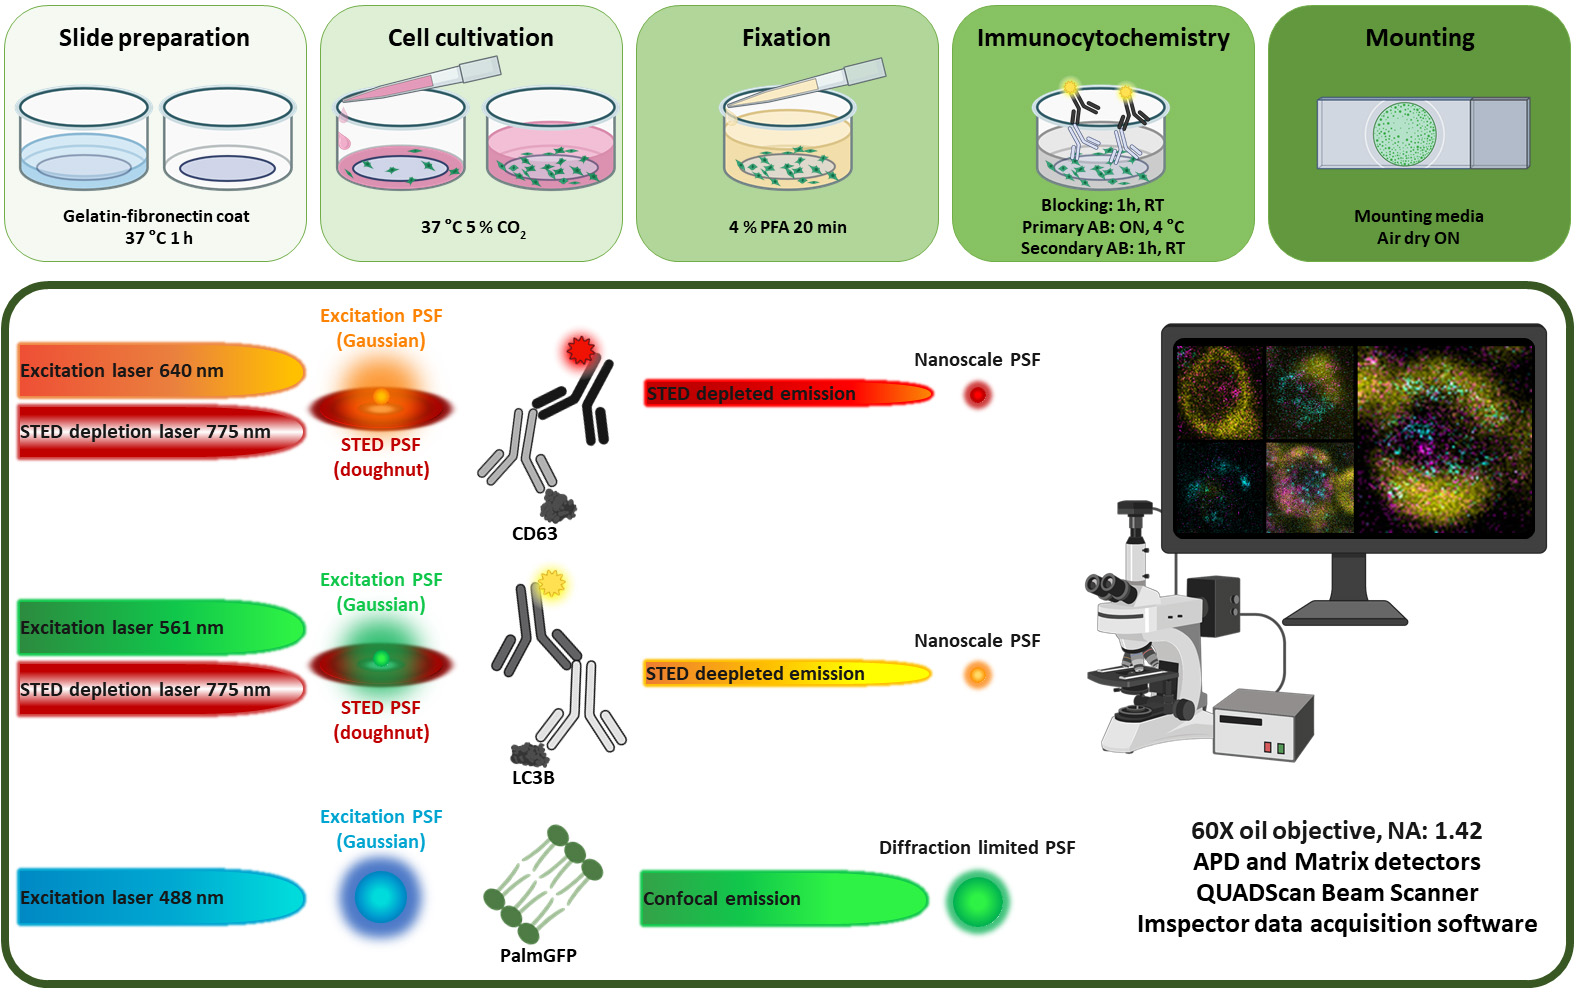
Graphical overview of immunostaining and STED imaging of monolayer cell cultures. (Top) HEK293T-PalmGFP cells were cultured on gelatin-fibronectin coated coverslips until reaching confluence. Cells were then fixed, followed by immunocytochemical staining. (Bottom) Samples were analyzed by confocal and stimulated emission depleted (STED) microscopy. The PalmGFP signal in the plasma membrane was visualized by confocal microscopy, while CD63 and LC3B were immunostained and analyzed using STED microscopy. Palm: palmitic acid; PFA: paraformaldehyde; PSF: point spread function. Image was partially created using BioRender (https://www.biorender.com/).
Background
Extracellular vesicles (EVs) are phospholipid bilayer enclosed structures [1-4]. They play important roles in intercellular communication, participate in immune responses, and contribute to the maintenance of both physiological and pathological processes [5]. Based on their biogenesis, we determine exosomes as small EVs (50–200 nm) with endosomal origin, whereas ectosomes (100–1000 nm) are released through plasma membrane budding and blebbing [1]. Early EV research primarily focused on small EVs and their biological functions [5], however recent studies have increasingly recognized the diverse roles of large EVs [6].
Due to their ability to carry proteins, lipids, and nucleic acids between cells, EVs are being extensively investigated as diagnostic biomarkers, therapeutic agents, and drug delivery vehicles in a wide range of diseases [7]. The molecular structure of EVs reflects their cell of origin and can provide insights into the surrounding bio fluid as well as the cells that subsequently take up these vesicles. Defining the molecular composition and their exact location (e.g., within the lumen, embedded in the membrane, or associated with the protein corona) is essential for understanding EV identity, function and fate.
To identify EV-associated markers and determine their spatial distribution, commonly used techniques such as confocal microscopy, flow cytometry, mass spectrometry and nanoparticle tracking analysis often face limitations due to insufficient resolution. Although additional sample preparation steps can provide further insight into the molecular composition of EVs, these procedures may alter their native structure, and the original spatial distribution of EV-associated molecules may be altered during sample preparation. For example, different isolation methods and their combinations or high-salt washing can remove the protein corona associated with the EVs, revealing proteins in the lipid membrane and altering the molecular composition of the sample. Similarly, membrane permeabilization can facilitate the detection of luminal markers, but may compromise vesicle integrity. While larger EVs (>200 nm) can be often easily visualized by confocal microscopy, precise localization of molecular markers within or on the vesicle membrane remains challenging.
To determine the exact localization of EV-associated biomolecules, high-resolution imaging techniques are required. Transmission electron microscopy (TEM) is one of the oldest and most widely used method for analyzing the ultrastructure of cells and EVs. Combined with immunogold labeling, TEM enables the localization of specific molecules at nanometer resolution. However, sample preparation is technically demanding. Image acquisition and analysis are often time-consuming, and TEM imaging is limited to fixed biological specimens. In contrast, super-resolution fluorescent microscopy can overcome several of these limitations, allowing the investigation of both fixed and live samples with less complex and often faster sample preparation workflows.
Stimulated emission depletion (STED) microscopy is one of the most widely applied super-resolution imaging techniques developed to overcome the ~200 nm diffraction limit of conventional light microscopy [8, 9]. Building on the principles of confocal microscopy, STED employs an excitation laser and a doughnut-shaped depletion laser that induces stimulated emission in fluorophores surrounding the focal center, suppressing fluorescence at the periphery of the excitation focus and leaving only a nanoscale central region capable of emitting fluorescence. This effective reduction of the observation volume enables imaging with lateral resolutions typically in the range of 30–60 nm, substantially below the diffraction limit [10].
Over the past decade, STED microscopy has become a powerful tool for investigating the nanoscale organization of biological structures, providing unprecedented insights into molecular architecture in diverse cellular systems [11, 12]. In neuroscience STED has significantly advanced the understanding of synaptic organization and plasticity by enabling direct visualization of protein distributions within individual synapses [8, 13, 14]. Similarly, in cell biology STED has facilitated the precise localization and quantification of molecular assemblies that cannot be resolved by conventional fluorescence microscopy [15-17].
Due to the nanoscale dimensions of most viruses, STED microscopy plays a crucial role in virological studies by providing super-resolution imaging of viral architecture, intracellular trafficking, and virus-host interactions [18, 19]. It is also a used method to investigate EV release and secreted, isolated EV fractions [20, 21].
In this protocol, we describe strategies for achieving highly efficient immunolabeling of cell cultures and their microenvironment to investigate endo-lysosomal vesicles and EVs. We provide information on cell culture conditions, immunocytochemistry procedures and imaging. The gelatin-fibronectin coating and in situ fixation method enable the investigation of EVs directly at their site of secretion. This protocol can be applied to a wide range of fluorescence microscopy techniques, until the fluorescently labeled antibodies are compatible with the imaging system used. Together, this protocol enables high-resolution imaging and molecular characterization of intraluminal and EVs, their biogenesis, release and molecular composition.
Materials and reagents
Biological materials
1. HEK293T-PalmGFP (gift from Charles P. Lai, https://doi.org/10.1038/ncomms8029)
Reagents
1. Gelatin 150 Bloom (Molar Chemicals KFT, CAS number: 9000-70-8)
2. Bovine Plasma Fibronectin (Gibco/Thermo Fisher Scientific, catalog number: 33010018)
3. MQ distilled water (Millipore)
4. Denaturized ethanol (any vendor)
5. Dulbecco's Modified Eagle Medium (DMEM, any vendor)
6. Heat-inactivated Fetal Bovine Serum (FBS, any vendor)
7. L-Glutamine (any vendor)
8. Penicillin-Streptomycin (any vendor)
9. Trypsin-EDTA solution (any vendor)
10. Phosphate Buffer Saline (PBS, any vendor)
11. Paraformaldehyde (Sigma/Merck, catalog number: 158127-100G)
12. Glycine (Serva, catalog number: 2339004)
13. TritonTM X-100 (Sigma/Merck, catalog number: X100-100ML)
14. Monoclonal anti-LC3B (Sigma/Merck, catalog number: ZRB100)
15. Monoclonal anti-CD63 (Santa Cruz Biotechnology, catalog number: MX-49.129.5)
16. Goat anti-rabbit Star 580 (Abberior, catalog number: ST580-1002-500UG)
17. Goat anti-mouse Star 635P (Abberior, catalog number: ST635P-1001-500UG)
18. SlowFade™ Diamond with DAPI (Invitrogen)
Solutions
1. 70 % ethanol (see Recipes)
2. Gelatin-fibronectin coat solution (see Recipes)
3. Cell culture media (see Recipes)
4. 1× PBS (see Recipes)
5. 8 % paraformaldehyde (see Recipes)
6. 50 mM glycine washing buffer (see Recipes)
7. Permeabilization and blocking solution A (see Recipes)
8. Blocking solution B (see Recipes)
Recipes
1. 70 % ethanol
Reagent | Final concentration | Quantity or Volume |
ddH2O | n/a | 300 mL |
Denaturized ethanol | 70 % (v/v) | 700 mL |
Total | n/a | 1 L |
Prepare the solution according to the table above and store it at RT.
2. Gelatin-fibronectin coat solution
Reagent | Final concentration | Quantity or Volume |
ddH2O | n/a | 39.75 mL |
Gelatin (10 % (w/v)) | 0.02 % (w/v) | 10 mL |
Fibronectin (1 mg/mL) | 5 µg/mL | 250 µL |
Total | n/a | 50 mL |
Prepare the solution according to the table above and store at -20 °C the 0.2 µm filtered 5–10 mL aliquots.
Note: The 10 % gelatin is prepared by dissolving 1 g of gelatin in 10 mL of ddH2O. The stock can be kept in 4 °C after 0.2 µm filtration for months. The 1 mg/mL fibronectin is prepared in a sterile hood, by adding 1 mL of autoclaved ddH2O to 1 mg of sterile fibronectin. Allow the lyophilized fibronectin to dissolve without any disturbances or vortexing. After dissolving, it is stable at 4 °C for months.
Critical: During dissolving the fibronectin, the solution must not be vortexed, avoiding aggregation of the protein. Gentle suspension with a pipette can be used, but the material will dissolve in the ddH2O under a few minutes without any disturbance.
3. Cell culture media
Reagent | Final concentration | Quantity or Volume |
DMEM | n/a | 44 mL |
Heat-inactivated FBS | 10 % | 5 mL |
200 mM L-Glutamine | 2 mM | 0.5 mL |
10,000 units/mL Penicillin and 10,000 μg/mL Streptomycin | 100 units/mL and 100 μg/mL | 0.5 mL |
Total | n/a | 50 mL |
Prepare the solution according to the table above and store it 4 °C up to 2 weeks. Before use allow it to warm up to 37 °C.
Note: Store the glutamine at -20 °C. Prior to use, allow it to reach room temperature and ensure that any precipitated material is completely dissolved.
4. 1× PBS
Reagent | Final concentration | Quantity or Volume |
10× PBS | 1× | 5 mL |
ddH2O | n/a | 45 mL |
Total | n/a | 50 mL |
Prepare the solution according to the table above and store it RT.
5. 8% paraformaldehyde
Reagent | Final concentration | Quantity or Volume |
1× PBS | n/a | 10 mL |
Paraformaldehyde | 8 % (w/v) | 0.8 g |
Total | n/a | 10 mL |
Prepare the solution according to the table above and store it on 4 °C.
6. 50 mM glycine washing buffer
Reagent | Final concentration | Quantity or Volume |
1× PBS | n/a | 12.5 mL |
Glycine (300 mM) | 50 mM | 2.5 mL |
Total | n/a | 15 mL |
Prepare the solution according to the table above and store it on 4 °C.
Note: The 300 mM glycine stock is prepared by dissolving 0.225 g glycine in 10 mL 1× PBS. Sterilize the solution with 0.2 filtration and store it on 4 °C.
7. Permeabilization and blocking solution A
Reagent | Final concentration | Quantity or Volume |
1× PBS | n/a | 8990 μL |
TritonTM X-100 | 0.1 % (v/v) | 10 μL |
FBS | 10 % (v/v) | 1000 μL |
Total | n/a | 10 mL |
Preparation of the solution: cut the pipette tip and add the TritonTM X-100 to the 1× PBS, then dissolve it under rotation. Add the FBS to the solution when the TritonTM X-100 is completely dissolved. Store the solution on 4 °C.
8. Blocking solution B
Reagent | Final concentration | Quantity or Volume |
1× PBS | n/a | 9900 μL |
FBS | 1 % (v/v) | 100 μL |
Total | n/a | 10 mL |
Prepare the solution according to the table above.
Laboratory supplies
1. Glass coverslip (VWR, catalog number: ECN 631-1577)
2. Tweezer
3. Glass petri dish
4. Surface treated T25 flask (any vendor)
5. 24-well plate (any vendor)
6. Parafilm (any vendor)
7. Sterile nuclease-free pipette tips: 10 µL, 200 µL, 1000 µL, 5 mL) (any vendor)
8. Pipettes (any vendor) with volume ranges: 0.5–10 µL, 10–100 µL, 100–1000 µL, 1–5 mL
9. Sterile polypropylene centrifuge tubes: 10 mL, 15 mL, 50 mL (any vendor)
10. Tissue paper
11. Microscopic slide (VWR, catalog number: 631-1179)
12. Nail polish
Equipment
1. Common laboratory equipments: drying cabinet, laminar box for cell culturing, cell culture incubator, upright microscope, microplate oscillator, freezer, fridge (any vendor)
2. STED microscope with fully motorized inverted microscope platform (Abberior, 4C Facility Line, S/N FC215001) (Olympus IX83)
a. Laser sources (Abberior, 405, 485, 561, 640 nm excitation lasers at 40 MHz; pulsed 775 nm STED depletion laser at 25-40 mHz, maximum nominal output power of 2,750 mW)
b. Objective (Olympus, 60×/1.42 NA oil-immersion, working distance 0.15 mm, UPLXAPO60XO)
c. Scanning system (Abberior, QUADScan Beam Scanner, IX3-SSU ultrasonic XY stage)
d. Detection system (Abberior, APD detectors and Matrix array detector, with variable spectral filtering over the 400-800 nm range)
e. Focus stabilization (Olympus, IX3-ZDC2-830 TrueFocus continuous focus stabilization system using a 790 nm laser diode)
3. Active self-leveling vibration isolation table (any vendor)
Note: The laser powers listed above refer to the nominal specifications of the installed laser sources and should not be interpreted as the laser power delivered to the specimen. Experimental excitation and depletion powers should be reported as the settings used during image acquisition or, when available, as measured power at the sample plane.
Software and datasets
1. Imspector data acquisition software (Abberior, version: 16.3.14278-w2129-win64). For image analysis Abberior Lightbox 2024.48.21648-g318143e271 software was used.
Procedure
A. Prepare the coated coverslips
1. Prepare the sterile coverslips by sterilizing them with 70 % ethanol, then allow to dry them.
a. Put the glass coverslips into a petri dish. Pour 70 % ethanol on them until every coverslip is covered in the alcohol. Distribute the ethanol evenly then discharge it.
b. Put the petri dish with the sterilized coverslips into a drying cabinet, until all the remaining ethanol evaporated.
c. Keep the coverslips at RT and sterile until you use them.
2. Sterilize the tweezer by putting it in 70 % ethanol for 1 minute, then air dry it.
3. Put the sterile glass coverslips with the sterile tweezer into a 24-well plate.
4. Put 130 µL Gelatin-fibronectin coat solution in the well to cover the glass coverslip.
Note: If you are not using freshly made Gelatin-fibronectin coat solution, then take the solution out from -20 °C and thaw the small amount that you will use for the given coat.
Critical: Only thaw the amount that you need for the given coat, avoid freeze-thaw cycles.
5. Put the lid on the plate and place it into 37 °C for 30–60 minutes.
Pause point: You can prepare the coated coverslips maximum one week before you want to seed the cells on them. In this case put 130–200 µL of Gelatin-fibronectin coat solution into the well. Close the plate with parafilm and store it on 4 °C up to one week. Put the plate to 37 °C for 30 minutes before use.
6. Remove as much as possible liquid coat from the well by a 200 µL pipette immediately before culturing the cells.
B. Cell culturing
1. Cultivate cells in a T25 flask with 5 ml Cell culture media at 37 °C with 5 % CO2 until they reach the optimal confluence (70–90 %).
2. Remove as much as possible cell culture media from the flask using a 5 ml pipette.
3. Put 750 µL of Trypsin-EDTA on the cells and incubate for 1–3 minute.
4. When the cells start detaching from the bottom of the flask, add 5 mL of Cell culture media, and detach the cells mechanically, by pipetting, and tapping the flask slightly.
5. Put the cell containing media into a centrifugal tube and pellet the cells with 300× g 5 min with medium acceleration and deceleration.
6. Discard the supernatant.
7. Put 700 µL of fresh media on the cells, and suspend them.
Note: Secure a 10 µL pipette tip on the end of a 1000 µL pipette tip and suspend the cells two times, to help forming a single-cell suspension.
8. Place 8 µL of the cells on the surface of the coverslip.
9. Fill the plate wells with Cell culture media in total volume of 500 µL, by gently running the cell culture medium down the side of the well. Shake the plate gently to distribute the cells evenly, and check their even location with a light microscope.
10. Incubate the cells at 37 °C with 5 % CO2 until they reach the optimal confluence.
C. Immunocytochemistry
1. Fix the cells and their microenvironment in situ: without changing the culture medium add 8 % PFA in an equal volume to achieve a final concentration of 4 %. Incubate the samples in the 4 % PFA for 20 minutes.
Note: To avoid disturbance of the surface run the PFA down on the side of the well.
2. After 20 minutes incubation remove the liquid from the well.
3. Wash the samples with 500 µL 1× PBS under slow oscillation for 5 minutes RT twice.
Note: To avoid disturbance of the surface run PBS down on the side of the well.
4. Wash the samples with 500 µL 50 mM glycine washing buffer under slow oscillation for 5 minutes RT.
Note: To avoid disturbance of the surface run wash buffer down on the side of the well.
5. Replace the washing buffer with 500 µL 1× PBS.
Pause point: Sample preparation can stop here for 2–4 weeks. Close the plate with parafilm and store it on 4 °C.
6. Incubate the sample with 500 µL Permeabilization and blocking solution A for 1 hour RT under slow oscillation.
7. Dilute the primary antibodies in Permeabilization and blocking solution A based on the manufacturer’s instructions, then centrifuge it at 10000× g for 5 minutes to get rid of the aggregated antibodies.
8. Put 200 µL of diluted antibody on the sample. Close the plate with parafilm and incubate the sample ON on 4 °C.
9. Wash the primary antibody containing solution with 500 µL Permeabilization and blocking solution A under oscillation for 5 minutes RT twice.
10. Wash the samples with 500 µL Blocking solution B under oscillation for 5 minutes RT.
11. Dilute the secondary antibodies in Blocking solution B based on the manufacturer’s instructions and put 200 µL on the sample and incubate in dark under oscillation for 1 hour RT.
12. Wash the sample with 500 µL 1× PBS under oscillation for 5 minutes RT twice.
13. Wash the sample with 500 µL ddH2O under oscillation for 5 minutes RT.
14. Replace the ddH2O with 350 µL ddH2O.
15. Put 1 drop (2–10 µL) of mounting medium on the surface of a microscope slide.
Note: The mounting medium contained DAPI.
16. Take the glass coverslip out from the well with a tweezer, and put it on a tissue paper for 5 seconds to drain excess fluid.
17. Turn the glass coverslip on the mounting medium (with the biological sample facing the mounting medium).
18. Push the glass coverslip gently down to spread out the mounting medium evenly, make sure the glass coverslip is straight and there is no bubble under it.
19. Close the sample from air, by painting the glass coverslip edges with nail polish.
20. Place the microscope slide on an even surface and allow the nail polish to dry ON in dark. After the nail polish dried store the samples on 4 °C. The sample is stable for imaging for months.
D. Imaging by STED microscope
1. Switch on the microscope system and allow the laser sources and electronic components to reach stable operating conditions according to the manufacturer's recommended startup procedure.
2. Verify the alignment and performance of the STED system before imaging experimental samples using an appropriate fluorescent calibration sample.
Critical: Proper spatial alignment between the excitation focus and the center of the doughnut-shaped STED depletion beam is essential for reliable super-resolution imaging. Misalignment may produce asymmetric structures, reduced resolution, or other imaging artifacts that can be misinterpreted as biological features.
3. Place the mounted microscope slide on the microscope stage and apply the appropriate immersion oil to the UPLXAPO60XO 60×/1.42 NA objective.
4. Activate the ZDC-830 TrueFocus system when appropriate to minimize axial drift during acquisition, particularly during three-dimensional and sequential multi-channel imaging.
5. Set pinhole between 0.5 and 0.8 AU.
6. Identify cells and regions of interest using low excitation power and confocal imaging. Minimize repeated scanning of regions selected for subsequent STED acquisition to reduce photobleaching.
7. Acquire the PalmGFP signal in confocal mode using the 485 nm excitation laser.
8. Acquire STAR 580 fluorescence using the 561 nm excitation laser in combination with the pulsed 775 nm STED depletion laser.
9. Acquire STAR 635P fluorescence using the 640 nm excitation laser in combination with the pulsed 775 nm STED depletion laser.
Note: The nominal output powers of the installed laser sources are instrument specifications and do not correspond directly to the optical power delivered to the sample. Record the excitation and STED laser settings used for each acquisition.
10. Adjust the spectral detection windows according to the emission properties of PalmGFP, STAR 580, and STAR 635P while minimizing spectral cross-talk between channels.
11. Optimize the excitation power to obtain sufficient photon counts without excessive photobleaching or detector saturation. Subsequently optimize the 775 nm STED depletion power to achieve improved spatial resolution while maintaining sufficient fluorescence signal.
12. Define the imaging field and z-range according to the biological structure of interest. When analyzing intracellular multivesicular structures, acquire the complete structure in three dimensions whenever possible.
13. Set the lateral pixel size sufficiently below the expected effective STED resolution to provide adequate spatial sampling (between 16-25 nm).
14. Define the z-step according to the axial resolution required for the experiment and acquire the complete volume of the structure whenever three-dimensional interpretation is required.
15. Use identical acquisition parameters for samples or experimental groups intended for quantitative comparison.
16. Inspect the acquired images for detector saturation, photobleaching, sample drift, channel misregistration, insufficient signal-to-noise ratio, and depletion-related artifacts before proceeding to additional fields of view.
17. Save the raw image data together with the complete acquisition metadata. Preserve the unprocessed raw data for subsequent analysis and reproducibility.
Critical: Structures close to or below the effective resolution of the imaging system should not be classified solely according to their apparent diameter. Interpretation should incorporate marker distribution, three-dimensional morphology, signal-to-noise ratio, and appropriate experimental controls.
Table 1. Detection channels for target proteins.
| Channel | Target | Fluorescent label | Excitation | STED depletion* | Imaging mode |
| 1 | PalmGFP | GFP | 485 nm | None | Confocal |
| 2 | LC3B | STAR 580 | 561 nm | 775 nm | STED |
| 3 | CD63 | STAR 635P | 640 nm | 775 nm | STED |
*The 775 nm depletion laser is shared by both STED channels.
Table 2. Image acquisition parameters.
| Parameter* | PalmGFP | STAR 580 | STAR 635P |
| Excitation laser setting (%) | 3 | 30 | 6 |
| STED laser setting (%) | N/A | 30 | 30 |
| Detection window (nm) | 498–551 | 571–630 | 650–755 |
| Pixel size (nm) | 16 × 16 | 16 × 16 | 16 × 16 |
| Pixel dwell time (µs) | 5 | 5 | 5 |
| Line/frame accumulation | 2 | 25 | 5 |
| Pinhole (AU) | 0.50 | 0.50 | 0.50 |
*The acquisition parameters listed below should be optimized experimentally and recorded for each imaging configuration.
Table 3. Additional informations for antibodies.
Antibody | Host | Species reactivity | Identifiers | Dilution |
Monoclonal anti-LC3B | Rabbit | Human, rat | ZRB100, clone 12K5 | 1:200 |
Monoclonal anti-CD63 | Mouse | Human | MX-49.129.5, clone: sc-5275 RRID:AB_627877 | 1:200 |
Goat anti-rabbit Star 580 | Goat | Rabbit | ST580-1002-500UG RRID:AB_2910107 | 1:500 |
Goat anti-mouse Star 635P | Goat | Mouse | ST635P-1001-500UG RRID:AB_2893232 | 1:500 |
Data analysis
Raw confocal and STED image datasets should first be inspected for technical artifacts, including sample drift, channel misregistration, detector saturation, insufficient signal-to-noise ratio, and fluorescent structures potentially generated by antibody aggregation. Images failing predefined quality criteria should be excluded before biological classification or quantitative analysis.
For quantitative experiments, multiple independently prepared biological replicates should be analyzed, with multiple cells and regions of interest sampled from each replicate. The exact number of biological replicates, cells and vesicular structures analyzed should be reported for each experiment. Statistical tests should be selected according to the experimental design and distribution of the measured data.
Validation of protocol
This protocol, or the experimental procedures on which it is based, was used and validated in the following research article:
Visnovitz, Lenzinger and Koncz et al. (2025), *A ‘torn bag mechanism’ of small extracellular vesicle release via limiting membrane rupture of en bloc released amphisomes (amphiectosomes)*, eLife 13:RP95828.
Multi-channel STED microscopy was used to resolve structural intermediates associated with amphisome formation, including MVBs, autophagosomes, MVB-autophagosome fusion, LC3B-positive internal membrane remodeling, and mature amphisomes. The imaging strategy combined confocal detection of PalmGFP membranes, with STED imaging of immunofluorescently labeled vesicular markers, enabling the molecular organization of complex multivesicular structures to be examined at sub-diffraction resolution.
The biological interpretation of the STED observations was supported by complementary imaging approaches, including confocal fluorescence microscopy, transmission electron microscopy, immunogold electron microscopy, and live-cell super-resolution imaging. STED microscopy provided molecularly specific information on the nanoscale spatial organization of vesicular structures, whereas complementary methods provided ultrastructural and dynamic evidence supporting the proposed pathway of amphiectosome formation and EV release.
General notes and troubleshooting
General notes
1. This protocol is to prepare cell cultures for multi-channel STED super-resolution imaging. The samples prepared with the techniques listed above can also be investigated by regular fluorescent microscopes, depending on the used secondary antibodies and the microscope system.
2. Handle the samples gently, because both the samples (gelatin-fibronectin coat, cells and EVs) are capable to float up. In order to avoid the damage of the coat and the seeded cells pipette the liquids slowly.
3. In situ fixation is a central feature of this protocol. Avoid EV isolation, centrifugation, or extensive manipulation before fixation when the objective is to preserve fragile extracellular vesicular structures in their original microenvironment.
4. The presence of CD63 and LC3B fluorescence within the same diffraction-limited region does not necessarily indicate molecular colocalization. STED imaging may reveal that these signals originate from spatially distinct membrane domains or intraluminal structures.
5. Antibody aggregates can fall within the apparent size range of EVs and other nanoscale structures. Centrifugation of antibody solutions and appropriate staining controls are therefore essential.
6. Interpretation of nanoscale vesicular structures should not rely exclusively on apparent diameter. The effective optical resolution, fluorophore distribution, antibody linkage error, labeling density, and signal-to-noise ratio should all be considered.
7. The nominal laser output power specified for the microscope should not be reported as the experimental power delivered to the specimen. For reproducibility, report the acquisition settings used in Imspector and, when available, measured laser power at the sample plane.
8. For mechanistic studies of EV release, fixed-cell STED should be combined with complementary imaging approaches where appropriate. STED provides high spatial resolution but does not independently establish the temporal sequence of dynamic release events.
Troubleshooting
Problem 1: The cells float up from the surface.
Possible cause: Pipetting the liquid directly on the sample or pipetting the liquids too fast and harsh.
Solution: When seeding the cells and washing steps during immunocytochemical labeling, always run the liquids slowly on the side of the well. Do not put the liquid directly on the sample or pipette it too fast.
Problem 2: Poor fluorescent signal, or uneven, burnt out image.
Possible cause: Suboptimal antibody, insufficient amount of antibodies or antibody aggregates.
Solution: Check the manufacturers instruction about properties of the antibodies (specificities, concentration). Titrate the antibodies to use the optimal amount for the labeling. Extend the primary antibody incubation time, extend the blocking time, or change the blocking solution to 5 % BSA. To eliminate antibody aggregates, after diluting the primary antibody, apply higher centrifugation force (12–15000× g), or extended centrifugation time (10–12 minutes).
Problem 3: High background signal.
Possible cause: Low signal-to-noise ratio can occur due to the samples high autofluorescence, insufficient blocking, or high antibody concentrations.
Solution: Inspect the autofluorescence signal of the sample and only use the given channels, where no autofluorescence signal is detectable. Autofluorescence noise can be present from the remaining aldehyde groups from the fixative PFA. Incubate the samples with 50 mM glycine washing buffer longer to eliminate the aldehyde groups. Extend the blocking time or change the blocking solution to 5 % BSA. Use highly specific and strong labeling to separate the targeted marker. Optimize the concentration of the used antibodies.
Problem 4: STED imaging does not provide a clear improvement in resolution compared with confocal imaging.
Possible causes: Misalignment of the excitation and STED depletion beams, insufficient depletion power, inappropriate fluorophore selection, low labeling density, excessive background fluorescence or inadequate spatial sampling.
Solution: Verify STED alignment using an appropriate fluorescent calibration sample. Confirm compatibility of the fluorophore with 775 nm depletion. Optimize labeling density, excitation power, STED depletion power, and pixel size. Avoid increasing depletion power beyond the point at which excessive photobleaching or signal loss compromises reliable structure identification.
Problem 5: Small bright fluorescent spots are detected outside or inside cells and may be mistaken for EVs.
Possible causes: Antibody aggregates, nonspecific staining, precipitated mounting medium, autofluorescent particles, or imaging noise.
Solution: Centrifuge diluted antibody solutions immediately before use. Include secondary-antibody-only, and appropriate negative controls. Inspect unstained samples for autofluorescence. Evaluate candidate structures in their three-dimensional context and, where possible, relative to the PalmGFP membrane signal.
Problem 6: Apparent spatial displacement occurs between fluorescence channels.
Possible causes: Chromatic aberration, channel misregistration, sample drift or movement during sequential channel acquisition.
Solution: Verify channel registration using multicolor fluorescent calibration beads with emission wavelengths covering the channels used in the experiment. Correct systematic channel offsets when necessary. Use the ZDC-830 TrueFocus system to minimize axial drift during extended or three-dimensional acquisitions.
Problem 7: Fluorescence intensity decreases substantially during acquisition of a z-stack.
Possible causes: Excessive excitation or STED depletion power, excessive pixel dwell time, repeated scanning, or an unnecessarily large imaging volume.
Solution: Reduce excitation and/or depletion power, minimize repeated scanning of the same region, reduce pixel dwell time or accumulation when compatible with the required signal-to-noise ratio, and restrict the acquired volume to the biological structure of interest.
Problem 8: The STAR 580 and STAR 635P channels show apparent cross-talk.
Possible causes: Inappropriate detection windows or excessive fluorescence intensity due to high laser levels.
Solution: Optimize the variable spectral detection windows independently for each fluorophore. Acquire single-labeled controls to determine channel-specific cross-talk and adjust the acquisition configuration accordingly.
Acknowledgments
1) Specific contributions of authors:
D.L. Conceptualization, Writing—Original Draft, Writing—Review & Editing, Formal analysis, Investigation, Methodology
C.C. Conceptualization, Writing—Original Draft, Writing—Review & Editing, Funding acquisition, Investigation, Methodology
Á.D. Resources, Funding acquisition, Writing—Review & Editing
E.I.B., Resources, Funding acquisition, Writing—Review & Editing
T.V. Conceptualization, Writing—Original Draft, Supervision, Funding acquisition, Investigation, Methodology, Writing—Original Draft, Writing—Review & Editing
2) Funding sources that supported the work:
This research was supported by the Hungarian National Research, Development and Innovation Office (NKFIH) through grants ADVANCED_25 grant (152112 awarded to TV), as well as by the Higher Education Excellence Program (FIKP) and the Therapeutic Thematic Programme (TKP2021-EGA-23). Additional support was provided by grant RRF2.3.1-21-2022-00003 (National Cardiovascular Laboratory Program). The János Bolyai Research Scholarship of the Hungarian Academy of Sciences supported TV and CC. ÁD was funded by the ‘Momentum’ research grant from the Hungarian Academy of Sciences (grant no. LP2022-5/2022) and the Hungarian Brain Research Program (grant no. NAP2022-I-1/2022).
3) Citation of the original research paper in which the protocol was described and validated:
Tamás Visnovitz, Dorina Lenzinger, Anna Koncz, Péter M Vizi, Tünde Bárkai, Krisztina V Vukman, Alicia Galinsoga, Krisztina Németh, Kelsey Fletcher, Zsolt I Komlósi, Csaba Cserép, Ádám Dénes, Péter Lőrincz, Gábor Valcz, Edit I Buzas (2025) A ‘torn bag mechanism’ of small extracellular vesicle release via limiting membrane rupture of en bloc released amphisomes (amphiectosomes) eLife 13:RP95828, https://doi.org/10.7554/eLife.95828.3
Competing interests
The authors declare no conflicts of interest.
References
1. Buzas, E.I., The roles of extracellular vesicles in the immune system. Nat Rev Immunol, 2023. 23(4): p. 236-250.
2. György, B., et al., Membrane vesicles, current state-of-the-art: emerging role of extracellular vesicles. Cellular and Molecular Life Sciences, 2011. 68(16): p. 2667-2688.
3. Théry, C., et al., Minimal information for studies of extracellular vesicles 2018 (MISEV2018): a position statement of the International Society for Extracellular Vesicles and update of the MISEV2014 guidelines. Journal of Extracellular Vesicles, 2018. 7(1): p. 1535750.
4. Welsh, J.A., et al., Minimal information for studies of extracellular vesicles (MISEV2023): From basic to advanced approaches. Journal of Extracellular Vesicles, 2024. 13(2): p. e12404.
5. Yáñez-Mó, M., et al., Biological properties of extracellular vesicles and their physiological functions. J Extracell Vesicles, 2015. 4: p. 27066.
6. Rutter, S.F., et al., Mechanisms and functions of large extracellular vesicle biogenesis. Nature Cell Biology, 2026. 28(6): p. 1113-1126.
7. Kalluri, R. and V.S. LeBleu, The biology, function, and biomedical applications of exosomes. Science, 2020. 367(6478).
8. Nägerl, U.V., et al., Live-cell imaging of dendritic spines by STED microscopy. Proc Natl Acad Sci U S A, 2008. 105(48): p. 18982-7.
9. Hell, S.W. and J. Wichmann, Breaking the diffraction resolution limit by stimulated emission: stimulated-emission-depletion fluorescence microscopy. Opt Lett, 1994. 19(11): p. 780-2.
10. Donnert, G., et al., Macromolecular-scale resolution in biological fluorescence microscopy. Proceedings of the National Academy of Sciences, 2006. 103(31): p. 11440-11445.
11. Calovi, S., F.N. Soria, and J. Tønnesen, Super-resolution STED microscopy in live brain tissue. Neurobiology of Disease, 2021. 156: p. 105420.
12. Blom, H. and J. Widengren, Stimulated Emission Depletion Microscopy. Chemical Reviews, 2017. 117(11): p. 7377-7427.
13. Willig, K.I., et al., STED microscopy reveals that synaptotagmin remains clustered after synaptic vesicle exocytosis. Nature, 2006. 440(7086): p. 935-939.
14. Chéreau, R., et al., Superresolution imaging reveals activity-dependent plasticity of axon morphology linked to changes in action potential conduction velocity. Proceedings of the National Academy of Sciences, 2017. 114(6): p. 1401-1406.
15. Eggeling, C., et al., Direct observation of the nanoscale dynamics of membrane lipids in a living cell. Nature, 2009. 457(7233): p. 1159-1162.
16. Yang, X., et al., Mitochondrial dynamics quantitatively revealed by STED nanoscopy with an enhanced squaraine variant probe. Nature Communications, 2020. 11(1): p. 3699.
17. Bottanelli, F., et al., Two-colour live-cell nanoscale imaging of intracellular targets. Nature Communications, 2016. 7(1): p. 10778.
18. Li, Z., et al., Visualizing the replicating HSV-1 virus using STED super-resolution microscopy. Virol J, 2016. 13: p. 65.
19. Chojnacki, J. and C. Eggeling, Super-Resolution STED Microscopy-Based Mobility Studies of the Viral Env Protein at HIV-1 Assembly Sites of Fully Infected T-Cells. Viruses, 2021. 13(4).
20. Koliha, N., et al., A novel multiplex bead-based platform highlights the diversity of extracellular vesicles. J Extracell Vesicles, 2016. 5: p. 29975.
21. McKay, T.B., et al., Extracellular Vesicles Secreted by Corneal Epithelial Cells Promote Myofibroblast Differentiation. Cells, 2020. 9(5).
Related files
 STED protocol for EVs_final_for-submission.docx
- Lenzinger, D, Cserép, C, Dénes, Á, Buzas, E and Visnovitz, T(2026). Multi-channel STED super-resolution imaging for studying extracellular vesicle release. Bio-protocol Preprint. 10.21769/p3009.
- Visnovitz, T., Lenzinger, D., Koncz, A., Vizi, P. M., Bárkai, T., Vukman, K. V., Galinsoga, A., Németh, K., Fletcher, K., Komlósi, Z. I., Cserép, C., Dénes, Á., Lőrincz, P., Valcz, G. and Buzas, E. I.(2025). A ‘torn bag mechanism’ of small extracellular vesicle release via limiting membrane rupture of en bloc released amphisomes (amphiectosomes). eLife. DOI: 10.7554/eLife.95828
Do you have any questions about this protocol?
Post your question to gather feedback from the community. We will also invite the authors of this article to respond.
 Post a Question


