
- Home
- Protocols

-

Phenotypic Identification of Abiotic Stress at Rice Seedling Stage
Last updated date: Nov 3, 2024 Views: 174 Forks: 0
Experimental Principle: The purpose of this experiment is to simulate non-biotic stress survival conditions in nature artificially, compare transgenic plants with control plants, and observe the differences in phenotypic and physiological responses to non-biotic stress. Through this comparison, we can explore the function and mechanism of the target gene in non-biotic stress, thereby better understanding the survival and adaptability of transgenic plants under stress conditions.
Experimental Materials: This experiment involves independent transgenic and control plants, with three families for each type. If the transgenic plants are mutant materials, the transgenic plants should be pure families separated from heterozygous offspring, and the control materials should be the corresponding negative families. If the transgenic plants are overexpression or RNAi materials, three overexpression single-copy families or RNAi families and their corresponding control families need to be prepared. The selection and preparation of these materials are crucial for the accuracy and reliability of the experiment.
Keywords: Rice, Seedling Stage, Non-Biotic Stress, Phenotype, Physiological Response
Materials and Reagents:
Small buckets (30 cm in height, 20 cm in diameter) for planting rice seedlings.
Clay and river sand (mixed in a 1:1 ratio) as planting medium.
Rice seeds for planting in the experiment.
Industrial salt (NaCl) (laboratory analytical pure reagents can be used for small-scale trials) to simulate salt stress conditions.
Compound fertilizer as a base fertilizer for the planting medium.
Sodium Hypochlorite (NaClO): For seed disinfection.
Tap Water: For seed rinsing and hydroponic culture.
Yoshida Culture Medium: For hydroponic cultivation and nutrient provision.
pH Meter: For measuring and adjusting the pH of solutions.
Electronic Balance: For precise weighing of solid materials.
Measuring Cylinders and Pipettes: For accurate measurement of liquid volumes.
Sterile Equipment: Such as sterile gloves, masks, alcohol lamps, etc., for seed treatment and aseptic operations.
Petri Dishes: For seed cultivation and observation.
Microscope: For observing the microstructure of seeds and seedlings.
Notebook and Marking Pens: For recording experimental data and observations
Instrumental Equipment:
Rainproof and light-transmitting shed to simulate natural light and precipitation conditions.
Artificial cold storage room (temperature range 0-10°C) for simulating low-temperature stress.
Artificial climate chamber (temperature range 0-50°C) for simulating high-temperature stress.
Thermostatic Water Bath: For maintaining a constant temperature of solutions.
Centrifuge: For separating liquids from solid particles.
Spectrophotometer: For measuring the absorbance of solutions, such as chlorophyll content determination.
Autoclave: For sterilizing culture media and experimental tools.
Microscope: For observing the microstructure of seeds and seedlings.
Data Analysis Software: For processing and analyzing experimental data.
Image Analysis Software: For analyzing plant phenotype changes in photographs.
Temperature and Humidity Data Loggers: For monitoring temperature and humidity conditions in the experimental environment.
Data Recorders: For logging various parameters during the experiment, such as temperature and time.
Experimental Steps:
Material Preparation: Place the seeds in a 50°C oven for 2 to 3 days to break dormancy; then wash the seeds with distilled water, soak them in a 0.3% NaClO (sodium hypochlorite) solution for 6 hours, rinse with tap water 2 to 4 times, and then place them in an artificial climate chamber at 33°C with tap water (pH 5.5-5.8) for germination for 3 to 4 days. When the seeds germinate to 2-3 cm, transfer them to a PCR plate with the bottom cut off, floating on tap water (pH 5.5-5.8) for growth. After one week, transfer them to Yoshida (Yoshida S, 1972) culture medium, adjust the pH to 5.5-5.8, and change the culture medium once a week. If soil cultivation is used, first sow on a seedling tray and transplant after the 3-4 leaf stage. Growth cycle external environmental conditions: 2/3 time (27°C) light conditions, 1/3 time (25°C) dark conditions.
I. Seedling Drought Phenotype Identification
Soak and germinate the rice seeds, select seedlings with consistent growth and approximately 2-3 cm in length, and carefully transplant them into small buckets (plant transgenic family seedlings and control seedlings in each bucket, 12-20 plants of each type).
When the seedlings grow to the 4-leaf stage, carefully pour off the surface water or stop watering, take photos for recording. Then, observe each plant individually at the same time every day and record the number of days of leaf rolling. When the control group plants show irreversible full leaf rolling (still rolled in the morning, the specific time is determined based on air temperature and humidity), re-water and observe and record phenotypic changes, take photos, and count the survival rate.
II. Seedling Simulated Drought (Osmotic Stress) Phenotype Identification
When the rice seedlings reach the four-leaf stage (21 days from sowing), treat with 20% PEG, set up three repetitions, and place them in the same light incubator under the same conditions. When the control group plants show irreversible full leaf rolling (still rolled in the morning, the specific time is determined based on air temperature and humidity), re-water (note that this is a return to Yoshida nutrient solution), observe and record phenotypic changes, take photos, and count the survival rate.
III. Seedling Salt Tolerance Phenotype Identification
Plant 15-20 transgenic seedlings and 15-20 control seedlings in small buckets, and cultivate until they are healthy and consistent in size.
When the seedlings grow to the 4-leaf stage, carefully pour off the surface water, then irrigate with 50 mM NaCl solution, continue for 3-4 days, then change to 100 mM NaCl solution, and after another 3-4 days, change to 200 mM NaCl solution.
During the treatment, take photos for recording, and observe and record the time of leaf rolling or wilting on a per-plant basis. Record each bucket's control group and compare with the same bucket's transgenic line. After the control seedlings are almost all wilted, examine the survival rate and individual green leaf area. In addition, you can measure the salt sensitivity index [(fresh weight under normal growth - fresh weight under stress) / fresh weight under normal growth], Na+/K+ concentration, and other indicators to judge the phenotype.
Note: In high-salt stress sandy soil, seedlings are difficult to recover growth; the hydroponic experimental method is the same as above, during stress, add 100mM-140mM NaCl to the hydroponic solution, and when recovering, change to normal Yoshida hydroponic solution.
IV. Seedling Cold Tolerance Phenotype Identification
Plant 15-20 transgenic seedlings and 15-20 control seedlings in small buckets, and cultivate until they are healthy and consistent in size. The formal experiment should be repeated three times and set a non-stress control.
When the seedlings grow to the 4-leaf stage, subject them to low-temperature stress (set 2-6°C low-temperature environment in the growth chamber) for about a week. Observe and record the time of leaf wilting, compare each bucket's control with the same bucket's transgenic line. After the control seedlings are almost all wilted, return to normal growth for one week, and examine individual green leaf area and fresh weight, family survival rate, and average low-temperature sensitivity index [(fresh weight under normal growth - fresh weight under stress) / fresh weight under normal growth].
V. Seedling High-Temperature Tolerance Phenotype Identification
Plant 15-20 transgenic seedlings and 15-20 control seedlings in small red buckets, and cultivate until they are healthy and consistent in size. The formal experiment should be repeated three times and set a non-stress control.
When the seedlings grow to the 4-leaf stage, subject them to high-temperature stress (set 40-45°C high-temperature environment in the growth chamber), stress for one to two days, and after the control seedlings are almost all wilted, return to normal growth for one week, and examine individual green leaf area and fresh weight, family survival rate, and average high-temperature sensitivity index [(fresh weight under normal growth - fresh weight under stress) / fresh weight under normal growth].
VI. Germination Tolerance to Low Oxygen Phenotype Identification
For low-oxygen stress screening, use 1.5% (v/v) sodium hypochlorite for disinfection for 15 minutes, rinse with ultrapure water 8 times, then load into 10 cm centrifuge tubes filled with high-pressure sterilized ultrapure water and seal. Load 5 seeds with consistent germination and length into each centrifuge tube, place in an incubator for dark culture for 7 days (28°C), allowing the coleoptile to grow fully, and use the length of the coleoptile after 7 days of germination as an indicator of germination tolerance to waterlogging.
VII. Seedling Alkali Tolerance Phenotype Identification
The same hydroponic method as above is used, with three alkali levels set: 10, 20, 30 mmol·L−1. At these three alkali levels, three different pH environments are formed by adjusting the ratio of sodium carbonate and sodium bicarbonate: pH 8.65, pH 9.55, and pH 10.50. Specifically:
For the 10 mmol·L−1 alkali level, the ratio of sodium carbonate to sodium bicarbonate is 9:1, i.e., 9 parts sodium carbonate and 1 part sodium bicarbonate.
For the 20 mmol·L−1 alkali level, the ratio of sodium carbonate to sodium bicarbonate is 5:5, i.e., equal amounts of sodium carbonate and sodium bicarbonate.
For the 30 mmol·L−1 alkali level, the ratio of sodium carbonate to sodium bicarbonate is 1:9, i.e., 1 part sodium carbonate and 9 parts sodium bicarbonate.
Under each alkali level, according to the different
| c(NaHCO3+Na2CO3)/(mmol·L−1) | pH | n(NaHCO3):n(Na2CO3) | c(NaHCO3)/(mmol·L−1) | c(Na2CO3)/(mmol·L−1) | |
| 10A | 10 | 8.65 | 9:01 | 9 | 1 |
| 10B | 10 | 9.55 | 5:05 | 5 | 5 |
| 10C | 10 | 10.5 | 1:09 | 1 | 9 |
| 20A | 20 | 8.65 | 9:01 | 18 | 2 |
| 20B | 20 | 9.55 | 5:05 | 10 | 10 |
| 20C | 20 | 10.5 | 1:09 | 2 | 18 |
| 30A | 30 | 8.65 | 9:01 | 27 | 3 |
| 30B | 30 | 9.55 | 5:05 | 15 | 15 |
| 30C | 30 | 10.5 | 1:09 | 3 | 27 |
pH, the specific concentrations of sodium carbonate and sodium bicarbonate are shown in the table below.
When the rice seedlings reach the four-leaf stage (21 days from sowing), treat with different modes, set up three repetitions, and place them in the same light incubator under the same conditions. When the control group plants show irreversible full leaf rolling (still rolled in the morning, the specific time is determined based on air temperature and humidity), re-water (note that this is a return to Yoshida nutrient solution), observe and record phenotypic changes, take photos, and count the survival rate.
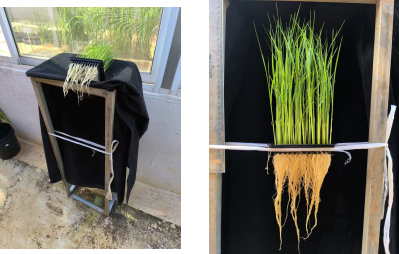
VIII. Photography Method
Notes:
When conducting drought and salt treatments, the soil in the small buckets should be a 1:1 evenly mixed clay and river sand soil, and a suitable amount of base fertilizer (compound fertilizer) should be mixed before soil installation.
Try to select healthy seedlings with consistent growth for transplantation, and plant more pots, selecting pots with consistent plant growth for treatment.
When watering, avoid impacting the soil and keep the soil surface flat.
The experiment should use a random block design and set up three repetitions.
Different rice varieties have different tolerances to various stress levels, so a pre-experiment is needed before the formal experiment to measure their tolerance.
References:
Yoshida, S. (1972). A laboratory manual for physiological studies of rice. International Rice Research Institute.
Bray, E. A., Bailey-Serres, J., & Weretilnyk, E. (2000). Responses to abiotic stresses. In Biochemistry and molecular biology of plants (pp. 1158-1249). American Society of Plant Biologists.
Munns, R., & Tester, M. (2008). Mechanisms of salinity tolerance. Annual Review of Plant Biology, 59, 651-681.
Zong.W.,Du,H.,Ma.S.Q.and Xiong.L.Z.(2018).Phenotypic identification of abiotic stress at rice seedling stage.Bo-101 e1010179.Doi:10.21769/BioProtoc.1010179.(in Chinese)
- Wang, S, Zhang, Y, Li, L, Wang, s, Shao, Q and Shi, X(2024). Phenotypic Identification of Abiotic Stress at Rice Seedling Stage. Bio-protocol Preprint. bio-protocol.org/prep2744.
Do you have any questions about this protocol?
Post your question to gather feedback from the community. We will also invite the authors of this article to respond.