
- Home
- Protocols

-

Quantification of Dengue Virus infectivity in cell lines

Last updated date: Apr 22, 2024 Views: 1755 Forks: 0
Quantification of Dengue Virus infectivity in cell lines
Maharah Binte Abdul Mahid1, Pradeep Bist1, Kristmundur Sigmundsson2, Muhammad Danial Bin Mohd Mazlan1, Satoru Watanabe1, Choy Ming Ju Milly1 and Subhash G. Vasudevan1,3, Kitti Wing Ki Chan1*
1 Programme in Emerging Infectious Diseases, Duke–National University of Singapore Medical School, 169857 Singapore, Singapore
2Programme in Cardiovascular & Metabolic Disorders, Duke–National University of Singapore Medical School, 169857 Singapore, Singapore
3Institute for Glycomics, Griffith University, Gold Coast Campus, Queensland 4222, Australia
*For correspondence: kitti.chan@duke-nus.edu.sg
[Abstract] Dengue virus (DENV), a common and prevalent mosquito-borne endemic disease caused by four serotypes (DENV1-4), has spread rapidly on a global scale in the past decade. At present, there are no approved antiviral drugs against DENV infection. A crucial first step in antiviral drug discovery utilizes in vitro cell-based methods such as plaque assays or focus-forming assays (FFA). The sensitivity and efficiency of these assays are dependent on various factors, such as the permissibility of the cell line to virus infection as well as the plaque-forming ability of the virus strain. Therefore, there is a need to improvise the existing assays for more efficient detection of infectious virus of clinical isolates. Here, we have made slight improvements to widely used FFA protocols by reducing the number of steps and possibility of false postives. Using a pan-flavivirus Envelope (E) protein antibody, we show that the use of BHK-21 cells is preferred over Vero cells in detecting DENV1-4 plaques and focis. In particular, a DENV4 strain that does not form clear plaques was able to form clear focis using FFA. In this assay, we define the minimum number of infected cells per foci to be 8, to reduce the possibility of false positives. We outlined a protocol using the Operetta® high content imaging system to automate the digital capture of infected cells and designed a pipeline using the CellProfiler™ automated image analysis software to detect these focis. We then show a possible application of the FFA protocol in antiviral testing using NITD008 as a proof of concept. The protocol is amenable for a wide range of applications, such as high throughput compound screening (HTS) with the use of 96- and 384 wells.
[Key Features]
Focus-forming assay for quantification of DENV with improvements to reduce possibility of false positives.
Automated digital imaging process and counting of foci.
Applicable for antiviral compound screening and amenable for high-throughput screening.
Protocol can be easily modified for usage with different cell lines and different viruses such as those that do not plaque well.
[Keywords]
DENV clinical isolates; Plaque Assay; Focus-forming assay; BHK-21; Vero; Automated Imaging; Automated Foci counting; Antiviral Compound Screening
[Background] Dengue poses a colossal burden to public health systems worldwide as >40% of the global population is at risk of infection. An estimate of ~400 million people annually, of which 100 million manifests clinically, the dengue haemorrhagic fever, and 25,000 deaths have been reported yearly(Bhatt et al., 2013) (Messina et al., 2019). The need for efficient, accurate and robust infectious virus quantification assays that contribute towards antiviral drug discovery has thus increased. A variety of techniques have been explored and developed over the years, with plaque and/or focus-forming assays (FFA) still serving as the gold standard assay. Several cell lines have been used in these assays, with Vero (African Green Monkey kidney fibroblasts) cells being the most frequently used in plaque assay (Baer and Kehn-Hall, 2014). In addition, several optimization protocols for FFA have been reported for different viruses including DENV (Bolivar-Marin et al., 2022, Payne et al., 2006), however, usually requiring more steps such as usage of multiple different monoclonal antibodies for foci visualization and may result in false positive focis. Here, we outlined the steps taken for plaque assay and FFA in parallel for infectious virus quantification by E protein detection and denoted the differences between the two (Figure 1 and 2). We compared the use of Vero and BHK-21 cell lines in both plaque and FFA for all four DENV serotypes and showed that the latter is preferred over Vero cells due to clear plaque and foci formation (Figure 3). Furthermore, we have made slight improvements to the current FFA by defining a focus to consist a minimum of 8 cells for improved foci count accuracy and automated foci counting using the CellProfiler™ software (Figure 4). This method is applicable to a variety of DENV strains, including one that is unable to form distinct plaques (Figure 3). Furthermore, we demonstrated the immediate application of FFA as a tool in assessing the antiviral efficacy of compounds using a known adenosine nucleoside DENV inhibitor, NITD008 (Yin et al, 2009) as a control (Figure 5). Taken together, this FFA can be an effective and sensitive tool for not only quantifying clinical isolates but also could be useful for HTS of compounds for dengue drug discovery.
Materials and Reagents
Biological materials
Representative Dengue virus strains from EDEN study (Low et al., 2006): DENV-1 clinical isolate (EDEN1: GenBank accession EU081230), DENV-2 clinical isolate (EDEN2: GenBank accession EU081177), DENV-3 clinical isolate (EDEN3: GenBank accession EU081190), DENV-4 clinical isolate (EDEN4: GenBank accession GQ398256)
Aedes albopictus C6/36 cell line (ATCC, CRL-1660TM)
Baby Hamster Kidney fibroblast, BHK-21 (ATCC, CCL-10TM)
African Green Monkey Kidney fibroblast, Vero cell line (ATCC, CCL-81TM)
Hybridoma cells; 4G2 (ATCC, HB-112TM)
Reagents
RPMI1640 medium (Thermo Fisher Scientific, Gibco®, catalogue number: 11875093)
- DMEM (1X) medium (Thermo Fisher Scientific, Gibco®, catalogue number: 11995-040)
Heat-inactivated fetal bovine serum (FBS) (Thermo Fisher Scientific, Gibco®, catalogue number: 10082147)
200 mM L-glutamine (Thermo Fisher Scientific, Gibco®, catalogue number: 25030081)
Penicillin and streptomycin (PenStrep) (Thermo Fisher Scientific, Gibco®, catalogue number: 15140122)
1M HEPES (Thermo Fisher Scientific, Gibco®, catalogue number: 15630-080)
0.25% Trypsin-EDTA (Thermo Fisher Scientific, Gibco®, catalogue number: 25200-056)
Protein-Free hybridoma medium (PFHM-II medium) (Thermo Fisher Scientific, Gibco®, catalogue number: 12040-077)
1 × PBS (1st Base, catalogue number: BUF-2040-10X1L)
Ethanol (EtOH) Molecular Biology Grade (Merck, Sigma-Aldrich, catalogue number: 51976)
RPMI1640 powder (Thermo Fisher Scientific, Gibco®, catalogue number: 31800-022)
DMEM powder, high glucose (Thermo Fisher Scientific, Gibco®, catalogue number: 12100046)
- Tris (First BASE, catalogue number: BIO-1400)
- Glycine (Merck, Sigma-Aldrich, catalogue number: G7126)
Triton-X -100 (BioRad, catalogue number: 161-0407)
Albumin, heat shock isolation (Bio Basic, catalogue number: AD0023)
Sodium azide (Merck, Sigma-Aldrich, catalogue number: S8032)
DAPI (Merck, Sigma-Aldrich, catalogue number: D9542)
37% Formaldehyde solution (Merck, Sigma-Aldrich, catalogue number: F1635)
Crystal violet (Merck, Sigma-Aldrich, catalogue number: C3886)
Alexa Fluor TM 488 F(ab’) 2 fragment of goat anti-mouse IgG (H + L) (Thermo Fischer Scientific, Invitrogen, catalogue number: A11017)
Alexa Fluor TM 594 F(ab’) 2 fragment of goat anti-mouse IgG (H + L) (Thermo Fischer Scientific, catalogue number: A-11020)
Alexa Fluor™ 488 Phalloidin (Thermo Fisher Scientific, catalogue number: A12379)
Solutions
0.8% Methyl-cellulose medium supplemented with 2% FBS (see Recipes)
1% Crystal violet (see Recipes)
1 M Tris- HCl (pH 9.0) (see Recipes)
0.1 M glycine (pH 2.7) (see Recipes)
3.7% Formaldehyde (see Recipes)
10% Formaldehyde (see Recipes)
Recipes
0.8% methyl-cellulose medium
Add 8 g methyl-cellulose powder into 500 ml water by autoclaving twice to dissolve the powder.
Prepare 500 ml 2×RPMI 1640 or DMEM media by dissolving RPMI1640 powder or DMEM powder in water followed by supplementing with 4% heat-inactivated FBS, 4 mM L-glutamine, 200 U/ml penicillin and streptomycin, 0.075% sodium bicarbonate solution and 50 mM HEPES.
After filtration of 2× RPMI1640 or DMEM media through 0.2 μm membrane filter unit, mix well with 500 ml prepared methyl-cellulose.
Store at 4 °C.
1% crystal violet
Add 5 g Crystal violet to 100 ml 100% EtOH and mix well to dissolve powder
Add 400 ml water
Store at room temperature
0.1 M glycine (pH 2.7)
Add 3.75 g glycine into 500 ml water
Adjust the pH to 2.7 using 1 N HCl
Store the solution at 4 °C
1 M Tris-HCl (pH 9.0)
Add 30.3 g of Tris into 250 ml water
Adjust the pH to 9.0 using 1 N HCl
Store the solution at room temperature
3.7 % Formaldehyde
Add 500 ml of 37% Formaldehyde into 4500 ml of Milli-Q water
10% Formaldehyde
Add 200 ml of 37% Formaldehyde into 540 ml of Milli-Q water
Laboratory Supplies
Nunclon TM MULTIDISH 24 (Thermo Fisher Scientific, catalogue number: 142475)
Nunclon TM MULTIDISH 48 (Thermo Fisher Scientific, catalogue number: 150687)
- PerkinElmer CellCarrier-96 Ultra Microplates, treated, black, 96-well with lid
- (Genomax technologies, catalogue number: 6055302)
- Greiner Bio-One MASTERBLOCK™ 96 Deep Well Conical Bottom 2mL Storage Plate (Fisher scientific: 07-000-873)
CryoTubes vials for freezing viruses (Thermo Fisher Scientific, Thermo ScientificTM, catalogue number: 368632)
- 175cm2 angled-neck easy flasks (Nunc, catalogue number: 159920)
50ml Centrifuge tubes (BD Falcon, catalogue number: 357550)
Filter Unit 0.45µm (Merck, Sigma-Aldrich, Millex®-HP, catalogue number: SLHPR33RS)
Filter unit 0.2 μm (Thermo Fisher Scientific, Thermo ScientificTM, catalogue number: 567-0020)
HiTrap Protein G HP-5 ml (GE Healthcare, catalogue number: 170-0405-01)
Snakeskin dialysis tubing 10kDa (Thermo Fisher Scientific, Thermo ScientificTM, catalogue number: 68100)
15ml Centrifuge tubes (Merck, Sigma-Aldrich, catalogue number: CLS430791)
Aluminium foil
Equipment
Incubator (SANYO) without CO2 atmosphere at 28 °C
Humidified incubator (NUAIRE) with 5% CO2 atmosphere at 37 °C
VACUSAFE Aspiration System (Integra Biosciences, model: 158310)
ProBlot™ 25 Economy Rocker Single Platform (Bio Laboratories, model: S2025-B-230V)
Operetta® High Content Imaging System (PerkinElmer®, model: Operetta)
Cermax® Xenon Fiber-Optic Light source (Excelitas® technologies, model: XL3000)
DELL computerSwinging rotor centrifuge (for cells) (Thermo electron)
-80 °C freezer (Thermo Fisher Scientific)
Visi-White Transilluminator (Analytik Jena US, model: TW-26)
Autoclave (TOMY, model: SX-700)
AKTApurifierTM UPC 10 (GE Healthcare, catalogue number: 28406268)
pH meter (Satorius)
NanoDrop 2000 spectrophotometer (Thermo Fisher Scientific)
Software
Harmony 4.8
CellProfiler
GraphPad prism
Procedure
Generation of DENV stocks
Grow C6/36 cells in a 175 cm2 flask with RPMI1640 medium supplemented with 10% FBS, 2 mM L-glutamine, 100 U/ml penicillin and streptomycin and 25 mM HEPES and incubate at 28 °C under non-CO2 atmosphere condition until ~90% confluency.
Note: Growth media supplemented with 20% FBS improves cell growth if C6/36 cells do not proliferate desirably.
Thaw virus stock and dilute with serum-free RPMI 1640 medium.
Remove medium from culture flask and inoculate with 10 ml of virus inoculum at MOI of 0.1 into 175 cm2 flask.
Incubate for 1 h at 28 °C under non-CO2 atmosphere condition.
Discard virus inoculum and add 25 ml RPMI1640 medium supplemented with 2% FBS into the 175 cm2 flask.
Incubate for 5-7 days at 28 °C under non CO2 atmosphere condition.
Note: Cytopathic effect is observed depending on virus strain (seen in DENV2 infection but not in the other DENV strains infection). Check virus titer in the supernatant at different time point to determine the optimal day to obtain high virus titer. Incubation periods are recommended as such: 5 days for DENV2 and 7 days for DENV1, 3 and 4.
Scrape cells and transfer into a centrifuge tube.
Spin down the cells at 1,800 × g for 10 min at 4 °C, collect the supernatant and transfer into a fresh tube through a 0.45 μm membrane filter.
Aliquot virus supernatant into cryotubes and store in a -80 °C freezer until use.
Determination of viral titer by plaque assay
Grow BHK-21 cells in RPMI1640 supplemented with 10% FBS, 2 mM L-glutamine and 100 U/ml penicillin and streptomycin or Vero cells in DMEM supplemented with 10% FBS, 4.5 g/L D-glucose, 2 mM L-Glutamine and 110mg/L Sodium Pyruvate and 100 U/ml penicillin and streptomycin in a humidified incubator with 5% CO2 atmosphere at 37 °C.
Seed cells at 2 × 10⁵ cells per well in 500 μl into a 24-well plate.
Note: Cells may be seeded at 5 × 10⁴ or 2 × 10⁴ cells per well in 500 μl for 100% confluency prior to infection after 2 days or 3 days incubation respectively. Gently move the plate using short, back-and-forth and side to side motions prior to placing into incubator to ensure even distribution of cells. Repeat after 15 minutes if needed and ensure gentle closing and opening of incubator door thereafter to prevent cell aggregation.
Incubate cells overnight at 37 °C in 5% CO2 incubator to allow cells to attach and reach 100% confluency.
Dilute virus in a series of 10-fold dilutions in serum-free RPMI1640 or DMEM.
Note: Dilution in microfuge or centrifuge tubes are preferred to enable vortexing and spinning down in centrifuge after diluting for a homogenous suspension. If unable to dilute in tubes, re-suspend virus suspension with a pipette for a minimum of 30 times upon diluting.
Discard culture supernatant of BHK-21 cells or Vero cells and add 200 μl of diluted virus into each well.
Note: Virus should be added immediately after removing culture supernatant to avoid cells drying out.
Incubate the plate for 1 h at 37 °C in 5% CO2 incubator.
Note: Pre-equilibrate the 0.8% Methyl-cellulose medium supplemented with 2% FBS to room temperature prior to use.
Discard virus and overlay the cells with 500 μl of 0.8% Methyl-cellulose medium supplemented with 2% FBS.
Note: Methyl-cellulose medium is viscous, hence it is recommended to use Pasteur pipette for overlaying the medium to the cells.
Incubate plate for 4-8 days at 37 °C in 5% CO2 incubator.
Note: The plaque size is affected by virus replication rate. Check the plaque size visually before fixation to obtain clear plaque morphology. BHK-21-seeded plates of DENV1 infection are normally incubated until day 4 post-infection, whereas plates of DENV2-4 are usually incubated until day 5 post-infection. Vero seeded plates of DENV1,3,4 infection was incubated for 8 days and DENV2 was incubated for 5 days. However, it is recommended to incubate Vero-seeded plates of DENV2 infection for more than 5 days as plaques were small.
Fix cells with 3.7% formaldehyde (diluted in Milli-Q water) for a minimum of 3 hours.
Note: Fixation overnight may be required if 3.7% formaldehyde is not freshly made.
Rinse the plate with copious amount of running water to remove Methyl-cellulose medium completely.
Add 1-2 drops of 1% crystal violet into each well and stain for 1 min.
Rinse the plate with copious amount of running water to remove the excess crystal violet stain.
Air dry plates on a paper towel.
Visualize plaques using the White Light Transilluminator apparatus and count the number of plaques for determination of virus titer as follows:
Virus titer [plaque-forming units (pfu)/ml] = average number of plaques × 1000 µl/200µl inoculum × reciprocal of dilution factor
Preparation of α-DENV E protein antibodies (4G2) from hybridoma cells
Culture 4G2 hybridoma cells in 50 ml of PFHM-II (Protein-Free hybridoma Medium) in 175 cm2 flasks in humidified incubator with 5% CO2 atmosphere at 37 °C.
Note: It is recommended to culture the cells in RPMI1640 supplemented with 10% FBS, 2 mM L-glutamine and 100 U/ml penicillin and streptomycin during the initial period of several days after thawing cells. Once the cells grow well, replace the media gradually by increasing the proportion of PFHM-II media:RPMI1640 from 10% (vol/vol) to finally 100% PFHM-II media.
Collect cell suspension into a centrifugal tube when the cells become confluent (the color of culture media turns to orange or yellow).
Centrifuge cells at 900 × g for 5 min at room temperature.
Collect the supernatant and stored at 4 °C without filtration until enough amount of supernatant is obtained.
Continue culturing the cells and repeat steps C2-4 if a large amount of the supernatant is required.
Filter the supernatant through a 0.2 μm membrane filter unit.
Load the 4G2 supernatant onto a 5 ml Protein G column pre-equilibrated in pH 7.2 PBS.
Note: 4G2 antibody is purified using the AKTApurifier. Refer to the manufacturer’s instruction guides regarding sample loading specifications.
Wash the column with PBS using 5× the column volume (i.e. 25 ml).
Prepare a Grenier 96-well master block containing 60 μl 1 M Tris-HCl pH 9.0 for collection.
Note: The standard ratio of Tris-HCl to glycine (100:6) for neutralization is subjected to change depending on the concentration of buffers prepared. Volume of Tris-HCl to be added required for neutralization (pH 7) can be adjusted by pH paper testing.
Elute antibodies using 100% 0.1 M glycine pH 2.7 and collect 1 ml fractions into the wells of the block.
Note: Check the purity of the antibody by running a SDS-PAGE.
Select fractions of high purity and collect into a dialysis membrane, and then dialyse against PBS overnight.
Quantitate the concentration of the purified antibody using NanoDrop.
D. Determination of viral titer by FFA
(I) Preparation of FFA samples for image acquisition
Maintain BHK-21 cells in RPMI1640 supplemented with 10% FBS, 2 mM L-glutamine and 100 U/ml penicillin and streptomycin or Vero cells in DMEM supplemented with 10% FBS, 4.5 g/L D-glucose, L-Glutamine and 110mg/L Sodium Pyruvate and 100 U/ml penicillin and streptomycin in a humidified incubator with 5% CO2 atmosphere at 37 °C.
Seed cells at 5 × 10⁴ cells per well in 100 μl into the PerkinElmer CellCarrier-96 Ultra Microplates.
Note: Cells may be seeded at 1.25 × 10⁴ or 5 × 10³ cells per well in 100 μl for 100% confluency prior to infection after 2 days or 3 days incubation respectively. A single cell monolayer formation is crucial to allow capture of focused images for accurate analysis.
Incubate cells overnight at 37 °C in 5% CO2 incubator to allow cells to adhere and reach 100% confluency.
Prepare 10-fold serial dilutions of virus in serum-free RPMI1640 or DMEM.
Remove culture supernatant of BHK-21 cells or Vero cells and add 50 μl of diluted virus into each well.
Note: Virus should be added immediately after removing culture supernatant to avoid cells drying out.
Incubate the plate for exactly 1 h at 37 °C in 5% CO2 incubator.
Remove virus and add 125 μl of 0.8% Methyl-cellulose medium supplemented with 2% FBS. Incubate the plates with infected BHK-21 cells at 37°C in 5% CO2 incubator for 2 days.
Note: Plates with infected Vero cells will require more than 2 days incubation as focis were not as clear as those seen in BHK-21 with mostly single cell infections observed (Figure 2).
Add 100 µl/well of 10% Formaldehyde (diluted in Milli-Q water) and incubate for 1 hour at room temperature OR 20 minutes in the 37ᵒC incubator.
Wash off the 10% Formaldehyde thoroughly with copious amount of water in a container. Shake the plate robustly to remove Methyl-cellulose medium completely.
Add 100 µl/well of 0.2% Triton-X-100 in PBS and incubate on ProBlot™ 25 economy rocker with maximum speed at room temperature for 20 minutes.
Discard 0.2% Triton-X-100 in 1 × PBS and wash wells 3 times with 1×PBS.
Note: Remove as much 1×PBS as possible when washing each time and avoid drying of cells by ensuring wells are always filled with 1×PBS.
- Add 125 µl/well of 1% BSA in 1 × PBS and incubate on ProBlot™ 25 economy rocker with maximum speed at room temperature for 1-2 hours.
- Discard 1% BSA in 1×PBS and wash wells 3 times with 1× PBS.
Add 50 µl/well purified mouse anti-E 4G2 Antibody (final concentration of 2 µg/ml) in 1% BSA/PBS and incubate for at least 1 hour on ProBlot™ 25 economy rocker with speed at 60-70 rpm at room temperature or overnight at 4ᵒC.
Collect the purified mouse anti-E 4G2 antibody from each well in a new tube after incubation and keep at -30°C.
Note: Diluted antibody can be reused approximately 2-3 times.
Wash wells 3 times with 1× PBS.
Add 50 µl/well of Alexa FluorTM 488 goat anti-mouse antibody with a 1:1000 dilution in 1% BSA/PBS and incubate for 1 hour on ProBlot™ 25 economy rocker with speed at 60-70 at room temperature.
Note: Protect antibody and sample plate from light by wrapping tube holding diluted antibody and sample plates with aluminium foil from this step onwards. Do not incubate for more than an hour as this may result in high background signal.
Remove the secondary antibody (Alexa FluorTM 488 goat anti-mouse antibody) and wash wells 3 times with 1×PBS.
Add 50 µl/well of DAPI at 1:10000 dilution and incubate for 5 minutes on ProBlot™ 25 economy rocker at room temperature in the dark.
Wash wells 3 times with 1× PBS.
Maintain wells in approximately 125 µl of 1×PBS at 4°C until imaging.
Image acquisition from FFA samples using the Operetta® high content imaging system
1. Place microplate with FFA samples into the instrument.
Note: Ensure the light on the instrument turns blue before opening lid and inserting microplate.
2. Select the ‘Setup’ tab and choose the following parameters:
Plate Type: 96 PerkinElmer CellCarrier Ultra
Objective: 20 × high NA
Note: Magnification of objective used affects the imaging of whole wells and time taken to acquire image. Choose a high magnification objective for whole well imaging, however, more time will be needed for acquisition. The automated SV Foci Counter pipeline designed has been optimized for analysis of images captured with the 20 × high NA objective.
Optical (Opt.) Mode: Non-Confocal
Excitation: 50%
Transmission: 0%
Select channels:
Alexa 488:
Time: 20 ms
Height: 0.0 µM
Note: Time (ms) refers to the exposure time that contributes to determining the brightness of the image. The exposure time may require adjustment due to batch-to-batch variability in staining intensity. Height (µM) refers to the focus height above the plate bottom. The height indicated here is the default setting and may require amendment to achieve a more focused image.
II. DAPI:
Time: 10 ms
Height: 0.0 µM
Layout selection:
Number of wells: 96
Well:
Number of Fields: 97
Overlap: 0%
Stack:
First plane at: 0.0 µM
Number of planes: 0
Distance: 0.0 µM
Last plane at: 0.0 µM
Overall height: 0.0 µM
Image control:
Coloring: Highlight
Flatfield Correction: None
Select the ‘Run Experiment’ tab and press start.
Determination of focus-forming units (FFU) by CellProfiler
Note: See supplementary materials for example customized image analysis pipeline termed ‘SV Foci Counter’.
Load images in CellProfiler and categorize images split into DAPI- and corresponding Alexa FluorTM 488- labelled images as ‘Nuclei’ and ‘Foci’ under ‘NamesAndTypes’ function.
Add the following modules and customize respective settings:
CropGreen and CropBlue
Cropping shape: Rectangle
Cropping method: Coordinates
Apply which cycle’s cropping pattern: Every
Left and right rectangle positions: 0 - end – Absolute
Top and bottom rectangle positions: 0 - end – Absolute
Remove empty rows and columns: All
Identify Primary Objects:
Use advanced settings: Yes
Select the input image and name the primary objects to be identified: Foci
Typical diameter of objects in pixel units (Min,Max): 10, 1000
Note: Diameter of foci was estimated based on 8 cells minimum per foci.
Discard objects outside the diameter range: Yes
Discard objects touching the border of the image: No
Threshold strategy: Global
Thresholding method: Manual
Manual threshold: 0.1 – 0.16
Note: Depending on quality of antibody staining done, there may be a need to adjust the threshold correspondingly.
Threshold smoothing scale: 1.3488
Method to distinguish clumped objects: Intensity
Method to draw dividing lines between clumped objects: Shape
Automatically calculate size of smoothing filter for declumping: Yes
Automatically calculate minimum allowed distance between local maxima: Yes
Speed up by using lower-resolution image to find local maxima: Yes
Display accepted local maxima: No
Fill holes in identified objects: After both thresholding and declumping
Handling of objects if excessive number of objects identified: Continue
Export to spreadsheet
Data analysis
Dose-response analysis for half maximal effective concentration (EC50) determination can be performed plotting the dose-response curve using the GraphPad Prism software.
Representative data
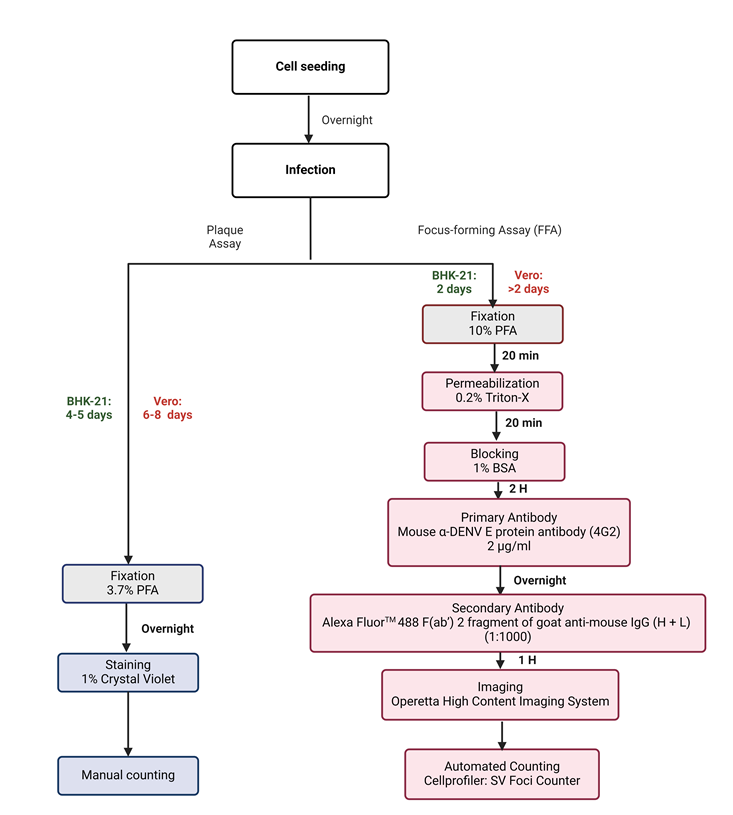
Figure 1. Schematic flow chart of the experimental design used to establish Infectious virus quantification. (A) Sequential steps used during plaque and focus-forming assay to quantify DENV1-4 clinical isolate titers. Following BHK-21 or Vero cell seeding onto 24- or 96-well plate, plates were incubated overnight at 37 °C in 5% CO2 for the formation of a cell monolayer. Cells were infected with the respective virus and incubated similarly for 4-5 days (BHK-21) and 6-8 days (Vero) for plaque assay, and 2 days for both BHK-21 and Vero FFA plates respectively. Plaque assay plates were fixed in 3.7% (overnight), stained with 1% Crystal violet, and plaques were counted manually. On the other hand, FFA plates were fixed in 10% Formaldehyde, permeabilized with 0.2% Triton X, blocked with 1% BSA, and probed with α-DENV E protein (4G2) (overnight) followed by addition of Alexa-FluorTM 488 antibodies. Plates were then imaged using the Operetta High Content Imaging System and focis counted using the automated SV Foci Counter imaging pipeline.
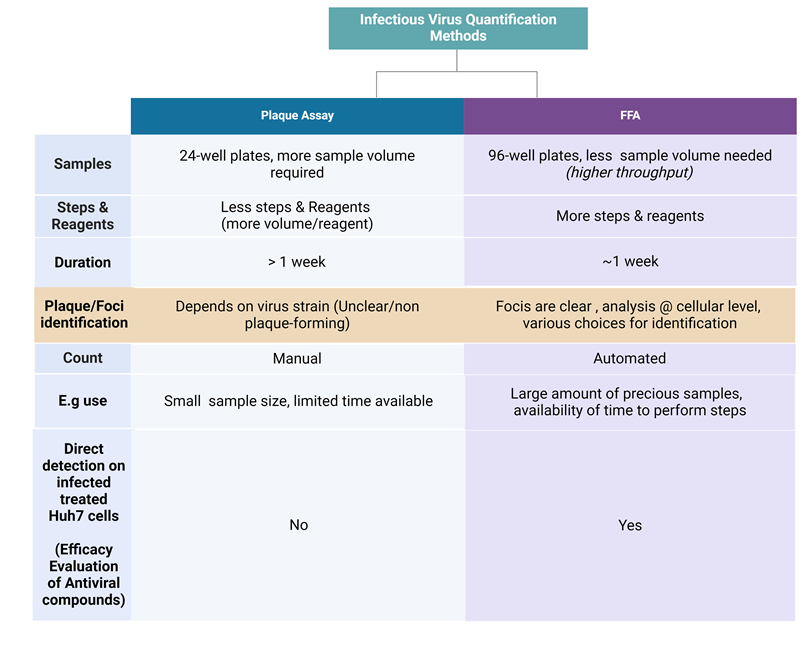
Figure 2. Comparison between plaque Assay and the improved Focus-forming assay. Table denotes the difference between these two assays with respect to virus quantification from the clinical perspective where virus quantification is critical. FFA has the high credential in such scenario, and serves as a useful tool.
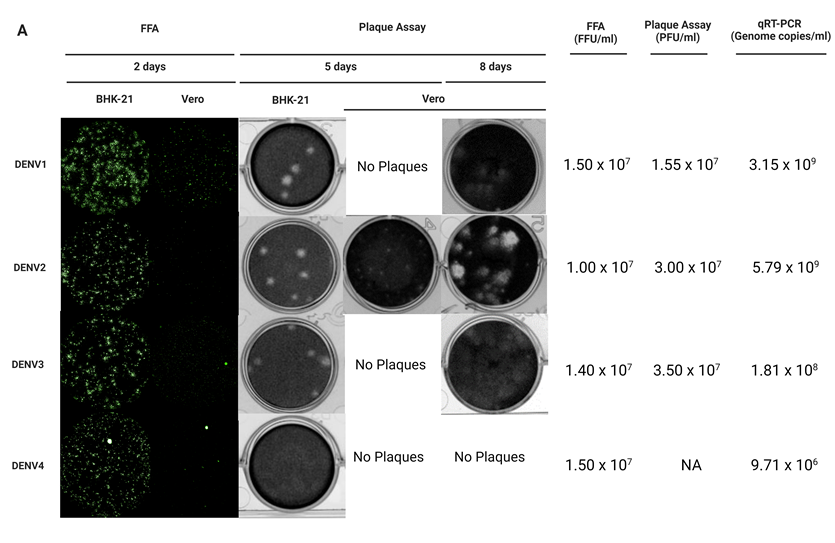
Figure 3. BHK-21 and Vero cell lines serve as in vitro cell-based infection models for DENV1-4 clinical isolates quantification. (A) BHK-21 and Vero cells were used as in vitro infection models to quantify infectious virus production by plaque assay and FFA. Viral genomic copies were detected by quantitative reverse transcription polymerase chain reaction (qRT-PCR) as a positive indication of infection. After 2 days of incubation*, DENV1-4 focis in BHK-21 were clearer, brighter and larger compared to the focis seen in Vero cells for all the clinical isolates. DENV1 formed larger focis in both BHK-21 and Vero cells while single cell infections were seen mostly for DENV2 and DENV4 in Vero cells. Dashed circles indicate representative foci for each serotype in the different cell lines. After 5 days of incubation, DENV1-3 plaques were clear and large while DENV4 formed unclear plaques in BHK-21. No plaques were seen for DENV1, DENV3, DENV4 however small plaques were seen for DENV2 in Vero after 5 days. Plaques for DENV1-3 in Vero cells were seen after 8 days of incubation. In addition, the presence of DENV1-4 viral RNA were detected in respective samples. Of note, the BHK-21 infectious model is more efficient and is preferred over Vero and FFA is a viable alternative to detect DENV4 that do not form proper plaques. *All plates were incubated at 37 °C in 5% CO2; FFU/ml, Focus-forming unit/ml; PFU/ml, Plaque-forming unit/ml. Green: E protein.
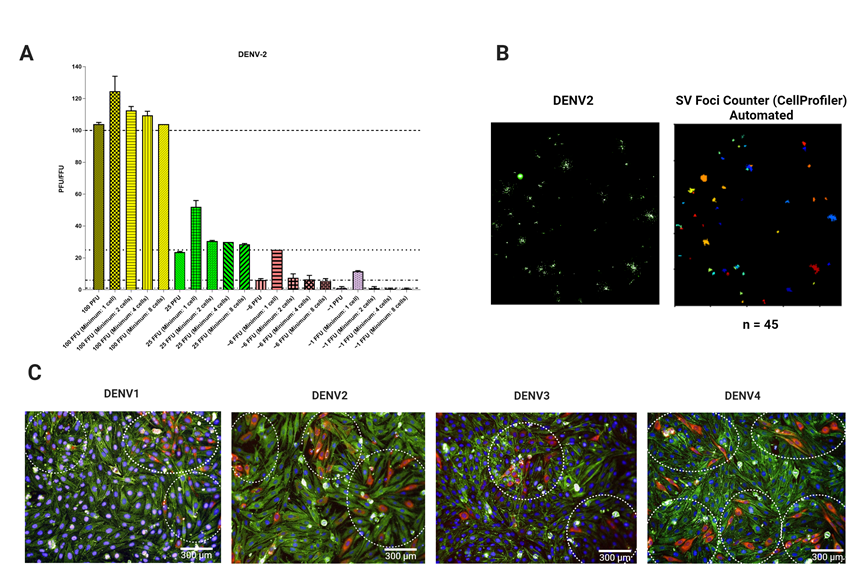
Figure 4. Foci characterization in the BHK-21 infectious model. (A) Correlation between the number of plaque-forming units (PFU) and foci. 100 PFU of DENV2 were added to a BHK-21 cell monolayer and plaque assay and FFA were performed. The number of plaques and foci were counted manually. Foci were counted using 1,2, 4 and 8 infected cells as a minimum per foci. As indicated in the bar diagram (dotted lines), the foci counted with a minimum of 8 cells showed a higher correlation to PFUs. Larger focis may also be consisting of cells that are more than 8 and may appear fusing together. In this case, the focis will still be regarded as two separate focis. (B) Automated foci counting using the SV foci counter designed using CellProfiler. Using the SV foci counter imaging pipeline with the estimated size of 8 cells per foci, a foci plot was generated and the number of foci counted automatically. n = number of foci. (C) Representative images of DENV1 – 4 individual focis using 20× Objective. Dotted circles indicate the focis for DENV1-4 shown and are quantified as follows: 3, 3, 2 and 5 respectively. Red: E Protein; Green: f-actin; Blue: Nuclei. Scale bar: 300 µm.
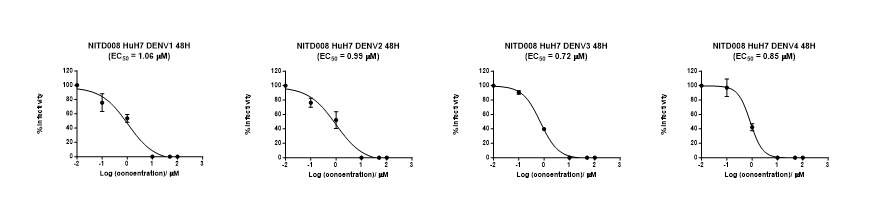
Figure 5. Application of the BHK-21 infectious model in evaluating the efficacy of antiviral compound NITD008 against DENV1-4 clinical isolate using FFA. Huh7 cells were infected with DENV1-4 at a multiplicity of infection (MOI) of 0.3 and subsequently treated with different concentrations of NITD008 (100 µM, 50 µM, 10 µM, 1 µM, 0.1 µM, 0.01 µM respectively) for 48 hours. Post 48 hours, viral supernatants were assayed on BHK-21 cells for FFA to estimate virus titers. The half-maximal effective concentration (EC50) of NITD008 was calculated through the plotting of a sigmoidal dose-response curve using GraphPad Prism. The known EC50 of NITD008 lies between the range of 0.16 – 2.61 µM(Yin et al., 2009, Touret et al., 2019), and the range of calculated EC50 from both assays was 0.62 – 1.18 µM indicating the efficiency of FFA. The data was obtained from three biological replicates and reproducibility was verified by an independent experimenter.
Supplementary materials
SV foci counter
(Unable to add CellProfiler pipeline in)
Acknowledgments
I would like to acknowledge and give my warmest thanks to all the members of Subhash Vasudevan’s laboratory without whom, the protocol established would have not been possible.
References
BAER, A. & KEHN-HALL, K. 2014. Viral concentration determination through plaque assays: using traditional and novel overlay systems. J Vis Exp, e52065.
BHATT, S., GETHING, P. W., BRADY, O. J., MESSINA, J. P., FARLOW, A. W., MOYES, C. L., DRAKE, J. M., BROWNSTEIN, J. S., HOEN, A. G., SANKOH, O., MYERS, M. F., GEORGE, D. B., JAENISCH, T., WINT, G. R., SIMMONS, C. P., SCOTT, T. W., FARRAR, J. J. & HAY, S. I. 2013. The global distribution and burden of dengue. Nature, 496, 504-7.
BOLIVAR-MARIN, S., BOSCH, I. & NARVAEZ, C. F. 2022. Combination of the Focus-Forming Assay and Digital Automated Imaging Analysis for the Detection of Dengue and Zika Viral Loads in Cultures and Acute Disease. J Trop Med, 2022, 2177183.
LOW, J. G., OOI, E. E., TOLFVENSTAM, T., LEO, Y. S., HIBBERD, M. L., NG, L. C., LAI, Y. L., YAP, G. S., LI, C. S., VASUDEVAN, S. G. & ONG, A. 2006. Early Dengue infection and outcome study (EDEN) - study design and preliminary findings. Ann Acad Med Singap, 35, 783-9.
MESSINA, J. P., BRADY, O. J., GOLDING, N., KRAEMER, M. U. G., WINT, G. R. W., RAY, S. E., PIGOTT, D. M., SHEARER, F. M., JOHNSON, K., EARL, L., MARCZAK, L. B., SHIRUDE, S., DAVIS WEAVER, N., GILBERT, M., VELAYUDHAN, R., JONES, P., JAENISCH, T., SCOTT, T. W., REINER, R. C., JR. & HAY, S. I. 2019. The current and future global distribution and population at risk of dengue. Nat Microbiol, 4, 1508-1515.
PAYNE, A. F., BINDUGA-GAJEWSKA, I., KAUFFMAN, E. B. & KRAMER, L. D. 2006. Quantitation of flaviviruses by fluorescent focus assay. J Virol Methods, 134, 183-9.
TOURET, F., BARONTI, C., GOETHALS, O., VAN LOOCK, M., DE LAMBALLERIE, X. & QUERAT, G. 2019. Phylogenetically based establishment of a dengue virus panel, representing all available genotypes, as a tool in dengue drug discovery. Antiviral Res, 168, 109-113.
YIN, Z., CHEN, Y. L., SCHUL, W., WANG, Q. Y., GU, F., DURAISWAMY, J., KONDREDDI, R. R., NIYOMRATTANAKIT, P., LAKSHMINARAYANA, S. B., GOH, A., XU, H. Y., LIU, W., LIU, B., LIM, J. Y., NG, C. Y., QING, M., LIM, C. C., YIP, A., WANG, G., CHAN, W. L., TAN, H. P., LIN, K., ZHANG, B., ZOU, G., BERNARD, K. A., GARRETT, C., BELTZ, K., DONG, M., WEAVER, M., HE, H., PICHOTA, A., DARTOIS, V., KELLER, T. H. & SHI, P. Y. 2009. An adenosine nucleoside inhibitor of dengue virus. Proc Natl Acad Sci U S A, 106, 20435-9.
- Mahid, M B, Chan, K W, Bist, P, Sigmundsson, K, Mohd Mazlan, M B, Watanabe, S, Choy, M M and Vasudevan, S G(2024). Quantification of Dengue Virus infectivity in cell lines. Bio-protocol Preprint. bio-protocol.org/prep2647.
Do you have any questions about this protocol?
Post your question to gather feedback from the community. We will also invite the authors of this article to respond.