
- Home
- Protocols

-

Image analyses
Last updated date: Mar 9, 2020 Views: 1180 Forks: 0
IMAGE ANALYSES
Image Pro Plus 6.0 program was used for all the quantifications of focal adhesion and stress fiber properties.
LENGTH OF DORSAL STRESS FIBERS
Dorsal stress fiber lengths from fixed ctrl or ML-7-, Y27632-, KT5823- or Compound C-treated as well as Rif-TN-transfected cells (Figure 5A-B and-E; Figure 9C-D; Figure2-Figure supplement 3 and Figure2-Figure supplement 4) were analysed from at least 12 cells and 3 fibers per each cell (exact numbers for each experiment are indicated in the figure legends). Measurement was performed by drawing a line along the measured dorsal stress fibers in Image Pro. The length was received in pixels and was automatically converted to um.
FOCAL ADHESION ANGLE AND ALIGNMENT
Live cell imaging was utilized to follow focal adhesions along the formation of ventral stress fibers from the stress fiber precursor structures (Figure2 – Figure supplement 1A). GFP-paxillin was used to visualize adhesion sites together with mCherry-Actin that was used to detect arc fusion. Specific adhesions at the sides of the cells were followed until the arcs were fused into mature ventral stress fibers. Three image frames from the videos were chosen from specific time points. Lines were drawn on top of the adhesion sites (Line direction demonstrated by the red arrows next to the adhesions in images) and angle change of the adhesions along time was calculated with Image Pro Plus 6. Angle change in the focal adhesions was calculated in between the first and third images. Angles were calculated as the change in between the Similarly, angle change of the adhesions was calculated from frames of live cell imaging experiments of GFP-CaP3 (Figure2 –Figure supplement 1B). Individual adhesions, bound to fusing transverse arc network at the sides of the cell, were imaged and analysed as explained above.
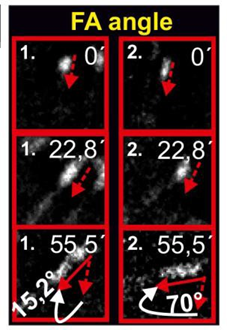
Panel from Figure2- Figure supplement 1A
MEASUREMENT OF P-VASP INTENSITY AND LOCALIZATION OF VASP
Intensity of VASP in immunofluorescence stainings as well as its co-localization with focal adhesion protein zyxin in the adhesion sites were analysed with line profiles in Image Pro Plus 6 (Figure 4A- B and D-E). For the analyses of VASP localization (Figure 4A-B), immunofluorescence images of VASP, zyxing and phalloidin-stained U2OS cells were imported to Image Pro and lineprofiles were drawn along the tips of dorsal stress fibers and ventral stress fibers. The lineprofiles were drawn so that they contained both the adhesion sites and part the fiber underneath the adhesion site. Intensity peaks along these lineprofiles indicate that VASP and zyxin colocalize in both dorsal stress fiber- and ventral stress fiber-associated focal adhesion sites (see Figure 4B).
The acquired immunofluorescence images of P-VASP/phalloidin stainings were analysed for the intensity of phospho-VASP in the dorsal stress fiber- and ventral stress fiber-associated adhesions (Figure 4D-E). Lineprofiles were drawn in Image Pro so that they connect and span two adjacent dorsal stress fiber- or ventral stress fiber-linked focal adhesions (as indicated with the yellow line in Figure 4D). Intensity peaks in phalloidin stainings (green) represent these adhesion sites (Figure 4E). The corresponding P-VASP intensity values at the adhesion sites were divided with the intensity values for phalloidin, to enable the comparison of P-VASP intensities in between the dorsal –and ventral stress fiber-associated adhesions. The received values for ventral stress fiber adhesions were normalized to 1 and values for dorsal stress fibers were normalized accordingly.
LATERAL FUSION AND PERIODIC SPACING OF TRANSVERSE ARCS ALONG THEIR FLOW TOWARDS THE CELL CENTER
Flow, lateral fusion and spacing of the periodic pattern of transverse arcs was followed in live cell imaging experiments (Figures 1B-D and Figure1-Figure supplement 1B-C) with GFP-CaP3, GFP- Actin or combination of CFP-α-actinin and YFP-Tm4. Image frames from CaP3 live cell videos were utilized for following the spacing in between specific CaP3 dots within the arcs. Lineprofiles were drawn in Image Pro Plus 6 in between two adjacent dots and the distance in between the intensity peaks of these dots was measured in pixels and converted to nm. Such measurements were performed for four distinct time points (as presented in Figure1- Figure supplement 1C). Similarly, line profiles were drawn along the periodic pattern of transverse arcs, visualized by GFP-CaP3 in fixed U2OS cells (Figure1-Figure supplement 1D) at three different distances from the leading edge of the cell. Utilized lineprofile length was 60 pixels. Frequency in between the intensity peaks along these line profiles is shown in Figure1-Figure supplement 1D.
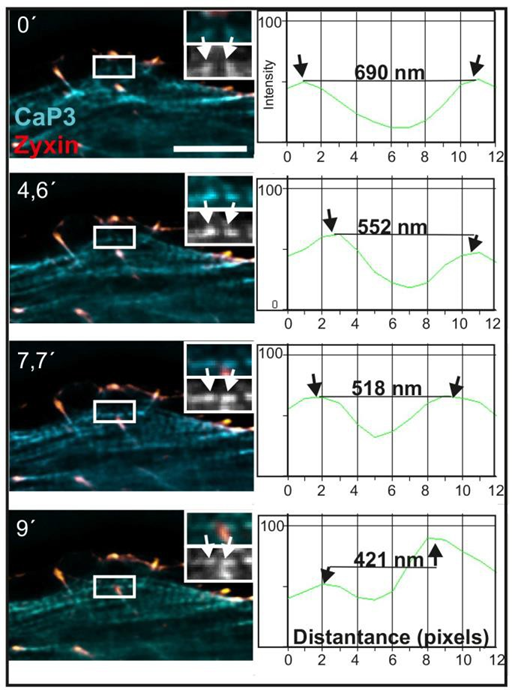
Figure1-Figure supplement 1C
- Tojkander, S(2020). Image analyses. Bio-protocol Preprint. bio-protocol.org/prep240.
- Tojkander, S., Gateva, G., Husain, A., Krishnan, R. and Lappalainen, P.(2015). Generation of contractile actomyosin bundles depends on mechanosensitive actin filament assembly and disassembly. eLife. DOI: 10.7554/eLife.06126
Category
Do you have any questions about this protocol?
Post your question to gather feedback from the community. We will also invite the authors of this article to respond.