
- Home
- Protocols

-

Lipid Quantification in Caenorhabditis elegans by Nile Red and Oil Red O Staining
Last updated date: Sep 23, 2021 Views: 1636 Forks: 0
Lipid Quantification in Caenorhabditis elegans by Nile Red and Oil Red O Staining
Nicole L. Stuhr1,2,#, James D. Nhan1,2,#, Amy M. Hammerquist1,2, Bennett Van Camp1, David Reoyo1, and Sean P. Curran1,2,3, *
1Leonard Davis School of Gerontology, University of Southern California, Los Angeles, United States; 2Department of Molecular and Computational Biology, Dornsife College of Letters, Arts and Science, University of Southern California, Los Angeles, United States; 3Norris Comprehensive Cancer Center, Keck School of Medicine, University of Southern California, Los Angeles, United States
*For correspondence: spcurran@usc.edu
#Contributed equally to this work
[Abstract] The ability to stain lipid stores in vivo allows for the facile assessment of metabolic status in individuals of a population following genetic and environment manipulation or pharmacological treatment. In the animal model, Caenorhabditis elegans, lipids are stored in and mobilized from intracellular lipid droplets in the intestinal and hypodermal tissues. The abundance, size, and distribution of these lipids can be readily assessed by two staining methods for neutral lipids: Oil Red O, which can define tissue distribution and lipid droplet size or Nile Red, which can also quantitatively measure lipid droplet abundance. C. elegans are a useful animal model in studying pathways relating to aging, fat storage, and metabolism whose transparent nature allows for easy microscopic assessment of lipid droplets. This is done by fixation and permeabilization, staining with NR or ORO, image capture on a microscope, and computational identification and quantification of lipid droplets in individuals within a cohort. To ensure reproducibility of measures of lipid, we provide a detailed protocol to measure intracellular lipid dynamics in C. elegans.
Graphic abstract:

Keywords: Lipids, C. elegans, Fat, Distribution, Abundance, Age-dependent somatic depletion of fat (Asdf), Nile Red, Oil Red O
[Background] In C. elegans, lipid homeostasis is one of the many cellular processes that declines with age (Lynn et al. 2015, Johnson et al. 2019, Hammerquist et al. 2021). C. elegans are a popular model organism to study lipid metabolism because of the multiple techniques that have been developed to determine lipid content of worms (Zhang et al. 2013). Analysis of specific lipid species can be conducted with the use of high-performance liquid chromatography-mass spectrometry and gas-chromatography-mass spectrometry (Castro et al. 2012, Pino et al. 2013). Although useful in determining lipid extract complexity, these methods require time for analysis and expensive machinery that isn’t readily available. Here we describe two methods that take advantage of the transparency of the worm for visualizing the amount and tissue distribution of intracellular lipids. C. elegans can be stained with many lipophilic dyes; two of the most readily available, easy-to-use, and biochemically validated compounds are Nile Red and Oil Red O (Pino et al. 2013, Pang et al. 2014, Lynn et al. 2015, Webster et al. 2017, Stuhr et al. 2020). Nile Red, 9-diethylamino-5H-benzo[α]phenoxazine-5-one, is a lipophilic dye that stains intracellular neutral lipid droplets (Greenspan et al. 1985). Nile Red allows for the quantification of lipid abundance due to the emition of green light following excitation. Oil Red O is a fat-soluble dye that stains neutral lipids a bright red color, allowing for qualitative assessment of lipid droplet size and lipid distribution (O'Rourke et al. 2009). Staining C. elegans with these two different dyes allows for the determination of alterations in quantity and distribution of lipids.
Materials and Reagents
- Microscope slides (VWR, catalog number: 48312-004)
- Sterile 6 cm Petri dishes (VWR, catalog number: 25373-085)
- Platinum wire (Tritech Research, catalog number: PT-9010)
- Eyelash brush (consisting of a human eyelash attached to a Pasteur pipette, generic, with tape, generic)
- Microscope slide cover slips (VWR, catalog number: 48366-227)
- Parafilm (Sigma-Aldrich, catalog number: P7543)
- 200 μl micropipette tips (Genesee Scientific, catalog number: 24-151RL)
- 1000 μl micropipette tips (Genesee Scientific, catalog number: 23-165R)
- E. coli OP50-1 (available from Caenorhabditis Genetics Center)
- Worm strains (available from Caenorhabditis Genetics Center)
- Sodium Chloride (Fisher Scientific, catalog number: 02-004-047)
- Peptone (BD, catalog number: 211820)
- Bacto Agar (BD, catalog number: 214040)
- Cholesterol (Sigma-Aldrich, catalog number: C8667)
- Ethanol (VWR, catalog number: 89125-172)
- Calcium Chloride (Sigma-Aldrich, catalog number: C3881)
- Magnesium Sulfate (Sigma-Aldrich, catalog number: M2773)
- Potassium Phosphate dibasic (Sigma-Aldrich, catalog number: P5504)
- Potassium Phosphate monobasic (Sigma-Aldrich, catalog number: P0662)
- Streptomycin sulfate (Sigma-Aldrich, catalog number: S6501)
- LB powder (Teknova, catalog number: L9315)
- Potassium Chloride (Sigma-Aldrich, catalog number: P3911)
- Triton X-100 (Sigma-Aldrich, catalog number: X100-100 ml)
- Isopropanol (BHD, catalog number: BDH1133)
- DAPI (Sigma-Aldrich, catalog number: D9542)
- Dimethyl sulfoxide (DMSO) (Sigma-Aldrich, catalog number: D2650-5X10ML)
- Nail Polish (clear, generic)
- Oil Red O (Alfa Aesar, catalog number: A12989)
- Nile Red for microscopy (Sigma-Aldrich, catalog number: 72485)
- Acetone 99.5% (BDH, catalog number: 1101-1LP)
- 15 ml Centrifuge Tubes with EZ Flip Cap (ThermoFisher Scientific, catalog number: 362694)
- 1.5 ml Microtube (Axygen Scientific, catalog number: MCT-150-C)
- 10 ml Disposable Syringe (VWR, catalog number: 76290-382)
- 0.2 μm Syringe Filters (VWR, catalog number: 28145-477)
- Nematode Growth Medium (NGM) plates (see Recipes)
- Phosphate buffered saline (PBS) (see Recipes)
- PBS + 0.01% Triton X-100 (PBST) (see Recipes)
- M9 (see Recipes)
- Oil Red O stock solution (see Recipes)
- Nile Red stock solution (see Recipes)
- DAPI stock solution (see Recipes)
Equipment
- 2-20 μl micropipette (Gilson FA10003M)
- 20-200 μl micropipette (Gilson FA10005M)
- 100-1000 μl micropipette (Gilson FA10006M)
- Microcentrifuge for 1.5 ml tubes (Eppendorf, model: 5430)
- Worm incubator (Generic, maintain at 20 °C)
- Tube rotator (Thermo Scientific, catalog number: 88881001)
- Compound microscope with DIC, DAPI, and GFP filters, and 5× and 10× objectives (Zeiss, model: AxioScope5)
- Color camera (Zeiss AxioCam MRm)
- Digital camera (Zeiss AxioCam ERc5s)
- Stir plates, generic
- Magnetic stir bars, generic
Software
- Imaging software: Dependent on the microscope used (in this case, we used a Zeiss Axioscope and the associated ZEN imaging software)
- ImageJ (available from NIH)
- Data analysis software: We used GraphPad prism, although any software capable of t-test will suffice. ANOVA may be helpful if comparing multiple conditions, but not strictly necessary.
Procedure
A. Prepare hermaphrodite worms to use for staining.
- Maintain the growth of strains needed for Oil Red O fat staining and/or Nile Red fat staining. Allow populations to be unstarved for 3+ generations to avoid changes due to epigenetics.
- Ramp up worm strains that will be used for fat staining (Nile Red and/or Oil Red O).
- Synchronize populations by alkaline hypochlorite treatment overnight, as described before (Nhan et al. 2019).
- Drop larval stage 1 worms onto freshly seeded 6 cm NGM plates. Aim for 100 worms per plate.
- 48 hours after dropping the worms (unless the strains are developmentally delayed or staining Day 3 adults), L4 fat staining can occur.
- If imaging Day 3 adults, wash adult worms with M9 to new plates 72 hours-post drop and 96 hours post-drop to avoid having the progeny overtake the experiment worms. Adult animals can be enriched from larvae and eggs by allowing the larger adults to settle by gravity in a 15 ml centrifuge tube.
- 120 hours after dropping the worms (unless strains are developmentally delayed), Day 3 adult fat staining can occur.
B. Oil Red O fat staining
- Prepare Oil Red O staining solution.
- Make staining solution: Dilute Oil Red O stock solution in autoclaved water (600 μl Oil Red O stock solution per 400 μl water). Depending on the volume, prepare in either a 1.5 ml Eppendorf tube or 15 ml centrifuge tube. Note: 600 μl is used per sample. Make more than necessary to account for volume lost during filtration (Protocol B.1.d.).
- Wrap the top of the tube with parafilm.
- Place Oil Red O staining solution on a tube rotator overnight. Note: Although preparing the stain overnight is preferred, stain can be prepared up to two hours before being used in this protocol.
- The next day, filter the Oil Red O staining solution in a 10 ml plastic syringe attached to a 0.2 μm syringe filter into a new centrifuge tube.
- Optional. Co-staining samples with DAP will aid in the identification of tissues (germline versus intestine). Dilute 1 mg/ml DAPI stock solution to 10 μg/ml in the Oil Red O staining solution (10 μl DAPI per 1 ml Oil Red O staining solution).
- Stain C. elegans with Oil Red O staining solution.
- Wash off synchronized worm populations from 6 cm petri dishes with NGM seeded with E. coli OP50-1 with PBS + 0.01% Triton X-100 (PBST) into a 1.5 ml tube.
- For each strain, you will need ~100 worms.
- Centrifuge for 30 seconds at 500 rpm. Remove supernatant to 0.1 ml (use marks on the tube as a guide).
- Wash 1-2 additional times with PBST. Note: These washes remove E. coli from the worms to be stained. Wash until the supernatant is clear and not cloudy with bacteria.
- Centrifuge for 1 minute at 500 rpm. Remove supernatant to 0.1 ml.
- Add 600 μl of 60% isopropanol and rotate for 3 minutes at room temperature to fix worms.
- Centrifuge for 1 minute at 500 rpm. Remove supernatant to 0.1 ml.
- Add 600 μl of Oil Red O staining solution and incubate for two hours while rotating at room temperature.
- Centrifuge for 1 minute at 500 rpm. Remove supernatant to 0.1 ml.
- Add 600 μl PBST and incubate for 30 minutes while rotating at room temperature.
- Centrifuge for 1 minute at 500 rpm. Remove supernatant to 0.1 ml.
- Using a cut pipette tip (to broaden opening), pipette 14 μl of worms in PBST onto microscope slide.
- If you want to line worms up, do so with the eyelash brush before covering with a cover slip.
- Cover with a cover slip and seal the edges with clear nail polish. Allow to dry for 5-10 minutes.
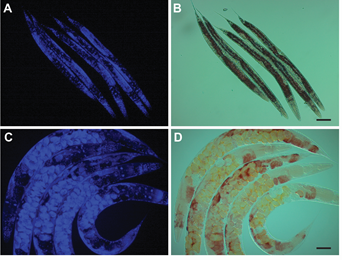
- Image at 10× with DIC and DAPI filters using the Zeiss AxioCam ERc5s. Representative images are shown in Figure 1.
- Image at least 100 worms per strain per replicate for qualitative analysis of non-Asdf versus Asdf (age-dependent somatic depletion of fat).
- Wash off synchronized worm populations from 6 cm petri dishes with NGM seeded with E. coli OP50-1 with PBS + 0.01% Triton X-100 (PBST) into a 1.5 ml tube.
C. Nile Red fat staining of post-embryonic animals
- Wash off synchronized worm populations from 6 cm petri dishes with NGM seeded with E. coli OP50-1 with PBS + 0.01% Triton X-100 (PBST) into a 1.5 ml tube.
- For each strain, you will need ~100 worms.
- Centrifuge for 1 minute at 500 rpm. Remove supernatant to 0.1 ml (use marks on the tube as a guide).
- Wash 1-2 additional times with PBST. Note: These washes remove E. coli from the worms to be stained. Wash until the supernatant is clear and not cloudy with bacteria.
- Centrifuge for 1 minute at 500 rpm. Remove supernatant to 0.1 ml.
- Add 600 μl of 40% isopropanol and rotate for 3 minutes at room temperature to fix worms.
- While worms are fixing, make Nile Red staining solution: dilute Nile Red stock solution in 40% isopropanol (6 μl Nile Red stock solution per 1 ml 40% isopropanol).
- Optional. Co-staining samples with DAP will aid in the identification of tissues (germline versus intestine). Add 1 mg/ml DAPI stock solution (10 μl in 1 ml Nile Red staining solution).
- Centrifuge for 1 minute at 500 rpm. Remove supernatant to 0.1 ml.
- Add 600 μl of Nile Red staining solution and incubate for two hours in the dark. Note: Before incubation, flick the bottom of the tube to resuspend the pellet in the staining solution.
- Centrifuge for 1 minute at 500 rpm. Remove supernatant to 0.1 ml.
- Add 600 μl PBST and incubate for 30 minutes in the dark.
- Centrifuge for 1 minute at 500 rpm. Remove supernatant to 0.1 ml.
- Using a cut pipette tip (to broaden opening), pipette 14 μl of worms in PBST onto microscope slide.
- If you want to line the worms up, do so with the eyelash brush before covering with a cover slip.
- Cover with a cover slip and seal the edges with clear nail polish. Allow to dry in the dark for 5-10 minutes.
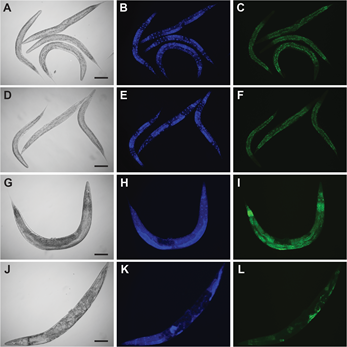
- Image at 10× with DIC, DAPI (Blue) and AlexaFluor488 (Green) filters using the Zeiss AxioCam MRm. Representative images are shown in Figure 2.
- Image at least 50 worms per strain per replicate for quantitative analysis. Note: The Nile Red fat staining is imaged in the GFP/AlexaFluor488 channel and the DAPI is imaged in the DAPI channel.
D. Nile Red fat staining of embryonic animals
Note: This protocol is similar to the Nile Red fat staining of post-embryonic animals with a few minor differences.
- Synchronize populations by alkaline hypochlorite treatment. Instead of allowing animals to hatch overnight, aspirate down to 1 ml and transfer M9 buffer with embryos to a 1.5 ml centrifuge tube.
- Spin down for 1 minute at 5000 rpm. Remove as much as the supernatant as possible without disrupting the pellet.
- Wash sample with PBST. Spin down for 1 minute at 5000 rpm and remove supernatant to 0.1 ml.
- Add 600 μl of 40% isopropanol and rotate overnight at room temperature to fix embryos.
- The next day, make Nile Red staining solution: dilute Nile Red stock solution in 40% isopropanol (6 μl Nile Red stock solution per 1 ml 40% isopropanol).
- Add 1 mg/ml DAPI stock solution (10 μl in 1 ml Nile Red staining solution).
- Centrifuge for 1 minute at 5000 rpm. Remove supernatant to 0.1 ml.
- Add 600 μl of Nile Red staining solution and incubate for two hours in the dark. Note: Before incubation, flick the bottom of the tube to resuspend the pellet in the staining solution.
- Centrifuge for 1 minute at 5000 rpm. Remove supernatant to 0.1 ml.
- Add 600 μl PBST and incubate for 30 minutes in the dark.
- Centrifuge for 1 minute at 5000 rpm. Remove supernatant to 0.1 ml.
- Pipette 14 μl of embryos in PBST onto microscope slide.
- Cover with a cover slip and seal the edges with clear nail polish. Allow to dry in the dark for 5-10 minutes.
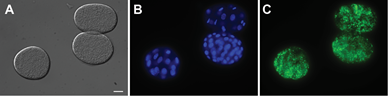
- Image at 40-63× with DIC, DAPI and GFP (AlexaFluor488 – Green) filters using the Zeiss AxioCam MRm. Representative images are shown in Figure 3.
- Image at least 50 eggs per strain per replicate for quantitative analysis. Note: The Nile Red fat staining is imaged in the GFP/AlexaFluor488 channel and the DAPI is imaged in the DAPI channel.
Data analysis
- Download Fiji by ImageJ to open and analyze the .czi files from the Zen imaging software: https://imagej.net/Fiji/Downloads
- Open Fiji. Open the .czi image file to analyze (File – Open – Select File – Open).
- The “Bio-Formats Import Options” window will pop up. Format the following way:
- For stacking view, “View stack with: Hyperstack”.
- For color options, “Color mode: Custom”.
- No other options need to be selected.
- Once the stacking view and color options have been updated, press “OK”.
- The “Console” window will pop up. You can ignore this window.
- The “Bio-Formats Color Customization” window will pop up. Select a color for each channel used to image.
- Example:
- DIC
- “Series 0 Channel 0 Red”: 255
- “Series 0 Channel 0 Green”: 255
- “Series 0 Channel 0 Blue”: 255
- Note: These settings will make the DIC look like it does when you are imaging (no colors added)
- DAPI
- “Series 0 Channel 1 Red”: 0
- “Series 0 Channel 1 Green”: 0
- “Series 0 Channel 1 Blue”: 255
- Note: These settings will make everything imaged in the DAPI channel blue in color.
- GFP
- “Series 0 Channel 2 Red”: 0
- “Series 0 Channel 2 Green”: 255
- Series 0 Channel 2 Blue”: 0
- Note: These settings will make everything imaged in the GFP/AlexaFluor488 channel green in color.
- DIC
- Example:
- Press “OK”. Now the image file will open with a slider to move from one channel to another.
- Open the “ROI Manager” window: Edit – Selection – Add to Manager
- Open the “Results” window: Analyze – Measure.
- Make sure the “Results” window has the following measurements: “Area”, “Mean”, and “IntDen”.
- If these are not shown in the “Results” window, right click the gray bar in the “Results” window and select “Set Measurements…”
- Select “Area”, “Integrated density”, and “Mean gray value”. Press “OK”.
- Move to the Nile Red fat staining channel. Select the oval tool and draw a small shape in an area with just the background in it (no worms). Measure the background: Analyze – Measure. Background measurement will show up in the “Results” window. Note: You need a new background measurement for each image analyzed. If you have multiple worms in one image, you can use the same background measurement for all of them. You can use this oval measurement again if you save it in the “ROI Manager” window.
- While the oval is still drawn on the image, select the “Add [t]” option in the “ROI Manager” window.
- Rename to “Background” to remember to use for future images: Highlight number, select “Rename…”, rename the image and press “OK”.
- Move to the DIC channel. Select the polygon tool. Outline the worm completely. Note: In order to include a worm for analysis, the whole worm must be present in the image.
- With the worm still outlined, move to the Nile Red fat staining channel. Add the outline to the “ROI Manager” (“Add [t]”). Measure the fluorescence in the outlined worm (Analyze – Measure).
- Close image: File – Close.
- Repeat for all other images in the analysis.
- Open image: File – Open.
- Move to the Nile Red fat staining channel.
- Background measurement: Select ROI in “ROI Manager” labelled background. Measure background: Analyze – Measure.
- Worm measurement: Move to DIC channel, select polygon tool and outline the worm. Move to the Nile Red fat staining channel, add to the “ROI Manager” (“Add [t]”). Measure the worm fluorescence: Analyze – Measure.
- Close image: File – Close.
- Once finished with a strain/condition, save the ROIs in the “ROI Manager”: Highlight all of the ROIs and select: “More…” then “Save” and save.
- Save all the measurements by selecting all measurements and copying to a spreadsheet where the area-corrected worm fluorescent intensity (CTCF) will be calculated.
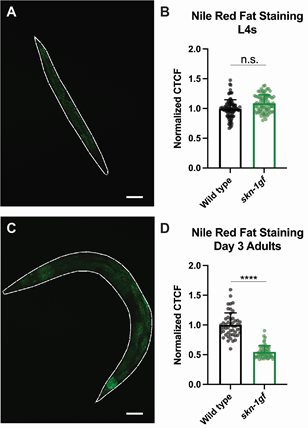
- To calculate the CTCF for each image: Multiply the background area by the background mean. Subtract this value from the worm integrated densitiy. Divide by the worm area. The final value is the CTCF.
- To normalize all samples to the control, calculate the average CTCF value for the control samples. Divide all CTCF values (including the controls) by the average control CTCF. Now everything is normalized to the control.
- Plot CTCF values on a graph. If there are multiple samples, either a t-test or ANOVA can be performed to determine significance between the samples’ fat content. Representative quantification of data is shown in Figure 4.

Notes
Note 1. NGM stock plates should be freshly prepared and freshly seeded for all experiments.
Note 2. Staining solutions should be prepared the day of staining (NR) or the day before staining (ORO).
Note 3. Always include a control group to make comparisons within each experimental group.
Note 4. Although the washing steps use PBS + 0.01% Triton X-100, worms and embryos tend to stick to the side of the tubes. It is recommended to have over double the population required for imaging to compensate for the loss of some of the sample.
Recipes
- Nematode Growth Media (NGM) plates
- Prepare stock solutions of 1 M MgSO4, 5 mg/ml cholesterol, 1 M KH2PO4, 1 M CaCl2, and 2.5% (w/v) streptomycin.
- Dissolve 120.366 g of MgSO4 per 1 L water (1 M). Filter sterilize.
- Dissolve 5 g of cholesterol per 1 L 100% ethanol (5 mg/ml). Store at 4 °C.
- Dissolve 136.086 g of KH2PO4 per 1 L water (1 M). Filter sterilize.
- Dissolve 110.98 g of CaCl2 per 1 L water (1 M). Filter sterilize.
- Dissolve 25 g of streptomycin sulfate per 1 L water (2.5%). Filter sterilize. Store at 4 °C.
- Add 3 g of NaCl, 17 g of agar, 2.5 g of peptone, and 950 ml of water to a glass flask. Include a stir bar.
- Cover with foil and autoclave to sterilize and dissolve agar.
- Cool, with stirring, to 55-60 °C.
- Add 1 ml of 1 M MgSO4, 1 ml of 5 mg/ml cholesterol, 25 ml of 1 M KH2PO4,, 1 ml of 1 M CaCl2, and 7.5 ml of 2.5% streptomycin.
- Stir 15 minutes.
- Dispense 11 ml into 6 cm Petri dishes using sterile technique.
- Allow to solidify overnight.
- Seed stock NGM plates with 250 μl of OP50-1 overnight culture (grown in LB + streptomycin, without shaking).
- Allow plates to dry (covered) 2-3 days before use.
- Prepare stock solutions of 1 M MgSO4, 5 mg/ml cholesterol, 1 M KH2PO4, 1 M CaCl2, and 2.5% (w/v) streptomycin.
- Phosphate buffered saline (PBS)
- Add 26.5 g of Na2HPO4·H2O, 80 g of NaCl, 2 g of KCl, and 2 g of KH2PO4 to a glass bottle.
- Bring volume to 1 L with water.
- Sterilize by autoclaving.
- PBS + 0.01% Triton X-100 (PBST)
- Using a cut pipette tip (to broaden opening), add 100 μl of Triton X-100 to 1 L sterile PBS.
- Mix well (do not shake).
- M9
- Add 30 g of KH2PO4, 60 g of Na2HPO4, 50 g of NaCl, and 120 mg of MgSO4 to a glass bottle.
- Bring volume to 1 L with water.
- Sterilize by autoclaving. Precipitation of calcium salts may occur after autoclaving. Re-dissolving may take several days. Agitation helps.
- DAPI stock solution
- Dissolve 1 mg/ml in DMSO.
- Oil Red O stock solution
- Add 1.5 g Oil Red O to 300 ml 100% isopropanol in a glass bottle for a final concentration of 5 mg/ml. Add a stir bar.
- Let stir overnight. Store at room temperature in the dark (can be stored for months).
- Nile Red stock solution
- Cover a glass bottle with foil.
- Add 100 mg Nile Red for microscopy to 200 ml 100% acetone in a glass bottle. Add a stir bar.
- Let stir overnight in the dark. Store at room temperature in a dark place (can be stored for months).
Acknowledgments
Protocol is derived from the original research paper, Nhan et al. “Redirection of SKN-1 abates the negative metabolic outcomes of a perceived pathogen infection” Proc Natl Acad Sci U S A. 2019 Oct 29;116(44):22322-22330. doi: 10.1073/pnas.1909666116 (Nhan et al. 2019). This work was funded by the NIH R01AG058610 to S.P.C., T32AG052374 to N.L.S and B.V.C., T32GM118289 to N.L.S., and T32AG000037 to J.D.N. and A.M.H.
Competing interests
The authors declare no competing interests.
Ethics
No human or vertebrate animal subjects are used in this study.
References
Castro, C., F. Sar, W. R. Shaw, M. Mishima, E. A. Miska and J. L. Griffin (2012). "A metabolomic strategy defines the regulation of lipid content and global metabolism by Delta9 desaturases in Caenorhabditis elegans." BMC Genomics 13: 36.
Greenspan, P., E. P. Mayer and S. D. Fowler (1985). "Nile red: a selective fluorescent stain for intracellular lipid droplets." J Cell Biol 100(3): 965-973.
Hammerquist, A. M., W. Escorcia and S. P. Curran (2021). "Maf1 regulates intracellular lipid homeostasis in response to DNA damage response activation." Mol Biol Cell 32(11): 1086-1093.
Johnson, A. A. and A. Stolzing (2019). "The role of lipid metabolism in aging, lifespan regulation, and age-related disease." Aging Cell: e13048.
Lynn, D. A., H. M. Dalton, J. N. Sowa, M. C. Wang, A. A. Soukas and S. P. Curran (2015). "Omega-3 and -6 fatty acids allocate somatic and germline lipids to ensure fitness during nutrient and oxidative stress in Caenorhabditis elegans." Proc Natl Acad Sci U S A112(50): 15378-15383.
Nhan, J. D., C. D. Turner, S. M. Anderson, C. A. Yen, H. M. Dalton, H. K. Cheesman, D. L. Ruter, N. Uma Naresh, C. M. Haynes, A. A. Soukas, R. Pukkila-Worley and S. P. Curran (2019). "Redirection of SKN-1 abates the negative metabolic outcomes of a perceived pathogen infection." Proc Natl Acad Sci U S A 116(44): 22322-22330.
O'Rourke, E. J., A. A. Soukas, C. E. Carr and G. Ruvkun (2009). "C. elegans major fats are stored in vesicles distinct from lysosome-related organelles." Cell metabolism 10(5): 430-435.
Pang, S. and S. P. Curran (2014). "Adaptive Capacity to Bacterial Diet Modulates Aging in C. elegans." Cell metabolism 19(2): 221-231.
Pino, E. C., C. M. Webster, C. E. Carr and A. A. Soukas (2013). "Biochemical and high throughput microscopic assessment of fat mass in Caenorhabditis elegans." Journal of visualized experiments : JoVE(73).
Stuhr, N. L. and S. P. Curran (2020). "Bacterial diets differentially alter lifespan and healthspan trajectories in C. elegans." Commun Biol 3(1): 653.
Webster, C. M., E. C. Pino, C. E. Carr, L. Wu, B. Zhou, L. Cedillo, M. C. Kacergis, S. P. Curran and A. A. Soukas (2017). "Genome-wide RNAi Screen for Fat Regulatory Genes in C. elegans Identifies a Proteostasis-AMPK Axis Critical for Starvation Survival." Cell Rep20(3): 627-640.
Zhang, Y., X. Zou, Y. Ding, H. Wang, X. Wu and B. Liang (2013). "Comparative genomics and functional study of lipid metabolic genes in Caenorhabditis elegans." BMC Genomics 14: 164.
- Stuhr, N L, Nhan, J D, Hammerquist, A M, Camp, B V, Reoyo, D and Curran, S P(2021). Lipid Quantification in Caenorhabditis elegans by Nile Red and Oil Red O Staining. Bio-protocol Preprint. bio-protocol.org/prep1378.
Category
Do you have any questions about this protocol?
Post your question to gather feedback from the community. We will also invite the authors of this article to respond.