
- Home
- Protocols

-

Glutamate clearance assay.
Last updated date: Jun 18, 2021 Views: 818 Forks: 0
Glutamate Clearance in Primary Human Fetal Astrocytes
Type of plates used | Cell numbers plated |
| 48 well tissue culture plate | 0.15 million/well with 24 hour recovery before treatment. 3 – 4 wells per condition/controls. (for basic experiment Control and IL-1B = 12 wells ) |
This experiment requires:
Stimuli | Length of incubation | Concentrations |
Activated Control: Interleukin-1 beta (R&D Systems: Cat # 201-LB-005) | 24h | 20 ng/ml |
Assays required:
Assay | Timepoints | # reactions |
Amplex® Red Glutamic Acid/Glutamate Oxidase Assay Kit (cat # MP12221) | 4h, 8h, 24h | 18 wells/timepoint =52 16 standards / assay Minimum 68 reactions if run all together. |
MTT | 24h | 12 well post- glutamate
|
Normal Astrocyte media (ASM) for plating and activation, PHENOL RED Free ASM for glutamate assay.1
Base: DMEM/F12 with HEPES (Gibco # 11330032 (with PR) and 11039047 (without PR))
Media Additives:
- Fetal bovine serum (10%)
- 1% penicillin-streptomycin-neomycin (with 5,000 units penicillin and 5 mg streptomycin and 10 mg neomycin per ml in 0.9% sodium chloride), 5 ml of the solution to 500 ml media)
- 1% Fungizone (250 µg/ml amphotericin B)
- Expires after 1 month.
Materials and Methods:
- Plate astrocytes in 48 well plates @ 0.15106/well for Glut clearance/MTT
- After 24h recovery
- Treat with final volume 400 µL in normal ASM of the following stimuli:
Control and IL-1B, and any other treatments.
- At 24h post- stimulation,
- Collect Media for ELISA (200 µL/well for total of 2 wells on 96-well plate) or discard
- Replace media with Phenol red free media containing 400 µM glutamate for 4-8-24 hours and measure glut. Clearance. Perform MTT after last timepoint
Flow Chart of Experiment
Day 1 (__/__/__)
(__:___ am/pm) Passage primary human astrocytes and plate Astrocytes. 12 wells x150,000/well in 48-well plate
Day 2 (__/__/__)
(__:___ am/pm) Treat Astrocytes in 48 well plates with IL-1B 20 ng/ml in 400 µL of ASM.1
Control | Control | Control | Control | Control | Control | ||
IL-1b | IL-1b | IL-1b | IL-1b | IL-1b | IL-1b | ||
Day 3 (__/__/__)
(__:___ am/pm) Collect/discard supernatants - 200 µL / well in 96 well plate (for other assays).
Treat half the Astrocytes with 400 µL PHENOL RED FREE ASM control (no glutamate media) and half the plate with 400 µM glutamate 400 µL in PHENOL RED FREE ASM.2
No (-) | glutamate | side | With (+) | glutamate | side | ||
| Negative Control (no cells) | Negative Control (no cells) | Negative Control (no cells) | Negative Control (no cells) | Negative Control (no cells) | Negative Control (no cells) | ||
| Control | Control | Control | Control | Control | Control | ||
| IL-1b | IL-1b | IL-1b | IL-1b | IL-1b | IL-1b | ||
(__:___ am/pm) 4 h glut clearance timepoint, collect 40 µL 4 from each well into a 96 well plate and freeze until you perform Glut assay
(__:___ am/pm) 8 h glut clearance timepoint, collect 40 µL and perform Glutamate assay
Day 4 (__/__/__)
(__:___ am/pm) 24 h glut clearance timepoint, collect remaining media and perform Glut assay followed by MTT assay.
Amplex® Red Glutamic Acid/Glutamate Oxidase Assay with annotations.
- Prepare reagent stocks as described in the Amplex® Red Glutamic Acid/Glutamate Oxidase Assay Kit (cat # A12221) (Section 1).
- Special instructions for l-glutamic acid (Component H): dissolve in in 534 μL of sterile Phenol Free ASM.3 Aliquot into single use vials with sufficient volume to treat the cells and prepare a standard curve for the assay. Stored frozen at –20 C. USE a fresh vial with EACH experiment.
- Both L-Glutamine and L-alanine are supplied in the A12221 kit in great excess, reconstitute and aliquot. Do not purchase these reagents from alternate venders.
- Alternately purchase the similar reagents from alternate providers.
- Amplex Red: Thermo Fisher, Cat. #: A12222 Reconstitute to 10 mM/mL in DMSO. Aliquot and store stock solution frozen at -20 C protected from light.
- Glutamate Oxidase: Cosmo Bio Usa Inc Cat#: YMS80049 through Fisher Scientific. Reconstitute to 5U/mL in 1x reaction buffer based on activity. Aliquot and store stock solution frozen at -20 C protected from light.
- Glutamate-Pyruvate Transaminase (GPT) from Pig heart: Sigma Prod #: G8255 Reconstitute to 100U/mL in 1x reaction buffer based on activity. Aliquot and store stock solution frozen at -20 C protected from light.
- Horse Radish Peroxidase (HRP) is widely available. Reconstitute to 100U/mL in 1x reaction buffer based on activity. Aliquot and store stock solution frozen at -20 C protected from light.
- 5x Reaction Buffer: 0.5 M Tris-HCl, pH 7.5.5
Glutamic Acid Assay Protocol (Modified from the Glutamic Acid Assay instructions (section 2) from Amplex® Red Glutamic Acid/Glutamate Oxidase Assay kit (A12221).) Total volume is 100 µL per microplate well where 50 µL is sample and 50 µL is assay solution.
1. Prepare a L-glutamic acid standard curve:
- Dilute the appropriate amount of 200 mM glutamate stock solution into 1X reaction buffer to make a standard curve of 2-fold dilutions from 100 µM to 1.625 µM. Use 1X reaction buffer without l-glutamic acid as a negative control (Blank/background/0 µM). A volume of 50 µL will be used for each reaction. Make sufficient volumes to run in duplicate (110-125 µL).
2. Dilute the l-glutamic acid-containing samples in 1X reaction buffer Make sufficient volumes to run in duplicate (110-125 µL), using 50 µL for each reaction.
- Example dilutions:
i. No (-) Glutamate conditions: dilute 1 to 1 (1:1, sample: 1x Reaction Buffer).
ii. With (+) Glutamate conditions: 4 – 8 h samples: 1 to 20 (1:19, sample : 1x Reaction buffer); 24 h samples: 1 to 10 (1:9) or 1 to 5 (1:4, sample: 1x Reaction Buffer) depending on the donor. No cell control : 1 in 20 (1:19) in in 1x Reaction buffer.
3. Pipet 50 µL of the diluted standards, samples and controls into separate wells of a black opaque microplate. Run samples in duplicate.6
| 100 µM | 100 µM | 24h No cell (+) glut | 24h No cell (+) glut | 24h No cell (+) glut | 24h No cell (+) glut | 24h No cell (+) glut | 24h No cell (+) glut | |||||
| 50 | 50 | 24h Control (+) | 24h Control (+) | 24h Control (+) | 24h Control (+) | 24h Control (+) | 24h Control (+) | |||||
| 25 | 25 | 24h IL-1b (+) | 24h IL-1b (+) | 24h IL-1b (+) | 24h IL-1b (+) | 24h IL-1b (+) | 24h IL-1b (+) | |||||
| 12.5 | 12.5 | 8h Control (+) | 8h Control (+) | 8h Control (+) | 8h Control (+) | 8h Control (+) | 8h Control (+) | |||||
| 6.25 | 6.25 | 8h IL-1b (+) | 8h IL-1b (+) | 8h IL-1b (+) | 8h IL-1b (+) | 8h IL-1b (+) | 8h IL-1b (+) | |||||
| 3.25 | 3.25 | 4h Control (+) | 4h Control (+) | 4h Control (+) | 4h Control (+) | 4h Control (+) | 4h Control (+) | |||||
| 1.625 | 1.625 | 4h IL-1b (+) | 4h IL-1b (+) | 4h IL-1b (+) | 4h IL-1b (+) | 4h IL-1b (+) | 4h IL-1b (+) | |||||
| 0 | 0 |
4. Prepare an assay solution containing 100 µM Amplex® Red (AR) reagent, 0.25 U/mL HRP, 0.08 U/mL l-glutamate oxidase (GO), 0.5 U/mL l-glutamate–pyruvate transaminase (GPT), and 200 µM l-alanine (Ala). Make sufficient for 50 µL per reaction, 5 mL is sufficient for 100 assays or a 96 well plate.
- If stocks were prepared as described this means:
- 965.5 µL of 1x Reaction Buffer / ml Assay solution
- 1 µL of Ala / ml Assay solution
- 2.5 µL of HRP / ml Assay solution
- 5 µL of GPT / ml Assay solution
- 16 µL of GO / ml Assay solution
- 10 µL of AR / ml Assay solution (add last – just before ready to mix and add to the plate)
5. Use a multichannel pipete to quickly add 50 µL of the assay solution to each microplate well containing the standards, samples and controls. The assay progresses quickly, and you will not want significant time between the beginning to add the assay solution and finishing.
6. Shake the plate in a spectrophotometer for 1 minute. Incubate 5-10 minutes in the dark. Because the assay is continuous (not terminated), measure the fluorescence at multiple time points to follow the kinetics of the reactions.
7. Measure the fluorescence every 5 minutes for 30+ minutes in a fluorescence microplate reader using excitation in the range of 530–560 nm and emission detection at ~590 nm. Mixing before every read. The assay will max out and the fluorescence values will start decreasing if glutamate concentrations are too high. We analyze the last read where our high standard increased.7
Analysis:
1. Examine your standard curve.
- What is the R2? Is it close to 1?
- Do any standards appear to fall outside the standard curve, can they be eliminated?
- Do your unknowns fall on the standard curve, preferably near the center?
2. Read the plate multiple times until the highest standard value reading starts declining. Use the reading with the highest standard value reading.
3. Calculate glutamate concentration [µM] in all samples and controls by subtracting the blank from each well and then comparing to the standard curve.
4. The no cell (+) glutamate control represents the amount of glutamate added to each well at the beginning of the experiment and what remains at the end when there is no clearance (negative control).8
5. Change in glutamate concentration9 = (No-cell (+) glutamate mean [µM] – unknown sample glutamate [µM])
(No-cell (+) glutamate mean [µM])
6. % Glutamate clearance10 = Change in glutamate concentration *100
7. At this point, the % glutamate clearance can be normalized to metabolic activity measures like MTT activity.
Notes:
1. It is critical to use phenol red free media for supernatants used in the glutamate assay as phenol red interferes with detection of fluorescence.
2. IL-1B treatment (stock: 5 µg/mL)
- Control: 6 wells = 6 x 0.4 mL /well = 2.4 mL à 3 mL needed
- IL-1B treatment: 6 wells = 6 x 0.4 mL /well = 2.4 mL à 3 mL x 20 ng/ mL = 60 ng / 5 µg/ mL = 0.012 mL or 12 µL stock into 3 mL ASM
3. Glutamate treatment (stock: 200 mM)
- We only use the kit’s version of glutamate. Made by dissolving the contents of the vial of l-glutamic acid (Component H) in 534 μL of sterile PBS. Aliquoted into single use vials with sufficient volume to treat the cells and prepare a standard curve for the assay. Stored frozen at –20 C.
- ALWAYS use a fresh aliquot to treat cells. Refreeze and use the leftovers to make assay standard curve. If performed as we describe here, we make 25 µl aliquots ( 10 µl for treatment, 10 µl for standard curve)
- No glutamate treatment to measure glutamate release:
- 3 conditions x 3 replicates = 9 wells x 0.4 mL /well = 3.6 mL à 5 ml PHENOL RED FREE ASM
- Glutamate treatment to measure clearance ability:
- 3 conditions (control, IL-1B, Negative control (no cells) x 3 wells = 9 wells
- 9 x 0.4 ml /well = 3.6 mL à 5 ml x 0.400 mM = XX mL x 200 mM = 0.01 mL of stock or 10 µL stock into 5 mL PHENOL RED FREE ASM
4. We collect 40 µL so as to not decrease the well volume too significantly. This limits the number of timepoints from individual wells. Alternately, one could plate different sets of wells for each timepoint.
5. The pH of the reaction buffer is VERY important. If the assay is not giving you the fluorescent numbers you are expecting, pH is often the culprit.
6. We will run the no (-) glutamate wells if glutamate clearance is not seen to see if the astrocytes were secreting glutamate.
7. We will often exclude one or more high standards (100 or 50), depending on where our samples fall on the standard curve. This allows us to run the assay longer if samples have low glutamate remaining in the supernatants (high glutamate clearance).
8. While “400 uM” glutamate was added at the start of the experiment, the concentration often varies when measured in the assay. Thus, it is critical to run the no cell glutamate on the same scale (standard curve) as the samples (unknowns) to calculate glutamate clearance. The actual glutamate concentration (µM) is not important as the read-out is in % glutamate remaining or % glutamate clearance.
9. If values are positive and less than 1, there was glutamate clearance. If values are negative, there was not glutamate clearance. Consider running the no glutamate samples to determine if the donor or treatment is secreting glutamate rather than clearing. If the values are very close to 1, there was little to no clearance.
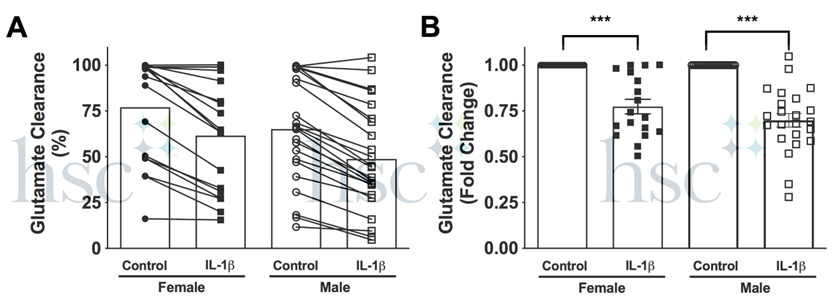
10. Glutamate clearance ability varies between primary human astrocyte cultures. We perform this test on all our cultures to understand the baseline for each donor (Panel A- 24h glutamate clearance). Typically, glutamate clearance at 24 h decreases by 25% in IL-1B treated cells as compared to controls (Panel B - 24h fold change). A donor that shows low clearance in control cells or small changes in clearance when treated with IL-1B may not be the best culture for this type of experiment. If both control and IL-1B treated cells clear 100% of glutamate at 24 h, try earlier timepoint to find when a difference in clearance can be measured.
Related files
 Glutamate clearace - revised.docx
  Glutamate clearace - revised.pdf
 - Edara, V and Borgmann, K(2021). Glutamate clearance assay.. Bio-protocol Preprint. bio-protocol.org/prep1177.
- Edara, V. V., Ghorpade, A. and Borgmann, K.(2020). Insights into the Gene Expression Profiles of Active and Restricted Red/Green-HIV+ Human Astrocytes: Implications for Shock or Lock Therapies in the Brain. Journal of Virology 94(6). DOI: 10.1128/JVI.01563-19
Do you have any questions about this protocol?
Post your question to gather feedback from the community. We will also invite the authors of this article to respond.