
- Home
- Protocols

-

Isoform-specific, semi-quantitative expression analysis of highly homologous proteins despite the lack of appropriate antibodies
Last updated date: Jun 17, 2021 Views: 1670 Forks: 0
Isoform-specific, semi-quantitative expression analysis of highly homologous proteins despite the lack of appropriate antibodies
Kristina Seiler1,2, Sreoshee Rafiq1,2, Mario P. Tschan1,2,*
1Institute of Pathology, University of Bern, Bern, Switzerland
2Graduate School for Cellular and Biomedical Sciences, University of Bern, Bern, Switzerland
*For correspondence: mario.tschan@pathology.unibe.ch
Abstract
Many protein families consist of multiple highly homologous proteins, whether they are encoded by different genes or originating from the same genomic location. Predominance of certain isoforms has been linked to various pathological conditions, such as cancer. Commonly, detection and relative quantification of protein isoforms in research are done via immunoblotting, immunohistochemistry, or immunofluorescence, where antibodies against an isoform-specific epitope of particular family members are used. However, isoform-specific antibodies are not always available, making it impossible to decipher isoform-specific protein expression patterns. Here we describe the insertion of a versatile 11-amino acid tag into the genomic location of the protein of interest. Expression of this tag on the isoform of interest allows precise isoform-specific expression analysis not only through traditional methods such as Western Blotting or immunofluorescence, but can also be used in a luciferase binary reporter system, allowing for reliable and fast relative expression quantification using a plate reader. The system was developed and is distributed by Promega (Fitchburg, WI, USA).
Graphic abstract:

Keywords: Protein isoform, antibody-free detection, endogenous tagging, protein expression, HiBiT
Background
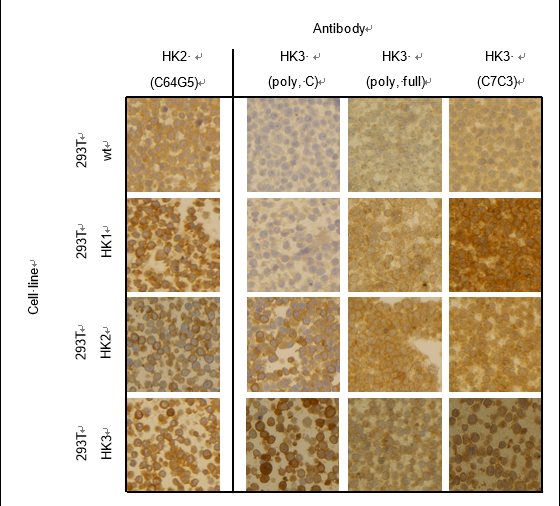
There is hardly a protein to be found within the human body that does not share extensive sequence homology to a family member, or isoform, as the human cell requires redundancies to ensure continuous work. Protein isoforms are sometimes encoded by different genes, and often, specific genes have multiple transcripts, returning slightly different proteins depending on how they are spliced. Many diseases are characterized by the predominant expression of specific enzyme isoforms, such as for example the muscle isoform 2 of pyruvate kinase (PKM2) in various cancers (Mazurek, 2011). Therefore, it is essential to be able to analyze and quantify the expression of specific protein isoforms in order to investigate pathogenic tendencies or in the search of novel biomarkers. For well-studied protein families, isoform-specific antibodies can usually be purchased and allow relative quantification of expression on Western Blot. However, batch-to-batch variations in antibody performance as well as recognition of unspecific binding partners sometimes hamper precise protein identification through this method (Voskuil, 2017). Furthermore, when studying newly identified isoforms or lesser studied protein families, there are often no monoclonal, isoform-specific antibodies available. We encountered this issue in our investigation of hexokinase 2 (HK2) and HK3, glycolytic enzymes of the hexokinase family. While sequence homology between HK2 and HK3 is only roughly 54%, we struggled to find appropriate antibodies detecting specifically one or the other isoform (Figure 1). If monoclonal antibodies are unavailable, the use of polyclonal antibodies should be assessed carefully as larger immunogens increase the likelihood of producing signals from various family members. If the proteins do not vary in size, their distinction is impossible. Hexokinases 2 and 3 are both roughly 100kDa in size and using antibodies against HK3, we detected signals on western blot in samples that were confirmed HK3 negative through mass spectrometry. This prompted us to generate a protocol for isoform-specific detection of endogenous protein expression without cross-reaction bias.
Another way of assessing isoform expression pattern is through RNA sequencing methods, where long reads are usually needed in order to be able to identify the precise variant of the transcript. While sequencing is becoming a lot more affordable, long reads are not the standard and certainly not yet an option for daily laboratory use. The same goes for mass spectrometric protein identification, which is done often but not yet widely available for everyday use. Furthermore, for mass spectrometric analysis proteins undergo tryptic digestion, which hampers isoform identification as short sequences of amino acids may very well be shared among different family members.
We hereby suggest the use of an endogenous tag which can be inserted into precise genomic locations and allows relative quantification and identification of protein isoforms through various methods. The system was developed by Promega (Fitchburg, WI, USA) (Schwinn et al., 2020, 2018). The HiBiT® peptide tag used is 11-amino acids small and binds tightly to an adaptor protein (LgBiT®) when supplied. Through this interaction, the bright luminescent protein NanoBiT® is reconstituted (Dixon et al., 2016). Luminescent intensity from reconstituted NanoBiT is directly proportional to the amount of HiBiT present. This allows for relative protein quantification within minutes using a common plate reader. Briefly, cells are lysed, complexed with the adaptor protein LgBiT®, and substrate is added. Cell lysate can also be run on an SDS-Gel, transferred onto a nitrocellulose membrane and HiBiT-expressing protein analyzed by incubation with LgBiT® followed by substrate addition and image acquisition. Furthermore, Promega recently launched an anti-HiBiT monoclonal antibody, which allows to visualize protein localization and expression within a cell using fluorescent microscopy. The anti-HiBiT antibody can also be used in traditional Western Blotting.
In order to insert the tag into the genomic locus of interest, CRISPR/Cas9 mediated genome editing is used. For successful editing, a sgRNA which binds very close to the desired insertion of the HiBiT tag is complexed with Cas9, and single strand donor DNA templates (ssODN) for homology directed repair are supplemented. A few days after electroporation of the cells with Cas9/sgRNA ribonucleoprotein complex (RNP) and ssODN, cells can be assessed for insertion of the tag using a plate reader. If desired, monoclonal populations with 100% of cells expressing the tag can be grown. However, the small tag is generally not expected to impair cellular growth and we have not observed a decrease in luminescent signal while propagating bulk edited cells in culture.
With the recently launched anti-HiBiT monoclonal antibody (Promega), further downstream experiments such as fluorescent microscopy are possible but will require prior optimization.
Materials and Reagents
1. Gene-specific Alt-R® CRISPR-Cas9 sgRNA, Integrated DNA Technologies (IDT), stored at -80°C
2. ssODN: Gene-specific Alt-R® HDR Donor Oligos, IDT
3. eSpCas9-GFP Protein, Sigma Aldrich (Cat# ECAS9GFPPR-50UG), stored at -20°C
Note: using a GFP-tagged Cas9 helps visualizing electroporation efficiency, but is not needed
4. Alt-R® HDR enhancer 100 μL, IDT (Cat# 1081072), stored at -20°C
5. NeonTM Transfection System 10μL Kit, Thermo Fisher Scientific (Cat# MPK1025), stored at RT with the exception of buffers at 4°C after opening
6. Nano-Glo® HiBiT lytic detection system, Promega (Cat# N3030), stored at -20°C
7. Immunoblot lysis buffer: 8M Urea +0.5% Triton X, prepared freshly
8. Lysis buffer for HiBiT Blotting
9. CompleteTM Proteinase inhibitor cocktail, Roche, distributed via Sigma Aldrich (Cat#11697498001), stored at -20°C
10. Nano-Glo® HiBiT Blotting system, Promega (Cat# N2410), stored at -20°C
11. Mouse anti-HiBiT mAB, Promega (Early access via Custom Assay Catalogue, Part Number: CS2006A01), stored at -20°C
12. White microplates suitable for luminescence
13. 4-20% Mini-PROTEAN® TGC Stain-FreeTM Protein Gels, BioRad (Cat# 4568093)
14. Trans-Blot Turbo RTA Mini 0.2uM Nitrocellulose Transfer Kit, BioRad (Cat# 1704270)
15. TBS-T
Equipment
1. NeonTM Transfection System, Thermo Fisher Scientific (Cat# MPK5000)
2. Luminescence Plate reader (Tecan Infinite® 200 PRO, Tecan Group)
3. 2-D protein electrophoresis equipment (Mini-PROTEAN Tetra Vertical Electrophoresis Cell and PowerPac Power supply, BioRad)
4. Trans-Blot Turbo Transfer System
5. ChemiDoc XRS+ Imaging System, BioRad
Software
1. gRNA design tools:
https://chopchop.cbu.uib.no/,
https://eu.idtdna.com/site/order/designtool/index/CRISPR_SEQUENCE
http://crispor.tefor.net/
2. ImageLab: Acquisition of chemiluminescent images using ChemiDoc Imaging System
3. ImageJ: relative quantification of chemiluminescent signal
Procedure
A. Design of gRNA and ssODN
1. Identify desired locus of HiBiT tag insertion (for example at the C- or N-terminal end, directly after the start codon or right before the stop codon)
2. Identify appropriate gRNA sequences within ±30 nucleotides of locus of insertion, for improved result compare gRNA efficiency over various publicly available algorithms (we have not tested gRNA sequences more than 30 nt away from the site of insertion)
3. Design ssODN with at least 80 nucleotides homology arms upstream and downstream of Cas9 cut site (total length of ssODN is 180-200nt)
4. To prevent Cas9 from binding to and cutting the ssODN, insert 2-3 silent mutations into the gRNA sequence within the ssODN, preferentially the PAM sequence if possible
Table 1: Sequences for HDR-mediated insertion of HiBiT-tag into C-terminus of Hexokinase isoforms
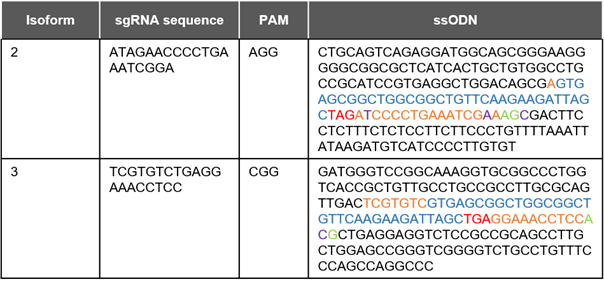
blue: HiBiT tag orange: sgRNA sequence red: Stop codon green: PAM sequence
purple: silent mutations inserted to prevent Cas9 from binding to ssODN
B. Electroporation
1. Prepare stock solutions:
a) Cas9: 20μM
b) sgRNA: 50μM
c) ssODN: 100μM
2. In a total volume of 7ul, add 15pmol of Cas9, 75pmol of sgRNA to buffer R or T (dependent on the cell type, see NeonTM instructions)
Note: The ratio between sgRNA and Cas9 can be empirically titrated for best efficiency. We recommend a ratio of 5:1 – 9:1.
Example, per reaction:
1.5μL of sgRNA (75pmol)
0.75μL of Cas9 (15pmol)
4.75μl of buffer R or T
3. Incubate for 15min at RT, RNP complexes are stable for 1 h at RT
Note: RNPs can be complexed prior to the experiment and stored for 2 weeks at 4°C, or up to at least 10 weeks at -80°C without loss in performance.
4. Prepare a 96-well plate with 100μL of complete medium containing 30μM of HDR enhancer to collect cells after electroporation, prewarm to 37°C
5. Add 75pmol of ssODN (0.75uL of 100μM stock) to the complexed RNPs
6. Collect cells and wash in PBS
7. Prepare the electroporator station: Fill electroporation tube with 3mL of buffer E, input desired settings (check Thermo Fisher’s recommendations for cell type specific settings)
8. Count cells, take appropriate cell number and resuspend in 5uL of buffer R or T per electroporation, include appropriate controls (electroporation only, untargeted sgRNA)
9. Add 5µL of cell suspension to 7µl of RNP complex, keep cell exposure to buffers R or T at a minimum (≤15min)
10. Using a 10uL Neon electroporation tip, electroporate cells and transfer into prewarmed media (Step 4)
11. Transfer cells to a humidified incubator immediately
12. Do not disturb cells for 24h
13. If desired, check electroporation efficiency of eCas9-GFP using a fluorescent microscope
C. Check for HiBiT insertion
1. Let cells grow until you can comfortably remove 5*104 cells
2. Prepare Nano-Glo® HiBiT lytic detection reagent by allowing buffer to thaw to RT
Note: This assay can be performed in various well formats, we prefer to use 384-well format and add 20µL of detection reagent to 20µl of cell suspension. For statistical reasons, we recommend performing the assay in no less than triplicates
3. Dilute assay reagents into assay buffer according to the manufacturers instructions
4. Count cells and add equal numbers of cells per well
Note: We use 15’000 cells per 384-well.
5. Add detection reagent and ensure homogeneous lysis by pipetting up and down, be sure to include a no-HiBiT expressing negative control
6. Equilibrate to RT for 10min
7. Measure luminescence
D. Monoclonal population
In case editing efficiency or endogenous protein expression is very low, single cell monoclonal populations can be obtained through limiting dilution assay.
1. To improve efficiency in growing edited monoclonal populations, we recommend preselecting HiBiT-expressing populations grown from 10 cells and performing limiting dilution assay after preselection
a. Of edited bulk population, plate 10cells/well in a 96-well format
b. After enough cells have grown, screen populations for highest HiBiT expression using Nano-Glo® HiBiT lytic detection
c. From the highest expressing populations, perform limiting dilution assay
d. Grow and screen monoclonal populations
E. HiBiT Blotting (optional)
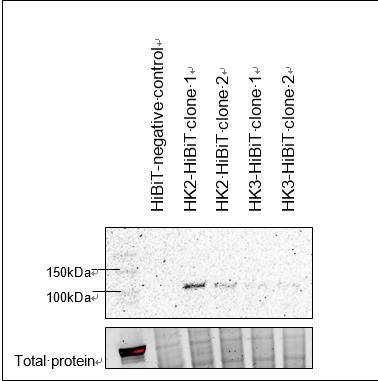
To ensure the HiBiT insertion has occurred at the correct protein, the size of the fusion protein can be tested via blotting.
1. Isolate protein using the lysis buffer for HiBiT blotting and quantify protein content (eg. Bradford assay)
2. Separate amount of protein appropriate for expected protein expression on a gel (eg. 4-20% Mini-PROTEAN® TGC Stain-FreeTM Protein Gel), include a molecular weight marker
3. If using stain-free gel technology, activate gel according to the manufacturers protocol
4. Transfer protein onto a nitrocellulose membrane (eg. via semi-dry Turbo-Blot transfer)
5. After transfer, wash membrane in TBS-T, do not allow membrane to dry
6. Acquire total protein image to allow for relative quantification
7. Prepare Nano-Glo® Blotting solution according to the manufacturer’s instructions: Dilute LgBiT protein 200-fold with 1X Nano-Glo® blotting buffer, mix by inversion, remove TBS-T and cover the membrane in blotting solution
8. Incubate for 1h at RT while gently rocking
Note: for increased signal, incubation can be prolonged up to over night incubation at 4°C. If incubating at 4°C, allow equilibration to RT before adding the substrate after incubation.
9. Dilute the Nano-Glo® Luciferase Assay Substrate 500-fold into the solution covering the membrane
10. Incubate for 5min at RT
11. Acquire chemilumiescent image using an appropriate imager (eg. ChemiDoc XRS+)
Note: Alternatively to the HiBiT blotting system, a conventional immunoblot can be performed using the mouse anti-HiBiT mAB available though Promega.
F. Perform your experiment
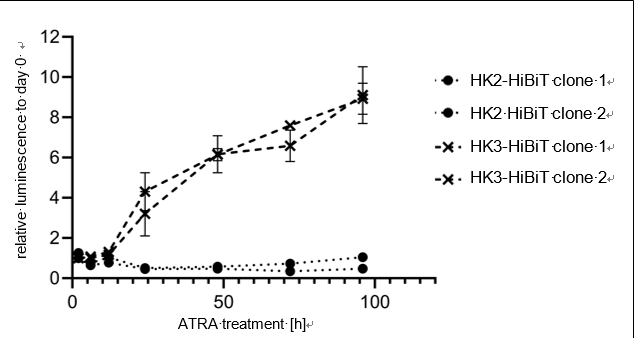
1. Quantify relative endogenous protein expression at desired time points using NanoGlo® HiBiT lytic detection (Figure 2), Nano-Glo® HiBiT blotting system (Figure 3), or HiBiT
Data analysis
Nano-Glo® HiBiT lytic detection:
Quantify relative protein expression using luminescence readings, subtracting readings of negative control.
Nano-Glo® HiBiT blotting system:
Quantify relative protein expression via luminescence signal on images, using software like imageJ. Normalize to the amount of total protein or to a housekeeping reference protein (β-tubulin, GAPDH).
Recipes
Lysis buffer for HiBiT Blotting: 50mM Tris-Hcl, 150mM NaCl, 1% Triton® X-100, 0.1% sodium deoxycholate, pH7.5
TBS-T: 20mM Tris, 150mM NaCl, Tween® 20 0.1%
Notes
To verify insertion of HiBiT tag, it is also possible to perform a PCR reaction using a primer pair that is specific for both the tag as well as the locus of insertion.
Acknowledgments
We thank Promega for technical support during optimization of this protocol. This study was supported by grants from the Swiss National Science Foundation and Krebsforschung Schweiz (31003A_173219 to MPT and MD-PhD 03/17 Scholarship to KS).
Competing interests
The authors declare no conflict of interests.
References
Dixon, A.S., Schwinn, M.K., Hall, M.P., Zimmerman, K., Otto, P., Lubben, T.H., Butler, B.L., Binkowski, B.F., Machleidt, T., Kirkland, T.A., Wood, M.G., Eggers, C.T., Encell, L.P., Wood, K.V., 2016. NanoLuc Complementation Reporter Optimized for Accurate Measurement of Protein Interactions in Cells. ACS Chem Biol 11, 400–408. https://doi.org/10.1021/acschembio.5b00753
Mazurek, S., 2011. Pyruvate kinase type M2: A key regulator of the metabolic budget system in tumor cells. The International Journal of Biochemistry & Cell Biology, Metabolic Pathways in Cancer 43, 969–980. https://doi.org/10.1016/j.biocel.2010.02.005
Schwinn, M.K., Machleidt, T., Zimmerman, K., Eggers, C.T., Dixon, A.S., Hurst, R., Hall, M.P., Encell, L.P., Binkowski, B.F., Wood, K.V., 2018. CRISPR-Mediated Tagging of Endogenous Proteins with a Luminescent Peptide. ACS Chem. Biol. 13, 467–474. https://doi.org/10.1021/acschembio.7b00549
Schwinn, M.K., Steffen, L.S., Zimmerman, K., Wood, K.V., Machleidt, T., 2020. A Simple and Scalable Strategy for Analysis of Endogenous Protein Dynamics. Sci Rep 10, 8953. https://doi.org/10.1038/s41598-020-65832-1
Voskuil, J.L.A., 2017. The challenges with the validation of research antibodies. F1000Res 6. https://doi.org/10.12688/f1000research.10851.1
- Seiler, K, Rafiq, S and Tschan, M P(2021). Isoform-specific, semi-quantitative expression analysis of highly homologous proteins despite the lack of appropriate antibodies. Bio-protocol Preprint. bio-protocol.org/prep1168.
Category
Do you have any questions about this protocol?
Post your question to gather feedback from the community. We will also invite the authors of this article to respond.