
- Home
- Protocols

-

Large-scale metabolome analysis

Last updated date: Dec 9, 2019 Views: 1606 Forks: 0
Metabolon Platform
Sample Accessioning: Following receipt, samples were inventoried and immediately stored at ‐80°C. Each sample received was accessioned into the Metabolon LIMS system and was assigned by the LIMS a unique identifier that was associated with the original source identifier only. This identifier was used to track all sample handling, tasks, results, etc. The samples (and all derived aliquots) were tracked by the LIMS system. All portions of any sample were automatically assigned their own unique identifiers by the LIMS when a new task was created; the relationship of these samples was also tracked. All samples were maintained at ‐80°C until processed
Sample Preparation: Samples were prepared using the automated MicroLab STAR® system from Hamilton Company. A recovery standard was added prior to the first step in the extraction process for QC purposes. To remove protein, dissociate small molecules bound to protein or trapped in the precipitated protein matrix, and to recover chemically diverse metabolites, proteins were precipitated with methanol under vigorous shaking for 2 min (Glen Mills GenoGrinder 2000) followed by centrifugation. The resulting extract was divided into four fractions: one for analysis by UPLC-MS/MS with positive ion mode electrospray ionization, one for analysis by UPLC‐MS/MS with negative ion mode electrospray ionization, one for analysis by GC-MS, and one sample was reserved for backup. Samples were placed briefly on a TurboVap® (Zymark) to remove the organic solvent. For LC, the samples were stored overnight under nitrogen before preparation for analysis. For GC, each sample was dried under vacuum overnight before preparation for analysis.
QA/QC: Several types of controls were analyzed in concert with the experimental samples: a pooled matrix sample generated by taking a small volume of each experimental sample (or alternatively, use of a pool of well-characterized human plasma) served as a technical replicate throughout the data set; extracted water samples served as process blanks; and a cocktail of QC standards that were carefully chosen not to interfere with the measurement of endogenous compounds were spiked into every analyzed sample, allowed instrument performance monitoring and aided chromatographic alignment. Tables 1 and 2 describe these QC samples and standards. Instrument variability was determined by calculating the median relative standard deviation (RSD) for the standards that were added to each sample prior to injection into the mass spectrometers. Overall process variability was determined by calculating the median RSD for all endogenous metabolites (i.e., non-instrument standards) present in 100% of the pooled matrix samples. Experimental samples were randomized across the platform run with QC samples spaced evenly among the injections, as outlined in Figure 1.
Table 1: Description of Metabolon QC Samples
Type | Description | Purpose |
MTRX | Large pool of human plasma maintained by Metabolon that has | Assure that all aspects of the Metabolon process are operating within specifications. |
| been characterized extensively. |
|
CMTRX | Pool created by taking a small aliquot from every customer sample. | Assess the effect of a non‐plasma matrix on the Metabolon process and distinguish biological variability from process variability. |
PRCS | Aliquot of ultra-pure water | Process Blank used to assess the contribution to compound signals from the process. |
SOLV | Aliquot of solvents used in extraction. | Solvent Blank used to segregate contamination sources in the extraction. |
Table 2: Metabolon QC Standards
Type | Description | Purpose |
RS | Recovery Standard | Assess variability and verify performance of extraction and instrumentation. |
DS | Derivatization Standard | Assess variability of derivatization for GC‐MS samples. |
IS | Internal Standard | Assess variability and performance of instrument. |
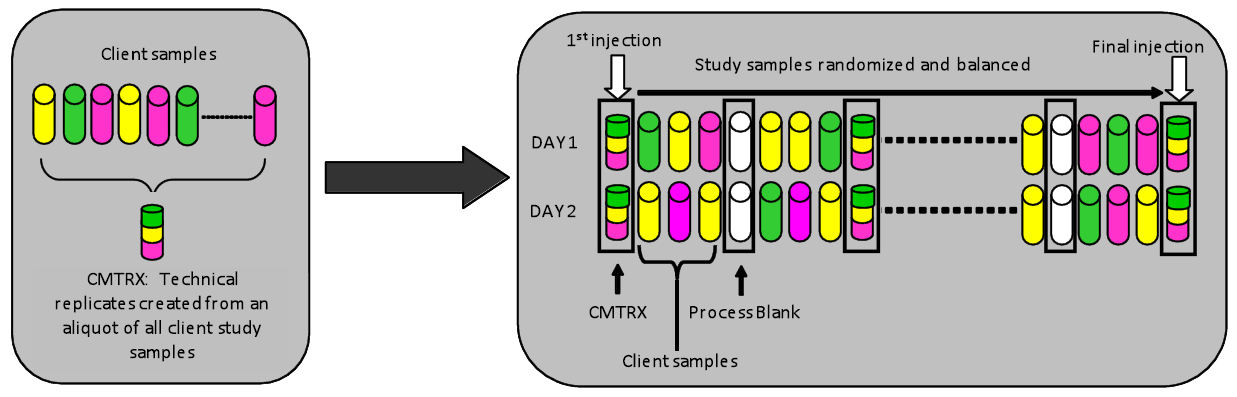
Figure 1. Preparation of client‐specific technical replicates. A small aliquot of each client sample (colored cylinders) is pooled to create a CMTRX technical replicate sample (multi-colored cylinder), which is then injected periodically throughout the platform run. Variability among consistently detected biochemicals can be used to calculate an estimate of overall process and platform variability.
Ultrahigh Performance Liquid Chromatography‐Tandem Mass Spectroscopy (UPLCMS/MS): The LC/MS portion of the platform was based on a Waters ACQUITY ultra‐performance liquid chromatography (UPLC) and a Thermo Scientific Q‐Exactive hig resolution/accurate mass spectrometer interfaced with a heated electrospray ionization (HESI‐II) source and Orbitrap mass analyzer operated at 35,000 mass resolution. The sample extract was dried then reconstituted in acidic or basic LC‐compatible solvents, each of which contained 8 or more injection standards at fixed concentrations to ensure injection and chromatographic consistency. One aliquot was analyzed using acidic positive ion optimized conditions and the other using basic negative ion optimized conditions in two independent injections using separate dedicated columns (Waters UPLC BEH C18-2.1x100 mm, 1.7 µm). Extracts reconstituted in acidic conditions were gradient eluted from a C18 column using water and methanol containing 0.1% formic acid. The basic extracts were similarly eluted from C18 using methanol and water, however with 6.5mM Ammonium Bicarbonate. The third aliquot was analyzed via negative ionization following elution from a HILIC column (Waters UPLC BEH Amide 2.1x150 mm, 1.7 µm) using a gradient consisting of water and acetonitrile with 10mM Ammonium Formate. The MS analysis alternated between MS and data-dependent MS2 scans using dynamic exclusion, and the scan range was from 80‐1000 m/z. Raw data files are archived and extracted as described below.
Gas Chromatography-Mass Spectroscopy (GC-MS): The samples destined for analysis by GC-MS were dried under vacuum for a minimum of 18 h prior to being derivatized under dried nitrogen using bistrimethyl-silyltrifluoroacetamide. Derivatized samples were separated on a 5% diphenyl / 95% dimethyl polysiloxane fused silica column (20 m x 0.18 mm ID; 0.18 um film thickness) with helium as carrier gas and a temperature ramp from 60° to 340°C in a 17.5 min period. Samples were analyzed on a Thermo-Finnigan Trace DSQ fast-scanning single-quadrupole mass spectrometer using electron impact ionization (EI) and operated at unit mass resolving power. The scan range was from 50–750 m/z. Raw data files are archived and extracted as described below.
Bioinformatics: The informatics system consisted of four major components, the Laboratory Information Management System (LIMS), the data extraction and peak-identification software, data processing tools for QC and compound identification, and a collection of information interpretation and visualization tools for use by data analysts. The hardware and software foundations for these informatics components were the LAN backbone, and a database server running Oracle 10.2.0.1 Enterprise Edition.
LIMS: The purpose of the Metabolon LIMS system was to enable fully auditable laboratory automation through a secure, easy to use, and highly specialized system. The scope of the Metabolon LIMS system encompasses sample accessioning, sample preparation and instrumental analysis and reporting and advanced data analysis. All of the subsequent software systems are grounded in the LIMS data structures. It has been modified to leverage and interface with the in‐house information extraction and data visualization systems, as well as third party instrumentation and data analysis software.
Data Extraction and Compound Identification: Raw data was extracted, peak-identified and QC processed using Metabolon’s hardware and software. These systems are built on a web-service platform utilizing Microsoft’s. NET technologies, which run on high-performance application servers and fiber-channel storage arrays in clusters to provide active failover and load-balancing. Compounds were identified by comparison to library entries of purified standards or recurrent unknown entities. Metabolon maintains a library based on authenticated standards that contains the retention time/index (RI), mass to charge ratio (m/z), and chromatographic data (including MS/MS spectral data) on all molecules present in the library. Furthermore, biochemical identifications are based on three criteria: retention index within a narrow RI window of the proposed identification, accurate mass match to the library +/- 0.005 amu, and the MS/MS forward and reverse scores between the experimental data and authentic standards. The MS/MS scores are based on a comparison of the ions present in the experimental spectrum to the ions present in the library spectrum. While there may be similarities between these molecules based on one of these factors, the use of all three data points can be utilized to distinguish and differentiate biochemicals. More than 3300 commercially available purified standard compounds have been acquired and registered into LIMS for distribution to both the LC-MS and GC-MS platforms for determination of their analytical characteristics. Additional mass spectral entries have been created for structurally unnamed biochemicals, which have been identified by virtue of their recurrent nature (both chromatographic and mass spectral). These compounds have the potential to be identified by future acquisition of a matching purified standard or by classical structural analysis.
Curation: A variety of curation procedures were carried out to ensure that a high quality data set was made available for statistical analysis and data interpretation. The QC and curation processes were designed to ensure accurate and consistent identification of true chemical entities, and to remove those representing system artifacts, mis-assignments, and background noise. Metabolon data analysts use proprietary visualization and interpretation software to confirm the consistency of peak identification among the various samples. Library matches for each compound were checked for each sample and corrected if necessary.
Metabolite Quantification and Data Normalization: Peaks were quantified using area-under-the-curve. For studies spanning multiple days, a data normalization step was performed to correct variation resulting from instrument inter-day tuning differences. Essentially, each compound was corrected in run-day blocks by registering the medians to equal one (1.00) and normalizing each data point proportionately (termed the“block correction; Figure 2). For studies that did not require more than one day of analysis, no normalization is necessary, other than for purposes of data visualization. In certain instances, biochemical data may have been normalized to an additional factor (e.g., cell counts, total protein as determined by Bradford assay, osmolality, etc.) to account for differences in metabolite levels due to differences in the amount of material present in each sample.
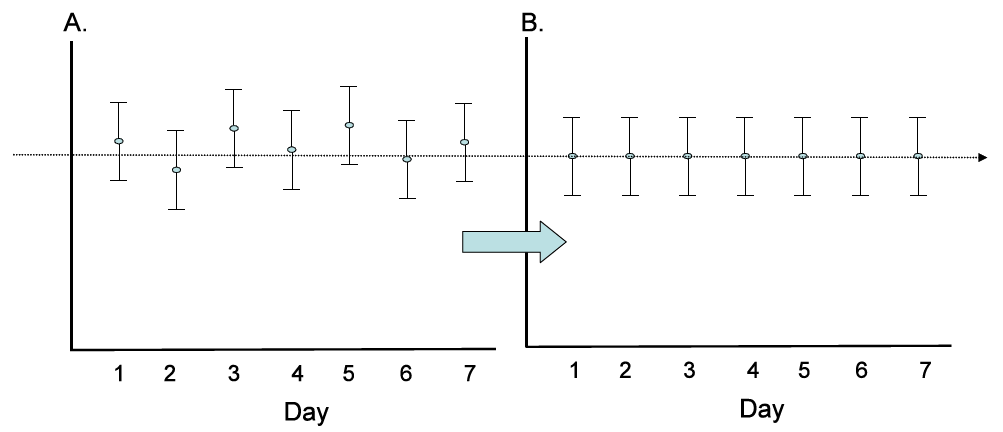
Figure 2: Visualization of data normalization steps for a multiday platform run.
- Maher, P and Currais, A(2019). Large-scale metabolome analysis. Bio-protocol Preprint. bio-protocol.org/prep102.
- Currais, A., Huang, L., Goldberg, J., Petrascheck, M., Ates, G., Pinto-Duarte, A., Shokhirev, M. N., Schubert, D. and Maher, P.(2019). Elevating acetyl-CoA levels reduces aspects of brain aging. eLife. DOI: 10.7554/eLife.47866
Category
Do you have any questions about this protocol?
Post your question to gather feedback from the community. We will also invite the authors of this article to respond.