


- Protocols

- Articles and Issues
- For Authors
- About
- Become a Reviewer


Modeling Tumor Cell Transendothelial Migration In Vitro: A Functional Assay for Metastatic Potential

(*contributed equally to this work) Published: Vol 16, Iss 22, Nov 20, 2026 DOI: 10.21769/BioProtoc.5895 Views: 34
 PDF
 Ask a question


Protocol Collections
Comprehensive collections of detailed, peer-reviewed protocols focusing on specific topics



Abstract
Metastasis of breast cancer (BC) cells remains one of the leading causes of cancer-related mortality among women worldwide and is therefore a major focus in molecular oncology research. Before disseminating and affecting vital organs, tumor cell intravasation into the circulatory system represents a key step in the complex metastatic process. To address this, we developed a robust and reproducible in vitro model to investigate the transmigration of BC cells across the endothelial barrier. The assay is based on a modified Boyden chamber assay, in which human umbilical vein endothelial cells (HUVECs) model the vascular wall. By optimizing cultivation conditions for endothelial cells and migration conditions for tumor cells, we established a stringent assay that allows the isolation of tumor cell subpopulations with more invasive characteristics for further use or analysis. The assay was established for estrogen receptor-positive (ER+) BC cells and their hormone therapy-resistant counterparts and can potentially be adapted to other tumor entities upon optimization, following the exemplary procedure for MCF7 and MCF7-TR cells demonstrated here.
Key features
• Adaptable assay parameters enable optimization for diverse cancer cell types and experimental needs, including FBS concentration, seeding timing, coating, pore size, and migration duration.
• Validated for endocrine therapy-resistant ER+ BC, this model captures the enhanced migratory behavior in resistant subpopulations, reflecting clinical metastatic progression.
• Enables isolation of migratory and non-migratory cells for downstream functional, molecular, or phenotypic analysis.
• Uses primary HUVECs to provide a physiologically relevant barrier, improving translational relevance over generic cell lines.
Keywords: Transendothelial tumor cell migration Intravasation
Transwell assay
Therapy-resistant ER+ breast cancer
GFP labeling
Graphical overview
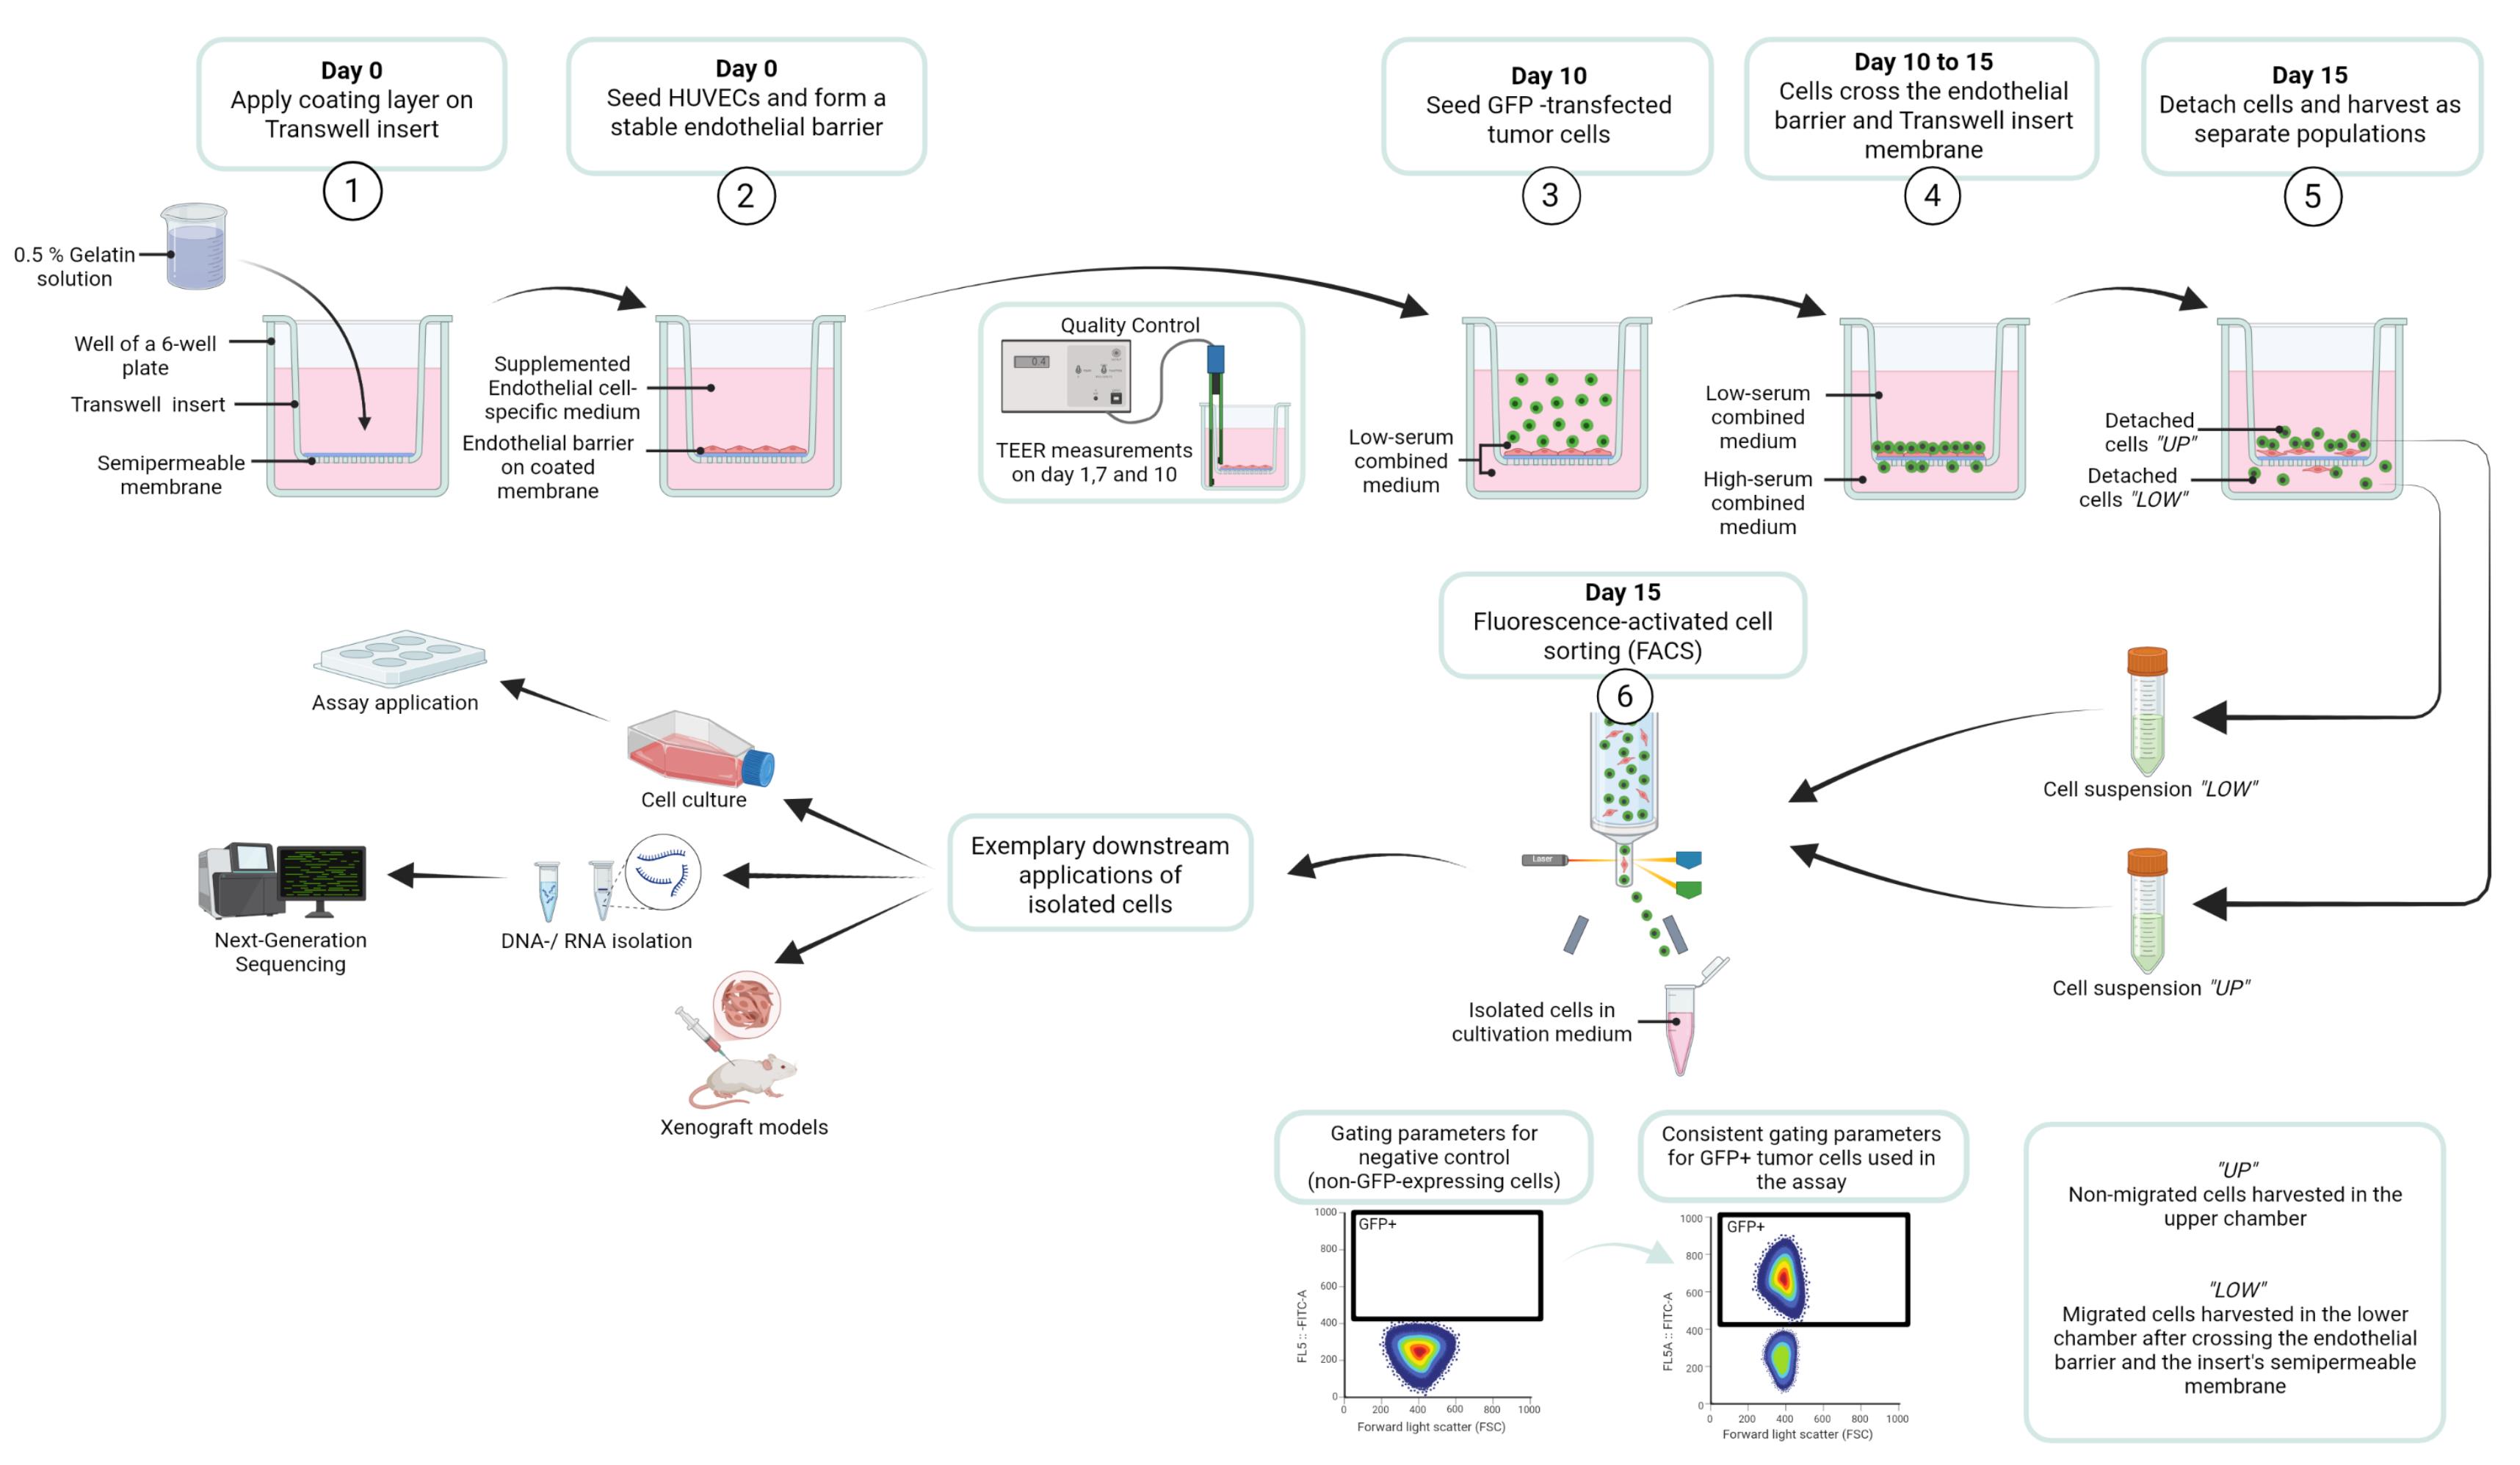
Workflow for the transendothelial migration assay designed to identify and isolate tumor cell subpopulations in MCF7 GFP and MCF7-TR GFP cells, based on their invasive capacity. Created in BioRender [1].
Background
Globally, approximately 1 in 20 women will be diagnosed with breast cancer (BC) during their lifetime, and 1 in 70 will die from the disease, though these rates vary significantly across countries and continents [2]. Estrogen receptor-positive (ER+) tumors account for approximately 70% of cases [3], underscoring the clinical and molecular significance of this subtype in both research and clinical settings.
Initially, ER+ BC typically exhibits sensitivity to selective estrogen receptor modulators (SERMs), including tamoxifen, which blocks estrogen-mediated proliferative signaling. However, acquired resistance during the therapeutic process remains a major clinical challenge, as it severely limits treatment efficacy [4].
During BC progression, formation of distant metastasis marks a critical turning point, transforming a potentially curable condition into a life-threatening disease [3]. As with most solid tumors, hematogenous dissemination is the predominant route of metastatic spread in breast cancer [5]. The metastatic cascade—driven by dynamic interactions between tumor cells and the tumor microenvironment—relies on intravasation into the bloodstream as a key, rate-limiting step. Once tumor cells breach the endothelial barrier and enter the bloodstream, disseminated tumor cells can seed distant organs, leading to metastatic colonization, poor prognosis, and increased metastasis-related mortality [6]. Understanding the mechanisms of intravasation, particularly across endothelial barriers, is therefore crucial for developing strategies to prevent metastatic spread.
To model tumor cell intravasation in vitro, we developed a physiologically relevant assay in which human endothelial cells are seeded on the apical side of porous tissue culture inserts to form a confluent, functional monolayer mimicking the vascular endothelium. For this purpose, HUVECs were chosen as an endothelial model due to their availability as a readily accessible and cost-effective human endothelial cell source with well-characterized responses to canonical stimuli and suitability for a wide range of standard in vitro vascular assays. FBS concentrations in the culture medium were optimized to enhance endothelial barrier stability on the one hand and to modulate migratory stimuli on the other hand, enabling controlled assessment of tumor cell migration and transendothelial invasion.
In order to facilitate the isolation and analysis of migratory versus non-migratory cell populations, BC cells were stably transfected with a GFP expression cassette using Sleeping Beauty transposon-mediated genome integration prior to seeding. After a predefined migration period, cells that had crossed the endothelial barrier were harvested and purified by fluorescence-activated cell sorting (FACS) for downstream analysis.
To compare migratory behavior, a 4-hydroxytamoxifen (4OHT)-resistant cell line established through chronic exposure to escalating 4OHT concentrations over several months was used [7]. This model enables the characterization of molecular adaptations associated with enhanced metastatic potential in therapy-resistant breast cancer.
Overall, this Transwell-based migration assay provides a robust platform for identifying key genes and signaling pathways driving metastasis, offering promising targets for future therapeutic strategies aimed at improving long-term patient outcomes.
Materials and reagents
Biological materials
1. HUVECs, isolated from human umbilical veins at the Department of Clinical Chemistry and the Department of Gynecology and Obstetrics, UMG Göttingen, following an in-house protocol as described in Willer et al. [8]; utilized in experiments at passages 3–5
2. MCF7 cells (ATCC, HTB-22); utilized in experiments up to passage 33
3. MCF7 GFP cells (ATCC, HTB-22, stably expressing a GFP reporter gene; see Section A); utilized in experiments up to passage 40
4. MCF7-TR cells (ATCC, HTB-22 variant with 4-OHT resistance developed by [7]); utilized in experiments up to passage 42
5. MCF7-TR GFP cells (ATCC, HTB-22 variant with 4-OHT resistance developed by [7], stably expressing a GFP reporter gene; see Section A); utilized in experiments up to passage 38
6. MG-63 cells (ATCC, CRL-1427); utilized in experiments up to passage 35
Reagents
A. Antibodies and staining solutions
1. APC anti-human CD31 antibody (BioLegend, catalog number: 303116)
2. DAPI (Novus Biologicals, catalog number: NBP2-31156), 1:1,000
3. Phalloidin 633 (Abcam, catalog number: ab176758), 1:400
4. Phalloidin 488 (Biolegend, catalog number: 424201), 1:400
5. Primary CD31 monoclonal antibody (mAb), mouse anti-human (DAKO, catalog number: M0823), 1:100
6. Primary ZO-1 (D7D12) mAb, rabbit anti-human (Cell Signaling Technology, catalog number: 8193), 1:100
7. Secondary antibody donkey anti-mouse IgG, Alexa Fluor 488 (Thermo Scientific, catalog number: A-21202), 1:400
8. Secondary antibody donkey anti-rabbit IgG, Alexa Fluor 555 (Thermo Scientific, catalog number: A-31572), 1:400
B. Cell culture reagents
1. Collagen I (BD Biosciences, catalog number: 354231)
2. DNAse I (NEB, catalog number: M0303S)
3. Fetal bovine serum (FBS) (Capricorn, catalog number: FBS-11A)
4. GFP Plasmid (Vector Builder: pSB[Exp]-CMV>EGFP, VB010000-9778kgx)
5. Insulin (Huminsulin 100, Eli Lilly, catalog number: HI0210)
6. Lipofectamine 2000 (Invitrogen, catalog number: 11668027)
7. Lipofectamine LTX reagent (Invitrogen, catalog number: 15338500)
8. Penicillin/streptomycin (Biowest, catalog number: L0022-100)
9. Paraformaldehyde (PFA) 4.5% (Chemsolute, catalog number: 2135.5000)
10. Poly-L-Lysine hydrochloride (Sigma-Aldrich, catalog number: P2658-25MG)
11. ROTI cell gelatin solution 2% (Roth, catalog number: 0646.1)
12. ROTI cell water (Roth, catalog number: 9186.1)
13. Transposase plasmid (Vector Builder, pRP[Exp]-CMV>T7/SB100X, VB010000-9366jzq)
14. Trypsin 0.05% EDTA (Pan-Biotech, catalog number: p10-027100)
15. Trypsin 0.25% EDTA (Pan-Biotech, catalog number: p10-020100)
16. TurboFect transfection reagent (Thermo Scientific, catalog number: R0531)
C. Cell culture media
1. Dulbecco's modified Eagle medium (DMEM) (Gibco, catalog number: 41966-029)
2. Dulbecco’s phosphate-buffered saline (DPBS) (Pan-Biotech, catalog number: P04-36500)
3. Endothelial cell growth medium 2 (EGCM2) (PromoCell, catalog number: C-22111)
4. Endopan 3 basal medium for endothelial cells (Pan-Biotech, catalog number: P04-0010K)
5. Medium 199 (Pan Biotech, catalog number: P04-07050)
6. Minimum essential medium (MEM) (Pan-Biotech, catalog number: P04-08500)
7. Opti-MEM I reduced serum medium (Gibco, catalog number: 51985026)
D. Other reagents
1. Bovine serum albumin (BSA) (Roth, catalog number: 3737.3)
2. Ethanol (99.9%) (Chemsolute, catalog number: 2212.5000)
3. Glycerol (Sigma-Aldrich, catalog number: 49767)
4. HCl (Merck, catalog number: 109057)
5. Mowiol 488 (Calbiochem, catalog number: 475904)
6. Sterile water (from Arium Mini Plus)
7. Tris hydrochloride (Roth, catalog number: 9090.3)
8. Triton X-100 (Merck, catalog number: 1086031000)
9. Tween-20 (ITW Reagents, catalog number: A4974)
Solutions
1. BSA (0.5% in DPBS) (see Recipes)
2. Collagen solution (0.1%) (see Recipes)
3. Combined medium (1.75% FBS) (see Recipes)
4. Combined medium (20% FBS) (see Recipes)
5. DMEM medium (see Recipes)
6. ECGM2 medium (see Recipes)
7. Endopan 3 medium (see Recipes)
8. Endopan 10 medium (see Recipes)
9. Endopan 15 medium (see Recipes)
10. Endopan 20 medium (see Recipes)
11. Ethanol 70% (see Recipes)
12. FACS buffer (see Recipes)
13. Gelatin solution (0.1%) (see Recipes)
14. Gelatin solution (0.2%) (see Recipes)
15. Gelatin solution (0.3%) (see Recipes)
16. Gelatin solution (0.4%) (see Recipes)
17. Gelatin solution (0.5%) (see Recipes)
18. Gelatin solution (0.6%) (see Recipes)
19. M199 medium (see Recipes)
20. MEM medium (see Recipes)
21. MEM medium (0.5% FBS) (see Recipes)
22. MEM medium (15% FBS) (see Recipes)
23. Mixed medium for endothelial cells (see Recipes)
24. Mowiol mounting medium (see Recipes)
25. DPBS-T (0.1% Tween-20) (see Recipes)
26. PFA (0.04%) (see Recipes)
27. Poly-L-Lysine solution (20 mg/mL) (see Recipes)
28. Poly-L-Lysine solution (0.1%) (see Recipes)
29. Staining solution with DAPI and Phalloidin (see Recipes)
30. Staining solution with primary antibodies (see Recipes)
31. Staining solution with secondary antibodies and Phalloidin, DAPI (see Recipes)
32. Tris-HCl (0.2 M, pH 8.5) (see Recipes)
33. Triton X-100 (1%) (see Recipes)
Recipes
1. BSA (0.5% in DPBS)
| Reagent | Final concentration | Volume for 50 mL |
|---|---|---|
| DPBS | n/a | 50 mL |
| BSA | 0.5% | 250 mg |
Stir for 1 h at room temperature. Aliquot and use or store at -20 °C.
2. Collagen solution (0.1%)
| Reagent | Final concentration | Volume for 1 mL |
|---|---|---|
| ROTI cell water | n/a | 966.7 μL |
| Collagen (30 mg/mL) | 0.1% | 33.3 μL |
3. Combined medium (1.75% FBS)
| Reagent | Final concentration | Volume for 500 mL |
|---|---|---|
| MEM medium (0.5% FBS) | 50% | 250 mL |
| Endopan 3 medium | 50% | 250 mL |
4. Combined medium (20% FBS)
| Reagent | Final concentration | Volume for 500 mL |
|---|---|---|
| MEM medium (10% FBS) | n/a | 200 mL |
| Endopan 3 medium | n/a | 200 mL |
| FBS | 20% | 67.5 mL |
5. DMEM medium
| Reagent | Final concentration | Volume for one bottle |
|---|---|---|
| DMEM | n/a | 500 mL |
| FBS | 20% | 126.6 mL |
| Penicillin/streptomycin | 1% | 6.4 mL |
6. ECGM2 medium
| Reagent | Final concentration | Volume for one bottle |
|---|---|---|
| ECGM2 | n/a | 500 mL |
| 7 supplements from kit | 1× | 700 μL |
| FBS from kit | 1× | 15 mL |
Follow the manufacturer’s recommendations.
7. Endopan 3 medium
| Reagent | Final concentration | Volume for one bottle |
|---|---|---|
| Endopan 3 | n/a | 500 mL |
| 8 supplements from kit | 1× | 800 μL |
| FBS from kit | 1× | 15 mL |
Follow the manufacturer’s recommendations.
8. Endopan 10 medium
| Reagent | Final concentration | Volume for one bottle |
|---|---|---|
| Endopan 3 | n/a | 500 mL |
| 8 supplements from kit | 1× | 800 μL |
| FBS from kit | 1× | 15 mL |
| Supplemented FBS | 10% | 40 mL |
9. Endopan 15 medium
| Reagent | Final concentration | Volume for one bottle |
|---|---|---|
| Endopan 3 | n/a | 500 mL |
| 8 supplements from kit | 1× | 800 μL |
| FBS from kit | 1× | 15 mL |
| Supplemented FBS | 15% | 73 mL |
10. Endopan 20 medium
| Reagent | Final concentration | Volume for 500 mL |
|---|---|---|
| Endopan 3 | n/a | 500 mL |
| 8 supplements from kit | 1× | 800 μL |
| FBS from kit | 1× | 15 mL |
| Supplemented FBS | 20% | 110 mL |
11. Ethanol 70%
| Reagent | Final concentration | Volume for 50 mL |
|---|---|---|
| Sterile water | n/a | 15 mL |
| Ethanol (99.9%) | 70% | 35 mL |
12. FACS buffer
| Reagent | Final concentration | Volume for 50 mL |
|---|---|---|
| DPBS | n/a | 45 mL |
| FBS | 10% | 5 mL |
13. Gelatin solution (0.1%)
| Reagent | Final concentration | Volume for 1 mL |
|---|---|---|
| ROTI cell water | n/a | 950 μL |
| ROTI cell gelatin solution (2%) | 0.1% | 50 μL |
14. Gelatin solution (0.2%)
| Reagent | Final concentration | Volume for 1 mL |
|---|---|---|
| ROTI cell water | n/a | 900 μL |
| ROTI cell gelatin solution (2%) | 0.2% | 100 μL |
15. Gelatin solution (0.3%)
| Reagent | Final concentration | Volume for 1 mL |
|---|---|---|
| ROTI cell water | n/a | 850 μL |
| ROTI cell gelatin solution (2%) | 0.3% | 150 μL |
16. Gelatin solution (0.4%)
| Reagent | Final concentration | Volume for 1 mL |
|---|---|---|
| ROTI cell water | n/a | 800 μL |
| ROTI cell gelatin solution (2%) | 0.4% | 200 μL |
17. Gelatin solution (0.5%)
| Reagent | Final concentration | Volume for 1 mL |
|---|---|---|
| ROTI cell water | n/a | 750 μL |
| ROTI cell gelatin solution (2%) | 0.5% | 250 μL |
18. Gelatin solution (0.6%)
| Reagent | Final concentration | Volume for 1 mL |
|---|---|---|
| ROTI cell water | n/a | 700 μL |
| ROTI cell gelatin solution (2%) | 0.6% | 300 μL |
19. M199 medium
| Reagent | Final concentration | Volume for one bottle |
|---|---|---|
| Medium 199 | n/a | 500 mL |
| FBS | 20% | 126.6 mL |
| Penicillin/streptomycin | 1% | 6.4 mL |
20. MEM medium
| Reagent | Final concentration | Volume for one bottle |
|---|---|---|
| MEM | n/a | 500 mL |
| FBS | 10% | 56 mL |
| Penicillin/streptomycin | 1% | 5.6 mL |
| Insulin 100 I.E./mL | 0.3% | 1.6 mL |
21. MEM medium (0.5% FBS)
| Reagent | Final concentration | Volume for one bottle |
|---|---|---|
| MEM | n/a | 500 mL |
| FBS | 0.5% | 2.6 mL |
| Penicillin/streptomycin | 1% | 5.1 mL |
| Insulin 100 I.E/mL | 0.3% | 1.5 mL |
22. MEM medium (15% FBS)
| Reagent | Final concentration | Volume for one bottle |
|---|---|---|
| MEM | n/a | 500 mL |
| FBS | 15% | 89 mL |
| Penicillin/streptomycin | 1% | 6 mL |
| Insulin 100 I.E./ mL | 0.3% | 1.8 mL |
23. Mixed medium for endothelial cells
| Reagent | Final concentration | Volume for one bottle |
|---|---|---|
| ECGM2 medium | 50% | 250 mL |
| M199 medium | 50% | 250 mL |
24. Mowiol mounting medium
| Reagent | Final concentration | Mass or volume for 50 mL |
|---|---|---|
| Mowiol 488 | 9.6% | 4.8 g |
| Glycerol | 24% | 12 g |
| Sterile water | n/a | 12 mL |
| Tris-HCl (0.2 M, pH 8.5) | 0.1 M | 24 mL |
Mix Mowiol 488 and glycerol with frequent agitation for 1 h at room temperature. Add sterile water and use a stir bar and magnetic stirrer to mix for 1 h at room temperature. Add Tris-HCl and incubate for 2 h at 50 °C with occasional stirring (e.g., stir for 2 min every 20 min). Centrifuge at 5,000× g for 15 min. Aliquot the supernatant and store at -20 °C.
25. DPBS-T (0.1% Tween-20)
| Reagent | Final concentration | Volume for 50 mL |
|---|---|---|
| DPBS | n/a | 50 mL |
| Tween | 0.1% | 50 μL |
26. PFA (0.04%)
| Reagent | Final concentration | Volume for 50 mL |
|---|---|---|
| DPBS | n/a | 49.6 mL |
| PFA (4.5%) | 0.04% | 440 μL |
27. Poly-L-lysine solution (20 mg/mL)
| Reagent | Final concentration | Volume for 10 mL |
|---|---|---|
| DPBS | n/a | 10 mL |
| Poly-L-lysine hydrochloride | 2% | 200 mg |
Mix thoroughly, aliquot, and either use immediately or store at -20 °C.
28. Poly-L-lysine solution (0.1%)
| Reagent | Final concentration | Volume for 1 mL |
|---|---|---|
| ROTI cell water | n/a | 950 μL |
| Poly-L-lysine (20 mg/mL) | 0.1% | 50 μL |
Use immediately.
29. Staining solution with DAPI and Phalloidin
| Reagent | Final concentration | Volume for 2.5 mL |
|---|---|---|
| DPBS | n/a | 2.47 mL |
| DAPI (1 mg/mL) | 1:1,000 | 2.5 μL |
| Phalloidin 488 (1 mg/mL) | 1:400 | 25 μL |
30. Staining solution with primary antibodies
| Reagent | Final concentration | Volume for 1.5 mL |
|---|---|---|
| BSA (0.5% in DPBS) | n/a | 1.47 mL |
| Primary CD31 mAb, mouse anti-human | (1:100) | 15 μL |
| Primary ZO-1 mAb, rabbit anti-human | (1:100) | 15 μL |
31. Staining solution with secondary antibodies and Phalloidin, DAPI
| Reagent | Final concentration | Volume for 1.5 mL |
|---|---|---|
| BSA (0.5% in DPBS) | n/a | 1.49 mL |
| Secondary antibody donkey anti-mouse IgG | (1:400) | 3.75 μL |
| Secondary antibody donkey anti-rabbit IgG | (1:400) | 3.75 μL |
| Phalloidin 633 (1 mg/mL) | (1:400) | 3.75 μL |
| DAPI (1 mg/mL) | (1:1,000) | 1.5 μL |
32. Tris-HCl (0.2 M, pH 8.5)
| Reagent | Final concentration | Volume for 1 L |
|---|---|---|
| Sterile water | n/a | 1 L |
| Tris hydrochloride | 0.2 M | 24.2 g |
| HCl | 1× | Dropwise to pH 8.5 |
Dissolve Tris hydrochloride in 800 mL of sterile water. While stirring with a stir bar on a magnetic stirrer, add HCl dropwise to adjust the pH to 8.5. Then, add sterile water to a final volume of 1 L. Store at room temperature.
33. Triton X-100 (1%)
| Reagent | Final concentration | Volume for 50 mL |
|---|---|---|
| DPBS | n/a | 49.5 mL |
| Triton-X 100 | 1% | 0.5 mL |
Mix and store at room temperature.
Laboratory supplies
1. Aluminum foil (Labsolute, catalog number: 7696857)
2. Conical tube sterile 15 mL (Greiner Bio-One, catalog number: 188271-N)
3. Conical tube sterile 50 mL (Greiner Bio-One, catalog number: 227261)
4. Cotton buds 150 mm (Beese, catalog number: 1260)
5. Coverslips (Roth, catalog number: HKE5.1)
6. Disposable gloves (Nitril NextGen, catalog number: 1283)
7. Eppendorf tube 0.5 mL (Eppendorf, catalog number: 0030121023)
8. Eppendorf tube 1.5 mL (Eppendorf, catalog number: 0030120086)
9. FACS tubes (Sarstedt, catalog number: 55.526.006)
10. Glass slides (Marienfeld, catalog number: 08-104-01)
11. Handheld counter (Roth Selection, catalog number: EE53.1)
12. Monarch Spin RNA Isolation kit (Mini) (NEB, catalog number: T2110L)
13. Neubauer counting chamber (Blaubrand, catalog number: 717805)
14. Paper towels (Tapira, catalog number: 07730008)
15. Parafilm M 100 mm (Amcor, catalog number: PM999)
16. Pasteur pipettes (Labsolute, catalog number: 7691061)
17. Pipette tips 10 μL (Sarstedt, catalog number: 70.3010.100)
18. Pipette tips 200 μL (Sarstedt, catalog number: 70.3030.020)
19. Pipette tips 1,000 μL (Sarstedt, catalog number: 70.3050.200)
20. PluriStrainer filter mini 40 μm (PluriSelect, catalog number: 43-10040-50)
21. Pyrex beaker 100 mL (Brand, catalog number: BR91224)
22. Scalpel sterile (Swann-Morton, catalog number: 0507)
23. Serological pipette 2 mL (Sarstedt, catalog number: 86.1252.001)
24. Serological pipette 5 mL (Sarstedt, catalog number: 86.1253.001)
25. Serological pipette 10 mL (Sarstedt, catalog number: 86.1254.001)
26. Square Petri dish non-sterile (Greiner Bio-One, catalog number: 688102)
27. TC flask T25 (Sarstedt, catalog number: 83.3910.002)
28. TC flask T75 (Sarstedt, catalog number: 83.3911.002)
29. TC inserts 6-well 1 μm pores (Sarstedt, catalog number: 83.3930.100)
30. TC inserts 6-well 3 μm pores (Sarstedt, catalog number: 83.3930.300)
31. TC inserts 6-well 5 μm pores (Sarstedt, catalog number: 83.3930.500)
32. TC inserts 6-well 8 μm pores (Sarstedt, catalog number: 83.3930.800)
33. TC inserts 24-well 5 μm pores (Sarstedt, catalog number: 83.3932.500)
34. TC inserts 24-well 8 μm pores (Sarstedt, catalog number: 83.3932.800)
35. TC plate 6-well (Sarstedt, catalog number: 83.3920)
36. TC plate 24-well (Sarstedt, catalog number: 83.3922)
37. Tweezers, blunt and curved (Roth, catalog number: PX30.1)
Equipment
1. Arium Mini Plus (Sartorius, model: H2O-MA-UV-T)
2. Automated cell counter (DeNovix Cell Drop BF)
3. Bead bath (Thermo Fisher, model: Precision GP 10)
4. Benchtop centrifuge (Eppendorf, model: 5415D)
5. Centrifuge (Heraeus Instruments, model: Labofuge 400)
6. Chemical fume hood (Köttermann, model: 2-401-DAAAGY)
7. CO2 incubator (HERAcell 150i)
8. Digital CMOS camera (Hamamatsu Photonics, model: ORCA-spark)
9. FACS instrument (BD Biosciences, model: Aria II)
10. Flow cytometer (Beckman Coulter, model: Cytoflex S)
11. Fluorescent microscope (Olympus, model: IX 83)
12. Ice machine (Scotsman, model: AF80 XSafe)
13. Magnetic stir bars (Roth, catalog number: X171.1)
14. Magnetic stirrer (IKA RCT basic, catalog number: Z645060)
15. Microscope (Nikon, model: Eclipse TS100)
16. Mini centrifuge (Biozym, catalog number: 552032)
17. pH meter Lab 860 Set (Schott Instruments, catalog number: 102711330)
18. Pipettes 2.5 μL, 10 μL, 100 μL, 200 μL, 1,000 μL (Eppendorf, catalog number: 492940)
19. Pipette controller (Integra Biosciences, catalog number: 155016)
20. Sterile cell culture hood (Thermo Scientific, model: Herasafe 2025 1.2)
21. TEER electrode (Millicell ERS-2 Replacement Electrode)
22. TEER measurement device (Millicell ERS-2)
23. Vortex machine (Scientific Industries, model: Vortex-Genie 2)
Software and datasets
1. CellSens Dimension (Olympus, version 3.2) for acquiring images with the inverted fluorescence microscope Olympus IX83
2. CytExpert Software (Beckman Coulter, version 2.5) for flow cytometry
3. Excel (Microsoft Office 2019, version 16.0) for quantitative analyses
4. Fiji (open-source distribution of ImageJ, version 1.54) for visual and quantitative analyses
5. FlowJo software (BD Biosciences, version 10.0.1) for FACS data analyses
6. GraphPad Prism (version 8.0.1) for statistical analyses
Procedure
The following protocols provide a general, adaptable framework for assessing the invasive potential of various tumor cell lines using a transendothelial migration assay. As they were established and validated for estrogen receptor-positive (ER+) breast cancer cells (MCF7) and their tamoxifen-resistant counterparts (MCF7-TR), the procedures include exemplary adjustments of parameters and experimental outcomes for these cell lines. When applying the assay to other tumor cell types, it is essential to first generate fluorescently labeled cells (Section A) and independently assess optimal pore size and migration duration as outlined in Sections B and C. This approach allows the transendothelial migration assay—described in Section D—to be performed under tumor cell line–specific conditions, ensuring reliable, reproducible, and biologically relevant results. These selected cells can then be used for further applications, such as cell culture assays, next-generation sequencing (NGS) of mRNA or DNA samples, or the generation of xenograft models.
A. Fluorescent labeling of tumor cells using the Sleeping Beauty transposon system
Fluorescent labeling of tumor cells enables real-time tracking and quantitative analysis in downstream assays. Stable expression of green fluorescent protein (GFP) is achieved via transfection using the Sleeping Beauty transposon system.
1. Cell culture: Culture parental and resistant tumor cells in T75 flasks in cell-specific complete culture medium under humidified conditions at 37 °C and 5% CO2 until they reach ~80% confluence.
Note: For the study on ER+ BC, MCF7 and MCF7-TR cells were cultured in T75 flasks, and MEM medium was used as the cell-specific complete medium throughout the experiment.
2. (Day 0) Cell seeding
a. Trypsinize and count parental and resistant tumor cells and prepare for seeding (see General notes 1, 2, and 3).
b. Seed 3 × 10⁵ cells in 2 mL of cell-specific medium per well in a 6-well plate, using at least one well per cell line.
c. Incubate the plate overnight in a humidified atmosphere at 37 °C and 5% CO2 to allow cell attachment to the tissue culture surface prior to transfection.
3. (Day 1) Preparation of the transfection mixture
a. Thaw the transfection reagent and plasmid DNA (GFP construct and transposase plasmid) on ice.
b. Prepare one 1.5 mL Eppendorf tube per well, each containing 400 μL of Opti-MEM.
c. Add 1,000 ng of GFP plasmid (5,133 bp) and 775.2 ng of transposase plasmid (3,979 bp) in equimolar ratios to the tube.
Equimolarity calculation:
Quantity of transposase plasmid: 0.7752 × 1,000 ng = 775.2 ng
d. Mix gently by brief vortexing.
e. Add 9 μL of TurboFect transfection reagent to the mixture and immediately mix thoroughly by vortexing for 10 s to ensure homogeneous complex formation and optimal transfection efficiency.
f. Incubate the transfection mixture for 20 min at room temperature.
4. (Day 1) Transfection of cells
a. Replace the cultivation medium in wells with 1.6 mL of Opti-MEM per well 5 min before the end of the incubation time (see General notes 1 and 4).
Note: Use Opti-MEM as the culture medium during transfection to minimize interference from serum components and promote efficient formation of transfection complexes, thereby enhancing gene delivery and expression.
b. After incubation of the transfection mixture, add the solution dropwise onto the cell monolayer. Gently move the plate back and forth in two directions to ensure homogeneous distribution of the transfection mixture across the well.
Critical: Avoid circular movements of the plate, as they may cause uneven cell distribution toward the periphery of the well.
c. Incubate transfected cells overnight at 37 °C and 5% CO2.
5. (Day 2) Post-transfection handling
a. Replace the Opti-MEM-based transfection mixture with complete cell-specific culture medium 24 h after transfection. Critical: Although Opti-MEM is essential for efficient transfection complex formation, prolonged exposure can compromise cell viability. Therefore, replace it with complete cell-specific medium as early as possible—preferably the following morning or within 24 h post-transfection.
b. Assess GFP expression using an inverted fluorescence microscope. Upon confirmation of a robust fluorescence signal, maintain and expand transfected cell populations under standard conditions at 37 °C and 5% CO2 until sorting for GFP-positive cells.
6. (Day 6) Cell sorting
a. On day 5 post-transfection, use FACS to isolate GFP-positive cells and expand the sorted population in a 6-well plate or a T25 flask, depending on the number of selected cells.
Note: Seed up to 100,000 cells into a 6-well plate and transfer them to a T25 flask at ~80% confluence, or seed directly into a T25 flask if more than 100,000 cells are obtained by FACS.
b. Once the cells have regained confluence, conduct a second FACS round to ensure a highly pure and homogeneous population of stably GFP-expressing cells.
B. Optimization of pore size for the tumor cell migration assay
Cancer cells exhibit variable size and morphology, which critically influence their ability to migrate through porous membranes during transendothelial migration assays. Cell diameter determines the extent to which cells can physically traverse membrane pores, necessitating careful selection of pore size to balance selection pressure and assay feasibility [9]. To assess intrinsic migratory potential and determine the corresponding pore size, pore diameters from 1 to 8 μm were compared using GFP-expressing parental and resistant cells in the absence of an endothelial barrier. Flow cytometry enables accurate quantification of migrated cells.
1. Cell culture: Cultivate three biological replicates of both cell lines—parental and resistant tumor cells—as well as one replicate of non-GFP-expressing variants of each cell line at 37 °C and 5% CO2 until they reach ~80% confluence.
Note: For flow cytometric analysis, use cells stably expressing a reporter protein (e.g., GFP). Culture cells in T75 flasks (one flask per biological replicate) to ensure adequate cell numbers. The yield per flask may vary depending on the cell line. Prepare non-transfected cells for determination of gating parameters.
2. (Day 0) Transwell insert preparation
a. Prepare two 6-well plates per tumor cell line to test four different pore sizes (1, 3, 5, and 8 μm) as outlined in Table 1.
Note: Use only two different pore sizes per 6-well plate to maintain a better workflow during harvesting.
Table 1. Exemplary seeding scheme for comparing pore size diameters of inserts in 6-well plates for parental and tamoxifen-resistant MCF7 cells
| MCF7 GFP | MCF7-TR GFP | |||||
| 1 μm | 1,200,000 cells | 1,200,000 cells | 1,200,000 cells | 1,200,000 cells | 1,200,000 cells | 1,200,000 cells |
| 3 μm | 1,200,000 cells | 1,200,000 cells | 1,200,000 cells | 1,200,000 cells | 1,200,000 cells | 1,200,000 cells |
| 5 μm | 1,200,000 cells | 1,200,000 cells | 1,200,000 cells | 1,200,000 cells | 1,200,000 cells | 1,200,000 cells |
| 8 μm | 1,200,000 cells | 1,200,000 cells | 1,200,000 cells | 1,200,000 cells | 1,200,000 cells | 1,200,000 cells |
b. To equilibrate the membranes of Transwell inserts, add the low-serum variant of tumor cell-specific medium (containing 0.5% FBS) to all wells and inserts and incubate for 1 h at 37 °C and 5% CO2 (see General notes 5 and 6).
3. (Day 0) Tumor cell seeding and migration induction
a. Trypsinize and count cells from all three biological replicates of parental and resistant GFP-expressing cells (see General notes 2 and 3).
b. Aspirate medium from wells and inserts, refresh with 3 mL of medium (0.5% FBS) in wells, and seed 1.2 × 10⁶ cells in 2 mL of medium (0.5% FBS) per insert (see General note 4).
c. Gently swirl the plate back and forth in two directions to ensure even distribution and incubate for 1 h at 37 °C and 5% CO2 to allow tumor cells to settle onto the insert membrane.
Caution: Move the plate bidirectionally only; avoid circular movements to prevent uneven cell seeding.
d. To induce tumor cell migration across the semipermeable insert membrane, create an FBS concentration gradient by replacing the medium in wells with 3 mL of the high-serum variant of the cultivation medium (15% FBS).
Critical: Depending on the pore size, medium from the insert may flow through the membrane into the wells upon lifting. To prevent disruption of the cell monolayer, perform the medium exchange quickly and carefully. If necessary, refill inserts with 2 mL of low-serum medium (0.5% FBS).
e. Incubate cells for 4 days at 37 °C and 5% CO2.
4. (Day 4) Preparation for tumor cell harvesting and experiment analysis
a. On day 4 post-seeding, prepare the following tubes:
i. Two 15 mL conical tubes per well, each containing 2 mL of complete cell-specific medium: one "LOW" for migrated cells on the lower surface of the insert membrane and one "UP" for non-migrated cells on the upper membrane surface of the Transwell system.
ii. One 15 mL conical tube per cell line for the non-GFP-expressing variant without added medium.
iii. One FACS tube for each of the previously prepared conical tubes.
Note: Ensure a total of 25 FACS tubes per cell line are available at this stage: 12 “UP” tubes, 12 “LOW” tubes, and one tube for control cells.
b. Place PluriStrainer filters on top of each pre-labeled conical tube.
Note: Filtering the cell suspension after harvesting ensures the formation of a single-cell suspension and prevents clogging of the flow cytometer instrument.
c. Prepare non-GFP-expressing variants of parental and resistant cells for GFP gating. To do so, trypsinize the cells, pass the cell suspension through a PluriStrainer filter into the pre-labeled conical tube, and centrifuge at 300× g for 5 min. Resuspend the resulting cell pellets in 500 μL of FACS buffer each, add 10 µL of 20 U/mL DNAse I, and incubate for 10 min at 37 °C. Centrifuge at 300× g for 5 min. Aspirate the supernatant and resuspend cell pellets in 500 µL of FACS buffer again, then transfer into pre-labeled FACS tubes.
Note: This control sample enables accurate optimization of detector gain and gating parameters, ensuring specific and reliable detection of GFP-positive cells during subsequent analysis. Since the acquisition of resistance may be associated with phenotypic alterations in cells, it is essential to include non-GFP-expressing cells as controls for each cell line independently.
5. (Day 4) Tumor cell harvesting
Note: As the harvesting procedure is time-consuming and cells are sensitive to prolonged trypsin treatment, harvest cells from only one 6-well plate at a time.
a. Aspirate media and wash cells in wells and inserts with DPBS for 1 min (see General note 4).
b. Use 2 mL of trypsin (0.25% EDTA) in wells and 1 mL in inserts to detach cells from insert membranes. Incubate for 10 min at 37 °C and 5% CO2.
c. To harvest migrated cells from the lower surface of the insert membrane, carefully lift the insert at a 45° angle above the well. Use the trypsin solution present in the well to perform 6–8 gentle washes of the insert’s lower surface, allowing the resulting cell suspension to flow back into the well. For efficient handling, use a 1,000 μL pipette. Subsequently, transfer the trypsin–cell suspension through a PluriStrainer filter into the pre-labeled conical tube designated "LOW" to collect harvested cells.
d. Repeat the washing procedure with 2 mL of DPBS and transfer the DPBS–cell suspension through the PluriStrainer filter into the conical tube "LOW."
e. To harvest cells from the upper surface of the membrane, gently wash off adherent cells with the remaining trypsin in the insert. Perform 6–8 washes with a 1,000 μL pipette and transfer the resulting trypsin–cell suspension through the PluriStrainer filter into the pre-labeled conical tube "UP."
f. Repeat the washing procedure with 1 mL of complete culture medium and transfer the suspension into the conical tube "UP."
g. Rinse the PluriStrainer filters thoroughly with an additional 2 mL of DPBS each to ensure complete collection of cells retained in the filter membranes before discarding all filters.
6. (Day 4) Preparation for flow cytometry and subsequent analysis
a. Centrifuge cell suspensions at 300× g for 5 min at room temperature. Discard the supernatant and resuspend the resulting cell pellets in 500 μL of FACS buffer each.
b. To ensure single-cell suspensions, add 10 μL of 20 U/mL DNAse I to each tube and incubate for 10 min at 37 °C.
Critical: This step digests extracellular DNA released during lysis of dying cells, which can otherwise form viscous aggregates, compromise cell suspension quality, and cause clogging of the flow cytometer.
c. Centrifuge again at 300× g for 5 min, resuspend in 500 μL of FACS buffer, and transfer cell suspensions into the pre-labeled FACS tubes.
d. Perform flow cytometry to quantify tumor cell migration and use FlowJo for data analysis.
As an example, when following the protocol, MCF7 GFP and MCF7-TR GFP cells were cultured in biological triplicates for the assessment of appropriate pore size when performing the transendothelial migration assay. MEM medium was used as the complete cell-specific culture medium, with adjusted FBS concentrations for low-serum variants (MEM medium, 0.5% FBS) and high-serum variants (MEM medium, 15% FBS). The results revealed a significantly enhanced migratory capacity in MCF7-TR GFP cells compared to parental MCF7 GFP cells, reflecting distinct invasive phenotypes as depicted in Figure 1. To enable a fair and stringent comparison under consistent physical constraints, inserts with 5 μm pores were selected for both cell lines (MCF7 GFP and MCF7-TR cells). This pore diameter provided sufficient selectivity to maintain discriminatory power while allowing efficient transmigration of both cell lines, ensuring biological relevance and analytical rigor in the assessment of migration dynamics.
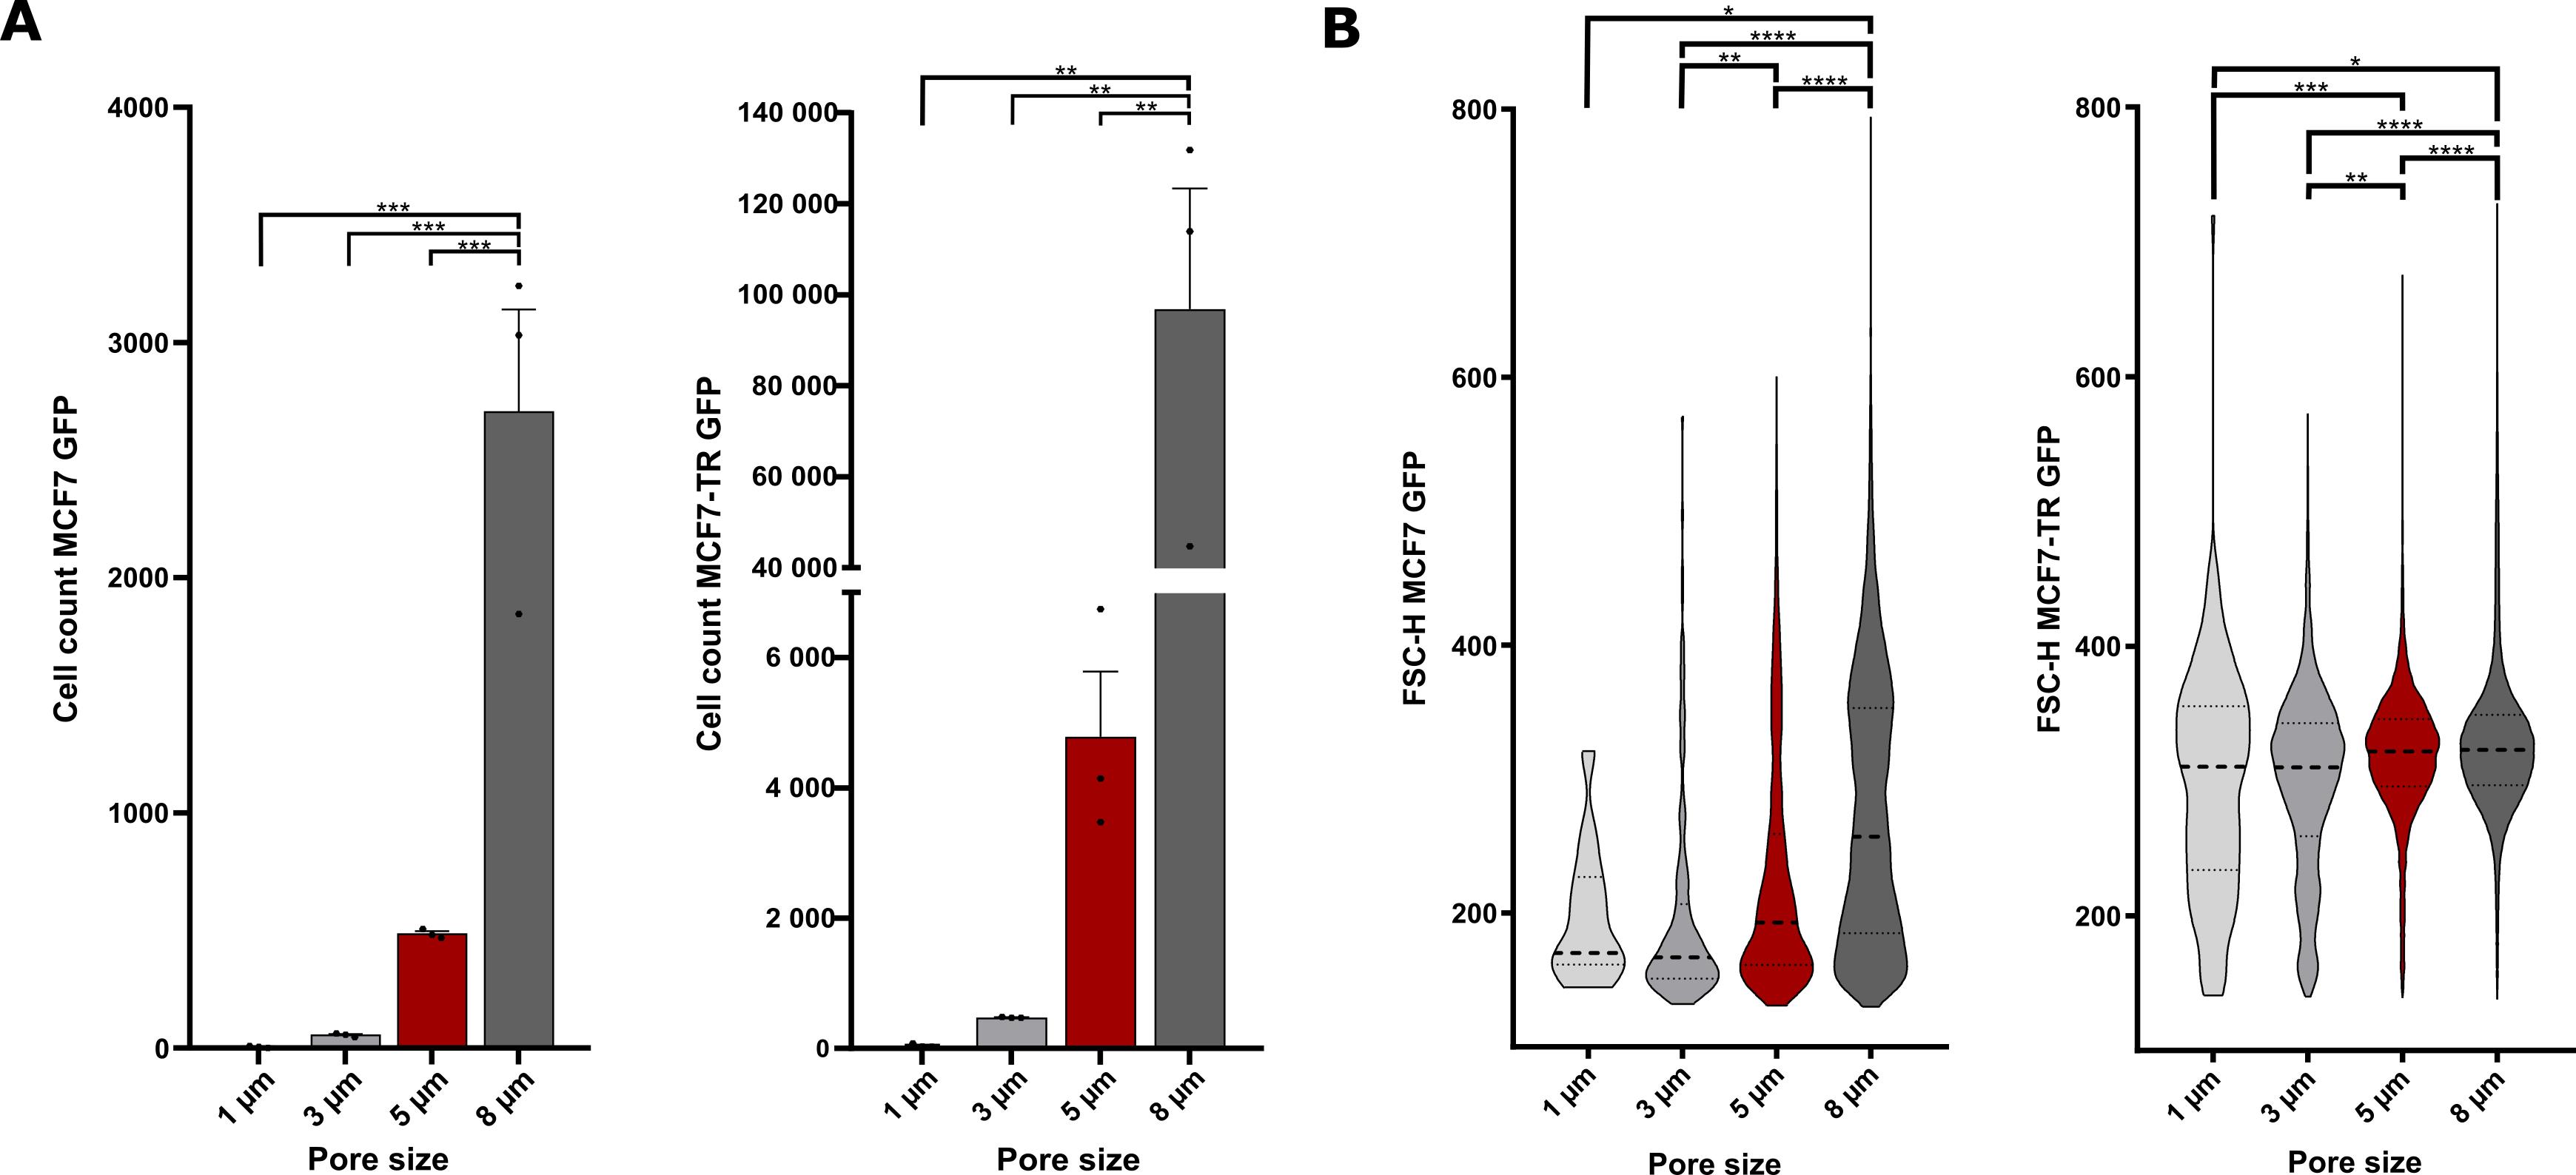
Figure 1. Pore sizes of the insert membranes for MCF7 GFP and MCF7-TR GFP cells. (A) Number of migrated MCF7 GFP cells (left panel) and MCF7-TR GFP cells (right panel) detected by flow cytometry after transmigrating through 1, 3, 5, and 8 μm pores. (B) Size of migrated MCF7 GFP (left panel) and MCF7-TR GFP cells (right panel) detected by flow cytometry after transmigrating through different pore sizes. One-way ANOVAs; *p < 0.05, **p ≤ 0.01, ***p ≤ 0.001, ****p ≤ 0.0001. Error bars are the standard error of the mean (SEM). The experiment was performed in biological triplicates per condition.
C. Optimization of migration duration for tumor cell transendothelial migration
To establish stringent parameters for tumor cell migration, the number of migrated parental and resistant tumor cells was quantified at multiple time points following assay initiation to assess transendothelial migration through the HUVEC layer and semipermeable membranes of the inserts. Migrated cells were fixed after 4, 5, and 6 days of migration and visualized using fluorescence microscopy.
1. Cell culture
a. Culture pooled HUVECs in Endopan 3 medium under standard conditions at 37 °C and 5% CO2 until two T75 flasks reach ~80% confluence (see General note 7).
b. Simultaneously, culture three biological replicates of GFP-expressing parental and resistant tumor cells in tumor cell-specific cultivation medium under standard conditions.
Note: If cells are freshly thawed, thaw HUVECs several days in advance, as they are required earlier in the experimental timeline and may proliferate more slowly than tumor cells.
2. (Day 0) Membrane equilibration and transendothelial electrical resistance (TEER) measurements
a. Prepare a 24-well plate with 19 inserts of 5 μm pore size to include three inserts per migration duration and cell line, plus one additional insert without cells (see Table 2).
Note: This last insert serves as a negative control for normalization of TEER measurements. At this stage, adjust the pore size according to the pore size optimization step (see Section B).
Table 2. Exemplary seeding scheme to determine optimal migration durations for MCF7 and MCF7-TR breast cancer cells
| MCF7 GFP | MCF7-TR GFP | |||||
| Fix on day 14 | 120,000 HUVECs, 80,000 MCF7 | 120,000 HUVECs, 80,000 MCF7 | 120,000 HUVECs, 80,000 MCF7 | 120,000 HUVECs, 80,000 MCF7 | 120,000 HUVECs, 80,000 MCF7 | 120,000 HUVECs, 80,000 MCF7 |
| Fix on day 15 | 120,000 HUVECs, 80,000 MCF7 | 120,000 HUVECs, 80,000 MCF7 | 120,000 HUVECs, 80,000 MCF7 | 120,000 HUVECs, 80,000 MCF7 | 120,000 HUVECs, 80,000 MCF7 | 120,000 HUVECs, 80,000 MCF7 |
| Fix on day 16 | 120,000 HUVECs, 80,000 MCF7 | 120,000 HUVECs, 80,000 MCF7 | 120,000 HUVECs, 80,000 MCF7 | 120,000 HUVECs, 80,000 MCF7 | 120,000 HUVECs, 80,000 MCF7 | 120,000 HUVECs, 80,000 MCF7 |
| Control (w/o cells) | Endopan 20 medium | |||||
b. For membrane equilibration of the inserts, add Endopan 20 medium to wells and inserts and incubate for 1 h at 37 °C and 5% CO2 (see General notes 5 and 6).
c. After membrane equilibration, perform baseline TEER measurements as follows:
i. Prepare 40 mL of ethanol (70%) and 40 mL of DPBS in separate 50 mL conical tubes.
ii. Calibrate the TEER electrodes in ethanol (70%) for 15 min under the sterile cell culture bench.
iii. Wash electrodes by dipping them 3–4 times into DPBS.
iv. Measure TEER by placing the longer electrode in the lower chamber and the shorter electrode in the upper chamber of the Transwell system. Ensure both electrodes are immersed in the medium.
Critical: While the longer electrode may touch the well bottom to improve stability and consistent positioning, strictly avoid contact of the shorter electrode with the insert bottom throughout the measurement to prevent mechanical damage to the cell monolayer. Perform three independent measurements per well and calculate the mean TEER value.
v. Use negative control wells without cells to normalize values; subtract values obtained from resistance values measured in these control wells with medium only from values obtained with HUVECs (see General note 8).
3. (Day 0) HUVEC seeding and endothelial barrier establishment
a. Trypsinize and count HUVECs (see General notes 2 and 3).
b. Aspirate medium from wells and inserts, add fresh Endopan 20 medium to wells, and seed 1.2 × 10⁵ HUVECs in 400 μL of Endopan 20 medium per insert. Cultivate under standard conditions at 37 °C and 5% CO2 (see General notes 4 and 5).
4. (Day 1 and day 7) TEER measurements
a. On days 1 and 7 post-HUVEC seeding, refresh medium in wells and inserts (see General notes 1, 4, and 5).
b. Perform TEER measurements as described in step C2 to monitor the establishment of functional and integrated endothelial barriers across all inserts (see General note 8).
c. Maintain cultivation under standard conditions at 37 °C and 5% CO2.
5. (Day 10) Tumor cell seeding and migration induction
a. On day 10 post-HUVEC seeding, perform medium refreshment followed by TEER measurements to confirm endothelial barrier formation. Calculate ΔTEER and expect results as shown in Figure 2A (see General notes 1, 4, 5, and 8).
b. Prepare one conical tube with 9 mL of combined medium (1.75% FBS), a 1:1 mixture of endothelial cell-specific medium and tumor cell-specific medium, to support optimal viability of both HUVECs and tumor cells under co-culture conditions. Also, prepare a conical tube with 20 mL of combined medium supplemented to a final concentration of 20% FBS to provide high-serum conditions.
c. Trypsinize and count three biological replicates of each fluorescence-labeled tumor cell line and prepare for seeding (see General notes 2 and 3).
d. Aspirate medium from wells and inserts and add the low-serum variant of combined medium (1.75% FBS) to all wells (see General notes 4 and 5).
e. Seed 8 × 10⁴ tumor cells in 400 μL of combined medium (1.75% FBS) per insert. Incubate the plates for 1 h at 37 °C in a humidified atmosphere with 5% CO2 to allow cell adhesion and settling onto the confluent HUVEC monolayer.
Critical: To prevent desiccation of the HUVEC monolayer, minimize air exposure during handling. Proceed sequentially with no more than three inserts at a time to maintain consistency and reduce variability.
f. To establish a chemotactic gradient promoting tumor cell migration, aspirate the medium from the lower chamber and replace it with combined medium supplemented to a final concentration of 20% FBS 1 h after tumor cell seeding (see General note 5).
Critical: During medium exchange, medium may flow through the porous membrane into the lower chamber, disrupting the cell layer or diluting the gradient. To mitigate this, perform the medium change rapidly. If necessary, immediately replenish the insert with 400 μL of low-serum combined medium (1.75% FBS) to maintain the directional migration stimulus.
6. (Days 14, 15, and 16) Cell fixation at specified endpoints
Note: Once the designated migration period is complete, fix cells on the inserts in preparation for fluorescence microscopy and quantification.
a. On day 14 post-HUVEC seeding (day 4 post-tumor cell seeding), carefully transfer the three corresponding inserts per cell line to a new 24-well plate. Maintain inserts with extended migration durations under standard culture conditions at 37 °C and 5% CO2 to allow continued migration until the designated endpoint.
b. To fix cells on insert membranes, proceed as follows:
i. Gently wash the corresponding three inserts per cell line three times with DPBS. Ensure thorough rinsing of both the well and insert to remove residual medium and non-adherent cells (see General notes 4 and 5).
Critical: Perform washes with minimal disturbance to the adherent cell layers.
ii. Transfer the plate with washed inserts to a chemical fume hood and proceed with fixation.
iii. Add 4.5% PFA in DPBS to wells and inserts and ensure complete coverage of membranes to avoid uneven fixation.
iv. Incubate for 15 min at room temperature.
v. Wash three times with DPBS to remove excess PFA (see General notes 4 and 5).
vi. For short-term storage until fixing cells of the corresponding three inserts on the next day, add 0.04% PFA in DPBS to wells and inserts and store the plate at 4 °C, wrapped in Parafilm to prevent evaporation.
Caution: PFA is a hazardous substance; handle it carefully and wear appropriate protective equipment.
c. Repeat the fixation procedure for three inserts per cell line on day 5 and day 6 after tumor cell seeding, respectively, as outlined in Table 2.
7. (Day 16) Removal of non-migrated cells and quantification of invasive cells
a. To remove non-migrated cells from the upper side of the insert membrane, wash the inserts under a chemical fume hood as follows:
i. Aspirate PFA solution from all wells and inserts and add 1 mL of DPBS to wells to ensure minimal disturbance of migrated cells on the lower surface of the insert membranes (see General note 4).
ii. Wash inserts three times with 400 μL of DPBS for 5 min each. After the final wash, leave inserts in DPBS until further processing.
Note: The DPBS in wells must remain throughout all wash steps to prevent drying and maintain a stable environment for the fixed cell monolayer.
b. Continue the washing procedure for one insert at a time:
i. Place three cotton buds per insert in a Pyrex beaker (100 mL) filled with 40 mL of DPBS.
ii. Take one insert out of the well plate and use a soaked cotton bud to gently wipe off non-migrated cells from the upper membrane surface with rolling movements of the fingers. Discard the cotton bud and aspirate the remaining DPBS.
iii. Add another 200 μL of DPBS to the insert and repeat the wiping process twice as described in the previous step.
Note: To assess residual fluorescent cells, return the insert to the 24-well plate and examine the remaining cells on the upper membrane surface under a fluorescence microscope. Use the outer rim of the insert as a reference—since it consists of a plastic frame devoid of membrane material, any fluorescence observed here originates from non-migrated cells on the upper surface.
c. If necessary, repeat the washing procedure with cotton buds until the membrane is free of non-migrated cells, as confirmed by microscopic inspection.
d. After the final wash, add 400 μL of DPBS and gently pipette up and down before discarding the solution to ensure complete removal of any remaining detached cells. Add fresh DPBS to prevent drying of the fixed cells and maintain sample integrity until imaging.
e. Proceed accordingly for all inserts in the plate, following the previously described protocol.
f. Retain inserts in the 24-well plate, ensuring they remain submerged in DPBS within the wells to prevent drying of fixed migrated cells.
g. To acquire microscopy images, add a drop of DPBS on a glass slide and position the insert onto the drop. Image the migrated cells at 4× magnification with an inverted fluorescence microscope (e.g., Olympus IX83) in the FITC channel (see General note 10).
h. Quantify migrated cells using Fiji to obtain results as shown in Figure 2B, C.
As an example, during the analysis of ER+ breast cancer cells, distinct migratory phenotypes were observed: parental MCF7-GFP cells exhibited a significantly slower transmigration rate compared to MCF7-TR-GFP cells, which displayed accelerated invasive capacity, as outlined in Figure 2. Although the migratory behaviors of the two cell lines differed substantially, a migration duration of 5 days was selected as a suitable standardized condition for both parental and resistant cells. This duration enables meaningful comparison while ensuring sufficient time for detectable transmigration in both cell lines.
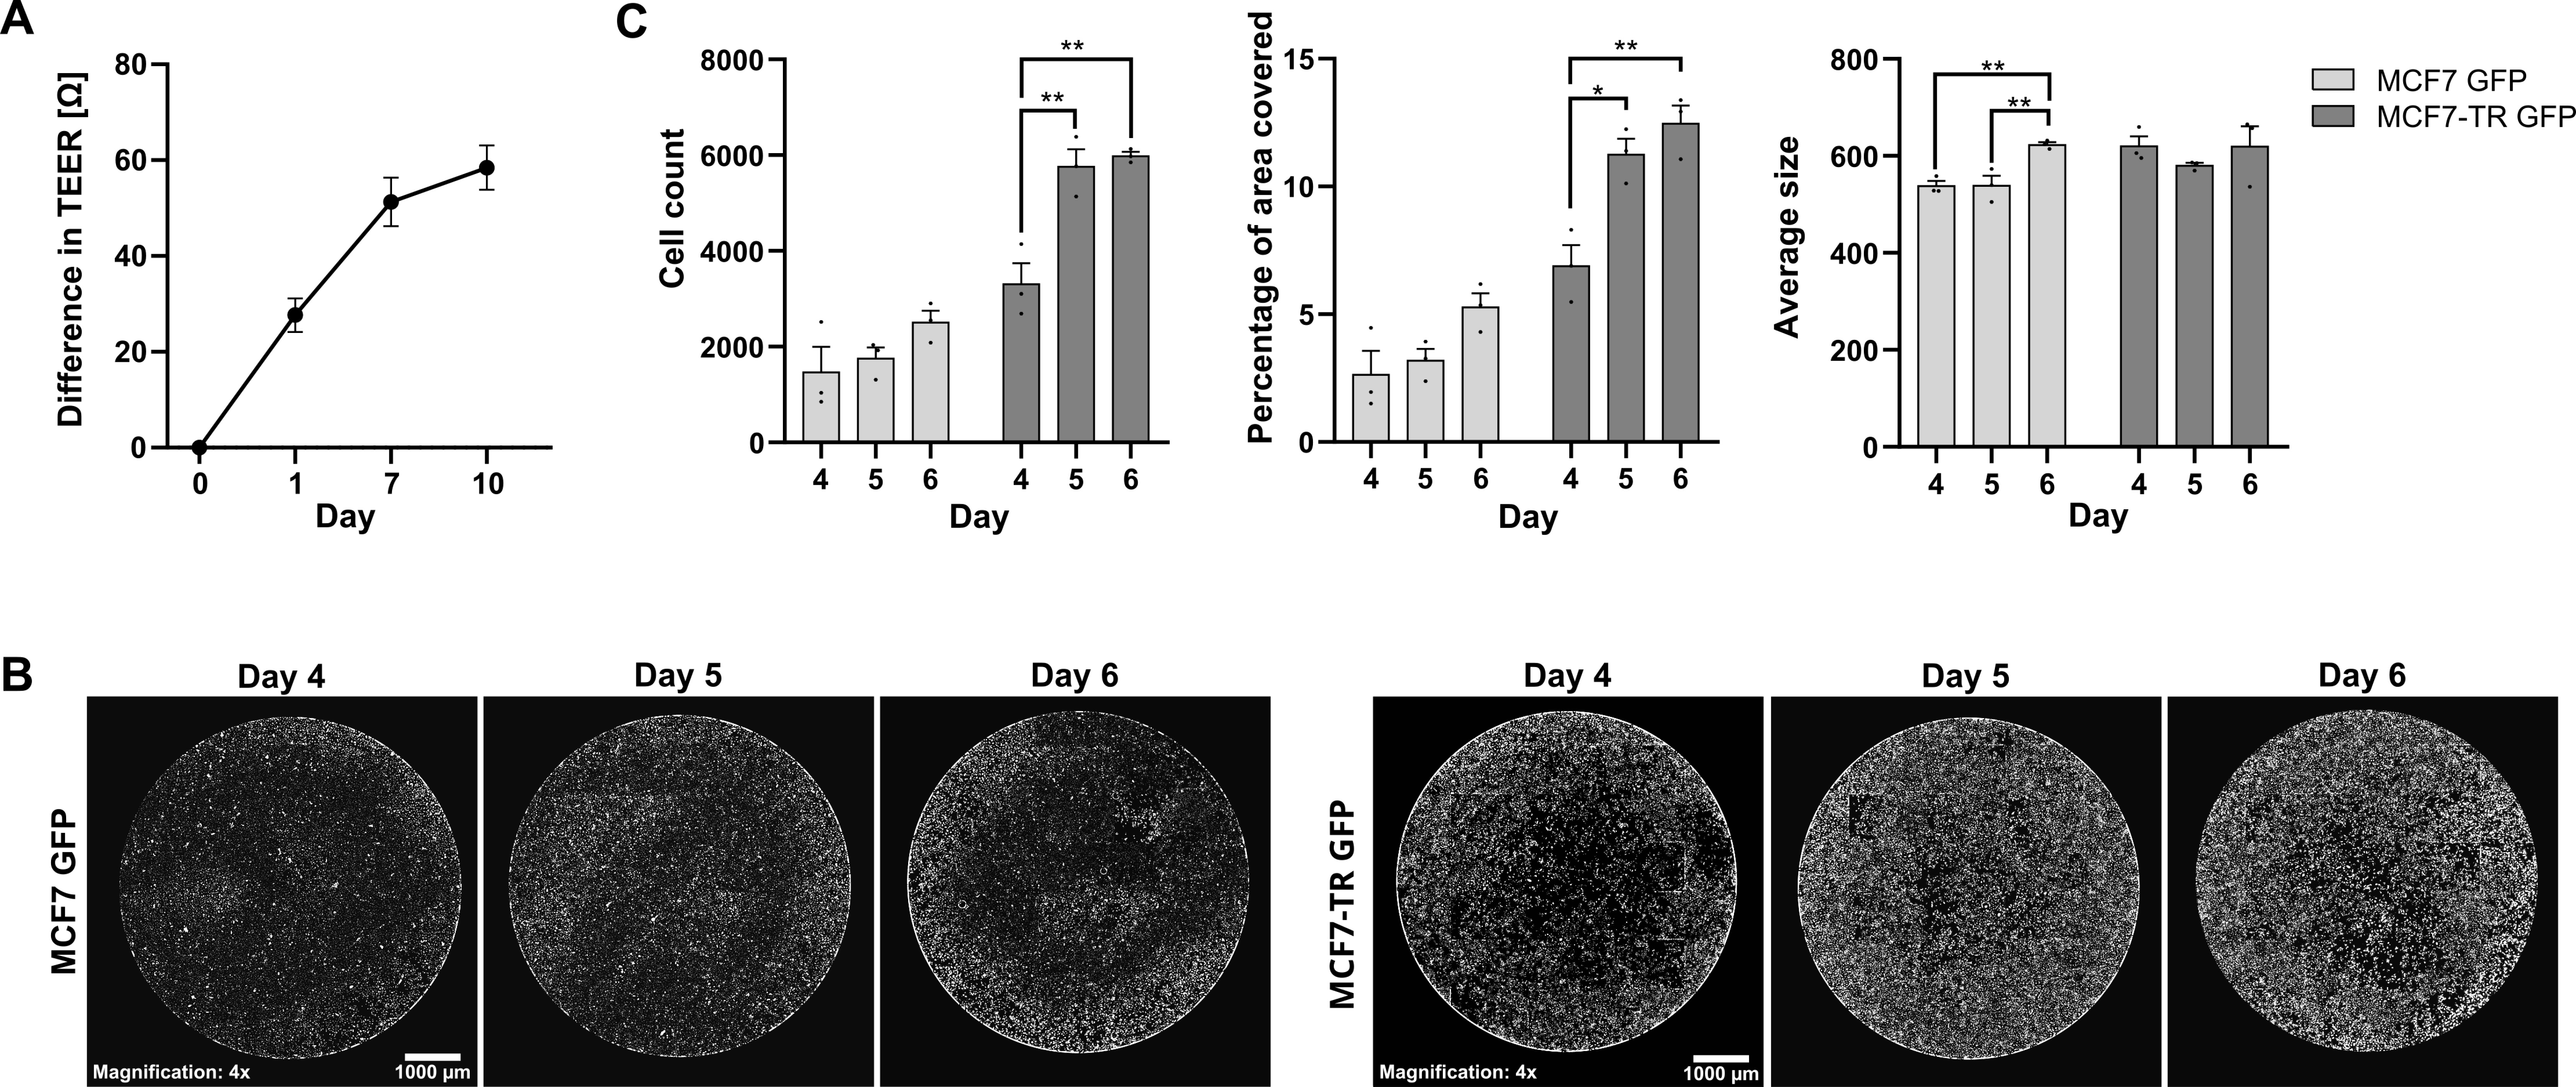
Figure 2. Migration duration for MCF7 GFP and MCF7-TR GFP cells. (A) Difference in TEER measurement values of HUVECs cultured in Endopan 20 medium, normalized to empty control wells and relative to baseline measurement values on day 0 (mean ± SD). (B) Fiji-generated thresholds of representative fluorescence microscopy images of migrated MCF7 GFP cells (left panel) and MCF7-TR GFP cells (right panel) on inserts fixed after 4, 5, and 6 days of migration across the endothelial barrier. Microscopy images were acquired using an Olympus IX83 equipped with a Hamamatsu CMOS camera in the FITC channel, with excitation at 490 nm (14% LED intensity), an exposure time of 440 ms, a gain setting of 1 dB, and a magnification of 4×. Scale bars: 1,000 μm. (C) Number of migrated tumor cells (left panel), area of inserts covered by migrated tumor cells (middle panel), and average cell size of migrated tumor cells (right panel) after different migration periods, quantified via thresholds of microscopy images shown in B. One-way ANOVA; *p < 0.05, **p ≤ 0.01 (mean ± standard error of the mean). The experiment was performed in biological triplicates per condition for both tumor cell lines.
D. Transendothelial migration assay
By systematically optimizing endothelial barrier integrity (outlined in Sections E–J), insert pore size (Section B), and tumor cell migration duration (Section C), a robust and physiologically relevant transendothelial migration assay was established to quantitatively compare the invasive capacities of tumor cells across an endothelial barrier. For efficient barrier formation, HUVECs are seeded at a density of 50–100 cells/cm2, optimized to achieve maximal confluence while preventing overgrowth [10,11]. Ensuring consistent experimental setup conditions for parental and corresponding resistant cells allows for reliable comparisons and minimizes variability due to technical or environmental factors. Downstream, migration efficiency is assessed via FACS to enable precise isolation and quantification of transmigrated cell subpopulations.
1. Cell culture and preparation
a. Cultivate the following cells in T75 flasks under standard conditions at 37 °C and 5% CO2:
i. Pooled HUVECs in Endopan 3 medium (see General note 7).
ii. Three biological replicates of fluorescently labeled tumor cells—parental and resistant cell lines.
iii. One replicate of non-GFP-expressing variants of each tumor cell line for proper GFP gating during flow cytometric analysis.
b. Based on prior pore size optimization experiments, determine the minimum number of inserts required per biological replicate and calculate the corresponding number of T75 flasks needed to ensure adequate availability of viable cells.
Note: One confluent T75 flask of HUVECs yields approximately 3 × 10⁶ cells, sufficient for seeding six wells at 5 × 10⁵ cells per insert. Similarly, one confluent T75 flask of MCF7 GFP or MCF7-TR GFP cells provides approximately 8 × 10⁶ cells, enabling seeding of six inserts with 1.2 × 10⁶ cells each. These specifications may vary depending on the tumor cell line.
c. Maintain comparable confluence across all cell culture flasks and begin the experiment when HUVECs are ~80% confluent.
Note: If freshly thawed from cryovials, thaw HUVECs 7–10 days before seeding (see Table 3) due to their earlier requirement in the experimental timeline and potentially slower proliferation rate compared to many tumor cell lines.
Table 3. Exemplary experimental timeline for the transendothelial migration assay with a migration duration of five days
| Day | Task 1 | Task 2 | Task 3 | Task 4 |
| 0 | Coating and first TEER measurement | HUVEC seeding | - | - |
| 4 | Medium refreshment | - | - | - |
| 7 | Medium refreshment | Second TEER measurement | - | - |
| 10 | Medium refreshment | Third TEER measurement | Tumor cell seeding | Media switch to higher FBS concentration 1 h after seeding |
| 13 | Medium refreshment | - | - | - |
| 15 | Harvesting | FACS | - | - |
2. (Day 0) Membrane coating and HUVEC seeding
a. Prepare 6-well plates with the calculated number of inserts of the corresponding pore size, based on prior pore size optimization results (see Section B).
Note: Prepare additional inserts beyond the minimum requirement to allow selection of those with the most stable endothelial barriers (assessed via TEER measurements). This quality control step excludes inserts with suboptimal barrier function, enhancing experimental reliability and consistency.
b. To apply the coating layer onto the insert membranes, prepare a sufficient volume of gelatin solution (0.5%) in a conical tube or, depending on the number of inserts, in an autoclaved Pyrex beaker to have 1.5 mL of the solution per insert. Pipette it onto the insert membrane.
Critical: Prepare additional volumes beyond the required amount to account for the viscous consistency of the solution and residual volumes retained in pipette tips during transfer.
c. Incubate coated inserts for 30 min at 37 °C and 5% CO2.
d. Carefully aspirate the excess coating solution using a Pasteur pipette and wash twice with DPBS to remove unbound coating material and ensure a uniform membrane surface (see General notes 4 and 5).
e. To equilibrate insert membranes, add fresh Endopan 20 medium to wells and inserts and incubate for 1 h at 37 °C and 5% CO2 (see General notes 5 and 6).
f. After successful membrane equilibration, perform baseline TEER measurements as described in step C2 (see General note 8).
g. Trypsinize and count HUVECs (see General notes 2 and 3).
h. Aspirate medium from wells and inserts, replace medium in wells with fresh Endopan 20 medium, and seed 5 × 10⁵ HUVECs in 2 mL of Endopan 20 medium per insert.
i. Cultivate cells under humidified conditions at 37 °C and 5% CO2 to initiate endothelial barrier formation.
3. (Day 4) Medium refreshment: On day 4 post-HUVEC seeding, refresh medium in all wells and inserts to supply essential nutrients and support optimal endothelial barrier formation (see General notes 1, 4, and 5).
4. (Day 7) Second TEER measurements
a. On day 7 post-HUVEC seeding, refresh medium in wells and inserts and perform the second TEER measurements as described in step C2 (see General notes 4, 5, and 8).
Note: Measurements on days 7 and 10 allow identification of inserts with suboptimal endothelial barrier formation, enabling the selection of those exhibiting the highest barrier integrity for subsequent experimental steps.
b. Maintain cells under standard conditions at 37 °C and 5% CO2.
5. (Day 10) Third TEER measurements: On day 10 post-HUVEC seeding, repeat medium refreshments and TEER measurements as previously described. Normalize TEER values to those of the cell-free insert, calculate the difference in TEER (ΔTEER) between day 0 and day 10, and only proceed with inserts exhibiting ΔTEER ≥ 45 Ω (see General notes 1, 4, 5, and 8).
6. (Day 10) Tumor cell seeding
a. Depending on the number of wells, prepare conical tubes containing combined medium (a 1:1 mixture of endothelial cell-specific medium and tumor cell-specific medium) to optimize cultivation conditions for both cell lines simultaneously. Provide at least 7 mL per insert of the low-serum variant of combined medium (1.75% FBS) and at least 6 mL per well of the high-serum variant of combined medium (20% FBS) to ensure sufficient volumes for the entire experiment (see General note 5).
Note: Prepare additional volumes beyond the minimum requirements to account for potential losses during handling.
b. Trypsinize and count all three biological replicates per tumor cell line and prepare for seeding (see General notes 2 and 3).
c. For initial tumor cell seeding, use only low-serum combined medium (1.75% FBS): Aspirate medium in wells and inserts and add low-serum combined medium (1.75% FBS) to wells (see General note 5).
d. Seed 1.2 × 10⁶ tumor cells in 2 mL of combined medium (1.75% FBS) per insert, gently swirling the plate in two directions to distribute the cells evenly.
Critical: Avoid circular movements of the plate to prevent uneven cell distribution along the periphery of the insert and to ensure a uniform cell layer across the membrane surface.
e. Incubate for 1 h at 37 °C and 5% CO2 to allow tumor cells to sediment passively and establish uniform contact with the HUVEC monolayer prior to migration induction.
7. (Day 10) Migration induction
a. To establish a chemotactic gradient, replace medium in wells with high-serum combined medium (20% FBS) (see General note 5).
b. Incubate the plate under standard conditions at 37 °C and 5% CO2 to allow migration of tumor cells across the endothelial barrier.
8. (Day 13) Migration stimulus refreshment and preparation for cell harvesting
a. To re-establish the chemotactic gradient, refresh medium in wells and inserts using combined medium with corresponding FBS concentrations (see General notes 1, 4, and 5).
b. Maintain cells in the incubator under standard conditions at 37 °C and 5% CO2.
c. In preparation for cell harvesting on day 15, provide and label the following tubes for each cell line:
i. Two FACS tubes per biological replicate (1 × “UP” and 1 × “LOW”).
ii. Nine 1.5 mL Eppendorf tubes per biological replicate: 3 × for non-migrated tumor cells “UP” (e.g., MCF7.1 UP: 1.1, 1.2, and 1.3), 3 × for migrated tumor cells “LOW” (e.g., MCF7.1 LOW: 1.1, 1.2, and 1.3), and 3 × for HUVECs contained in the suspension of “UP” (e.g., HUV MCF7.1: 1.1, 1.2, and 1.3), in case the interaction between tumor cells and endothelial cells is relevant for the project.
d. Prepare sufficient FACS buffer for harvesting and FACS analysis.
9. (Day 15) Preparations for cell harvesting and FACS analysis
a. To prepare for downstream applications, thaw DNAse I on ice.
b. Prepare non-GFP-expressing tumor cells in a FACS tube as control cells needed for setting GFP gating, as described in step B4 (see General notes 1 and 2).
c. Prepare 15 mL conical tubes with 2 mL of MEM medium each and pre-label them as “UP” for the collection of non-migrated cells in the upper chamber and “LOW” for migrated cells in the lower chamber.
Note: To improve experimental handling, consider pooling cells from two wells of the same biological replicate into a single conical tube. In such cases, prepare one “UP” tube and one “LOW” tube per pair of wells, each containing 4 mL of complete tumor cell culture medium to ensure adequate FBS concentration for effective trypsin inactivation. This can be particularly useful when working with large numbers of wells, as it reduces the number of tubes required, minimizes handling steps, and improves workflow efficiency.
10. (Day 15) Separate harvesting of migrated and non-migrated cells
Note: Take one 6-well plate at a time to harvest migrated and non-migrated cells using a procedure similar to that described in step B5. Depending on the number of wells, consider coordinating the workflow with multiple operators to enable timely harvesting of all cells of the same biological replicate. This approach minimizes the time cells spend in suspension without attachment to a culture surface and thereby preserves viability.
a. Collect medium from wells into the corresponding “LOW” conical tubes. Aspirate and discard medium from inserts (see General note 4).
Critical: Collect the medium from lower chambers instead of discarding, as some migrated cells may otherwise be missed.
b. Add DPBS to wells and inserts and incubate for 10 min at room temperature (see General notes 4 and 5).
c. Detach cells by adding 2 mL of trypsin to each well and 1 mL of trypsin to each insert. Incubate for 10 min at 37 °C and 5% CO2 (see General note 4).
Note: To assess detachment efficiency, examine the 6-well plates under an inverted fluorescence microscope at the end of the incubation period.
d. After ensuring sufficient detachment of cells, harvest migrated cells from the lower surface of the insert membrane. Lift the insert at a 45° angle and use a 1,000 μL pipette to wash the insert bottom 6–8 times with the trypsin contained in the well to wash off all migrated cells. Transfer the trypsin–cell suspension into the prepared tube “LOW.”
e. Repeat the washing procedure with 2 mL of DPBS and add the DPBS–cell suspension into the prepared tube “LOW.”
f. To harvest non-migrated cells on the upper surface of the insert membrane, gently dislodge the cells by washing 6–8 times with the trypsin solution remaining in the insert using a 1,000 μL Eppendorf pipette. Transfer the resulting trypsin–cell solution into the pre-labeled “UP” tube.
Note: Due to trypsinization-induced degradation of the endothelial monolayer, trypsin may leak into the lower chamber. In such cases, use the remaining solution to rinse the insert and proceed promptly to the next step to ensure efficient cell collection.
g. Repeat the washing procedure in the upper chamber with 1 mL of tumor cell cultivation medium and add the resulting suspension to the “UP” tube.
11. (Day 15) FACS preparation and cell sorting
a. Centrifuge all “UP” and “LOW” tubes at 300× g for 7 min at room temperature. Then, aspirate the supernatant and resuspend cell pellets in 500 µL of FACS buffer each.
b. Pool all “LOW” cell suspensions from one replicate into a single conical tube and similarly combine all “UP” cell suspensions from the same replicate into a tube to enable simultaneous FACS analysis of all cells from the same biological replicate.
Note: At this stage, ensure you have six conical tubes per cell line accordingly or nine tubes if HUVECs are to be maintained for subsequent analyses.
c. Add 10 µL of DNAse I (20 U/mL) to each pooled tube and incubate for 10 min at 37 °C.
Note: DNAse treatment helps degrade extracellular DNA released during potential cell lysis, thereby reducing cell clumping and improving the quality of the single-cell suspension for downstream FACS procedures.
Critical: Upon completion of the incubation period, visually inspect the cell suspensions for signs of viscous or cloudy debris, which may indicate the presence of extracellular DNA. If such material is observed, extend the DNAse incubation time accordingly. If no visible debris remains, proceed.
d. Prepare two conical tubes per replicate with PluriStrainer filters.
e. Individually transfer the resulting cell suspensions “UP” and “LOW” through filters into the prepared conical tubes and rinse filters with 2 mL of DPBS to prevent loss of cells.
Note: Filtering harvested cell suspensions ensures the formation of a single-cell suspension and helps prevent clogging of the FACS instrument.
f. Centrifuge cell suspensions at 300× g for 7 min.
g. Aspirate supernatants, resuspend pellets in 500 μL of FACS buffer each, and transfer cell suspensions to the corresponding pre-labeled FACS tubes.
h. Use a FACS sorting facility to sort tumor cells into pre-labeled Eppendorf tubes. Depending on the downstream application of sorted cells, either cultivate samples or centrifuge at 400× g for 6 min, aspirate supernatants, and snap-freeze.
Critical: It is recommended to select “UP” cells as the first sample for sorting and acquire 20,000 cells to validate gating parameters without loss of migrated “LOW” cells. Keep identical gate settings throughout the entire experiment.
Note: For optional isolation of HUVECs during the FACS procedure, perform immunofluorescence staining of the “UP” cells with APC anti-human CD31 antibody after harvesting as follows:
1. Count cells and prepare 1 × 10⁶ cells in 100 μL of FACS buffer.
2. Add 5 μL of anti-human CD31 antibody and incubate in the dark for 20 min.
3. Add 1 mL of DPBS and centrifuge at 400× g for 6 min at room temperature.
4. Aspirate the supernatant and resuspend cells in 500 μL of FACS buffer.
5. Provide unstained HUVECs in FACS buffer for the setup of gating parameters and prepare Eppendorf tubes with Endopan medium for the recovery of sorted cells.
i. Repeat the harvesting process as previously described for each biological replicate. Process harvested cells promptly to prevent viability loss associated with extended waiting times.
Note: The assay is deemed successful if: 1) the number of migrated cells is significantly reduced compared to a Transwell assay lacking an endothelial barrier, confirming functional barrier integrity; 2) fewer cells are detected in the lower chamber than remain in the upper chamber, indicating effective barrier-mediated selection pressure; and 3) depending on the downstream application, enough cells have migrated across the barrier to enable valid downstream analysis. For example, at least 3,000 cells per insert are considered acceptable for mRNA sequencing.
A sufficient number of sorted “UP” cells validates effective trypsinization of both “UP” and “LOW” populations during harvesting. Expect cell viability above 75% (see General note 9).
Example application: The transendothelial migration assay was exemplarily performed with MCF7 GFP cells in 18 inserts and with MCF7-TR cells in 12 inserts, yielding at least 4,000 cells per insert for MCF7 and at least 30,000 cells per insert for MCF7-TR. After obtaining tumor cells via FACS, RNA was isolated using the NEB Monarch Spin RNA Isolation kit, following the manufacturer’s instructions. RNA concentrations were assessed via the Qubit RNA Broad Range (BR) Assay kit, and 50–100 ng of RNA was used for library preparation prior to mRNA sequencing at Novogene. Raw data were processed, and quality checks, alignment, and expression analysis were performed following the pipeline established in our laboratory [12].
The results reveal substantial differences in gene expression between migrated and non-migratory subpopulations within each cell line, as well as between the two cell lines, thereby identifying key genetic determinants of migratory capacity. Notably, the distinction between migratory and non-migratory phenotypes is more pronounced in MCF7 cells than in MCF7-TR cells, as illustrated in Figure 3. These differences are consistently observed across all three biological replicates of both cell lines—underscoring the assay’s reproducibility, reliability, specificity, and capacity to accurately discriminate between invasive and non-invasive cell populations, thereby validating the established experimental protocols.
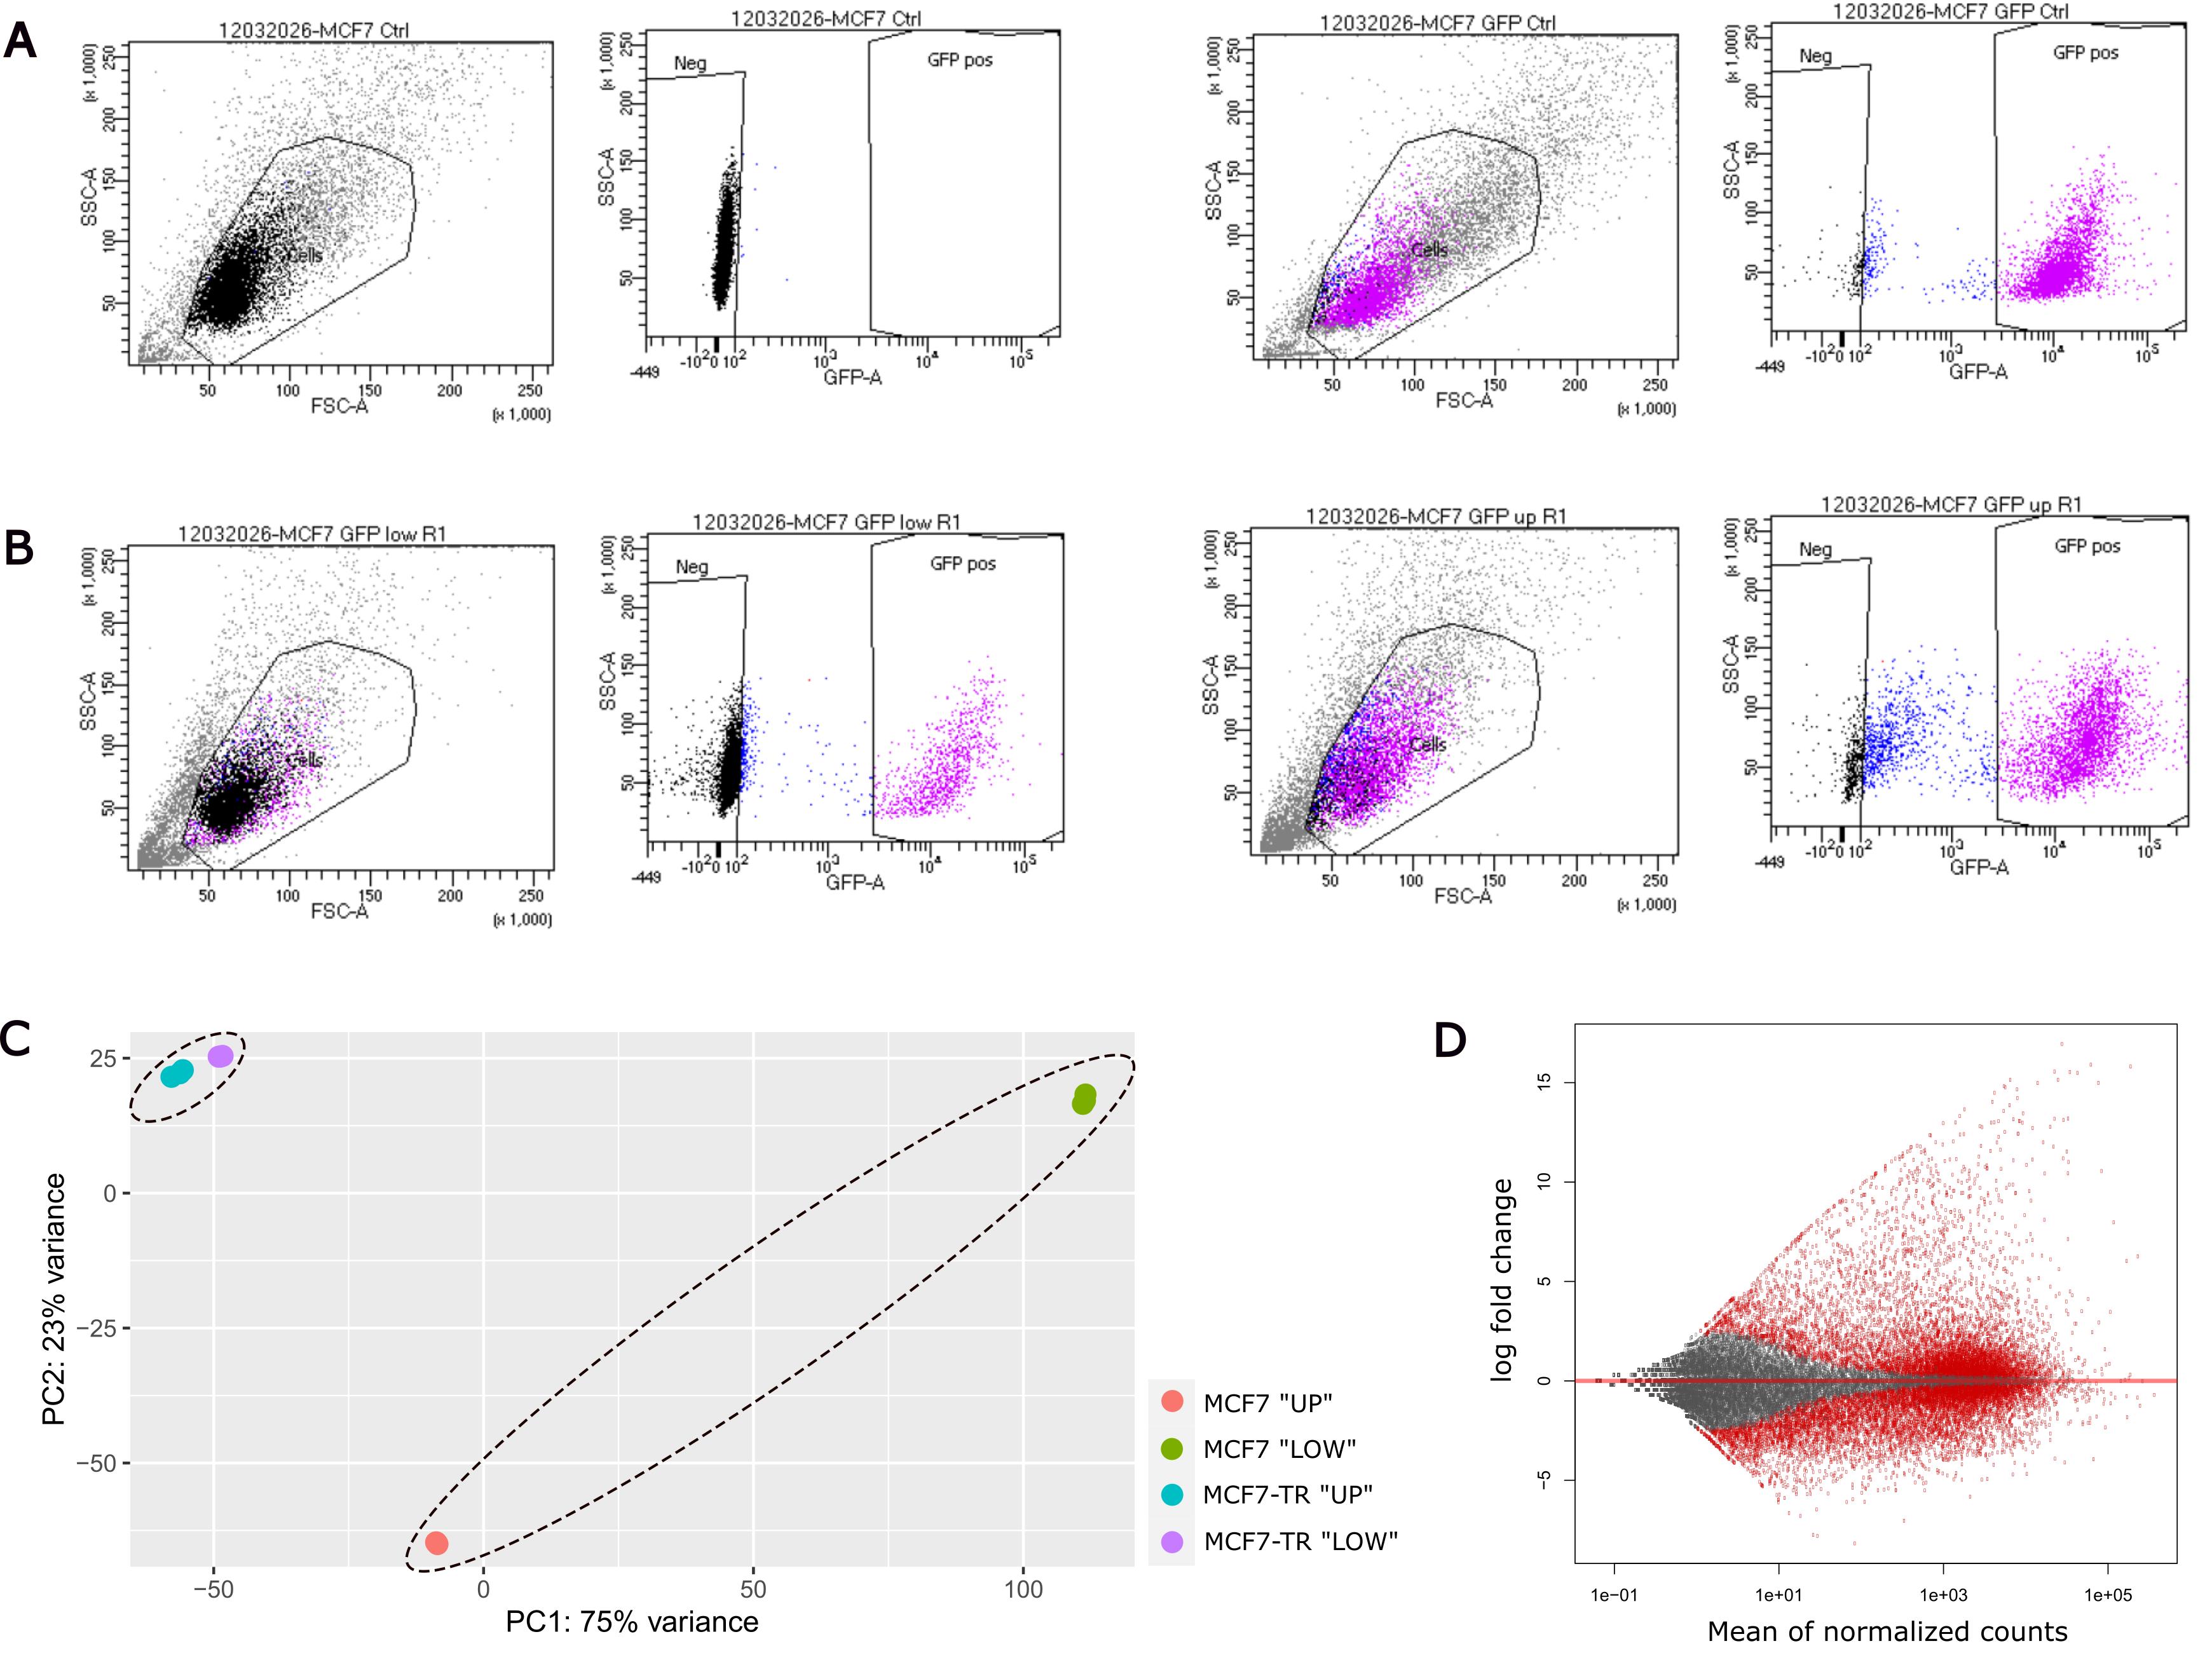
Figure 3. RNA sequencing after performing the transendothelial migration assay with MCF7 and MCF7-TR cells. (A) Exemplary sorting strategy of non-GFP-expressing MCF7 (left panel) and fluorescence-labeled MCF7 cells (right panel) for gating setup at the FACS facility. (B) Exemplary plots of invasive MCF7 GFP cells “LOW” (left panel) and non-invasive MCF7 GFP cells “UP” (right panel) of the same biological replicate. (C) PCA plot showing distinct clustering of invasive and non-invasive populations across both tumor cell lines. (D) MA plot of “LOW” MCF7 populations in contrast to “UP” MCF7 cells as a quantitative comparison of up- and downregulated genes. The experiments were performed in biological triplicates per condition for both tumor cell lines.
Validation of protocol
Validating information
Experiments were generally performed in biological triplicates of tumor cells, as indicated in the figure legends. For statistical analysis, standard error of the mean (SEM) was used to quantify variability, and one-way ANOVA was employed to assess significant differences between group means, unless otherwise specified in the figure legend.
Validating experiments
In addition to the successful selection of tumor cell subpopulations based on their invasive behavior (as shown in Section D), culture conditions for HUVECs were systematically evaluated and optimized as part of the validation process. Prior to determining tumor cell migration conditions (Sections B and C) and executing the migration assay (Section D), dedicated experiments ensured the formation of a robust, high-quality, and physiologically relevant endothelial barrier. Given that the barrier acts as the primary selective filter, its integrity is critical for discriminating between highly metastatic and less invasive cell subpopulations in downstream assays.
To identify optimal conditions for endothelial cells, key parameters were assessed, including the type of culture medium and supplemented FBS concentration, the timing of tumor cell seeding relative to endothelial monolayer maturation, the influence of co-cultivation with attractant cells, and the impact of different coating layers on the insert membrane.
E. Establishment of the endothelial barrier: Endothelial cell-specific culture media
To establish stable endothelial barrier formation, cultivation conditions for endothelial cells were optimized. The culture of HUVECs in ECGM followed by a switch to a 1:1 mixture with M199 medium is a well-established and widely used protocol [13]. To assess potential improvements in endothelial barrier integrity, this medium formulation was compared to Endopan 3 medium, an endothelial cell-specific culture medium supplemented to a final concentration of 20% FBS—matching the serum content of the ECGM/M199 mixture. The comparison was conducted over 10 days and quantified by TEER measurements to assess barrier integrity.
1. Cell culture and preparation: Culture HUVECs in Endopan 3 medium under humidified conditions at 37 °C and 5% CO2 until at least two T75 flasks reach ~80% confluence (see General note 7).
2. (Day 0) Experimental setup and membrane equilibration
a. Prepare 7 mL of each medium—Endopan 20 medium and ECGM2 medium—in separate 15 mL conical tubes.
b. Prepare a 24-well plate with eight inserts of 8 μm pore size. Use three inserts per condition and one additional insert without cells as a negative control for normalization of TEER measurements for each condition (see Table 4).
Note: The pore diameter of inserts is not critical for this experiment, provided that the same diameter is used consistently across all inserts.
Table 4. Seeding scheme for comparison of endothelial cell-specific cultivation media in a 24-well plate.
| Condition | Insert 1 | Insert 2 | Insert 3 | Control (w/o cells) |
| Endopan 20 medium | 300,000 HUVECs | 300,000 HUVECs | 300,000 HUVECs | Endopan 20 medium |
| Mixed medium | 300,000 HUVECs (ECGM2) | 300,000 HUVECs (ECGM2) | 300,000 HUVECs (ECGM2) | ECGM2 medium |
c. For equilibration of insert membranes, add appropriate volumes of the respective medium to wells and inserts and incubate for 1 h at 37 °C and 5% CO2 (see General notes 5 and 6).
3. (Day 0) Baseline TEER measurements and cell seeding
a. Perform baseline TEER measurements as described in step C2.
b. Trypsinize and count HUVECs and prepare for seeding (see General notes 2, 3 and 7).
c. Add fresh medium to all four wells per condition (see General notes 1 and 5).
d. Seed 3 × 10⁵ cells per insert in 400 μL of the corresponding medium. Use three inserts per condition as outlined in Table 4.
e. Add 400 μL of culture medium to the remaining insert designated as a negative control for each experimental condition (see Table 4).
Note: These cell-free inserts allow background correction and normalization of TEER measurements during the assessment of endothelial barrier integrity.
f. Incubate at 37 °C and 5% CO2 for the following three days to allow cell attachment, spreading, and initial growth (see Table 5).
Table 5. Experimental setup to compare endothelial cell-specific media for HUVEC cultivation
| Day | Condition 1 (Endopan medium) | Condition 2 (mixed medium) |
| 0 | Seed HUVECs in Endopan 20 medium in three inserts. Prepare one insert as negative control. | Seed HUVECs in ECGM2 medium in three inserts. Prepare one insert as negative control. |
| 3 | Medium exchange with Endopan 20 medium | Transition of cultivation medium: Medium exchange with 1:1 mixture of ECGM2 medium and M199 medium |
| 7 | Medium exchange with Endopan 20 medium, TEER measurements | Medium exchange with 1:1 mixed medium, TEER measurements |
| 10 | Medium exchange with Endopan 20 medium, TEER measurements | Medium exchange with 1:1 mixed medium, TEER measurements |
4. (Day 3) Medium exchange including transition of medium
a. On day 3 post-seeding, perform medium exchanges in all wells and inserts. Use Endopan 20 medium for Condition 1. For Condition 2, prepare 7 mL of a 1:1 mixture of ECGM2 medium and M199 medium (see Table 5) (see General notes 4 and 5).
b. Incubate the 24-well plate under standard conditions at 37 °C and 5% CO2.
5. (Day 7 and day 10) Medium exchange and TEER measurements
a. On day 7 post-seeding, refresh media in all wells and inserts as outlined in Table 5 (see General notes 4 and 5).
b. After medium exchange, measure TEER as described in step C2 and calculate ΔTEER (see General note 8).
c. Repeat medium refreshment and TEER measurements on day 10 post-seeding to monitor the progression and integrity of endothelial barrier formation (see Table 5). Expected results for ΔTEER are shown in Figure 4.
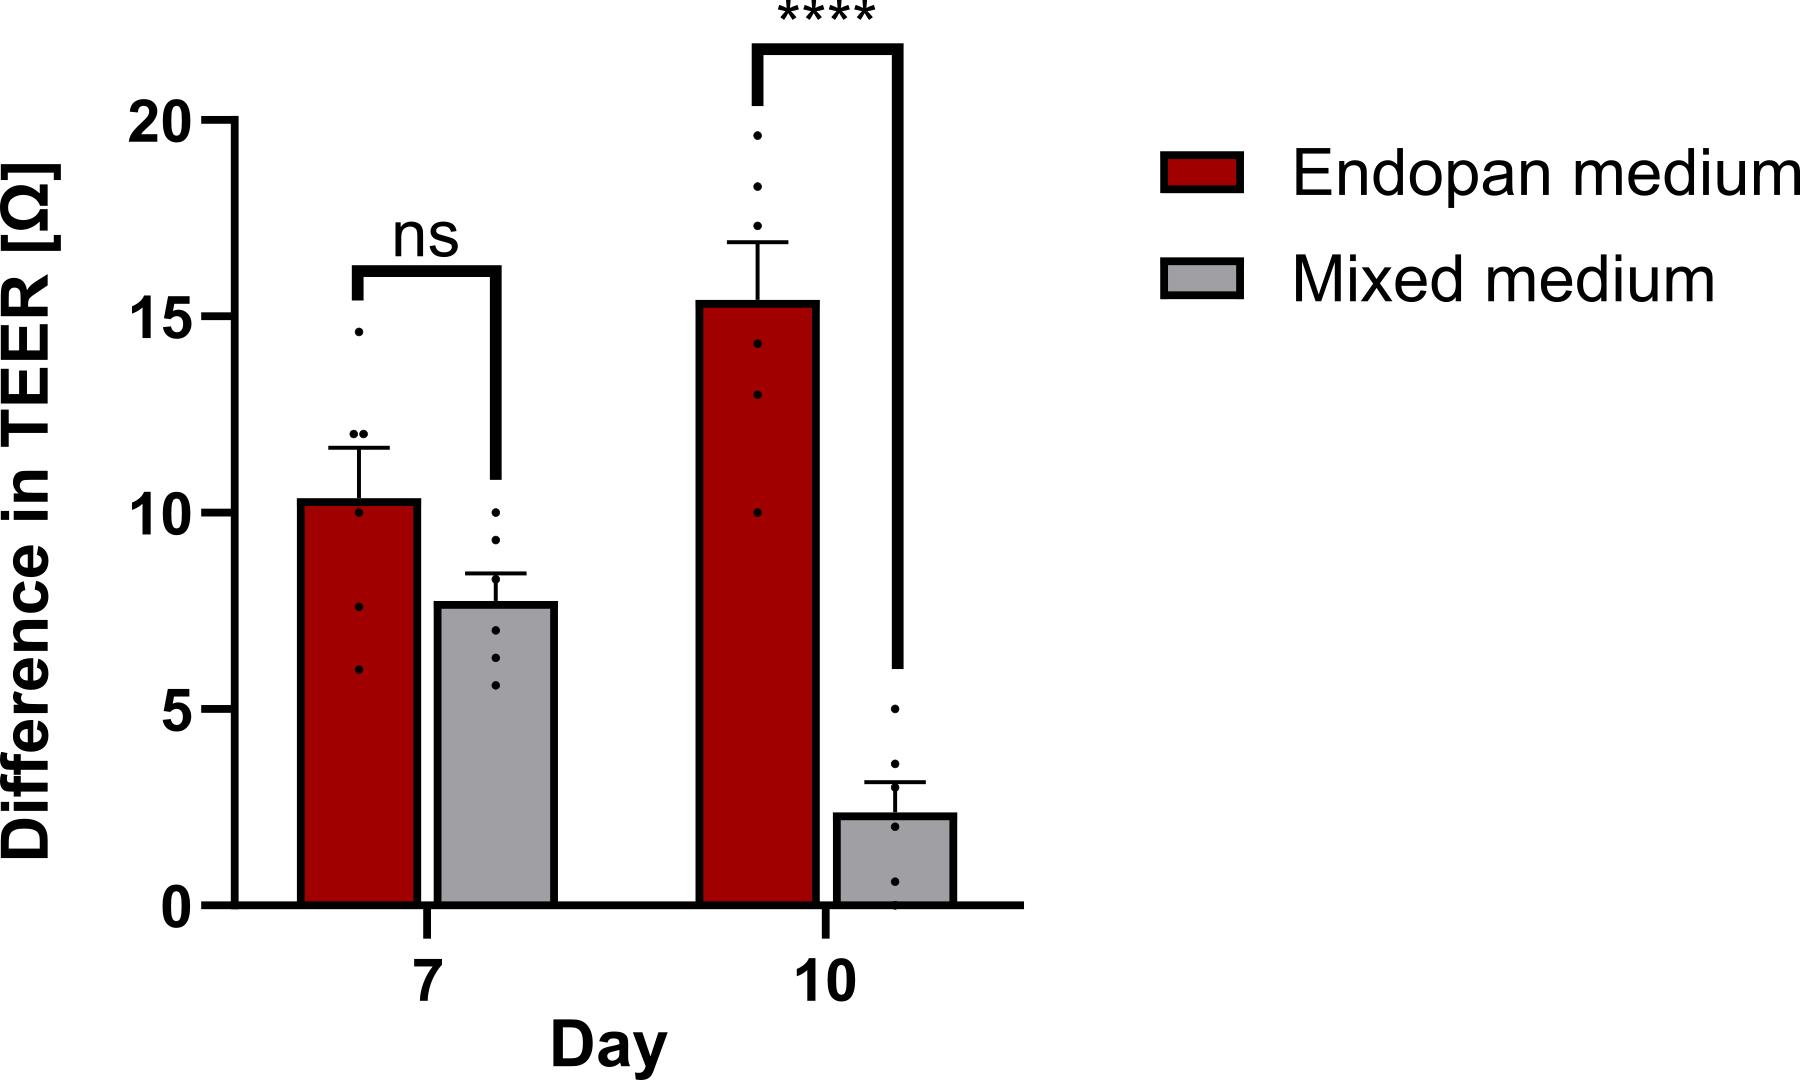
Figure 4. Comparison of human umbilical vein endothelial cell (HUVEC) cultivation media. Difference in transendothelial electrical resistance (TEER) measurements on days 7 and 10 post-seeding HUVECs in different cultivation media, normalized to one control insert without cells and relative to baseline measurements on day 0. Unpaired t-test; ns, non-significant; ****p ≤ 0.0001. Error bars are the standard error of the mean (SEM). The experiment was performed in six technical replicates per condition.
F. Establishment of the endothelial barrier: FBS concentration
To build a stable endothelial barrier, HUVECs must forfeit progenitor cell characteristics and differentiate into mature endothelial cells. As the differentiation behavior of HUVECs is strongly influenced by supplements added to the cultivation medium [14], assessing the influence of varying FBS concentrations is critical for the Transwell migration assay. To determine the most suitable FBS concentration in the cultivation medium, HUVECs were cultured on uncoated inserts in Endopan medium supplemented to final FBS concentrations of 3%, 10%, 15%, or 20%. Barrier integrity was assessed by TEER measurements and immunofluorescence staining using DAPI and Phalloidin.
The results demonstrate that Endopan 20 medium, containing 20% FBS, is the most effective for HUVEC monolayer formation and barrier integrity. It is therefore recommended to use Endopan 3 medium supplemented to a total concentration of 20% FBS for the reliable establishment of a functional endothelial layer in Transwell-based co-culture systems.
1. HUVEC cultivation and media preparation
a. Cultivate pooled HUVECs in Endopan 3 medium in one T75 flask until reaching ~80% confluence (see General note 7).
b. Prepare Endopan 3 medium without any additional FBS, as the standard formulation already contains 3% FBS. Supplement separate aliquots with additional FBS to achieve final concentrations of 10%, 15%, and 20%, respectively. Critical: Use the same batch of FBS for all conditions to minimize variability.
2. (Day 0) Insert preparation, membrane equilibration, and TEER measurement
a. Prepare a 24-well plate with 13 inserts of 8 μm pore size to include three wells per condition and one additional well per condition without cells as a negative control for TEER measurements (see Table 6).
Table 6. Seeding scheme for comparison of FBS concentrations in HUVEC cultivation medium in a 24-well plate
| Medium | Insert 1 | Insert 2 | Insert 3 | Control |
| Endopan 3 (3% FBS) | 120,000 HUVECs | 120,000 HUVECs | 120,000 HUVECs | w/o cells |
| Endopan 10 (10% FBS) | 120,000 HUVECs | 120,000 HUVECs | 120,000 HUVECs | w/o cells |
| Endopan 15 (15% FBS) | 120,000 HUVECs | 120,000 HUVECs | 120,000 HUVECs | w/o cells |
| Endopan 20 (20% FBS) | 120,000 HUVECs | 120,000 HUVECs | 120,000 HUVECs | w/o cells |
b. Add appropriate amounts of the corresponding culture medium to wells and inserts. Incubate for 1 h at 37 °C and 5% CO2 to equilibrate insert membranes (see General notes 5 and 6).
c. After membrane equilibration, perform baseline TEER measurements as described in step C2 (see General note 8).
3. HUVEC seeding and assessment of endothelial barrier stability
a. After TEER measurements, trypsinize and count HUVECs and prepare for seeding (see General notes 2 and 3).
b. Aspirate media from wells and inserts, add fresh medium to wells, and seed 1.2 × 10⁵ cells in 400 μL of the corresponding medium per insert (see General notes 4 and 5).
c. Cultivate under humidified conditions at 37 °C and 5% CO2.
4. (Days 4, 7, and 16) TEER measurements
a. On day 4 post-seeding, exchange media and perform TEER measurements as described in step C2 (see General notes 4, 6, and 8).
b. Repeat medium refreshments with corresponding media and TEER measurements on days 7 and 16 post-seeding to monitor the impact of supplemented FBS on endothelial barrier stability. Calculate ΔTEER for each day of measurements and expect results like those shown in Figure 5 (see General notes 8).
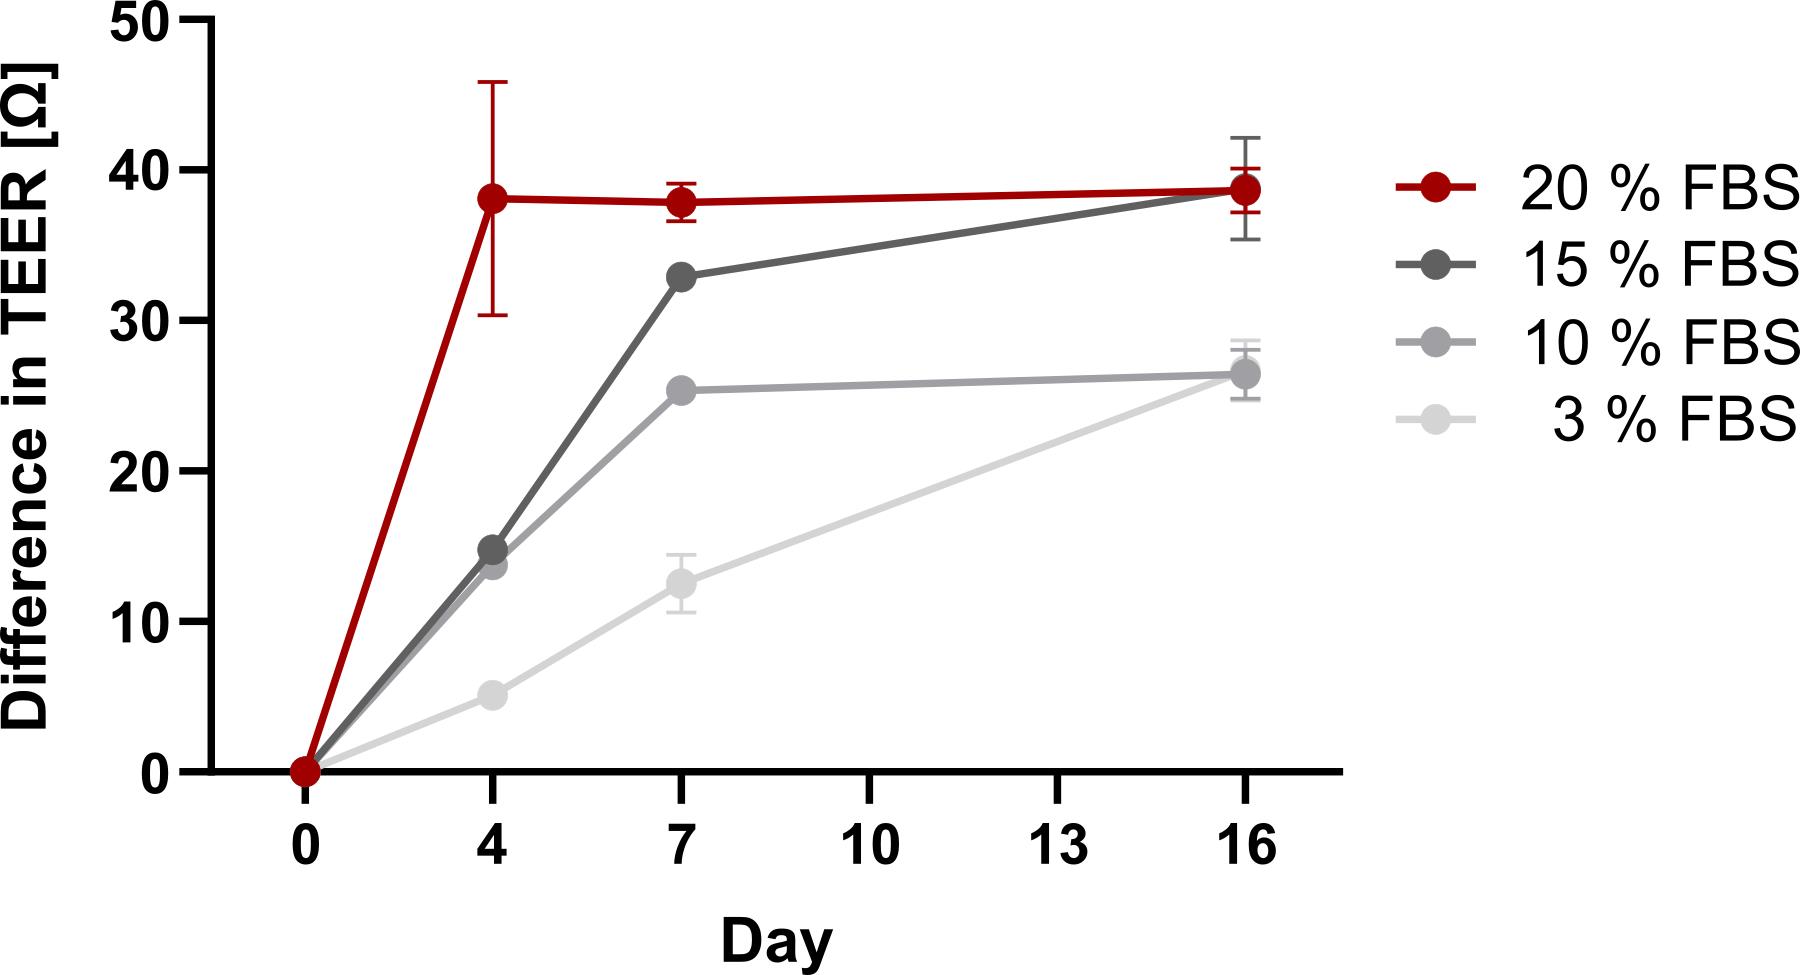
Figure 5. Optimization of FBS concentration for human umbilical vein endothelial cell (HUVEC) cultivation on inserts. Difference in transendothelial electrical resistance (TEER) measurement values of HUVECs cultured in Endopan medium containing 3%, 10%, 15%, or 20% FBS over 16 days, normalized to one empty control well and relative to baseline measurement values on day 0. Error bars are the standard error of the mean (SEM). The experiment was performed in technical triplicates per condition.
G. Establishment of the endothelial barrier: Change of culture condition and timing
Several studies indicate that dynamic modulation of supplements in the cultivation medium can influence the differentiation and barrier function of endothelial cells [15]. As tumor cell seeding requires a switch to low-serum medium as part of the migration stimulus, optimal timing for this change is necessary to maintain endothelial barrier stability. Therefore, HUVECs were cultured on inserts in Endopan 20 medium and subjected to a medium switch to low-serum conditions (3% FBS) either on day 7 or day 10 post-seeding. Barrier integrity was assessed by TEER measurements and immunofluorescence staining on day 16. Results show that switching on day 10, rather than day 7, preserves monolayer stability, supporting its use as the optimal window for tumor cell seeding in Transwell migration studies.
1. HUVEC culture: Culture pooled HUVECs in Endopan 3 medium until one T75 flask reaches ~80% confluence (see General note 7).
2. (Day 0) Insert preparation and baseline TEER measurements
a. Prepare one 24-well plate with ten inserts of 8 μm pore size, using three wells per condition and one additional cell-free insert as a negative control for normalization of TEER measurements (see Table 7).
Note: The pore diameter of inserts is not critical for this experiment, provided that the same diameter is used consistently across all inserts.
Table 7. Seeding scheme in a 24-well plate to determine optimal timing for FBS reduction in HUVEC cultivation medium for tumor cell seeding
| Condition | Insert 1 | Insert 2 | Insert 3 | Control (w/o cells) |
| Switch to Endopan 3 on day 7 | 120,000 HUVECs | 120,000 HUVECs | 120,000 HUVECs | Endopan 20 medium |
| Switch to Endopan 3 on day 10 | 120,000 HUVECs | 120,000 HUVECs | 120,000 HUVECs | - |
| Endopan 20 medium | 120,000 HUVECs | 120,000 HUVECs | 120,000 HUVECs | - |
b. To equilibrate Transwell membranes, add Endopan 20 medium to wells and inserts and incubate for 1 h at 37 °C and 5% CO2 (see General notes 5 and 6).
c. After membrane equilibration, perform baseline TEER measurements as described in step C2 (see General note 8).
3. (Day 0) HUVEC seeding
a. Trypsinize and count HUVECs and prepare for seeding (see General notes 2, 3 and 7).
b. Aspirate media from wells and inserts and add fresh Endopan 20 medium to wells (see General notes 1 and 5).
c. Seed 1.2 × 10⁵ cells in 400 μL of Endopan 20 medium per insert. Add 400 μL of medium to the remaining cell-free negative control insert (see Table 7). Cultivate under standard conditions at 37 °C and 5% CO2.
4. (Day 4) TEER measurements
a. On day 4 post-seeding, refresh medium in wells and inserts and perform TEER measurements as described in step C2 (see General notes 4, 5, and 8).
b. Incubate under humidified conditions at 37 °C and 5% CO2.
5. (Day 7) Medium transition for condition 1 and TEER measurements
a. On day 7 post-seeding, refresh the medium. For condition 1, switch to the lower-serum variant of medium (Endopan 3 medium, containing 3% FBS). For conditions 2 and 3, use Endopan medium supplemented to 20% FBS as applied previously (see General notes 1, 4, and 5).
Note: In the transmigration assay (Section D), the FBS concentration is further reduced to 1.75% due to the combination with tumor cell-specific medium. Since endothelial cell-specific Endopan 3 medium already contains 3% FBS, achieving a lower FBS concentration in this setup is limited. However, this reduction is sufficient to assess the functional impact of FBS depletion on tumor cell migration.
b. Perform TEER measurements as described in step C2 (see General note 8).
c. Cultivate under standard conditions at 37 °C and 5% CO2.
6. (Day 1) Medium transition for condition 2 and TEER measurements
a. On day 10 post-seeding, exchange medium in wells and inserts. For condition 1, continue with Endopan 3 medium as applied previously. For condition 2, reduce the FBS concentration and use Endopan 3 medium, identical to condition 1. For condition 3, use Endopan 20 medium as established in the experimental setup (see Table 7) (see General notes 1, 4, and 5).
b. Continue incubation under humidified conditions at 37 °C and 5% CO2.
7. (Day 13) TEER measurements
a. On day 13 post-seeding, refresh culture medium corresponding to each condition as specified in Table 7 (see General notes 1, 4, and 5).
b. Perform TEER measurements as described in step C2 (see General note 8).
c. Maintain cultures under standard conditions at 37 °C and 5% CO2.
8. (Day 16) TEER measurements and cell fixation
a. On day 16 post-seeding, refresh culture medium as previously described (see General notes 1, 4, and 5).
b. Perform TEER measurements as described in step C2 (see General note 8). Expected results are shown in Figure 6A.
c. Wash cells three times with DPBS, each for 5 min.
d. For fixation of cells, transfer the 24-well plate to a chemical fume hood.
i. Aspirate DPBS and add 4.5% PFA to wells and inserts (see General notes 4 and 5).
Critical: Ensure complete coverage of membranes to avoid uneven fixation.
Caution: PFA is a hazardous substance; handle it carefully and wear appropriate protective equipment.
ii. Incubate for 20 min at room temperature.
Pause point: For short-term storage before immunofluorescence staining, aspirate 4.5% PFA, wash three times with DPBS, and add 0.04% PFA to wells and inserts. Seal the plate tightly with Parafilm to prevent evaporation and store at 4 °C for up to one week. Due to the toxicity of PFA, ensure all handling is performed under a chemical fume hood.
iii. Aspirate 4.5% PFA and wash three times with DPBS for 5 min (see General notes 4 and 5).
9. (Day 16) Immunofluorescence staining
Note: Continue under a chemical fume hood.
a. Add Triton X-100 (1%) to wells and inserts and incubate for 5 min at room temperature to permeabilize cells.
b. Wash cells three times with DPBS for 5 min.
c. Add BSA (0.5% in DPBS) and incubate for 30 min at room temperature to block nonspecific binding sites prior to antibody staining.
d. Prepare 10 mL of staining solution with DAPI and Phalloidin. Add the staining solution to wells and inserts.
Critical: As an exception to the standard procedure, use only 800 μL per well and 80 μL per insert during this step to minimize reagent consumption.
e. Incubate for 30 min at room temperature in the dark.
Critical: Protect samples from light by wrapping the plate in aluminum foil and storing it in a dark drawer to prevent photobleaching.
f. Wash three times with DPBS-T, each for 10 min, to remove unbound antibodies while preserving antigen–antibody complexes. Use 1 mL for wells and 400 μL for inserts as per standard procedure. Then, keep the inserts in DPBS (see General notes 4 and 5).
Pause point: For short-term storage prior to imaging, store the plate at 4 °C. To minimize loss of fluorescence signal, protect samples from light by wrapping the plate tightly in aluminum foil.
10. (Day 17) Fluorescence microscopy imaging and quantitative analysis
a. Add one drop of DPBS in the middle of a glass slide and position the insert onto the drop.
b. Acquire images using an inverted fluorescence microscope (e.g., Olympus IX83) in FITC and DAPI channels (see General note 10).
c. Quantify the HUVEC-covered area using Fiji and consistent threshold settings. Figure 6B, C shows expected results.
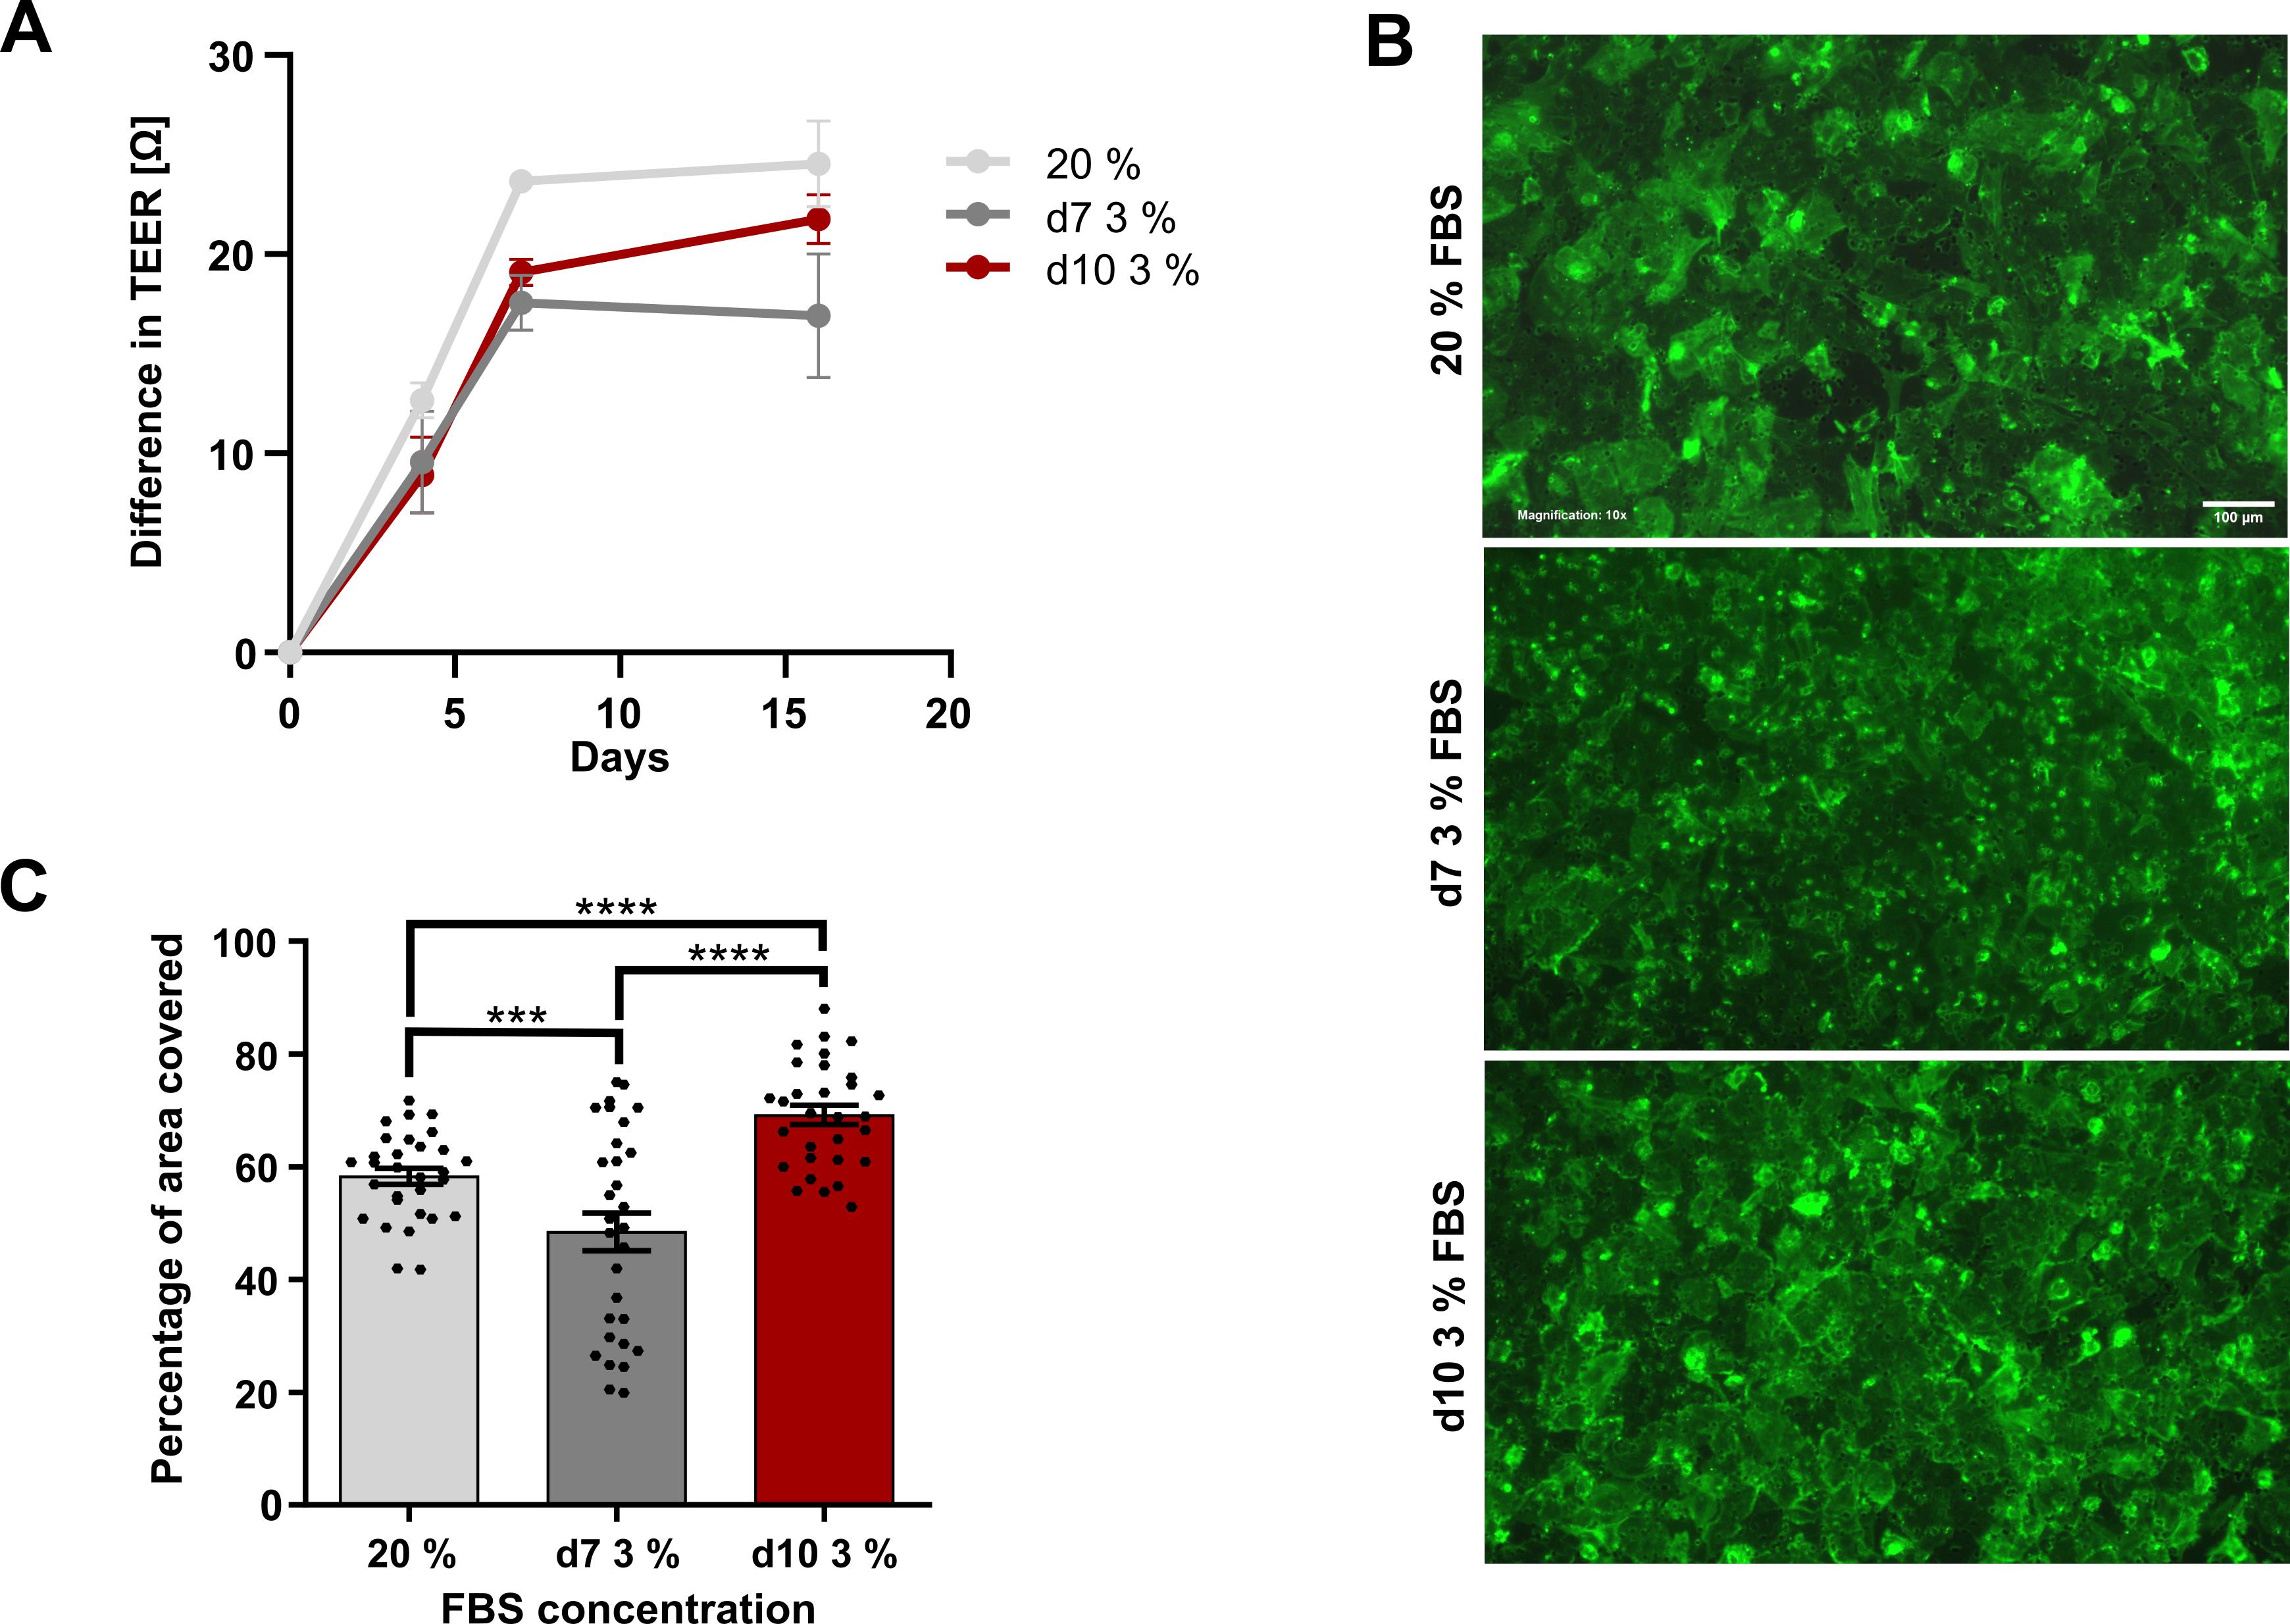
Figure 6. Optimal time point for FBS reduction in human umbilical vein endothelial cell (HUVEC) culture medium for tumor cell seeding. (A) Difference in transendothelial electrical resistance (TEER) measurement values of HUVECs, normalized to one empty control well and relative to baseline measurements on day 0 after switching from Endopan 20 medium (20% FBS) to Endopan 3 medium (3% FBS) on day 7 compared to day 10 and to the control group constantly cultivated with 20% FBS. Error bars are the standard error of the mean (SEM). (B) Representative fluorescence microscopy images of Phalloidin-stained HUVECs on day 16 after cultivation with and without switching from 20% FBS to 3% FBS in the cultivation medium on days 7 and 10. Images were acquired using an Olympus IX83 equipped with a Hamamatsu CMOS camera in the FITC and DAPI channels, with excitation at 490 nm (14% LED intensity) for FITC and 365 nm (50% LED intensity) for DAPI. For FITC, an exposure time of 807 ms and a gain setting of 18 dB were used; DAPI was imaged with an exposure time of 49 ms, and a gain setting of 1 dB. DAPI was used as a counterstain and is not shown. All images were acquired with a 10× magnification. Scale bar: 100 µm (C) HUVEC-covered area of inserts, quantified in 10 representative images per insert on day 16 after changing the cultivation medium. One-way ANOVA; ***p ≤ 0.001, ****p ≤ 0.0001. Error bars are the standard error of the mean (SEM). The experiment was performed in technical triplicates per condition.
H. Co-culture of HUVECs and MG-63 cells
Not all cancer cell types show spontaneous transendothelial migration under standard in vitro conditions. Many tumor cell lines, including certain breast cancer subtypes, display low baseline migratory potential when cultured in serum-containing media, limiting their ability to cross endothelial barriers in Transwell assays without external stimulation. This phenomenon underscores the importance of incorporating biologically relevant chemoattractants to enhance the physiological relevance and sensitivity of migration assays.
Several studies have demonstrated that co-culture with specific cell lines can significantly augment the migratory behavior of otherwise poorly invasive tumor cells by mimicking the chemotactic signals in the tumor microenvironment. Among these, the osteosarcoma cell line MG-63 is widely used as a source of soluble factors that promote endothelial transmigration. MG-63 cells secrete a range of pro-migratory and pro-angiogenic mediators—including vascular endothelial growth factor (VEGF), stromal cell-derived factor-1 (SDF-1/CXCL12), and matrix metalloproteinases (MMPs)—which can act as potent chemoattractants for tumor cells and contribute to endothelial barrier remodeling [16].
To evaluate whether the presence of MG-63 cells influences endothelial barrier integrity, a spatially separated co-culture system was established with HUVECs seeded on inserts and MG-63 cells cultured in the underlying wells. Barrier function was assessed over time using TEER measurements and immunofluorescence staining of nuclei (DAPI) and cytoskeletal organization (Phalloidin) to visualize HUVEC confluence on inserts after co-cultivation. The results indicate that MG-63 cells do not compromise endothelial monolayer stability. This finding supports the use of MG-63 cells as a reliable and non-disruptive attractant in transendothelial migration assays, particularly for studying the migratory potential of low-invasive tumor cell populations.
Regardless of their impact on endothelial barrier integrity, the chemotactic efficacy of MG-63 cells may vary depending on the tumor cell line, and not all cell types respond equally to co-culture conditions. Therefore, when working with less invasive tumor cell lines, evaluate the attractant effect of MG-63 cells in a separate pre-experiment to confirm meaningful improvement in migratory behavior before setting up a co-culture in the Transwell migration assay.
1. Cell culture and preparation
a. Culture HUVECs in Endopan 3 medium in a T75 flask until reaching ~80% confluence (see General note 7).
b. Culture MG-63 cells in DMEM medium in a T75 flask.
Note: MG-63 cells generally proliferate faster than HUVECs and may be thawed later to synchronize experimental timing if both cell lines are freshly thawed from cryovials.
2. (Day 0) Insert preparation and TEER measurements
a. Prepare one 24-well plate with seven inserts of 8 μm pore size. Use six of the inserts for HUVEC cultivation and the remaining insert as a cell-free negative control for normalization of TEER measurements (see Table 8).
Note: The pore diameter of inserts is not critical for this experiment, provided that the same diameter is used consistently across all inserts.
Table 8. Seeding scheme for co-cultivation of HUVECs and MG-63 cells in a 24-well plate
| Seeding time point | Well 1 | Well 2 | Well 3 | Control (w/o) cells |
| Day 0 (positive control) | 120,000 HUVECs, Endopan 20 medium | 120,000 HUVECs, Endopan 20 medium | 120,000 HUVECs, Endopan 20 medium | Endopan 20 medium |
| Day 0 (co-cultivation) | 120,000 HUVECs, Endopan 20 medium | 120,000 HUVECs, Endopan 20 medium | 120,000 HUVECs, Endopan 20 medium | - |
| Day 8 (co-cultivation) | 50,000 MG-63 cells, DMEM medium | 50,000 MG-63 cells, DMEM medium | 50,000 MG-63 cells, DMEM medium | - |
b. To equilibrate insert membranes, add Endopan 20 medium to all seven wells and inserts and incubate for 1 h at 37 °C and 5% CO2 (see General notes 5 and 6).
c. Perform baseline TEER measurements in all wells as described in step C2 (see General note 8).
3. (Day 0) HUVEC seeding
a. After TEER measurements, trypsinize and count HUVECs and prepare for seeding (see General notes 2 and 3).
b. Aspirate medium from wells and inserts, then refresh the medium in wells. Seed 1.2 × 10⁵ HUVECs in 400 μL of Endopan 20 medium per insert in the corresponding wells (see Table 8). For the control insert, add 400 μL of medium instead of cell suspension (see General notes 1 and 5).
c. Cultivate under standard conditions at 37 °C and 5% CO2.
4. (Day 4 and day 7) TEER measurements
a. On day 4 post-seeding, refresh medium in all wells and inserts (see General notes 1, 4, and 5).
b. Perform TEER measurements as described in step C2 (see General note 8).
c. Incubate under humidified conditions at 37 °C and 5% CO2.
d. On day 7 post-HUVEC seeding, repeat medium refreshment and TEER measurements as previously described and maintain cultivation under standard conditions at 37 °C and 5% CO2. Expect TEER values similar to those shown in Figure 7A.
5. (Day 8) Osteosarcoma cell seeding
a. On day 8 post-HUVEC seeding, trypsinize and count MG-63 cells and prepare for seeding (see General notes 2 and 3).
b. Seed 5 × 10⁴ MG-63 cells in 1.2 mL of DMEM medium per well in three separate wells of the same 24-well plate used for HUVEC cultivation (see Table 8).
c. Cultivate cells under standard conditions at 37 °C and 5% CO2 for the next two days.
6. (Day 10) Co-cultivation setup
a. On day 10 post-HUVEC seeding, refresh medium in all wells and inserts of HUVEC cultivation and in the control with Endopan 20 medium (see General notes 1, 4, and 5).
b. Aspirate medium in wells with MG-63 cultures and replace with 1 mL of Endopan 20 medium (see General notes 1 and 5).
Note: Although cultivation in endothelial cell-specific medium may slightly limit MG-63 proliferation or viability, it is essential to minimize potential bias from extraneous environmental influences on HUVECs—other than the co-culture condition itself—by maintaining consistent and standardized culture conditions across all experimental groups.
c. Initiate co-cultivation of endothelial cells with osteosarcoma cells by transferring the corresponding three inserts with HUVECs to the wells seeded with MG-63 cells.
d. Maintain cultivation under standard conditions at 37 °C and 5% CO2.
7. (Day 16) TEER measurements and immunofluorescence staining for microscopy imaging
a. On day 16 post-HUVEC seeding, refresh medium in all wells and inserts with Endopan 20 medium (see General notes 1, 4, and 5).
b. Perform TEER measurements as described in step C2 (see General note 8).
c. Wash cells three times with DPBS, fix in 4.5% PFA, and perform immunofluorescence staining of nuclei and cytoskeletal formation using DAPI and Phalloidin as described in steps G8–9 (see General notes 4 and 5).
d. Acquire images via inverted fluorescence microscope in FITC and DAPI channels (see General note 10).
e. Quantify the integrity of endothelial barriers in both conditions using Fiji. Expect results as shown in Figure 7B, C.
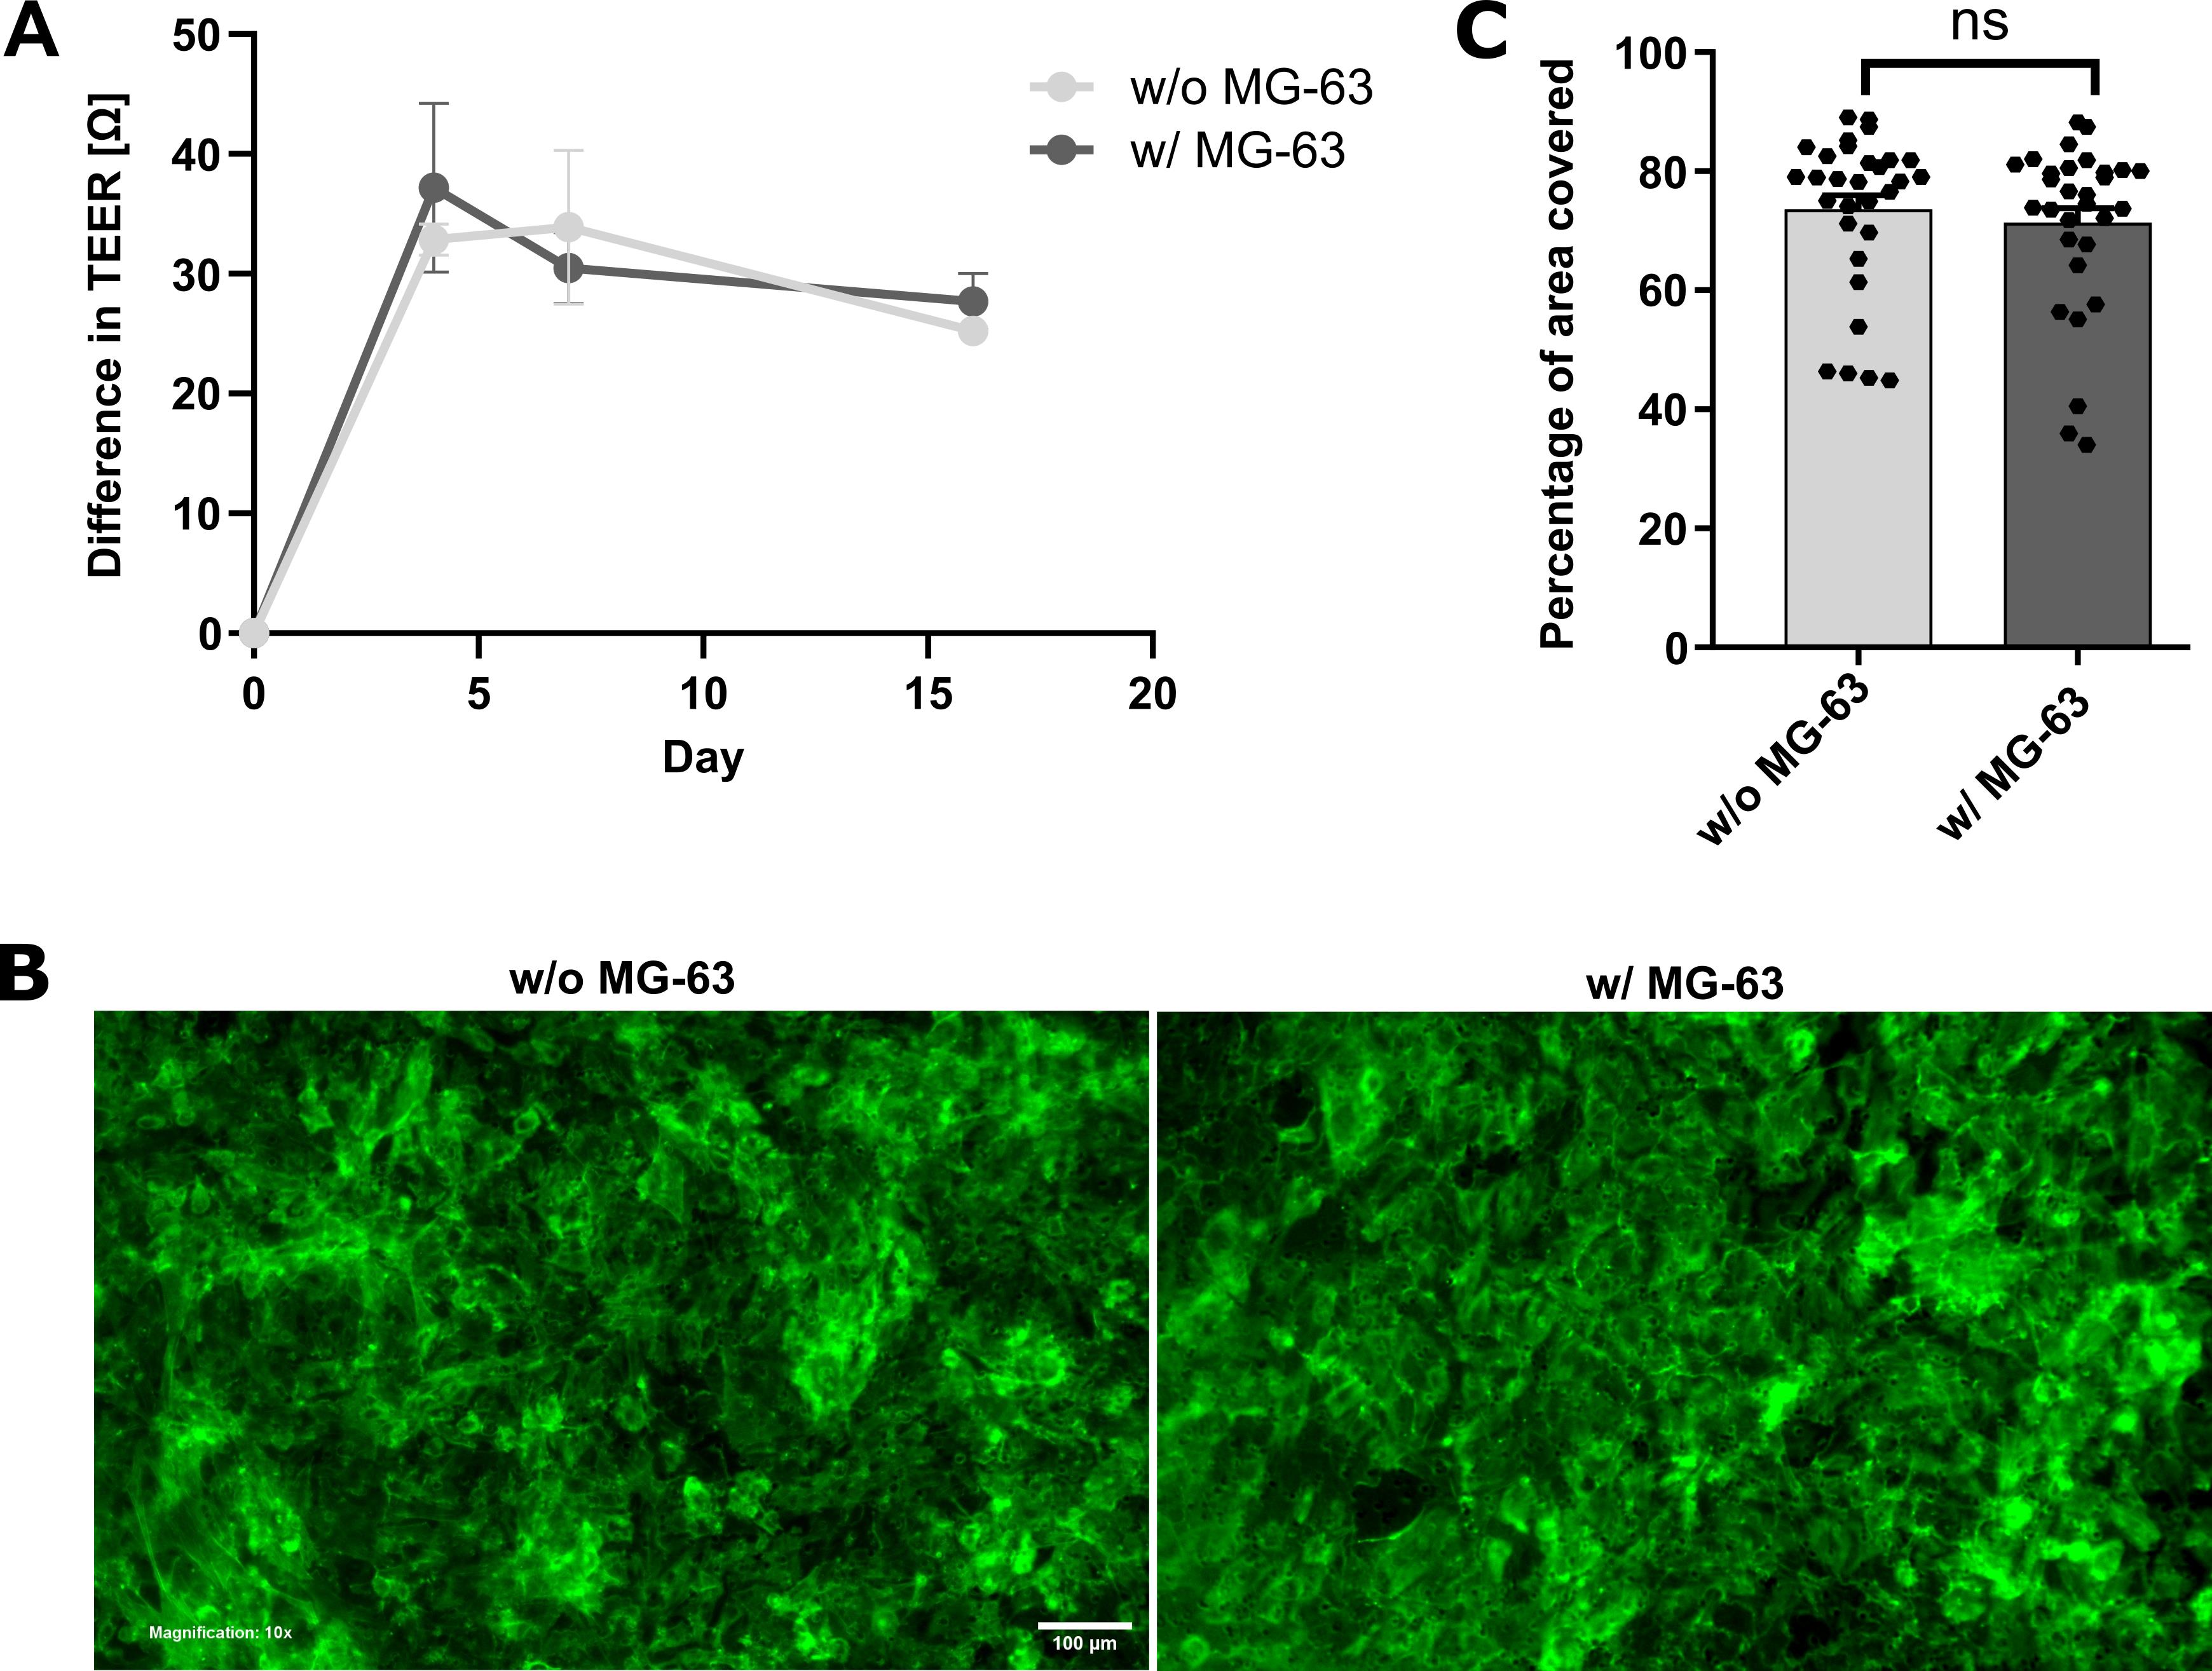
Figure 7. Co-cultivation of human umbilical vein endothelial cells (HUVECs) and MG-63 osteosarcoma cells. (A) Transendothelial electrical resistance (TEER) measurement values of HUVECs cultured in spatial proximity to MG-63 cells compared to cultivation without attractant cells, normalized to one empty control well and relative to baseline measurement values on day 0. Error bars are the standard error of the mean (SEM). (B) Representative fluorescence microscopy images of Phalloidin-stained HUVECs after six days of monoculture (left panel) and co-cultivation with MG-63 cells (right panel). Images were acquired using an Olympus IX83 equipped with a Hamamatsu CMOS camera in the FITC and DAPI channels, with excitation at 490 nm (14% LED intensity) for FITC and 365 nm (50% LED intensity) for DAPI, and a magnification of 10×. For FITC, an exposure time of 807 ms and a gain setting of 18 dB were used; DAPI was imaged with an exposure time of 8 ms and a gain setting of 18 dB. DAPI was used as a counterstain and is not shown. All images were acquired with a 10× magnification. Scale bar: 100 µm (C) HUVEC-covered area in 10 images per insert with and without MG-63 cells in technical triplicates for each condition. Unpaired t-test; ns, non-significant. Error bars are the standard error of the mean (SEM). The experiment was performed in technical triplicates for each condition.
I. Coating of inserts to enhance the endothelial barrier
Endothelial cell adhesion, spreading, and barrier maturation are critically influenced by the composition of the underlying extracellular matrix (ECM). In Transwell-based assays, the use of appropriate coating substrates can significantly enhance the efficiency and reproducibility of endothelial monolayer formation by promoting HUVEC attachment, polarization, and tight junction assembly [17]. To evaluate the impact of ECM components on endothelial barrier integrity, inserts were coated with a panel of biologically relevant substrates—including gelatin, collagen I, and poly-L-lysine—prior to HUVEC seeding. Barrier function was assessed using TEER measurements over time, complemented by immunofluorescence staining for cytoskeletal organization (Phalloidin). While no statistically significant differences were observed in cellular morphology or confluence by fluorescence microscopy, TEER measurements revealed a consistent and significant enhancement in barrier integrity in inserts coated with gelatin. Furthermore, gelatin demonstrated superior cost-effectiveness and ease of handling compared to collagen I and poly-L-lysine. Based on these findings, gelatin is recommended as the optimal coating substrate for the reliable and reproducible establishment of a functional endothelial barrier in transendothelial migration assays.
1. Cell culture: Culture HUVECs in Endopan 3 medium until two T75 flasks reach ~80% confluence (see General note 7).
2. (Day 0) Coating procedure for inserts
a. Prepare 2 mL of each coating suspension in a conical tube, using 0.1% (w/v) gelatin, collagen I, and poly-L-lysine in ROTI cell water, and vortex gently until homogeneous solutions are obtained.
Critical: Due to the viscous consistency of some coating solutions, prepare additional volumes beyond the minimum requirement to account for adsorption to pipette tips and tube walls.
b. Place 13 inserts with 8 μm pore size into one 24-well plate to use three inserts per coating substrate, three inserts for cell cultivation without coating, and one cell-free insert designated as a negative control for normalization of TEER measurements (see Table 9).
Note: The pore diameter is not critical for this experiment, provided the same diameter is used consistently across all inserts.
c. Add 100 μL of coating solution to the three corresponding inserts (see Table 9). Incubate for 30 min at 37 °C and 5% CO2.
Note: Keep the remaining four uncoated inserts submerged in DPBS during the incubation period to prevent drying and temperature-induced material damage.
Table 9. Seeding scheme for comparison of different coating compounds as substrates for HUVEC cultivation
| Coating | Insert 1 | Insert 2 | Insert 3 | Control (w/o cells) |
| w/o coating | 120,000 cells Endopan 20 medium | 120,000 cells Endopan 20 medium | 120,000 cells Endopan 20 medium | Endopan 20 medium |
| 0.1% gelatin | 120,000 cells Endopan 20 medium | 120,000 cells Endopan 20 medium | 120,000 cells Endopan 20 medium | - |
| 0.1% collagen I | 120,000 cells Endopan 20 medium | 120,000 cells Endopan 20 medium | 120,000 cells Endopan 20 medium | - |
| 0.1% poly-L-lysine | 120,000 cells Endopan 20 medium | 120,000 cells Endopan 20 medium | 120,000 cells Endopan 20 medium | - |
d. Aspirate the excess coating solution from all inserts.
e. Wash coated inserts twice by adding DPBS to wells and inserts and incubating them at room temperature for 10 min per wash to remove unbound coating material while preserving the integrity of the applied layer. Subsequently, aspirate the remaining DPBS in all wells and inserts and proceed promptly to membrane equilibration to ensure optimal hydration of coated inserts (see General notes 4 and 5).
3. (Day 0) Membrane equilibration and TEER measurements
a. To equilibrate insert membranes, add Endopan 20 medium to all 13 wells and inserts. Incubate for 1 h at 37 °C and 5% CO2 (see General notes 5 and 6).
b. After successful membrane equilibration, perform baseline TEER measurements as described in step C2 (see General note 8).
4. (Day 0) HUVEC seeding
a. Trypsinize and count HUVECs and prepare for seeding (see General notes 2 and 3).
b. Aspirate medium from wells and inserts, add fresh Endopan 20 medium to wells, and seed 1.2 × 10⁵ HUVECs in 400 μL of Endopan 20 medium per insert. Add 400 μL of Endopan 20 medium without cell suspension to the cell-free control insert (see Table 9).
c. Cultivate under humidified conditions at 37 °C and 5% CO2.
5. (Day 4) Medium refreshment: On day 4 post-seeding, refresh the medium in all wells and inserts using Endopan 20 medium to support HUVEC growth and promote the development of a stable endothelial monolayer (see General notes 1, 4, and 5).
6. (Day 7) TEER measurements
a. On day 7 post-seeding HUVECs, refresh medium in all wells and inserts using Endopan 20 medium (see General notes 1, 4, and 5).
b. Perform TEER measurements as described in step C2 (see General note 8).
c. Maintain cultivation under standard conditions at 37 °C and 5% CO2.
7. (Day 10) TEER measurements and cell fixation
a. Repeat medium refreshment and TEER measurements as previously described (see General notes 1, 4, 5, and 8). Expect results similar to those shown in Figure 8A.
b. After final TEER measurements, aspirate medium from wells and inserts and wash cells three times with DPBS. Fix in 4.5% PFA under a chemical fume hood as described in step G8.
Pause point: For short-term storage, maintain inserts in 0.04% PFA and store at 4 °C, wrapped in Parafilm to prevent evaporation.
8. (Day 10) Immunofluorescence staining and quantification of endothelial barrier stability
a. Perform immunofluorescence staining with DAPI and Phalloidin according to the protocol detailed in step G9.
b. Acquire images using an inverted fluorescence microscope in FITC and DAPI channels at 10× magnification as outlined in step G10 (see General note 10).
c. Quantify endothelial confluence using Fiji to obtain results consistent with those shown in Figure 8B, C.
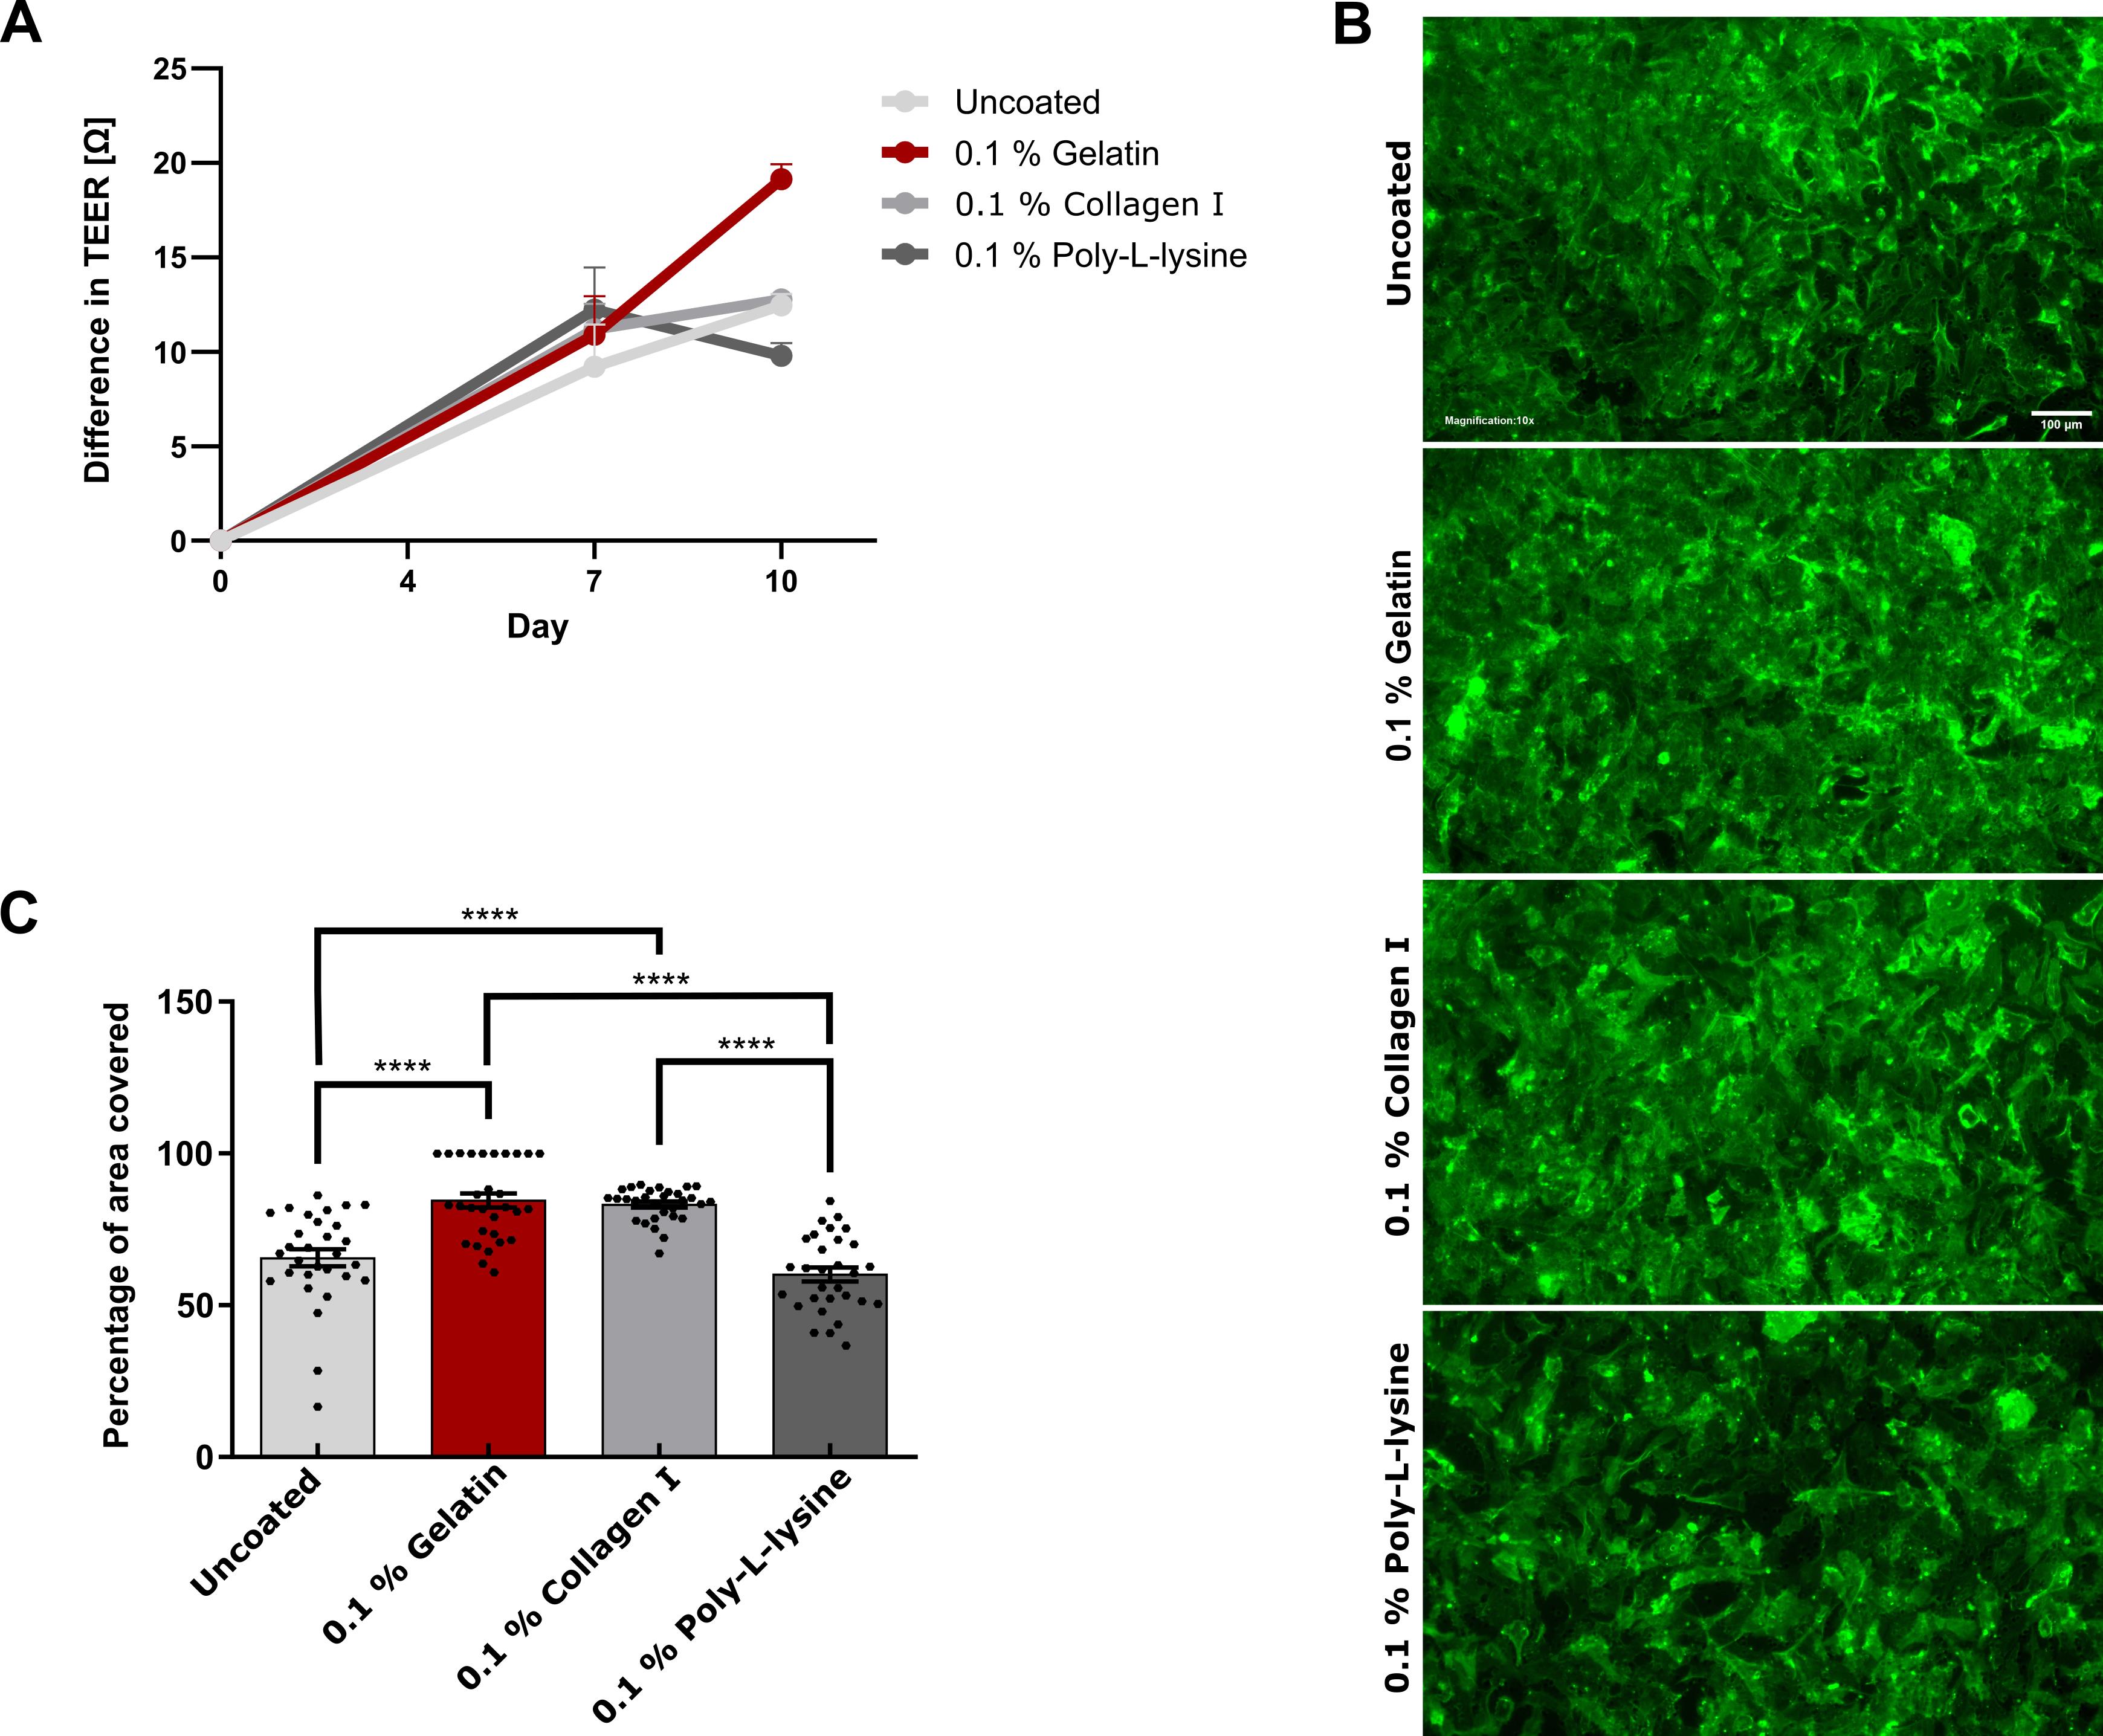
Figure 8. Coating for accurate endothelial barrier formation. (A) Difference in normalized transendothelial electrical resistance (TEER) measurement values of human umbilical vein endothelial cells (HUVECs) seeded on 0.1% protein solutions as a coating layer, relative to baseline measurement values on day 0. Error bars are the standard error of the mean (SEM). (B) Representative fluorescence microscopy images of Phalloidin-stained HUVECs on day 10 after seeding on different coating substrates. Images were acquired using an Olympus IX83 equipped with a Hamamatsu CMOS camera in the FITC and DAPI channels, with excitation at 490 nm (50% LED intensity) for FITC and 365 nm (50% LED intensity) for DAPI. For FITC, an exposure time of 807 ms and a gain setting of 20 dB were used; DAPI was imaged with an exposure time of 8 ms and a gain setting of 18 dB. DAPI was used as a counterstain and is not shown. All images were acquired with a 10× magnification. Scale bar: 100 µm (C) HUVEC-covered area of inserts on day 10 after seeding on various protein solutions. One-way ANOVA; ****p ≤ 0.0001. Error bars are the standard error of the mean (SEM). The experiment was performed in technical triplicates per condition.
J. Optimization of gelatin coating concentration for high-confluence endothelial barrier formation of HUVECs
To determine the optimal gelatin concentration for coating the inserts and to maximize the formation of a highly confluent, functionally intact endothelial barrier, a range of gelatin concentrations (0.1%–0.6% w/v) was systematically evaluated. Barrier integrity was assessed by immunofluorescence staining with DAPI, CD31, ZO-1, and Phalloidin, followed by quantitative image analysis. Quantitative assessment of endothelial confluence and junctional continuity revealed that a coating concentration of 0.5% gelatin yields the most robust and homogeneous monolayer formation, with significantly enhanced barrier integrity compared to lower or higher concentrations. These findings indicate that 0.5% gelatin provides an optimal balance between cell adhesion, spreading, and junctional organization, establishing it as the preferred coating concentration for reproducible and physiologically relevant transendothelial migration assays.
1. Cell culture: Cultivate HUVECs in Endopan 3 medium in one T75 flask until reaching ~80% confluence (see General note 7).
2. (Day 0) Membrane coating and equilibration
a. Prepare one conical tube with 4.5 mL of the corresponding gelatin solution for each condition. Dissolve gelatin to final concentrations of 0.1%, 0.2%, 0.3%, 0.4%, 0.5%, and 0.6% in ROTI cell water. Vortex gently until gelatin is fully dissolved.
b. Place 12 inserts with 5 μm pores into two 6-well plates. Use two inserts per gelatin concentration, enabling independent assessment and ensuring reproducibility of results across two separate experiments.
Note: The pore diameter of inserts is not critical for this experiment, provided that the same diameter is used consistently across all inserts.
c. Add 1.5 mL of gelatin solution to the corresponding wells as outlined in Table 10. Ensure even distribution across the insert membrane.
d. Incubate the plates for 30 min at 37 °C and 5% CO2.
e. Carefully aspirate the residual gelatin solution from inserts. Then, wash wells and inserts twice with DPBS at room temperature for 10 min each (see General notes 4 and 5).
f. To equilibrate insert membranes, aspirate the remaining DPBS, add Endopan 20 medium to wells and inserts, and incubate for 1 h at 37 °C and 5% CO2 (see General notes 1, 4, 5, and 6).
Table 10. Seeding scheme for evaluating the effect of varying gelatin concentrations on endothelial barrier formation on inserts in two 6-well plates
| Gelatin concentration | Insert 1 | Insert 2 |
| 0.1% gelatin | 300,000 HUVECs Endopan 20 medium | 300,000 HUVECs Endopan 20 medium |
| 0.2% gelatin | 300,000 HUVECs Endopan 20 medium | 300,000 HUVECs Endopan 20 medium |
| 0.3% gelatin | 300,000 HUVECs Endopan 20 medium | 300,000 HUVECs Endopan 20 medium |
| Gelatin concentration | Insert 1 | Insert 2 |
| 0.4% gelatin | 300,000 HUVECs Endopan 20 medium | 300,000 HUVECs Endopan 20 medium |
| 0.5% gelatin | 300,000 HUVECs Endopan 20 medium | 300,000 HUVECs Endopan 20 medium |
| 0.6% gelatin | 300,000 HUVECs Endopan 20 medium | 300,000 HUVECs Endopan 20 medium |
3. (Day 0) HUVEC seeding and maintenance
a. Trypsinize and count HUVECs and prepare for seeding (see General notes 2 and 3).
b. Aspirate medium from wells and inserts and add fresh medium to wells. Seed 3 × 10⁵ HUVECs in 2 mL of Endopan 20 medium per insert (see General notes 1, 4, and 5).
c. Cultivate under humidified conditions at 37 °C and 5% CO2.
4. (Day 4 and day 7) Medium refreshment
a. On day 4 post-seeding, refresh Endopan 20 medium in all wells and inserts (see General notes 1, 4, and 5).
b. Maintain cells under humidified conditions at 37 °C and 5% CO2.
c. Repeat medium refreshment on day 7 after seeding to ensure adequate nutrition of HUVECs.
5. (Day 10) Fixation and primary antibody solution (staining day 1)
a. On day 10 post-seeding, aspirate medium and wash three times with DPBS for 5 min each (see General notes 4 and 5). Proceed under a chemical fume hood:
b. Fix HUVECs using 4.5% PFA as outlined in step G8 (see General notes 4 and 5).
c. Aspirate PFA, wash three times with DPBS, and permeabilize cells with Triton X-100 (1%) in DPBS for 5 min at room temperature.
d. Wash wells and inserts three times with DPBS for 5 min each.
e. Aspirate DPBS and block the surface by adding BSA (0.5% in DPBS). Incubate for 1 h at room temperature to prevent nonspecific binding.
f. Prepare 1.3 mL of primary antibody solution.
g. At the end of the incubation time, prepare the lid of the 6-well plates by labeling and covering with Parafilm.
Critical: Avoid creating wrinkles, which may cause uneven distribution of staining solution during subsequent steps.
h. Apply the staining solution onto cells on insert membranes, processing one insert at a time: Add one drop (100 μL) of antibody solution onto the Parafilm; carefully cut the insert membrane out of the frame with a sterile scalpel and use tweezers to position the membrane onto the drop of antibody solution, with cells facing down to ensure optimal antibody access to the cell monolayer.
Critical: To prevent air bubbles between the membrane and staining solution, place the edge of the membrane close to the drop and slowly lower the rest of the membrane at an acute angle. Minimize the time for cutting the membrane and keep the inserts on DPBS for as long as possible to prevent cells from drying. When using tweezers, ensure minimal contact with membranes to prevent damage to the cell monolayer.
i. Repeat step J5h for each insert membrane.
j. Incubate overnight at 4 °C in a humid, dark chamber to prevent drying of stained cells. For example, use a 224 × 224 mm square Petri dish, cover the bottom with wet Whatman paper, and wrap the dish in aluminum foil before storing it in a dark drawer.
6. (Day 11) Secondary antibody solution (staining day 2)
a. On the next day, remove insert membranes from the 6-well plate lids and transfer them back into wells, cells facing up, using tweezers.
b. Wash three times with 2 mL of DPBS-T per well for 5 min each (see General notes 4 and 5).
c. Prepare 1.3 mL of secondary antibody solution.
d. Prepare the lids of the 6-well plates by covering with Parafilm and add 100 μL of secondary antibody solution on top of each insert membrane. Place membranes on the drops, cells facing down, and repeat for each membrane according to the procedure described in step J5.
e. Incubate for 2 h in a humid, light-tight box in the dark at room temperature. Prepare a square Petri dish as previously described.
f. Transfer membranes back into wells, cells facing up, and wash three times with 2 mL of DPBS-T per well for 10 min each to remove unbound antibodies while preserving cell integrity (see General notes 4 and 5).
g. Add a drop (20 μL) of Mowiol mounting medium on a glass slide and place one insert membrane onto the drop, with cells facing down. Add another 20 μL of Mowiol mounting medium to the membrane and place a coverslip on top. Repeat for every insert membrane.
Critical: Avoid the formation of air bubbles, as they can compromise image quality during microscopy. To prevent this, position the edge of the membrane close to the drop of mounting medium and slowly lower the remainder of the membrane until it lies flat and horizontally.
h. Allow the mountant to dry for at least 3 h in the dark at room temperature. Consider extending the incubation period to overnight incubation to ensure complete drying and stabilization of the mountant.
Critical: Protect samples from light to prevent photobleaching and maintain signal stability for accurate downstream quantifications.
7. (Day 12) Imaging: Acquire images of the stained cells on insert membranes with an inverted fluorescence microscope. Capture images in FITC, DAPI, Cy3, and Cy5 channels at 20× magnification and expect results as depicted in Figure 9 (see General note 10).
Note: For long-term storage, keep stained cells on glass slides at 4 °C in the dark.
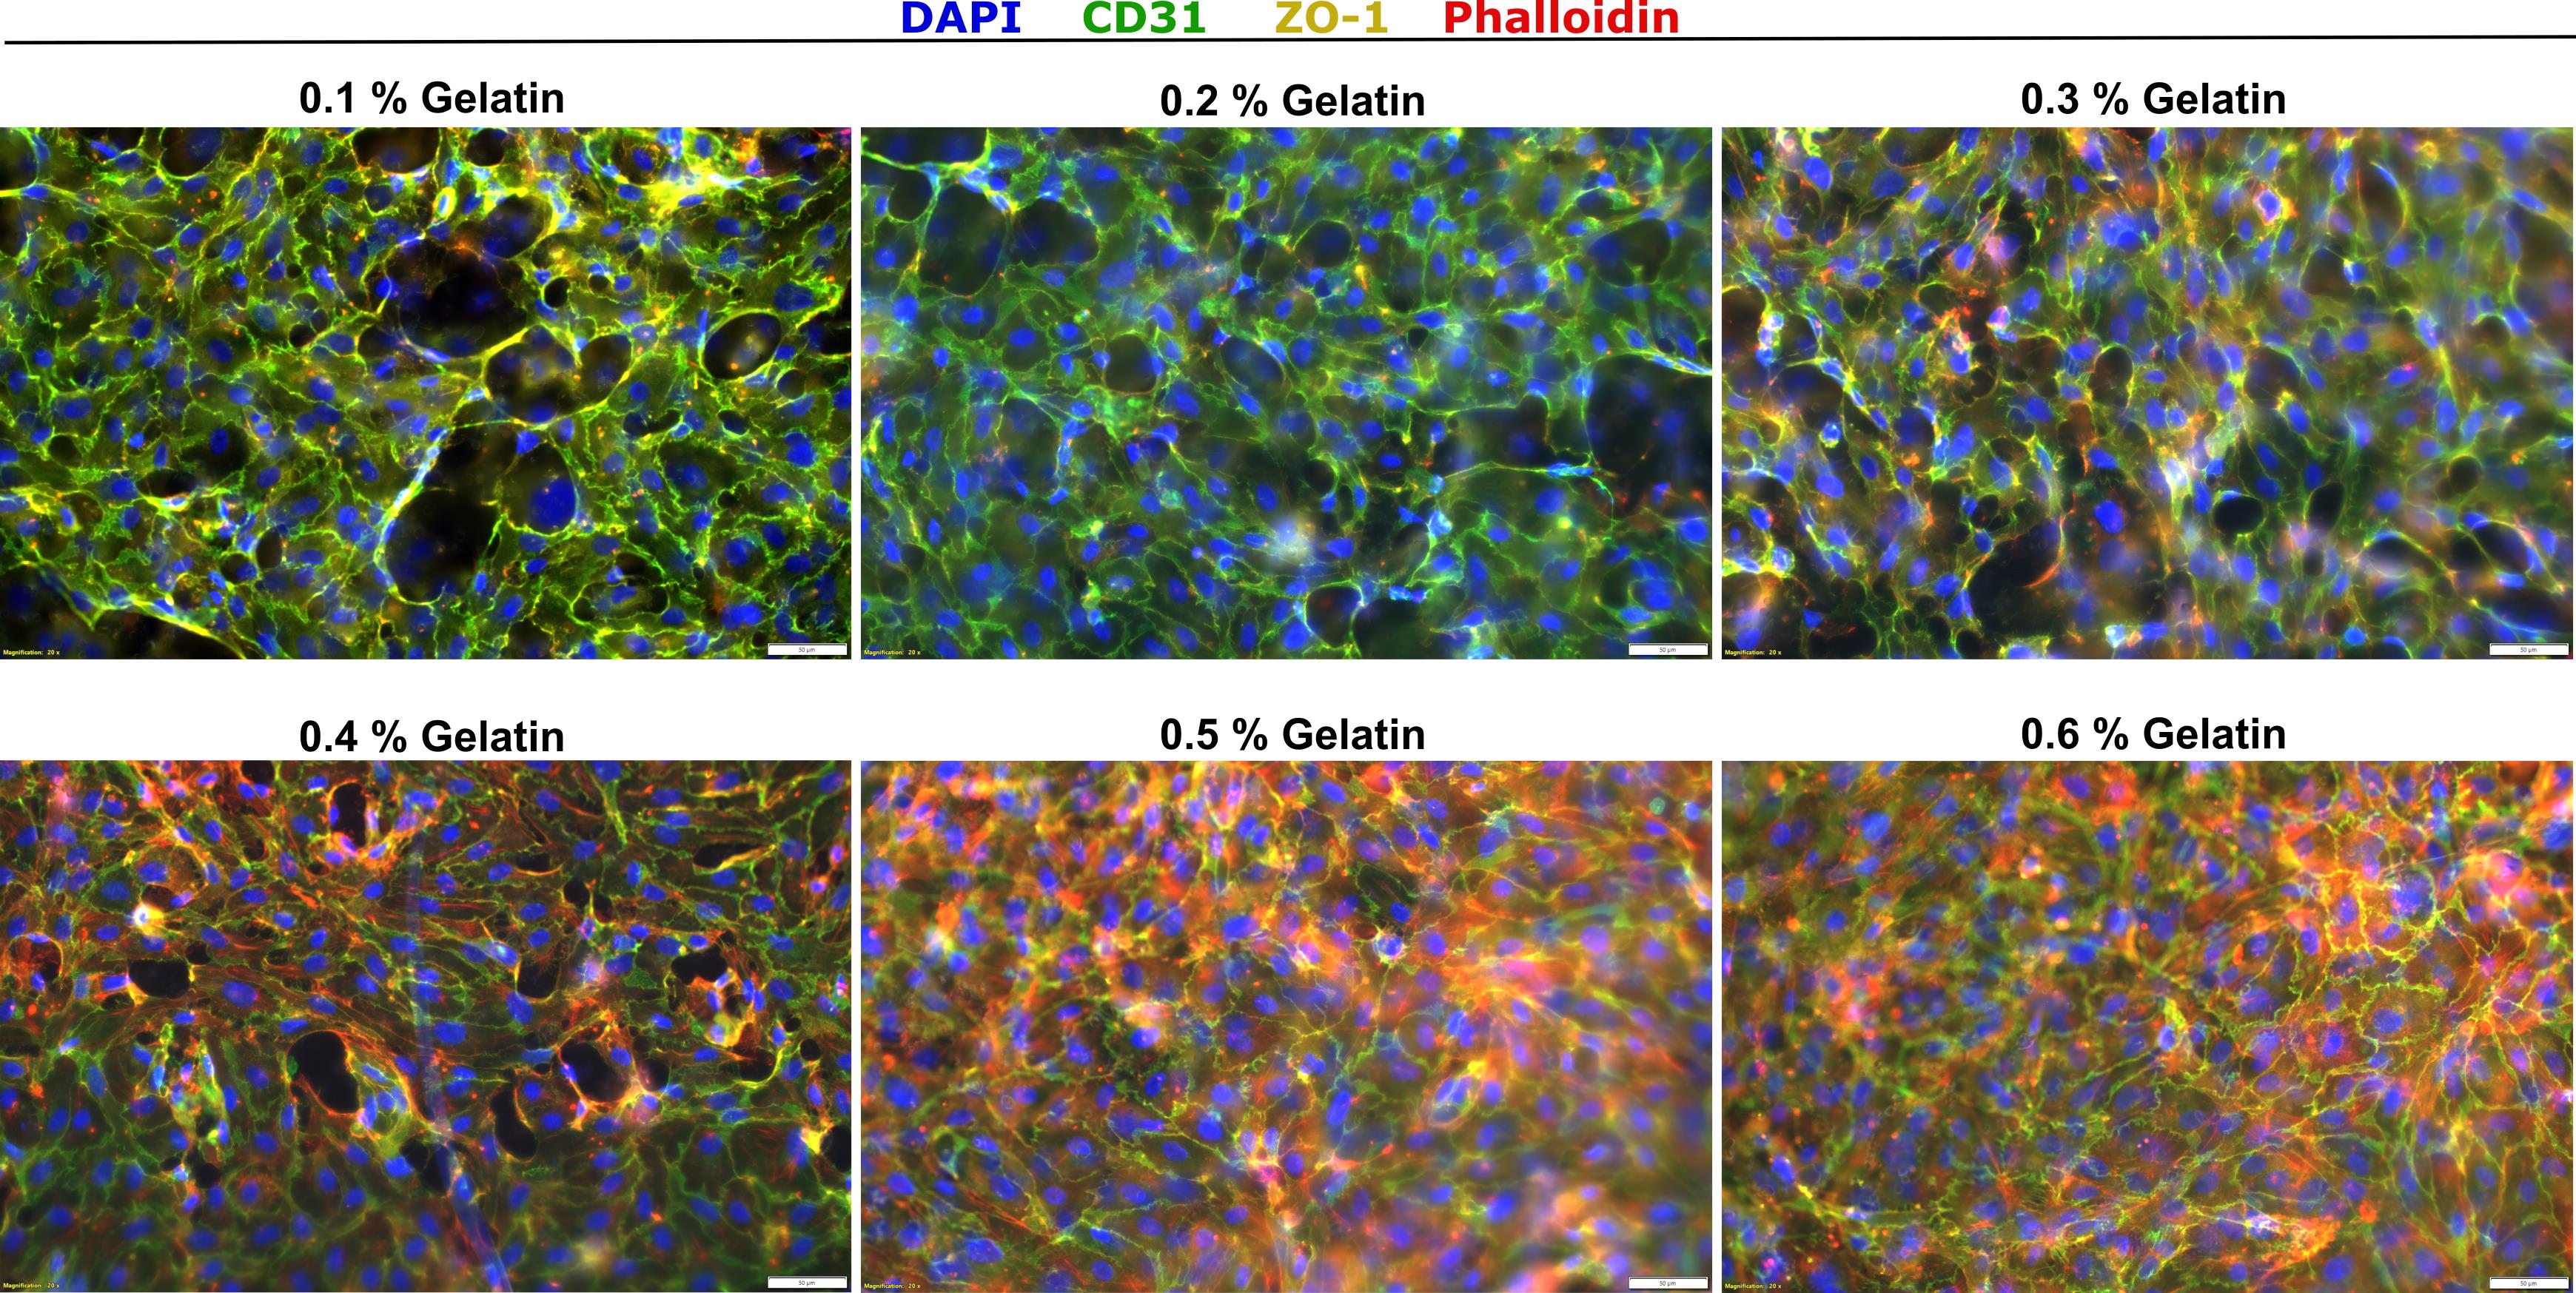
Figure 9. Various gelatin concentrations as coating agents for endothelial barrier formation. Fluorescence microscopy images of human umbilical vein endothelial cells (HUVECs) after 10 days of cultivation in Endopan 20 medium on inserts with varying concentrations of gelatin, after immunofluorescence staining of nuclei (DAPI, blue), endothelial cell-specific membrane proteins (CD31, green), intercellular contacts (ZO-1, yellow), and cytoskeletal components (Phalloidin, red). Images were acquired using an Olympus IX83 equipped with a Hamamatsu CMOS camera in the DAPI, FITC, Cy3, and Cy5 channels, with excitation at 365 nm (50% LED intensity) for DAPI, 490 nm (50% LED intensity) for FITC, 550 nm (50% LED intensity) for Cy3, and 625 nm (50% LED intensity) for Cy5. For DAPI, an exposure time of 10 ms was used; FITC was imaged with an exposure time of 632 ms, Cy3 with an exposure time of 1.3 s, and Cy5 with an exposure time of 1 s. For all channels, images were acquired with a gain setting of 1.4 dB and at 20× magnification. The experiment was performed in technical duplicates. Scale bars: 50 µm.
Data analysis
FlowJo: Guide for FACS data analysis (see Section B)
1. Import .fcs files of control cells and “UP” and “LOW” cells via drag-and-drop.
2. Create a dot plot and verify axis labels (x = FSC-H; y = SSC-H). Adjust the scales to center the dots in the middle of the plot.
3. Create a “Life” gate around the respective cell population, as depicted in Figure 10.
4. Copy the analysis to the group to apply the same gate to all tubes. Verify that the gate is appropriate for all tubes and adjust if necessary. Apply all changes to the entire dataset.
5. For appropriate GFP gating, double-click on the “Life” group of GFP-negative control cells to create a dot plot of the “Life” population only. Verify axis labels (x = FSC-H; y = FL5A-FITC-A).
6. Create a gate above the entire population of control cells to set a cutoff for GFP tumor cells used in the assay.
7. Copy the analysis to the group for all samples to quantify the number of migrated GFP+ tumor cells in “UP” and “LOW” populations, with cell populations above the threshold clearly indicated in the dot plot, as shown in Figure 10.
8. In the menu, identify the absolute numbers of cells in the table and save them as an Excel sheet. Save dot plots via the layout editor.
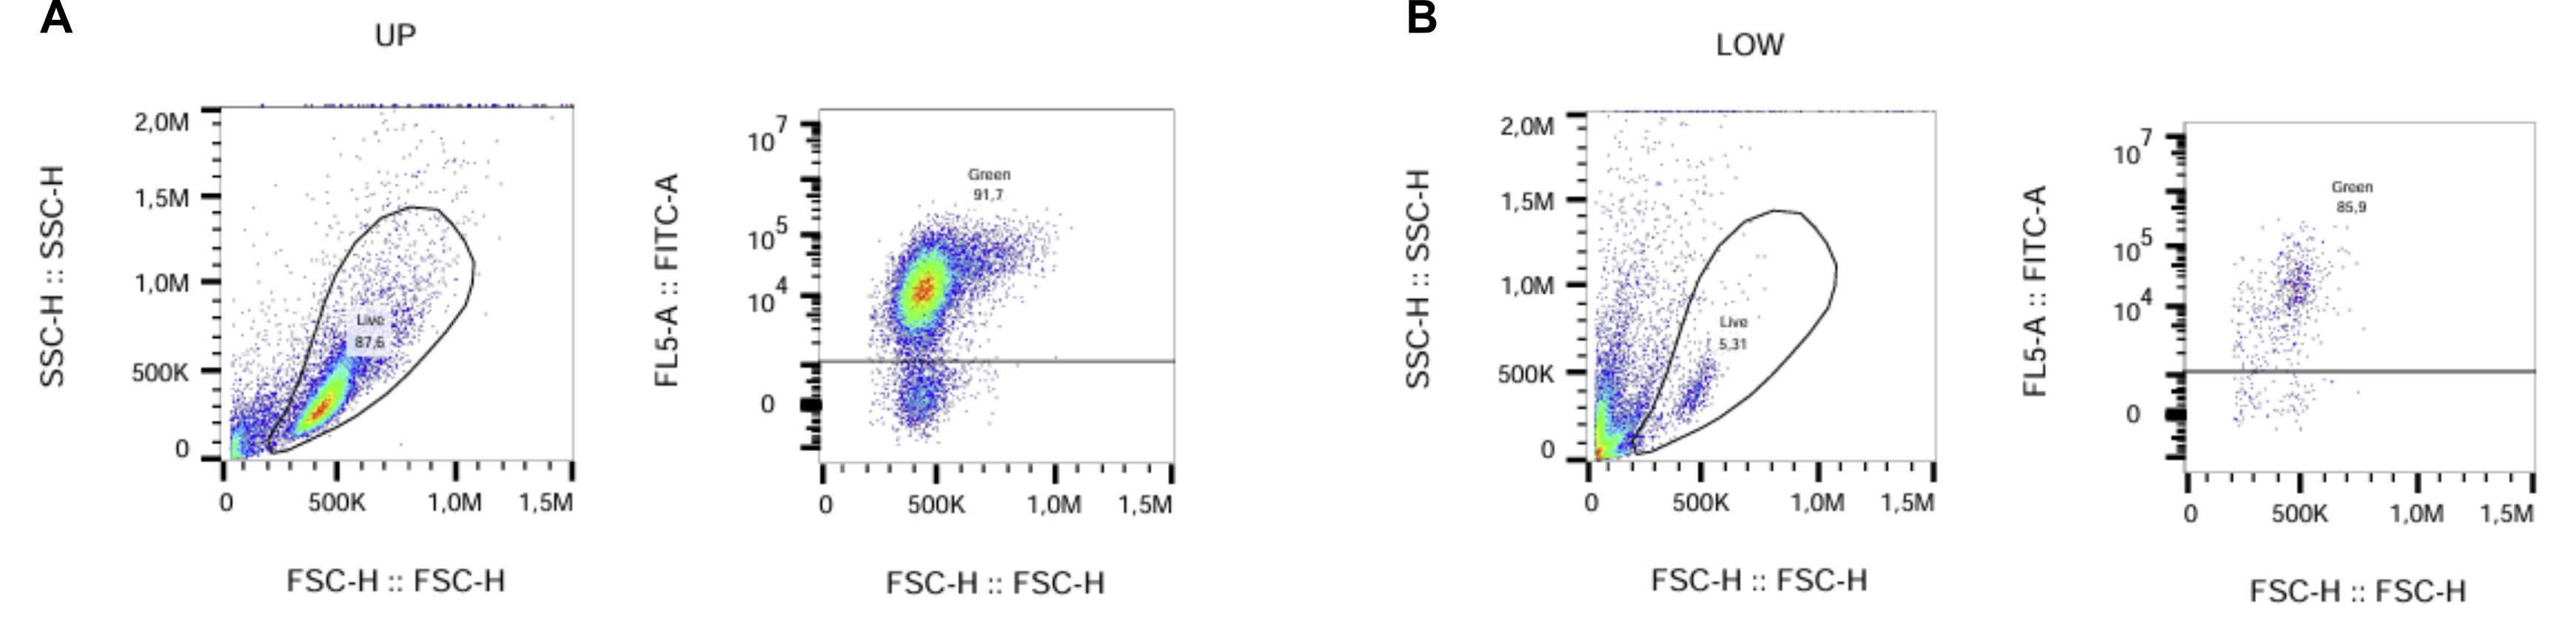
Figure 10. Exemplary gating strategy in flow cytometry analysis using FlowJo for “Life” and “GFP” subpopulations of MCF7-TR GFP samples from the pore size experiment (see Section B). (A) Gating for the “UP” population of non-migrated cells. (B) Gating for the “LOW” population of cells that have crossed the endothelial barrier and the semipermeable membrane (1 μm diameter).
Fiji: Guide for analysis of migration duration evaluation (see Section C)
1. Open the microscopy file and use the wand (tracing) tool to examine the average size of particles (cells).
2. Use a circle to define the region of interest (ROI) that includes the insert bottom, leaving minimal space to the insert wall.
3. Clear the outside and adjust the image to 8-bit.
4. Apply an auto-local threshold and test all options to determine the most suitable threshold.
5. Duplicate the original image and apply the selected threshold.
6. Analyze particles using the previously determined particle size and infinity as limits.
7. Summarize the displayed results and record status to enable copying of the results into an Excel sheet for further processing via GraphPad Prism.
8. Use the same ROI for all images to ensure consistency.
Fiji: Guide for analysis of FBS concentration experiment (see Section F) and assessment of coating layers (see Sections I and J)
1. Open the microscopy file, view the stack with hyperstack, and split channels.
2. DAPI images serve as controls for cell localization but are not required for primary analysis. Proceed with Phalloidin images only.
3. Adjust brightness using auto-adjustment and apply to all images.
4. Repeat the steps for all 10 images per replicate.
5. Create a stack of images and duplicate it.
6. Add a threshold to the duplicated stack and use the original stack to adjust the threshold until it precisely covers the stained cells for all images in the stack.
7. Analyze the area fraction using the ROI manager, marking the entire image as the area of interest.
8. Use multi-measure to analyze all slices of the stack with one row per slice.
9. Copy the results into an Excel sheet and save the images as TIFF files. The results can be further processed via GraphPad Prism.
General notes and troubleshooting
General notes
1. Always use prewarmed medium to prevent exposing cells to temperature-induced stress.
2. To trypsinize cells in T25 flasks for use in experiments:
a. Aspirate media, wash with 5 mL of DPBS, and aspirate.
b. Add 1 mL of trypsin and incubate for 5 min at 37 °C.
c. Add 4 mL of cultivation medium and wash the entire flask bottom.
d. Resuspend to ensure a single-cell solution before splitting 1:5 and using the remaining 4 mL of cell solution. For cells in T75 flasks, use double the volume of DPBS, trypsin, and medium.
3. To count the appropriate number of cells needed for experiments:
a. Split cells 1:5 and transfer the remaining 4 mL of cell suspension from a T25 flask or 8 mL from a T75 flask to a conical tube.
b. For counting with a Neubauer chamber: Gently mix the cell suspension and add 10 μL to each side of the counting chamber, topped with a coverslip. Count only bright cells within the four quadrants.
c. For counting with an automated cell counter (e.g., Denovix Celldrop), gently mix the cell suspension before adding 50 μL to a 0.5 mL Eppendorf tube; then use 10 μL of this cell suspension to fill the counting chamber of the device; repeat measurement three times.
4. While working with Transwell systems (commonly referred to as Boyden chamber assays), the lower chamber is referred to as the "well" and the upper chamber as the "insert," as illustrated in Figure 11. When exchanging solutions, always aspirate from the well first, then from the insert. Follow the same order when adding culture medium or any other solution. This sequential approach minimizes shear stress and prevents disruption of the cell monolayer. When aspirating, hold the insert by its frame above the well to stabilize the insert and allow unobstructed access to the well, enabling efficient and precise pipetting.
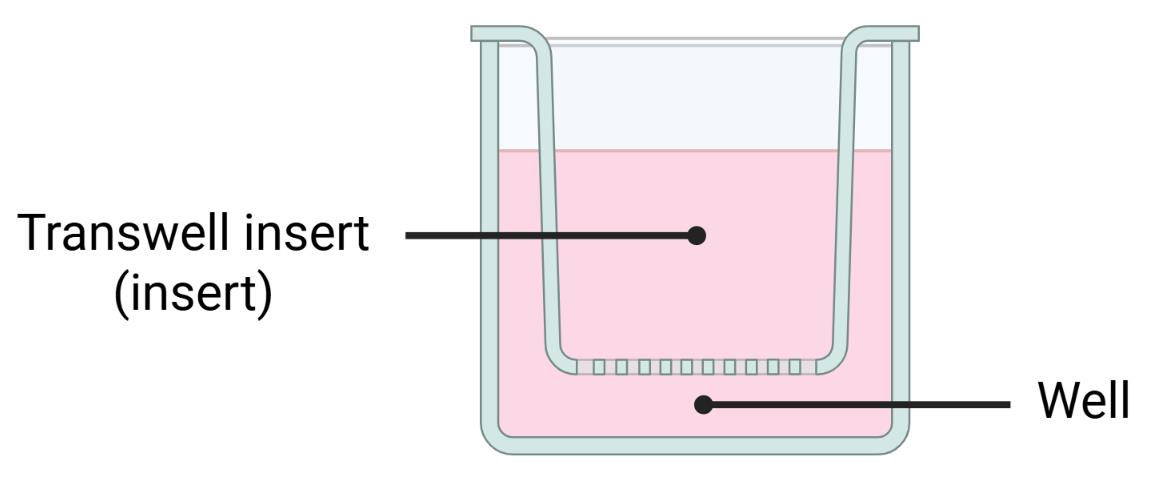
Figure 11. Schematic representation of a Transwell system. Created in BioRender [18].
5. When using inserts:
a. In 6-well plates, generally add 3 mL of volume to wells and 2 mL to inserts.
b. In 24-well plates, generally use 1 mL of volume in wells and 400 μL in inserts for cell culture experiments.
Note: The volumes may differ when trypsinizing or staining, as specified in the corresponding protocols.
6. Prolonged membrane equilibration is acceptable and does not affect the results.
7. When working with HUVECs:
a. Always use pooled cells from at least three different donors for the most reproducible results.
b. For pooling, trypsinize and harvest HUVECs from at least three different biological samples. Collect all cells in the same 50 mL conical tube, centrifuge at 300× g for 5 min, and resuspend the pellet in 10 mL of Endopan 3 medium for experiments or continued cultivation.
c. HUVECs are generally cultured in T75 flasks and should not be used beyond passage 5 [8].
d. For trypsinization, use trypsin 0.05% EDTA. If cells fail to detach adequately, switch to trypsin 0.25% EDTA.
8. Between each TEER measurement:
a. Wash the electrodes in ethanol (70%) first and then in DPBS. Allow the drops to rinse down the electrodes before continuing with measurements.
b. Perform each TEER measurement three times per well and calculate the mean of the three measurements.
c. Normalize by subtracting the mean of values measured in control wells without cells before calculating the difference between these TEER values and values measured on day 0 for each day X: Difference in TEER (ΔTEER) = normalized_TEER_day_X − normalized_TEER_day_0.
d. For coated 6-well inserts, a minimum of ΔTEER ≥ 40 Ω on day 10 post-seeding HUVECs marks successful barrier formation. For valid assay performance, only use inserts exceeding this cutoff and exclude those below. For improved reliability, consider a minimum of ≥45 Ω. Variability between replicates is expected. As an example, one experiment of transendothelial migration of MCF7 and MCF7-TR cells through 5 and 8 μm pores resulted in ΔTEER values ranging from 44.7 to 62.3 Ω.
Critical: Do not touch the insert bottom with any of the electrodes to avoid harming the endothelial barrier. Maintain consistent electrode positioning by aligning the electrodes vertically, without tilt, and allowing contact between the longer electrode and the bottom of the well to ensure steady position during measurements, as illustrated in Figure 12.
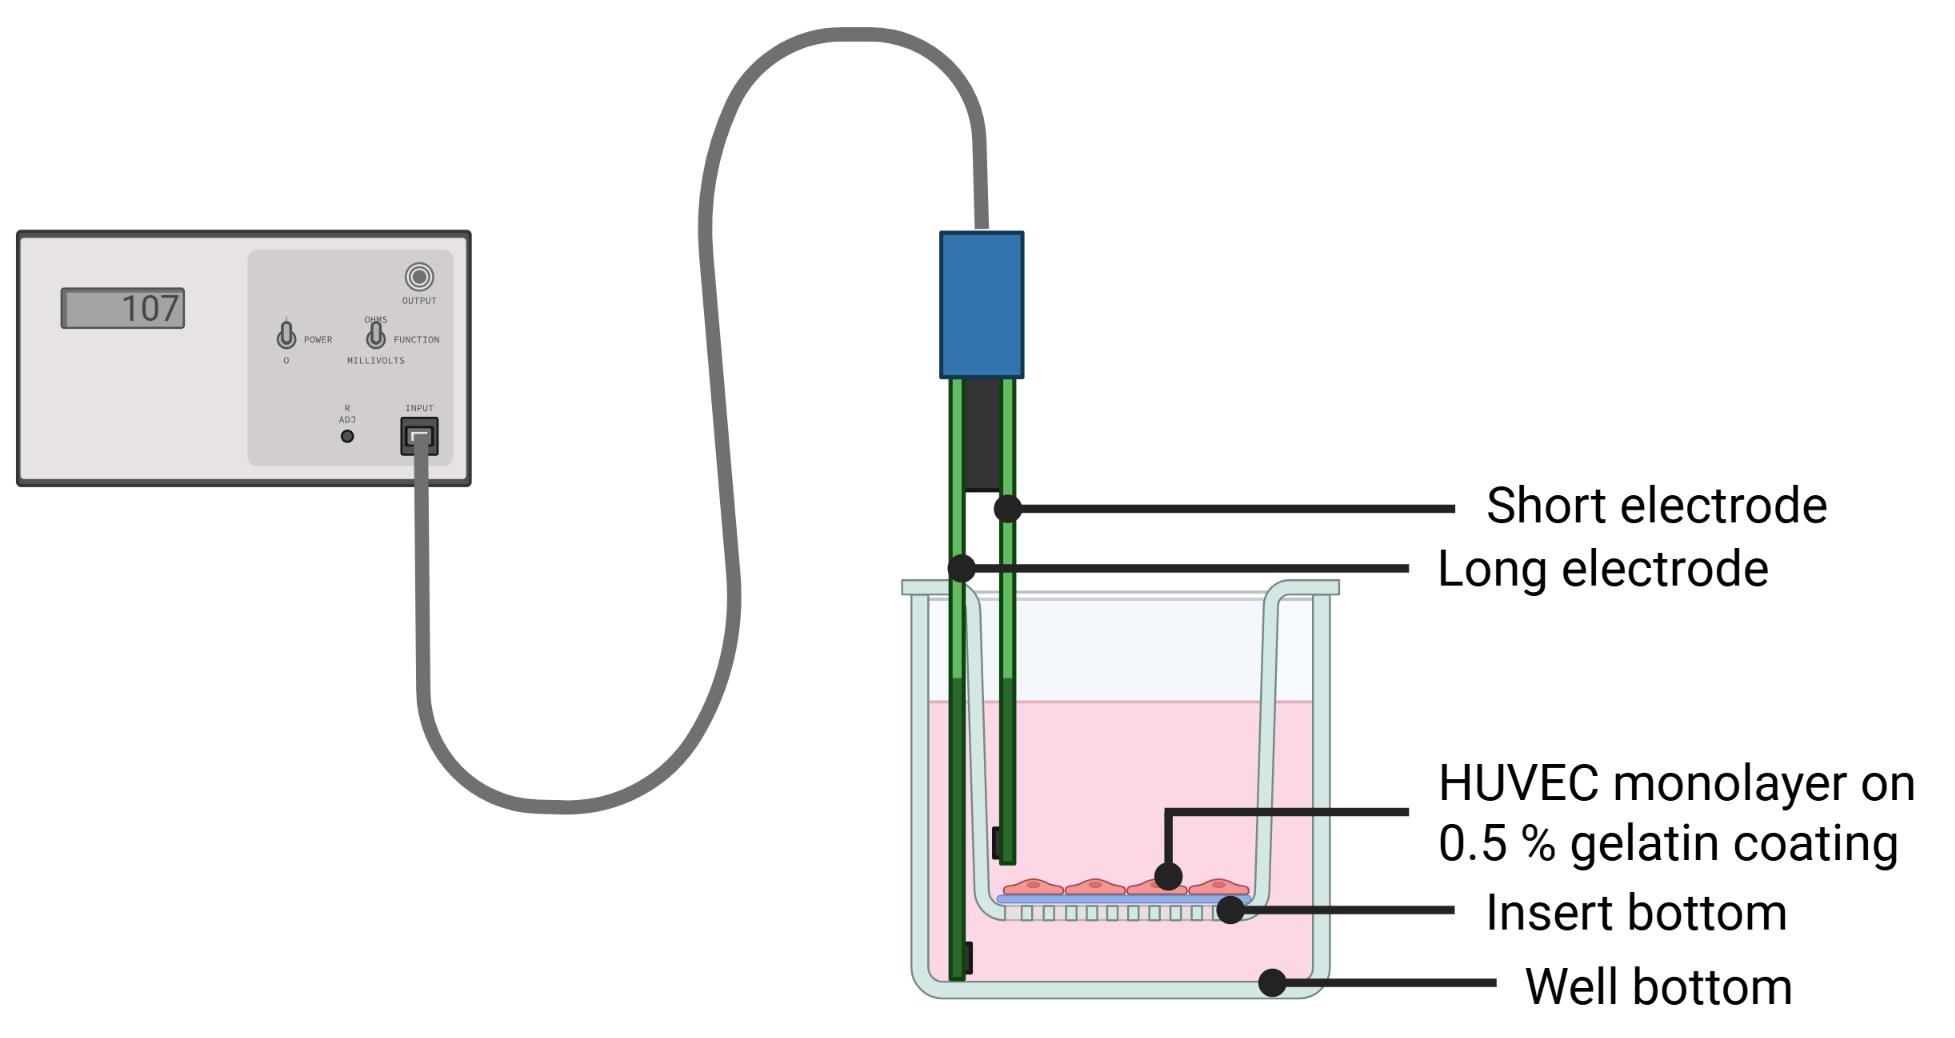
Figure 12. Schematic setup for transendothelial electrical resistance (TEER) measurements during endothelial barrier formation. Created in BioRender [19].
9. Compared to standard protocols, the sorting of GFP+ cells eliminates the need for additional staining of cells, thereby minimizing labeling-induced cell death. However, the required dissociation step with highly concentrated trypsin (0.25% EDTA) may reduce cell viability. Accordingly, expected viability values are consistent with those reported in the literature for similar experiments [20,21].
10. Fluorescence imaging settings were optimized for each experiment to maximize signal dynamic range while avoiding pixel saturation.
Critical: Capture images with constant settings for all samples of one individual experiment to ensure consistent and comparable results.
Troubleshooting
Problem 1: TEER measurement values show daily variations.
Possible cause: The TEER measuring electrode is exposed to external influences, even when not in use.
Solution: Calibrate the electrode in ethanol (70%) for 15 min before washing in DPBS and starting the first measurement. It may be necessary to recalibrate between measurements.
Problem 2: Microscopy images of some inserts show a partially damaged HUVEC layer at the edge of the insert.
Possible cause: The design of the TEER electrode may cause cells on the insert bottom to be scraped off during measurement.
Solution: Place the longer electrode on the bottom of the well without applying any pressure to ensure equal conditions for each measurement. Keep the electrode at one spot without moving the measurement device and avoid contact between the electrodes and the cell monolayer on the insert bottom.
Problem 3: During media exchange from low-serum medium to high-serum medium, the medium quickly passes through the insert membrane.
Possible cause: At higher pore sizes, the medium does not stay in the inserts.
Solution: Perform the medium exchange quickly and refill the medium if leaks occur.
Problem 4: Low yield of migrated cells in the assay.
Possible causes:
• Low GFP expression in tumor cells.
• Insufficient chemotactic gradient.
• Excessive cell death during dissociation.
• Low migratory potential of tumor cells.
Solutions:
• Prior to initiating the assay, assess cell GFP expression in GFP+ tumor cells by flow cytometry and proceed only if GFP expression levels are above 90%.
• Evaluate tumor cell viability before seeding for the assay.
• Determine the optimal migration duration for the cell line used and adjust the timing of harvesting accordingly.
• Increase the number of inserts per replicate.
• If the established migration period exceeds four days, refresh the medium on day 3 to re-establish the chemotactic gradient.
• On the day of harvesting, detach all migrated cells (“LOW”) first and recover them in cultivation media before collecting remaining cells with DPBS.
• To minimize trypsin digestion time, perform harvesting in parallel across multiple plates.
• Proceed with FACS as soon as all cells of one replicate are collected, before harvesting cells of the next replicate.
• Consider increasing the FBS concentration in the medium used to collect sorted cells after FACS.
• Examine the effect of co-cultivating MG-63 osteosarcoma cells as attractants.
• Evaluate the effect of cultivating tumor cells in low-serum medium (0.5% FBS) for 24 h prior to seeding for your chosen tumor cell line.
Problem 5: Ineffective FACS procedure.
Possible causes:
• Cell clumping.
• Nozzle clogging.
• Poor separation between GFP+ and GFP- cells.
Solutions:
• Increase the DNAse I concentration and incubate again for 10 min at 37 °C.
• Provide additional FACS buffer to dilute samples with high cell numbers.
• If uncertainty arises regarding the appropriateness of gating parameters, re-analyze the previously collected “UP” cells by flow cytometry and determine the proportion of GFP+ cells among the population.
Acknowledgments
We gratefully acknowledge the support of Novartis Pharma GmbH for funding this work.
We also thank the members of the Clinical Chemistry Department of UMG Göttingen for providing HUVECs, especially Nadine Winkler and Fatameh Hosami. Additionally, we thank the Trauma Surgery Department, especially Kai Böcker, for providing MG-63 cells. We extend our gratitude to Kendra Klatt for her cell sorting services, AG Schneider for providing flow cytometry instruments, and Dinah Größer for her competent technical assistance.
Author contributions
Conceptualization: L.S., A.R., A.K., F.W., J.G. Investigation: L.S., A.R., A.K., F.W. Writing—Original Draft: L.S., A.R., A.K., F.W. Writing—Review & Editing: F.W., J.G., M.H., A.F., R.A. Funding Acquisition: F.W., J.G. Supervision: F.W. All authors reviewed and approved the final version of the manuscript.
Competing interests
The authors declare no competing interests.
Ethical considerations
For HUVEC isolation from umbilical veins, the ethics committee approved the proposal 28/1/23, and informed consent was obtained from all umbilical cord donors.
References
- Pantelaiou Prokaki, G. (2026). Workflow for the transendothelial migration assay designed to identify and isolate tumor cells subpopulations based on their invasive capacity. Internet source. Retrieved from https://BioRender.com/uehjsea
- Kim, J., Harper, A., McCormack, V., Sung, H., Houssami, N., Morgan, E., Mutebi, M., Garvey, G., Soerjomataram, I., Fidler-Benaoudia, M. M., et al. (2025). Global patterns and trends in breast cancer incidence and mortality across 185 countries. Nat Med. 31(4): 1154–1162. https://doi.org/10.1038/s41591-025-03502-3
- Nicolini, A. and Ferrari, P. (2024). Targeted Therapies and Drug Resistance in Advanced Breast Cancer, Alternative Strategies and the Way beyond. Cancers. 16(2): 466. https://doi.org/10.3390/cancers16020466
- Hanker, A. B., Sudhan, D. R. and Arteaga, C. L. (2020). Overcoming Endocrine Resistance in Breast Cancer. Cancer Cell. 37(4): 496–513. https://doi.org/10.1016/j.ccell.2020.03.009
- Hilfenhaus, G., Mompeón, A., Freshman, J., Prajapati, D. P., Hernandez, G., Freitas, V. M., Ma, F., Langenbacher, A. D., Mirkov, S., Song, D., et al. (2021). A High-Content Screen Identifies Drugs That Restrict Tumor Cell Extravasation across the Endothelial Barrier. Cancer Res. 81(3): 619–633. https://doi.org/10.1158/0008-5472.can-19-3911
- Valastyan, S. and Weinberg, R. A. (2011). Tumor Metastasis: Molecular Insights and Evolving Paradigms. Cell. 147(2): 275–292. https://doi.org/10.1016/j.cell.2011.09.024
- Günthert, A. R., Gründker, C., Olota, A., Läsche, J., Eicke, N. and Emons, G. (2005). Analogs of GnRH-I and GnRH-II inhibit epidermal growth factor-induced signal transduction and resensitize resistant human breast cancer cells to 4OH-tamoxifen. Eur J Endocrinol. 153(4): 613–625. https://doi.org/10.1530/eje.1.01996
- Willer, N. A., Koperski, A., Andag, R., Fischer, A., Hasanov, M. F., Wegwitz, F. and Gallwas, J. (2026). HUVEC Isolation—A Robust Protocol to Obtain Human Umbilical Vein Endothelial Cells From Fresh Preparations. Bio Protoc 16(22): e5877. https://doi.org/10.21769/BioProtoc.5877
- Kramer, N., Walzl, A., Unger, C., Rosner, M., Krupitza, G., Hengstschläger, M. and Dolznig, H. (2013). In vitro cell migration and invasion assays. Mutat Res Rev Mutat Res. 752(1): 10–24. https://doi.org/10.1016/j.mrrev.2012.08.001
- Kanber, M., Umerah, O., Brindley, S., Zhang, X., Brown, J. M., Reynolds, L. and Beltran-Huarac, J. (2023). Magneto-Mechanical Actuation Induces Endothelial Permeability. ACS Biomater Sci Eng. 9(12): 6902–6914. https://doi.org/10.1021/acsbiomaterials.3c01571
- Lander, H. M., Grant, A. M., Peters, C. J., Hill, T. and Albrecht, T. (2014). Endothelial Cell Permeability and Adherens Junction Disruption Induced by Junín Virus Infection. Am J Trop Med Hyg. 90(6): 993–1002. https://doi.org/10.4269/ajtmh.13-0382
- Jansari, S., Blandau, A., Prokakis, E., Grimm, D., Naßl, A. M., Küffer, S., Möbius, W., Dullin, C., Ramos-Gomes, F., Schüürhuis, L., et al. (2025). RNF20/RNF40 supports the aggressive behavior in cervical cancer by regulating a peroxisome-based anti-ferroptotic mechanism. Cell Commun Signaling. 23(1): 304. https://doi.org/10.1186/s12964-025-02279-9
- Vandekeere, S., Dubois, C., Kalucka, J., Sullivan, M. R., García-Caballero, M., Goveia, J., Chen, R., Diehl, F. F., Bar-Lev, L., Souffreau, J., et al. (2018). Serine Synthesis via PHGDH Is Essential for Heme Production in Endothelial Cells. Cell Metab. 28(4): 573–587.e13. https://doi.org/10.1016/j.cmet.2018.06.009
- Bala, K., Ambwani, K. and Gohil, N. K. (2011). Effect of different mitogens and serum concentration on HUVEC morphology and characteristics: Implication on use of higher passage cells. Tissue Cell. 43(4): 216–222. https://doi.org/10.1016/j.tice.2011.03.004
- Relou, I. A., Damen, C. A., van der Schaft, D. W., Groenewegen, G. and Griffioen, A. W. (1998). Effect of culture conditions on endothelial cell growth and responsiveness. Tissue Cell. 30(5): 525–530. https://doi.org/10.1016/s0040-8166(98)80032-3
- Pietrovito, L., Leo, A., Gori, V., Lulli, M., Parri, M., Becherucci, V., Piccini, L., Bambi, F., Taddei, M. L., Chiarugi, P., et al. (2018). Bone marrow‐derived mesenchymal stem cells promote invasiveness and transendothelial migration of osteosarcoma cells via a mesenchymal to amoeboid transition. Mol Oncol. 12(5): 659–676. https://doi.org/10.1002/1878-0261.12189
- Jiménez, N., Krouwer, V. J. D. and Post, J. A. (2012). A new, rapid and reproducible method to obtain high quality endothelium in vitro. Cytotechnology. 65(1): 1–14. https://doi.org/10.1007/s10616-012-9459-9
- Pantelaiou Prokaki, G. (2026). Schematic representation of a Transwell system. Internet source. Retrieved from https://BioRender.com/2ul6xve
- Pantelaiou Prokaki, G. (2026). Schemativ setup of TEER measurements during endothelial barrier formation. Internet source. Retrieved from https://BioRender.com/4ufbkvc
- Sutermaster, B. A. and Darling, E. M. (2019). Considerations for high-yield, high-throughput cell enrichment: fluorescence versus magnetic sorting. Sci Rep. 9(1): 227. https://doi.org/10.1038/s41598-018-36698-1
- Kummrow, A., Frankowski, M., Bock, N., Werner, C., Dziekan, T. and Neukammer, J. (2012). Quantitative assessment of cell viability based on flow cytometry and microscopy. Cytometry Part A. 83A(2): 197–204. https://doi.org/10.1002/cyto.a.22213
Article Information
Publication history
Received: May 25, 2026
Accepted: Aug 10, 2026
Available online: Nov 18, 2026
Published: Nov 20, 2026
Copyright
© 2026 The Author(s); This is an open access article under the CC BY license (https://creativecommons.org/licenses/by/4.0/).
How to cite
Koperski, A., Rieß, A. L., Schüürhuis, L., Andag, R., Fischer, A., Hasanov, M. F., Gallwas, J. and Wegwitz, F. (2026). Modeling Tumor Cell Transendothelial Migration In Vitro: A Functional Assay for Metastatic Potential. Bio-protocol 16(22): e5895. DOI: 10.21769/BioProtoc.5895.

 Download Citation in RIS Format
Category
Cancer Biology > Invasion & metastasis > Cell biology assays > Cell invasion
Cell Biology > Cell movement > Cell migration
Do you have any questions about this protocol?
Post your question to gather feedback from the community. We will also invite the authors of this article to respond.
 Post a Question


