


- Protocols

- Articles and Issues
- For Authors
- About
- Become a Reviewer


Flow Cytometry Assessment of T-Cell Exhaustion Markers and Cytokine Production in Cryopreserved Mouse Splenocytes

Published: Vol 16, Iss 23, Dec 5, 2026 DOI: 10.21769/BioProtoc.5894 Views: 18
Reviewed by: Luis Alberto Sánchez VargasHepzibah Bacilio OcampoArundhati Mehta
 PDF
 Ask a question


Protocol Collections
Comprehensive collections of detailed, peer-reviewed protocols focusing on specific topics



Related protocols

Abstract
Aging is associated with accumulating dysfunctional T cells, characterized by altered marker expression detectable by flow cytometry. However, since no individual marker reflects age-related processes specifically, assessing a combined set of markers is critical, yet often impractical on fresh cells when multiple panels or samples are involved. Here, we present a detailed protocol to comprehensively evaluate exhaustion markers and cytokine expression using cryopreserved mouse splenocytes and multi-parameter flow cytometry. The approach is validated by comparing cells isolated from young and aged mice.
Key features
• Protocol for cryopreservation, thawing, stimulation, and flow cytometry processing of mouse splenocytes.
• Cryopreservation enables separation of splenocyte isolation and staining into distinct procedures, enhancing experimental flexibility and scheduling.
• Multi-marker flow cytometry panels for parallel assessment of T-cell exhaustion markers and cytokines.
• Protocol validation in a relevant biological context (young and aged mice).
Keywords: Flow cytometry T-cell exhaustion
Immune suppression
Cytokines
Cryopreserved splenocytes
Graphical overview
Background
Aging is associated with gradual T-cell compositional and functional changes that may reflect altered activation and differentiation programs and effector competence. With aging, naïve T-cell frequency typically decreases, whereas differentiated effector memory and immunosuppressive regulatory FOXP3+ T cells increase [1]. Phenotypically, age-associated dysregulated T cells show increased expression of markers associated with immune exhaustion, senescence, or suppression. T-cell exhaustion and senescence-associated markers include inhibitory checkpoint molecules such as programmed cell death protein 1 (PD-1), cytotoxic T-lymphocyte antigen 4 (CTLA-4), T-cell immunoreceptor with Ig and ITIM domains (TIGIT), lymphocyte-activation gene 3 (LAG-3), and killer cell lectin-like receptor subfamily G member 1 (KLRG1); and transcription factors such as eomesodermin (EOMES) and thymocyte selection-associated high mobility group box (TOX) [2,3]. In addition, age-associated dysregulated T cells may increase production of effector cytokines [3].
However, none of the above markers is specific to age-associated T-cell dysregulation, as they can also be expressed in other states, such as during immune cell development, immune activation, or immune regulation. Furthermore, although T-cell exhaustion has been more extensively investigated in CD8+ T cells, increasing evidence suggests that CD4+ T cells may undergo a similar fate with age [4]. For these reasons, it is important to evaluate the expression of multiple markers simultaneously in well-defined experimental settings.
Flow cytometry can be used to quantify the expression of many of the molecules associated with T-cell dysregulation. This may be achieved through adapted antibody panels, for example targeting key surface markers or intracellular targets such as transcription factors and cytokines upon ex vivo stimulation. However, because different markers often require distinct strategies to process and stain samples, including fixation/permeabilization and stimulation conditions, their simultaneous assessment through multiple panels may be challenging in fresh cells, increasing the risk of technical variability. Cryopreservation of immune cells is an essential technique that allows for long-term storage of biological samples for subsequent analysis. While fresh samples are typically preferred for functional assays, cryopreserved specimens offer several key advantages, including the batch processing of samples collected at different points and the possibility to share samples with collaborators at different sites.
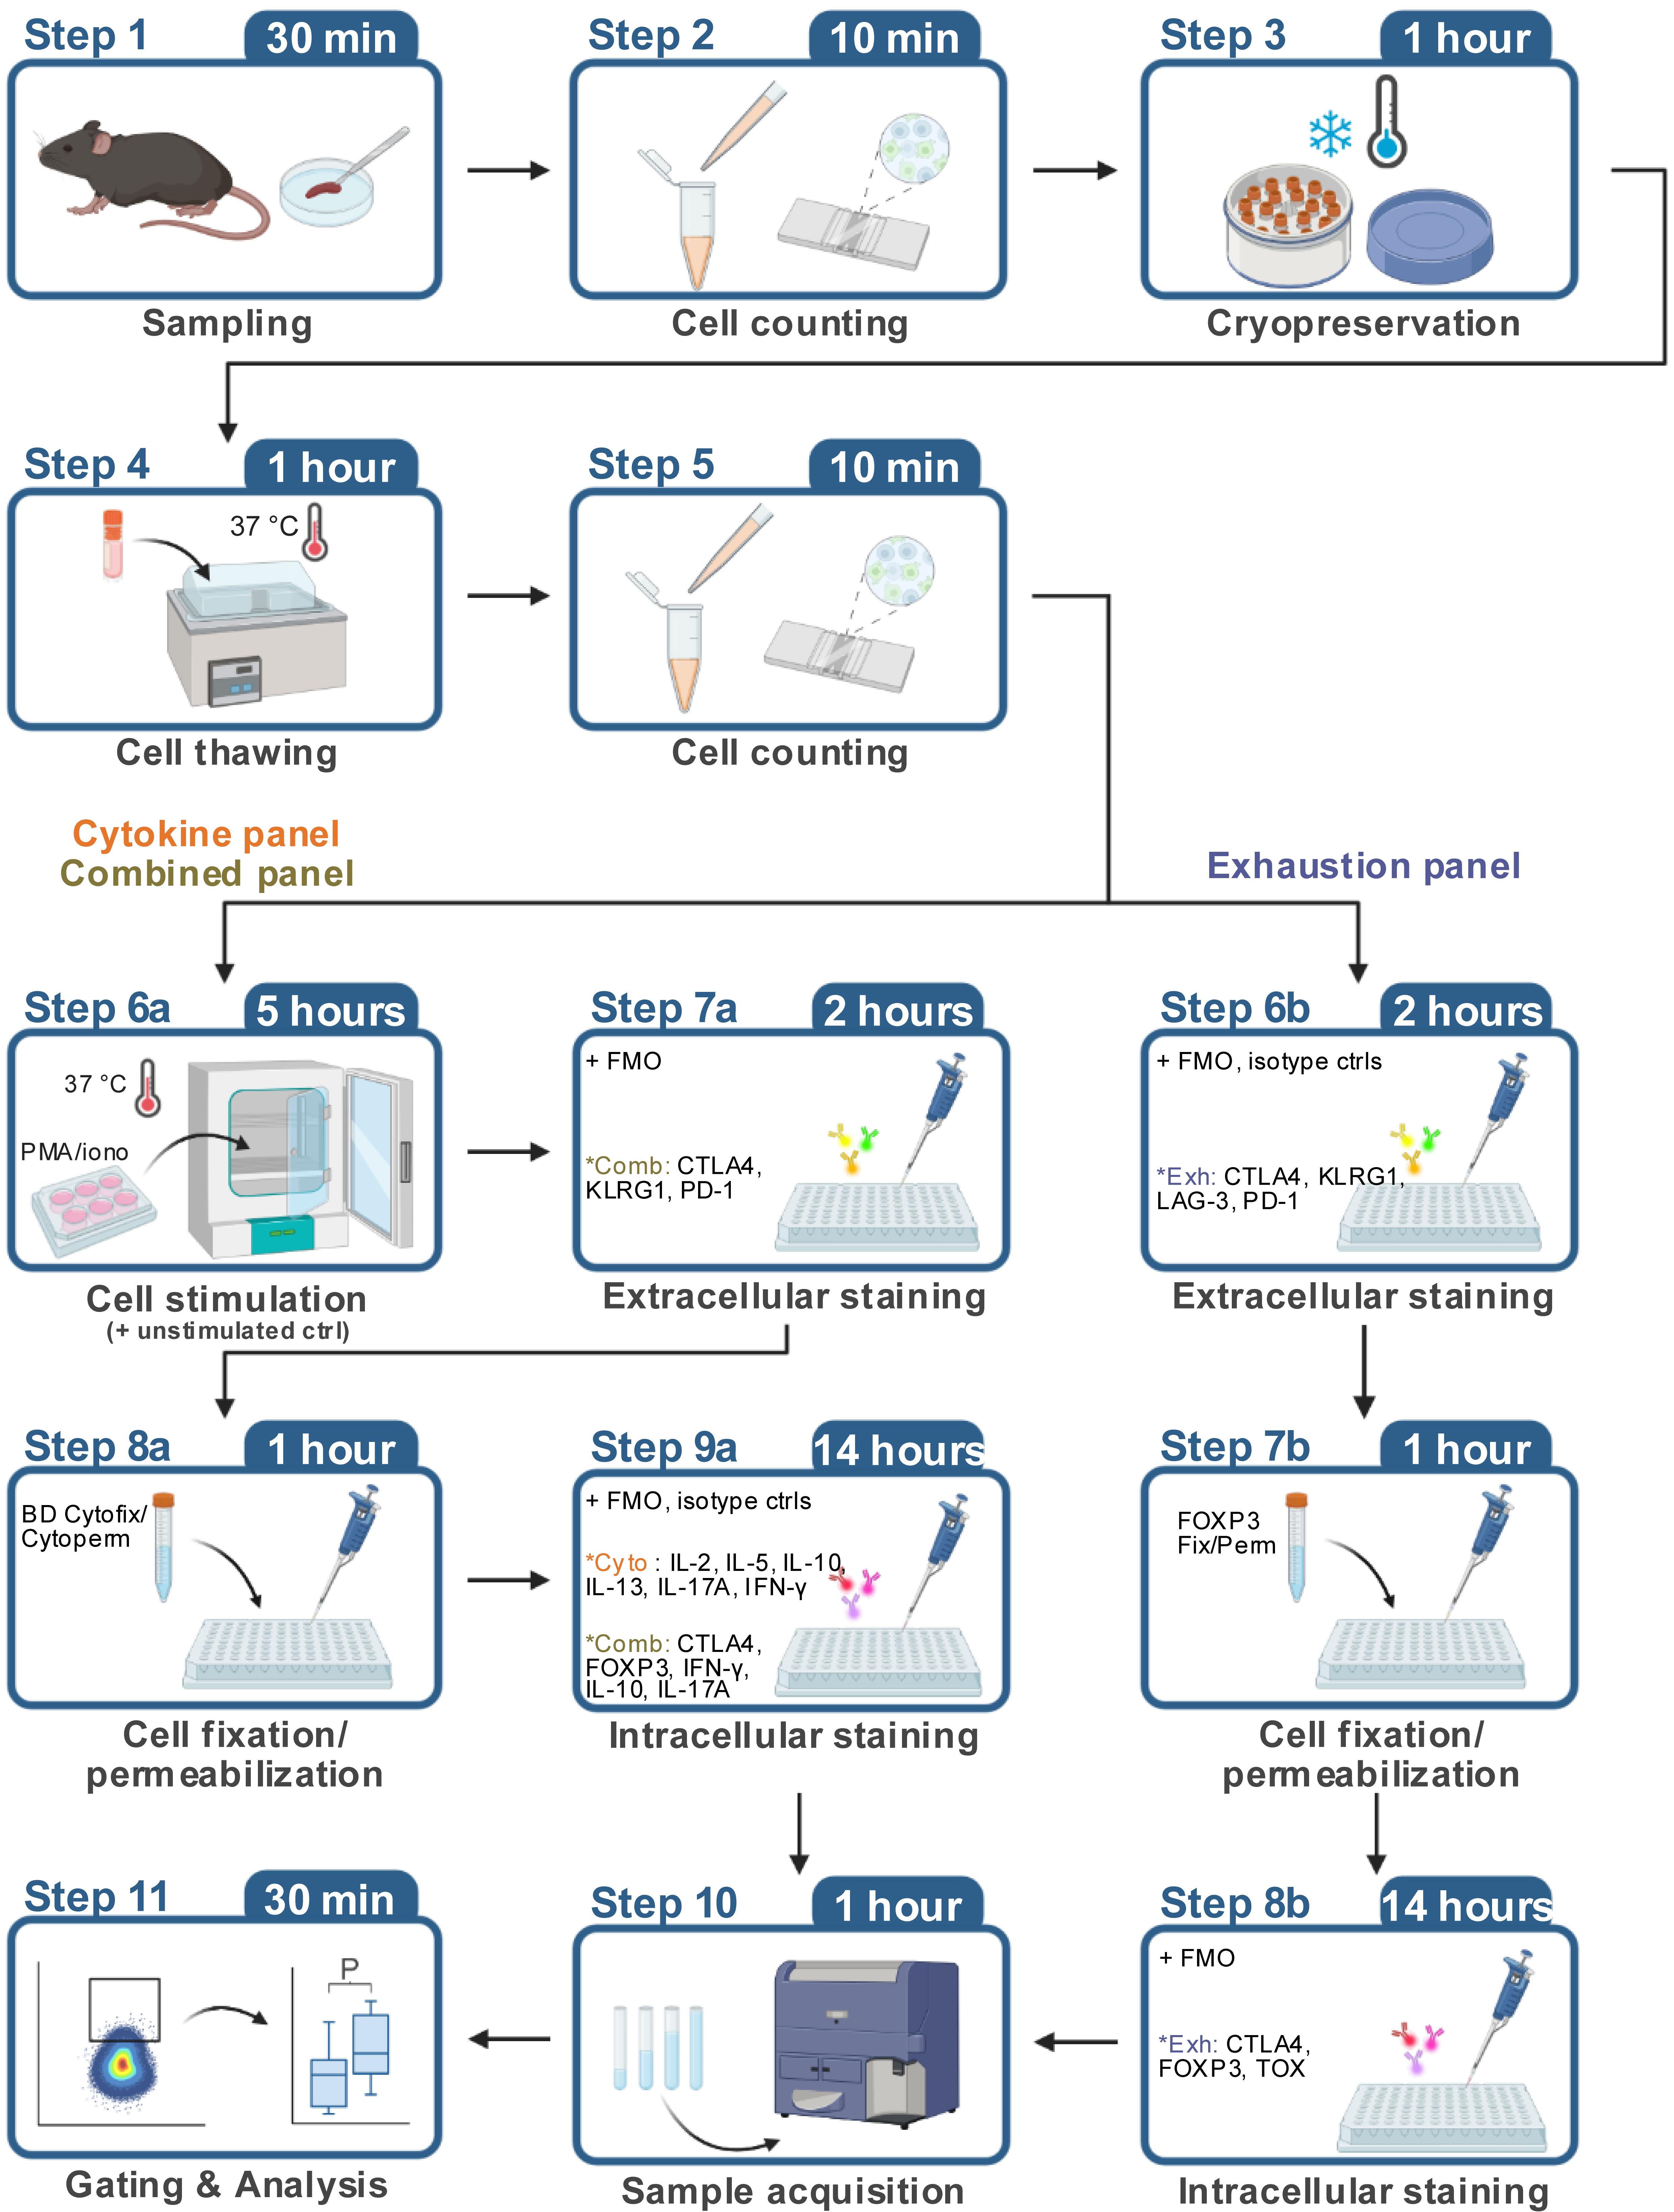
Here, we present an optimized protocol based on established procedures for immune cell preservation and flow cytometric analysis. The protocol includes a detailed description of the key steps for freezing, thawing, and subsequent flow cytometric analysis of mouse splenocytes, which provide a rich source of T cells. Using three distinct antibody panels (“exhaustion”, “cytokine”, and “combined”) on individual aliquots from the same animals, our protocol enables comprehensive phenotyping encompassing the assessment of inhibitory immune checkpoints (CTLA4, KLRG1, LAG-3, PD-1), transcription factors (FOXP3, TOX), and effector cytokines (IFN-γ, IL-2, IL-5, IL-10, IL-13, IL-17). The “exhaustion” panel is applied to thawed cells without a subsequent stimulation step, whereas the “cytokine” and “combined” panels require stimulation after thawing. The extracellular staining workflow is identical for the three panels, whereas the “exhaustion” panel uses a different fixation/permeabilization buffer from the “cytokine” and “combined” panels for the intracellular staining step. The overall staining steps are described once in the protocol below. Critically, the protocol recommends the use of controls for antibodies targeting rare populations, including fluorescence-minus-one (FMO) and isotype controls. Finally, our protocol is validated on cryopreserved splenocytes isolated from young (7–8 weeks) and aged (2 years) male C57BL/6J mice. Nonetheless, our protocol provides a versatile workflow that could be adapted to evaluate the same markers in other conditions associated with T-cell dysfunction, such as cancer, systemic inflammation, or metabolic disorders.
For a comprehensive analysis of T-cell activation, Treg functionality, and cytokine production in fresh mouse splenocytes, we recommend referring to the previously published protocol [5].
Materials and reagents
Biological materials
1. C57BL/6JRj mice (Janvier Labs, identifier: RRID: IMSR_RJ: C57BL-6JRJ)
2. C57BL/6JRj mice (aged; Janvier Labs, identifier: RRID: IMSR_RJ: AGED-C57BL-6JRJ)
Reagents
1. 10× PBS (Thermo Fisher Scientific, catalog number: BP399-1)
2. ACK lysis buffer (Gibco, catalog number: A10492-01)
3. Acridine orange/propidium iodide stain (Logos Biosystems, catalog number: F23001)
4. Benzonase (Sigma, catalog number: 70746-4)
5. Bovine serum albumin (BSA) (Sigma, catalog number: A7906)
6. Brefeldin A (Sigma, catalog number: B7651)
7. BV711 Streptavidin (BioLegend, catalog number: 405241)
8. Cytofix/CytopermTM Fixation/Permeabilization kit (BD, catalog number: 554714)
9. Dimethyl sulfoxide (DMSO) (Sigma, catalog number: D2650)
10. Ethanol 70%, filtered denatured (Contec, product code: FBC570DE)
11. Foxp3/Transcription Factor Staining Buffer Set (eBioscience, catalog number: 00-5523-00)
12. Fetal bovine serum (FBS) (Gibco, catalog number: 16140-071)
13. Horizon Brilliant Stain Buffer (BD, catalog number: 566349)
14. Ionomycin (Sigma, catalog number: I0634)
15. Isopropanol (2-propanol) for HPLC 99% (Sigma, catalog number: 34863-1L)
16. Ketamine 1000, 100 mg/mL (Virbac, GTIN: 03597132111010)
17. Live/DeadTM Fixable Blue Dead Cell Stain kit, for UV excitation (Thermo Fisher Scientific, catalog number: L23105)
18. Penicillin-streptomycin (Gibco, catalog number: 15140122)
19. Phorbol 12-myristate 13-acetate (PMA) (Sigma, catalog number: P8139)
20. Physiodose 5 mL (physiological serum) (Laboratoires Gilbert, reference: 3518646266638)
21. RPMI 1640 (Gibco, catalog number: 61870-010)
22. Xylasol 20 mg/mL (Bimeda, catalog number: 04042668304898)
23. Antibodies (Table 1)
Table 1. Antibodies used in the protocol. Antibody dilutions are reported in Table S1.
| Antibodies (clone) | Manufacturer | Catalog number; RRID |
|---|---|---|
| CD16/CD32 (93) | eBioscience | Catalog number: 14-0161-86; RRID:AB_467135 |
| CD19 BV650 (6D5) | BioLegend | Catalog number: 115541; RRID:AB_11204087 |
| CD3 APC-eF780 (17a2) | eBioscience | Catalog number: 47-0032-82; RRID:AB_1272181 |
| CD4 AF700 (RM4-5) | BD Biosciences | Catalog number: 557956; RRID:AB_396956 |
| CD45 PE-CF594 (30-F11) | BD Biosciences | Catalog number: 562420; RRID:AB_11154401 |
| CD8a BV786 (53-6.7) | BD Biosciences | Catalog number: 563332; RRID:AB_2721167 |
| CTLA4 APC (UC10-4B9) | BioLegend | Catalog number: 106310; RRID:AB_2087653 |
| CTLA4 BV605 (UC10-4B9) | BioLegend | Catalog number: 106323; RRID:AB_2566467 |
| EOMES PerCP-eF710 (Dan11mag) | eBioscience | Catalog number: 46-4875-82; RRID:AB_10597455 |
| FOXP3 AF488 (MF-14) | BioLegend | Catalog number: 126406; RRID:AB_1089113 |
| IFN-γ BV711 (XMG1.2) | BioLegend | Catalog number: 505835; RRID:AB_11219588 |
| IL-10 APC (JES5-16E3) | eBioscience | Catalog number: 17-7101-81; RRID:AB_469501 |
| IL-13 PE-Cy7 (eBio13A) | eBioscience | Catalog number: 25-7133-82; RRID:AB_2573530 |
| IL-17A AF488 (TC11-18H10) | BD Biosciences | Catalog number: 560220; RRID:AB_1645194 |
| IL-17A PE (TC11-18H10) | BD Biosciences | Catalog number: 559502; RRID:AB_397256 |
| IL-2 BV605 (JES6-5H4) | BioLegend | Catalog number: 503829; RRID:AB_11204084 |
| IL-4 PE (11B11) | BD Biosciences | Catalog number: 554435; RRID:AB_395391 |
| IL-5 BV421 (TRFK5) | BioLegend | Catalog number: 504311; RRID:AB_2563161 |
| KLRG1 PE-Cy7 (2F1) | BioLegend | Catalog number: 138416; RRID:AB_2561736 |
| LAG-3 Biotin (C9B7W) | BioLegend | Catalog number: 125206; RRID:AB_2133345 |
| Mouse IgG1, κ Isotype Ctrl BV605 (MOPC-21) | BioLegend | Catalog number: 400162; RRID:AB_11125373 |
| PD-1 eF450 (J43) | eBioscience | Catalog number: 48-9985-82; RRID:AB_2574139 |
| Rat IgG1, κ Isotype Ctrl BV421 (RTK2071) | BioLegend | Catalog number: 400429; RRID:AB_10900998 |
| Rat IgG1, κ Isotype Ctrl PE (R3-34) | BD Biosciences | Catalog number: 554685; RRID:AB_395140 |
| Rat IgG1, κ Isotype Ctrl PE-Cy7 (RTK2071) | BioLegend | Catalog number: 400416; RRID:AB_326522 |
| TIGIT BV605 (1G9) | BD Biosciences | Catalog number: 744212; RRID:AB_2742061 |
| TNF-α PerCP-Cy5.5 (MP6-XT22) | BioLegend | Catalog number: 506322; RRID:AB_961434 |
| TOX PE (TXRX10) | eBioscience | Catalog number: 12-6502-82; RRID:AB_10855034 |
Solutions
1. Acridine orange/propidium iodide staining (see Recipes)
2. Antibody cocktail (see Recipes)
3. Anesthesia (see Recipes)
4. BD Perm/Wash solution (see Recipes)
5. Cell culture medium (see Recipes)
6. Cell stimulation medium (see Recipes)
7. Dead-cell suspension (see Recipes)
8. FACS buffer (see Recipes)
9. FOXP3 Fix/Perm solution (see Recipes)
10. FOXP3 Fix/Perm wash buffer (see Recipes)
11. Freezing medium (see Recipes)
Recipes
1. Acridine orange/propidium iodide staining
Mix the cell suspension and acridine orange/propidium iodide stain thoroughly at a 9:1 ratio (18 μL of cell suspension + 2 μL of acridine orange/propidium iodide stain).
2. Antibody cocktail
Prepare the necessary volume of antibody cocktail by diluting the antibodies at the appropriate concentrations (Table S1) in Brilliant Stain Buffer. The antibody cocktail should be prepared fresh and used on the same day.
3. Anesthesia
For each 1 mL of final volume, add 250 μL of ketamine and 50 μL of xylazine and bring to the final volume with physiological serum.
4. BD Perm/Wash solution
Dilute one part of the 10× BD Perm/Wash solution concentrate stock with nine parts of distilled water (dilution 1:10). The 1× BD Perm/Wash solution can be kept at 4 °C until use.
5. Cell culture medium
Prepare complete cell culture medium under sterile conditions by supplementing RPMI 1640 base medium with 10% FBS, 100 μg/mL penicillin, and 100 μg/mL streptomycin.
6. Cell stimulation medium
Prepare cell culture medium supplemented with PMA (50 ng/mL), ionomycin (500 ng/mL), and 1× brefeldin A (10 μg/mL).
7. Dead-cell suspension
Place 1 × 10⁶ spleen cells in an Eppendorf tube and incubate them in a water bath pre-heated to 65 °C for 30 min to kill them. The obtained dead-cell suspension can be used on the same day or prepared in advance and kept at 4 °C for up to 2 weeks.
8. FACS buffer
Prepare FACS buffer under sterile conditions by dissolving 2.5 g of BSA and adding 2 mL of 0.5 M EDTA to 500 mL of PBS to achieve final concentrations of 0.5% BSA and 2 mM EDTA. Mix thoroughly until BSA is completely dissolved and store at 4 °C.
9. FOXP3 Fix/Perm solution
Dilute one part of the 4× FOXP3 Fix/Perm concentrate stock with three parts of the Fix/Perm diluent (dilution 1:4). The 1× FOXP3 Fix/Perm solution can be kept at 4 °C until use.
Notes: Prepare fresh before use. The solution contains formaldehyde, which is toxic and carcinogenic. Wear proper personal protective equipment and dispose of waste appropriately.
10. FOXP3 Fix/Perm wash buffer
Dilute one part of the 10× permeabilization buffer concentrate stock with nine parts of distilled water (dilution 1:10). The 1× FOXP3 Fix/Perm wash buffer can be kept at 4 °C until use.
Note: The 10× permeabilization buffer concentrate stock may precipitate. If precipitate forms, filter after diluting to 1×.
11. Freezing medium
On the day of the experiment, prepare fresh freezing medium under sterile conditions by mixing 90% FBS and 10% DMSO. If prepared in advance, keep the freezing medium at 4 °C and use it the same day.
Laboratory supplies
1. 6-well tissue culture plate, flat bottom (Corning, catalog number: 3516)
2. 96-well cell culture plate, round bottom (Dutscher Dominique SAS, catalog number: 353077)
3. Cell freezing container, Nalgene Mr. Frosty (Sigma, catalog number: 5100-0001)
4. Cell strainers 100 μm (Thermo Fisher Scientific, catalog number: 11517532)
5. Centrifuge tubes 15 mL (Dutscher Dominique SAS, catalog number: 352096)
6. Centrifuge tubes 50 mL (Dutscher Dominique SAS, catalog number: 352070)
7. Clearline 2 mL cryotube (Dutscher Dominique SAS, catalog number: 390708)
8. Falcon 5 mL polystyrene round-bottom tube with cell strainer cap (Dutscher Dominique SAS, catalog number: 352235)
9. Forceps, Dumont AA, standard tips (Fine Science Tools GMBH, catalog number: 11210-10)
10. Forceps, anatomical standard forceps, curved (Fine Science Tools GMBH, catalog number: 11001-12)
11. PhotonSlideTM ultra-low fluorescence cell counting slide (Logos Biosystems, catalog number: L12005)
12. Scissors, hardened fine, straight/sharp (Fine Science Tools GMBH, catalog number: 14090-09)
13. Syringe Plastipak 1 mL (Dutscher Dominique SAS, catalog number: 303172)
Equipment
1. BD LSRFortessa X-20 (BD), cytometer configuration is summarized in Table S2
2. Cell culture CO2 incubator, Heraeus Kendro HeraCell 150 (Thermo Fisher Scientific)
3. Centrifuge 5810/5810R (Eppendorf)
4. Centrifuge Sorvall ST 8R (Thermo Fisher Scientific)
5. LUNA-FLTM Dual Fluorescence Cell Counter (Logos Biosystems)
6. Microbiological safety cabinet BIOAIR Safeflow 1.2 (Bioair)
Software and datasets
1. Adobe Illustrator v30.5.1 (Adobe, identifier: RRID:SCR_010279)
2. BD FACSDiva Software v.9.2 (BD, identifier: RRID:SCR_001456)
3. FlowJo v.10.10.0 (FlowJo LLC, identifier: RRID:SCR_008520)
4. GraphPad Prism 11.0.0 (GraphPad Software, identifier: RRID:SCR_002798)
5. Real Statistics Resource Pack software (Release 9.9, copyright 2013 – 2026, Charles Zaiontz, https://real-statistics.com)
6. All data are in Table S3
Procedure
A. Spleen harvesting
1. Euthanize mice through intraperitoneal anesthetic overdose (ketamine 300 mg/kg, xylazine 30 mg/kg).
2. Place mice in supine position and wet fur with 70% ethanol.
3. Use forceps to hold the skin and scissors to cut through the midline from the sternum to the pelvic region.
4. Carefully incise the peritoneum and expose the viscera to reveal the spleen on the animal’s left side.
5. Carefully remove the spleen and place it in a 1.5 mL tube pre-filled with 1× PBS.
6. Keep spleens on ice until cell processing.
B. Spleen processing
This section details how to prepare single-cell suspensions from mouse spleen for flow cytometric analysis.
Note: The following protocol is suitable for lymphocyte and monocyte analysis. For macrophages and dendritic cells, enzymatic digestion may be required [6]. Keep FACS buffer on ice throughout the entire procedure to preserve cell viability.
1. Place a 100 μm cell strainer in a 50 mL tube and rinse with 2 mL of FACS buffer.
Note: When working with multiple spleen samples, 6-well plates are recommended to reduce overcrowding during experimental procedures and facilitate easier handling.
2. Put the spleen into the cell strainer and mash with a syringe plunger. Rinse the plunger with 1 mL of FACS buffer and wash the strainer with 2 mL of FACS buffer to collect all cells.
3. Transfer the cell suspension into 15 mL tubes. Wash the 50 mL tube with 2 mL of FACS buffer and transfer all contents into the same 15 mL tube.
4. Centrifuge at 400× g for 5 min at 4 °C. Aspirate the supernatant and resuspend the pellet in the residual volume.
5. Add 5 mL of ACK lysis buffer to resuspend the pellet and incubate at room temperature (20–25 °C) for 10 min.
Critical: Do not exceed 10-min incubation time to avoid potential loss of cell viability.
Note: The incubation time may be optimized according to the specific lysis buffer used. First, incubate the cell suspension in ACK lysis buffer for 5 min. If red blood cells are not completely lysed, add FACS buffer and centrifuge the cells to stop the lysis reaction. Then, resuspend the pellet in ACK lysis buffer and incubate for an additional 1–5 min to ensure complete red blood cell lysis.
6. Fill the tubes with FACS buffer to stop the lysis reaction, then centrifuge at 400× g for 5 min at 4 °C.
7. Aspirate the supernatant, leaving approximately 100 μL, and gently resuspend the pellet.
8. Wash the cells with 5 mL of FACS buffer, then centrifuge at 400× g for 5 min at 4 °C.
9. Aspirate the supernatant, leaving approximately 100 μL, and gently resuspend the pellet.
10. Add 10 mL of FACS buffer and perform cell counting using acridine orange staining (9:1 ratio, 18 μL cell suspension + 2 μL acridine orange/propidium iodide stain). After mixing, load the sample onto a cell counting slide and read the cell count immediately.
11. Adjust cell concentration depending on experimental objectives.
12. Choose one of the following options:
a. For immediate flow cytometric analysis, proceed to the cell stimulation (section E) or extracellular staining protocol (section F).
b. For future analysis, continue with the cell cryopreservation procedure (section C).
C. Cell cryopreservation
This section contains the procedure for long-term storage of mouse splenocytes at -80 °C, enabling batch processing and future analysis.
Critical: Freezing medium preparation and cell resuspension in freezing medium prior to storage must be performed within a biosafety cabinet to prevent microbial contamination.
1. Prepare the controlled-rate freezing container by filling with isopropanol up to the designated line marker and pre-chill at 4 °C before starting cell cryopreservation.
2. Transfer the cells and cryotubes to a clean bench.
Note: Pre-label all required cryotubes to ensure efficient workflow during processing.
3. Centrifuge 15 mL tubes at 400× g for 5 min at 4 °C. Aspirate the supernatant, then add freezing medium to achieve a final concentration of 5 × 10⁶–25 × 106 cells/mL.
Note: When using serum-free medium, adjust the concentration to 1 × 10⁶ cells/mL for optimal cell viability recovery post-thaw.
4. Mix the cell suspension very gently using slow pipetting to avoid cell damage, then transfer 1.5-mL aliquots into pre-labeled 2 mL cryotubes.
Critical: Avoid overfilling the cryotubes, as the freezing medium expands during the freezing process and may lead to tube rupture.
5. Work quickly to dispense the cell suspension into cryotubes. Immediately transfer the cryotubes to a pre-chilled (4 °C) controlled-rate freezing container and place the container at -80 °C.
Critical: Rapid execution of this step is critical to ensure consistent freezing conditions across all samples.
Note: Cells may be stored at -80 °C for several months. For the present protocol, cell recovery was validated to remain stable between 5.5 and 8.8 months.
D. Cell thawing
This section details the critical cell thawing procedure that preserves cellular integrity and functionality for subsequent flow cytometry analysis.
Note: When thawing multiple cryotubes, process only a few at a time to ensure proper handling. As the freezing medium contains DMSO, which is cytotoxic, it must be removed promptly following thawing.
1. Prewarm the cell culture medium to 37 °C in a water bath before use.
2. Dilute benzonase to a final concentration of 1:10,000 in prewarmed cell culture medium (add 1 μL of benzonase in 10 mL of cell culture medium).
Note: Addition of benzonase prevents clumping of cryopreserved cells upon thawing and improves cell recovery [7].
3. Transfer cryotubes containing cells to a 37 °C water bath and thaw rapidly until only a small ice crystal remains, then immediately add 1 mL of prepared medium to the cryotubes.
Critical: Rapid thawing is critical to preserve cell viability. Cells should not be left at room temperature at any stage.
Note: To maximize DMSO dilution and prevent cytotoxicity, add cell culture medium in at least 10-fold excess volume during washing procedures following thawing. Maintain final DMSO concentration at 0.5%–1% or below by ensuring a minimum 9:1 ratio of medium to cell suspension volume.
4. Slowly resuspend the cells using gentle pipetting and transfer the suspension from cryotubes to 15-mL centrifuge tubes, then fill the tubes with prepared medium up to 15 mL.
5. Centrifuge at 400× g for 5 min at room temperature and aspirate the supernatant completely.
6. Resuspend cells with cell culture medium and centrifuge at 400× g for 5 min at room temperature, aspirate the supernatant completely, and resuspend the pellet in the residual volume.
7. Add 2 mL of cell culture medium, then check cell number and viability using acridine orange staining (9:1 ratio, 18 μL cell suspension + 2 μL acridine orange/propidium iodide stain). After mixing, load the sample onto a cell counting slide and read the cell count immediately.
Note: Following this cryopreservation and thawing protocol, post-thaw viability should be approximately 75%. Staining data from samples with viability below 40% should be interpreted with caution.
8. Adjust cell concentration according to experimental objectives.
9. Upon completion of thawing, proceed directly to extracellular staining (section F) or cell stimulation for cytokine analysis (section E).
E. Cell stimulation for intracellular cytokine detection
This section explains the process of stimulating splenocytes with PMA/ionomycin and BFA to induce cytokine production for intracellular cytokine staining analysis.
1. Resuspend cells at 4 × 10⁶ cells/mL in prewarmed cell culture medium.
Critical: Prewarm the stimulation medium to 37 °C prior to use to prevent temperature-induced stress on the cells.
2. Prepare a live-cell suspension by combining portions of the available samples. Use this live-cell suspension to prepare the unstimulated negative control to evaluate baseline cytokine production.
3. Prepare a 2× stimulation solution in cell culture medium (PMA 100 ng/mL, ionomycin 1 μg/mL, BFA 20 μg/mL).
Note: PMA and ionomycin synergistically induce robust T-cell activation, while brefeldin A inhibits cytokine secretion, enabling intracellular accumulation for flow cytometric analysis.
4. Add 250 μL of cell suspension (1 × 10⁶ cells) to each well of a 24-well culture plate.
5. Add 250 μL of prepared 2× stimulation solution to each well containing cell suspension and mix gently by pipetting 3–4 times. After adding stimulation solution, final concentrations in each well will be: PMA 50 ng/mL, ionomycin 500 ng/mL, and BFA 10 μg/mL. Add BFA only to the unstained control.
6. Cover the plate with the lid and transfer to a humidified 5% CO2 incubator at 37 °C for 4 h.
Note: This protocol uses a standard cell stimulation time of 4 h. The stimulation time may be optimized or adjusted as required.
7. After 4-h incubation, harvest cells into 15 mL centrifuge tubes and fill with FACS buffer to stop the stimulation process.
8. Centrifuge at 400× g for 5 min at 4 °C, aspirate the supernatant completely, and resuspend the cell pellet in the residual volume.
9. Resuspend cells with 1 mL of PBS, then keep cells on ice and proceed with extracellular staining.
Critical: Maintain cells at 4 °C after stimulation to preserve intracellular cytokine levels and prevent further activation or degradation.
F. Extracellular staining
This section details the extracellular staining procedure for mouse splenocytes, including Live/Dead discrimination, Fc receptor blocking, and surface marker antibody staining to prepare samples for flow cytometric analysis.
Critical: Maintain samples at 4 °C and protect from light throughout the procedure to preserve fluorophore integrity and prevent cellular activation.
Note: Antibody dilutions for each panel are indicated in Table S1. Avoid introducing air bubbles during pipetting, as they can interfere with staining consistency. Protect plates from light exposure during Live/Dead staining and throughout all subsequent steps.
1. Calculate the required cell suspension volume based on sample number. Resuspend cells in ice-cold PBS at appropriate concentration to allow 100 μL distribution per sample in a 96-well U-bottom plate (e.g., use 1 mL of PBS for 10 samples).
2. Prepare a live-cell suspension by combining portions of the available samples. Use this live-cell suspension to prepare the unstained cell control, FMO controls, and isotype controls. If staining stimulated cells (“cytokine” and “combined” panels), include an unstimulated-cell control. If not already prepared, prepare a dead-cell suspension (see Recipes). For Live/Dead compensation, aliquot one live-cell and one dead-cell control into separate wells, with approximately 5 × 10⁵ cells per well.
Critical: FMO and isotype controls facilitate accurate discrimination between positive and negative populations by enabling assessment of fluorescence spillover and nonspecific staining, respectively. We recommend including FMO and isotype controls for gating low-frequency markers as indicated in Table S1.
3. Add 100 μL of ice-cold PBS to each well (total 200 μL/well), centrifuge the plate at 400× g for 5 min at 4 °C, and remove the supernatant by flicking the plate.
4. Prepare Live/Dead stain by diluting LIVE/DEADTM Fixable Blue Dead Cell Stain kit 1:500 in serum-free PBS. Add 50 μL of diluted stain to each well. For Live/Dead compensation, stain live-cell and dead-cell controls separately. Incubate cells on ice for 30 min.
Critical: Use PBS without serum for Live/Dead staining, as serum proteins can interfere with dye labeling.
5. Add 200 μL of FACS buffer to each well and centrifuge at 400× g for 5 min at 4 °C. Remove supernatant by flicking plates. Perform Fc blocking by preparing CD16/CD32 monoclonal antibody at a 1:100 dilution in FACS buffer. Add 50 μL of blocking solution to each well and incubate on ice for 10 min.
Note: This step prevents nonspecific antibody binding by blocking Fc receptors on immune cells, which can cause false-positive signals and interfere with accurate flow cytometric analysis.
6. During the 10-min incubation, prepare single-color compensation controls using compensation beads. Vortex the beads for 30 s before use to ensure proper resuspension. Prepare the required number of compensation control samples in 1.5-mL tubes (15–20 μL beads/color). Distribute the prepared beads to designated wells.
7. Add 200 μL of FACS buffer to each well and centrifuge at 400× g for 5 min at 4 °C. Remove supernatant by flicking plates.
8. Prepare extracellular antibody cocktails in Brilliant Stain Buffer, calculating 50 μL per well based on predetermined optimal dilutions.
Critical: The Brilliant Stain Buffer is designed to complement experiments utilizing panels comprising BD Horizon Brilliant fluorescent polymer dyes.
9. Add 50 μL of antibody cocktail to each well and incubate on ice for 30 min protected from light.
10. Add 200 μL of FACS buffer to each well and centrifuge at 400× g for 5 min at 4 °C. Remove supernatant by flicking plates.
11. Keep cells on ice and proceed with intracellular staining.
G. Intracellular staining
This section details the intracellular staining procedure for detecting exhaustion markers and cytokines in fixed and permeabilized mouse splenocytes, utilizing appropriate fixation/permeabilization reagents to ensure optimal antibody penetration and epitope preservation for flow cytometric analysis.
Critical: Maintain samples at 4 °C and protect from light to preserve fluorophore integrity and to prevent degradation of intracellular epitopes. For the “exhaustion” panel, use FOXP3 Fix/Perm solution. For the “cytokine” and “combined” panels, use Cytofix/Cytoperm solution.
Note: Antibody dilutions for each panel are indicated in Table S1. For the “exhaustion” panel, BV711-conjugated streptavidin (1:200) to detect biotin-conjugated LAG-3 was included in the antibody cocktail for the intracellular staining. Avoid introducing air bubbles during pipetting procedures. Keep plates protected from light exposure throughout the entire protocol. Since a large portion of CTLA4 is retained intracellularly, to ensure complete detection, include the anti-CTLA4 antibody in the intracellular staining panel, as per manufacturer’s instructions (https://www.thermofisher.com/antibody/product/CD152-CTLA-4-Antibody-clone-UC10-4B9-Monoclonal/14-1522-82). Since CD4 is internalized following PMA stimulation [8], include anti-CD4 antibody in the intracellular staining panel.
1. Prepare fixation/permeabilization and permeabilization/washing solutions.
a. For fixation and permeabilization, prepare 1× FOXP3 Fix/Perm solution for the “exhaustion” panel (1:4 dilution; make it fresh before use). For the “cytokine” and “combined” panels, use the BD Cytofix/Cytoperm solution (ready for use).
b. For washes, prepare 1× FOXP3 Perm wash buffer for the “exhaustion” panel (1:10 dilution in distilled water; can be stored at 4 °C), and 1× BD Perm/Wash solution for the “cytokine” and “combined” panels (1:10 dilution in distilled water; can be stored at 4 °C).
Note: The FOXP3 Fix/Perm solution and the BD Cytofix/Cytoperm solution contain formaldehyde, which is toxic and carcinogenic. Wear proper personal protective equipment and dispose of waste appropriately. For exhaustion marker staining (CTLA-4, KLRG1, LAG-3, PD-1), we strongly recommend using the FOXP3 Fix/Perm kit as it preserves the integrity of these epitopes while providing superior nuclear access for transcription factor detection (FOXP3, TOX). For cytokine staining protocols, BD Cytofix/Cytoperm reagents are preferred as they optimize intracellular retention of cytokines while minimizing background fluorescence. The selection of appropriate fixation/permeabilization reagent significantly impacts staining quality and should be chosen based on the specific target proteins being investigated.
2. Resuspend cells in 50 μL of 1× FOXP3 Fix/Perm solution or BD Cytofix/Cytoperm solution and incubate for 40 min on ice, protected from light.
Pause point: After fixation, cells can be stored overnight at 4 °C in Perm/Wash buffer, protected from light. Intracellular staining can then be resumed the following day without compromising staining quality.
Note: If proceeding directly to intracellular staining, prepare intracellular antibody cocktails in the Brilliant Stain Buffer, calculating 50 μL per well based on predetermined optimal dilutions. For the “exhaustion” panel, include BV711-conjugated streptavidin at this step.
3. Add 200 μL of 1× Fix/Perm wash buffer to each well and centrifuge at 400× g for 5 min at 4 °C. Remove supernatant by flicking plates.
4. Resuspend cells in 200 μL of 1× Fix/Perm wash buffer in each well and centrifuge at 400× g for 5 min at 4 °C. Remove supernatant by flicking plates.
5. Add 50 μL of prepared intracellular antibody cocktail directly to cells and incubate overnight at 4 °C.
6. Next day, add 200 μL of 1× Fix/Perm wash buffer to each well and centrifuge at 400× g for 5 min at 4 °C. Remove supernatant by flicking plates. Resuspend cells in 100 μL of FACS buffer.
Pause point: Samples can be stored at 4 °C for up to 1 week prior to analysis by flow cytometry.
7. Proceed to flow-cytometry acquisition.
H. Flow-cytometry acquisition and compensation
This section describes the instrument setup, compensation workflow, and acquisition of experimental samples using a BD LSRFortessa X-20 flow cytometer.
1. Turn on the BD LSRFortessa X-20 flow cytometer and allow the instrument to complete the start-up procedure. Use the same laser, detector, and optical configuration for compensation controls and experimental samples.
Note: The optical configuration used for protocol validation is provided in Table S2. However, instrument configurations may vary across laboratories and may require adaptation of acquisition settings accordingly.
2. Transfer all samples and controls to 5 mL polystyrene round-bottom Falcon tubes fitted with a cell strainer cap. To prevent instrument clogging, add an approximately equal amount of PBS to cell samples.
3. Optimize photomultiplier tube (PMT) voltage settings at each acquisition setting. Use the same acquisition settings for all controls and experimental samples within the same acquisition session.
Note: PMT voltage settings may vary between acquisition sessions due to routine instrument performance checks. Therefore, it is recommended to optimize PMT voltages and generate and acquire compensation and staining controls at each session, rather than relying on pre-defined acquisition settings and compensation matrices.
4. In the parameter settings, select A, H, and W physical parameters for both the FSC and SSC detectors. Optimize FSC/SSC settings to visualize the lymphocyte population while minimizing debris. Using the FSC-A/SSC-A gate, the lymphocyte population will appear as a cluster of events characterized by low SSC-A and low-to-intermediate FSC-A.
Note: A shift toward lower FSC may be observed in cells processed through the “exhaustion” panel workflow.
Critical: Begin sample acquisition at a low flow rate. The flow rate may be increased to medium after confirming a stable event rate and appropriate sample flow. A high flow rate is not recommended.
5. Acquire unstained and single-stained controls to set the initial compensation matrix in BD FACSDiva software. For Live/Dead compensation, mix the live-cell and dead-cell controls in the same tube and proceed to acquisition. During recording, confirm that the fluorochrome of each control corresponds to the color selected in BD FACSDiva software. Record 5,000 events for each single-stained control and confirm that the positive peak is appropriately positioned within the expected range of the detection axis.
Note: Before acquisition, briefly measure each single-stained control to verify appropriate fluorochrome detection and clear separation of negative and positive populations.
6. Calculate compensation, save compensation settings, and begin acquisition of the experimental samples and staining controls (FMO controls, isotype controls, unstimulated-cell control). Maintain the same detector voltages, compensation, and acquisition settings during the entire acquisition session. Acquire all available cells per sample to maximize event detection for downstream analyses.
Note: If samples appear to have high cell concentration, dilute with PBS to prevent machine clogging.
I. Flow-cytometry data initial analysis
This section describes the analysis of acquired flow-cytometry data, including optimization of the compensation matrix, sequential gating, control-based gate definition, and extraction of panel-specific results.
1. Export the acquired FCS files from BD FACSDiva software and import them into FlowJo for analysis.
2. Before analysis, open the compensation matrix and confirm that the compensation corresponding to each channel has been selected in the compensation settings. Calculate the compensation matrix using the AutoSpill algorithm [9]. Inspect the automatically calculated matrix to confirm appropriate compensation and apply it to all samples.
3. Perform sequential gating according to the following strategy:
a. Identify the lymphocyte population based on FSC-A and SSC-A, while excluding debris and other non-lymphocyte events.
b. Identify single cells using FSC-A versus FSC-H.
c. Confirm the single-cell population using SSC-A versus SSC-W.
d. Identify live CD45-positive cells using the Live/Dead and CD45 parameters.
e. Apply subsequent panel-specific gates according to the experimental objectives and the markers included in each antibody panel.
4. For low-frequency exhaustion and cytokine markers, use FMO and, where applicable, isotype controls to define the boundaries between negative and positive populations. For the “cytokine” and “combined” panels, compare the proportion of positive events in stimulated samples with that in the corresponding unstimulated-cell control to assess the specificity and magnitude of the response to stimulation.
Note: As a practical guideline, position the gate such that no more than approximately 0.1% of cells in the parent population are positive across FMO or isotype controls.
5. Express cell frequencies as a percentage of the parent cell population. Record the number of events acquired for each sample and the event count for each gated population per sample.
Note: Positive populations characterized by very low event counts (<10 events) should be interpreted with caution and may be unsuitable for robust quantitative comparisons.
Data analysis
Flow cytometry data used for protocol validation and presented herein were analyzed using FlowJo v.10.10.0. Representative plots were optimized using Adobe Illustrator v30.5.1. After manual gating, exported cell frequencies were analyzed for quantitative comparisons using GraphPad Prism 11.0.0 and Excel’s plugin Real Statistics Resource Pack software (Release 9.9, copyright 2013–2026, Charles Zaiontz, https://real-statistics.com). Data normality was assessed using the Shapiro–Wilk’s test. Homogeneity of variance was assessed using the F-test. To compare abundant T-cell populations, the unpaired Student’s t-test was used for homoscedastic data, while Welch’s correction was applied to heteroscedastic data. To compare rare T-cell populations, Mann–Whitney’s U test was used. For paired measurements in complete datasets, two-way ANOVA with Geisser–Greenhouse’s correction was used, whereas a mixed-effects model (REML) was used when measurements were repeated at different storage durations for each sample. For both analyses, Fisher’s LSD post hoc test was used for pairwise comparisons. P-values less than 0.060 are shown on the graphs; P-values less than 0.050 were considered statistically significant. Detailed statistical results, including test statistics, exact P-values, and 95% confidence intervals, are reported in Table S4.
Validation of protocol
Here, we present a protocol for cryopreservation, thawing, stimulation, and staining of mouse splenocytes to quantify the expression of T-cell exhaustion markers, including variations in effector cytokine production. We validated our cryopreservation workflow using splenocytes from young (7–8 weeks, n = 10) and aged male C57BL/6J mice (2 years, n = 9). Splenocytes were harvested from all animals on the same day. After spleen dissociation, aged mice displayed significantly reduced fresh spleen cellularity compared to young mice (Figure 1A), as previously reported [10]. Freshly dissociated splenocytes were divided into two 1.5-mL aliquots containing equivalent cell numbers and cryopreserved as described herein. Aliquots were stored at -80 °C for a minimum of 5.5 and a maximum of 8.8 months before thawing (Figure 1B). After thawing, total cell recovery was approximately 60% and was stable across storage durations (Figure 1B). Cell viability after thawing was approximately 75%, as assessed by acridine orange/propidium iodide staining. In calibrating our workflow, we found that longer thawing durations, such as thawing splenocytes in the evening and leaving them for overnight incubation in a CO2 incubator at 37 °C, yielded lower cell numbers and worse viability, as described in published protocols [11]. The optimized thawing protocol presented here ensures sufficient cell recovery and viability for downstream flow-cytometric analysis of T-cell exhaustion markers and cytokine production.
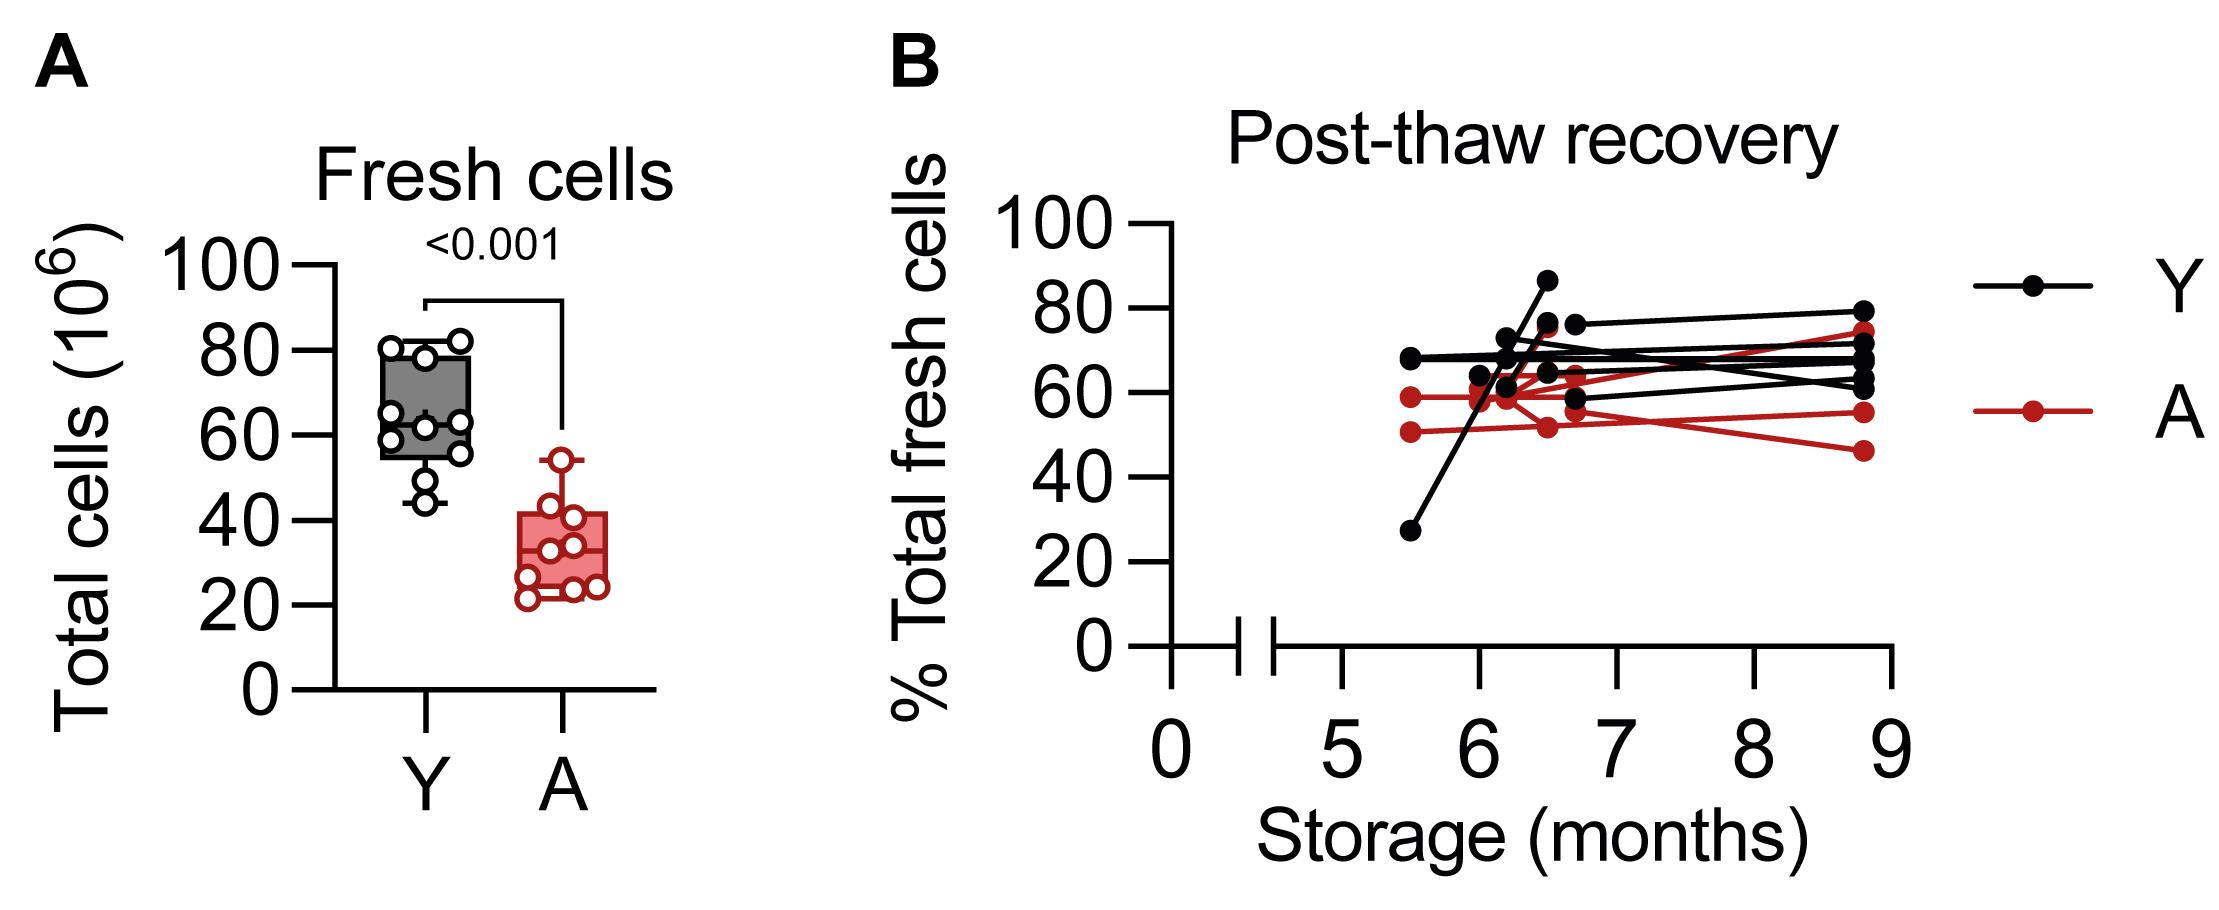
Figure 1. Post-thaw spleen cell recovery. (A) Total fresh spleen cell count. Statistical analysis: unpaired Student’s t-test. (B) Post-thaw spleen cell recovery after cryopreservation. From each animal, two spleen cell aliquots were stored and thawed at different time points to assess the impact of storage duration. Aliquots from the same animals are connected by lines. For one animal in each group (A and Y), both aliquots were thawed on the same day (storage: 6 months for both animals); therefore, a single data point is shown for these two animals. Statistical analyses: repeated-measures mixed-effects model (REML) followed by Fisher’s LSD post hoc test. Abbreviations: A, aged; Y, young. Sample n: A = 9, Y = 10.
To support flow-cytometry staining validation (Figures 2–6 and Figures S1 and S2), we used aliquots from three aged mice and seven young mice, one aliquot per mouse, thawed after 8.8 months, corresponding to the longest storage duration tested. No animals were excluded from the analysis. The gating strategies for the three staining panels here described are illustrated in Figures 2–4. FMO, isotype, and unstimulated controls are shown in Figures S1 and S2. Cells stained with the “exhaustion” panel (Figure 2) displayed a shift toward lower FSC compared with cells stained with the “cytokine” and “combined” panels (Figures 3 and 4, respectively), possibly reflecting differences in the fixation/permeabilization buffers used [12]. PMA/ionomycin stimulation resulted in an approximately 10-fold decrease in live CD45+ single cells (Figures 2–4). In addition, stimulation led to an almost complete disappearance of FOXP3+ cells (Figures 2–4), indicating that the unstimulated condition is more suitable for quantifying this subset.
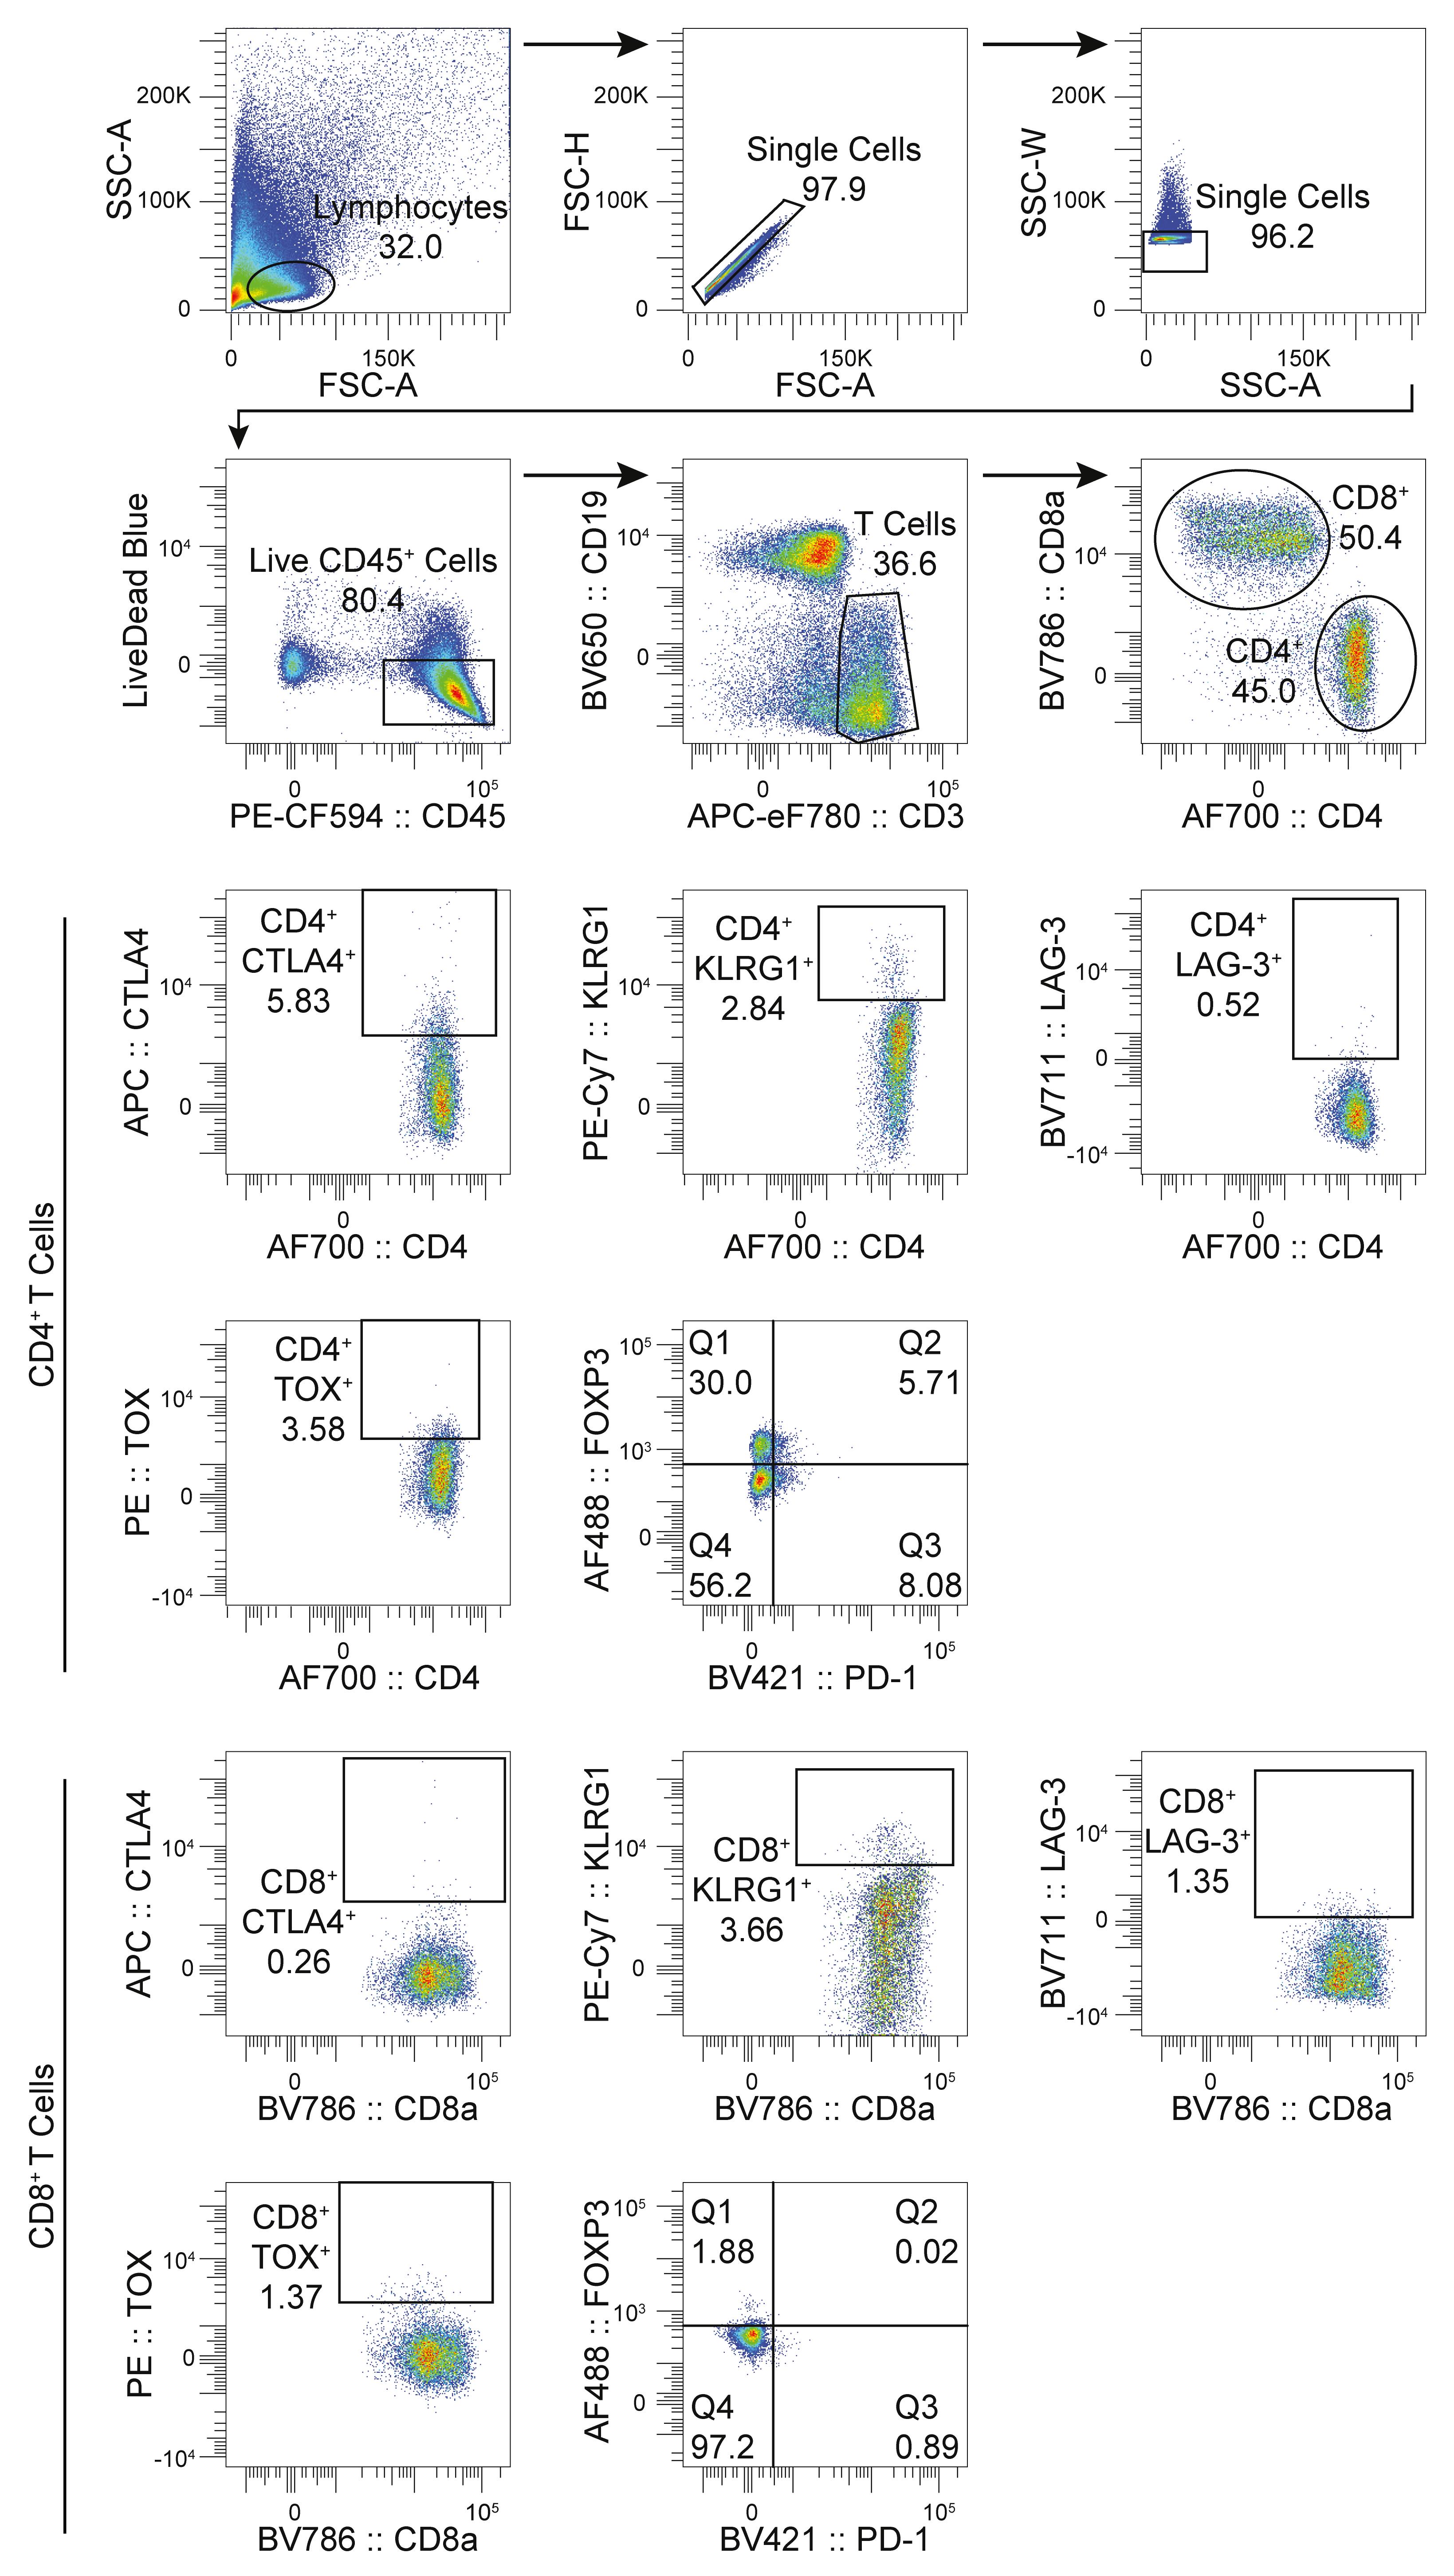
Figure 2. Gating strategy for the “exhaustion” panel. Graphs show one representative “aged” sample. On the FOXP3 versus PD-1 graphs, Q1+Q2 denote FOXP3+ regulatory T cells, Q2+Q3 denote PD-1+ cells, and Q2 denote PD-1+FOXP3+ regulatory T cells.
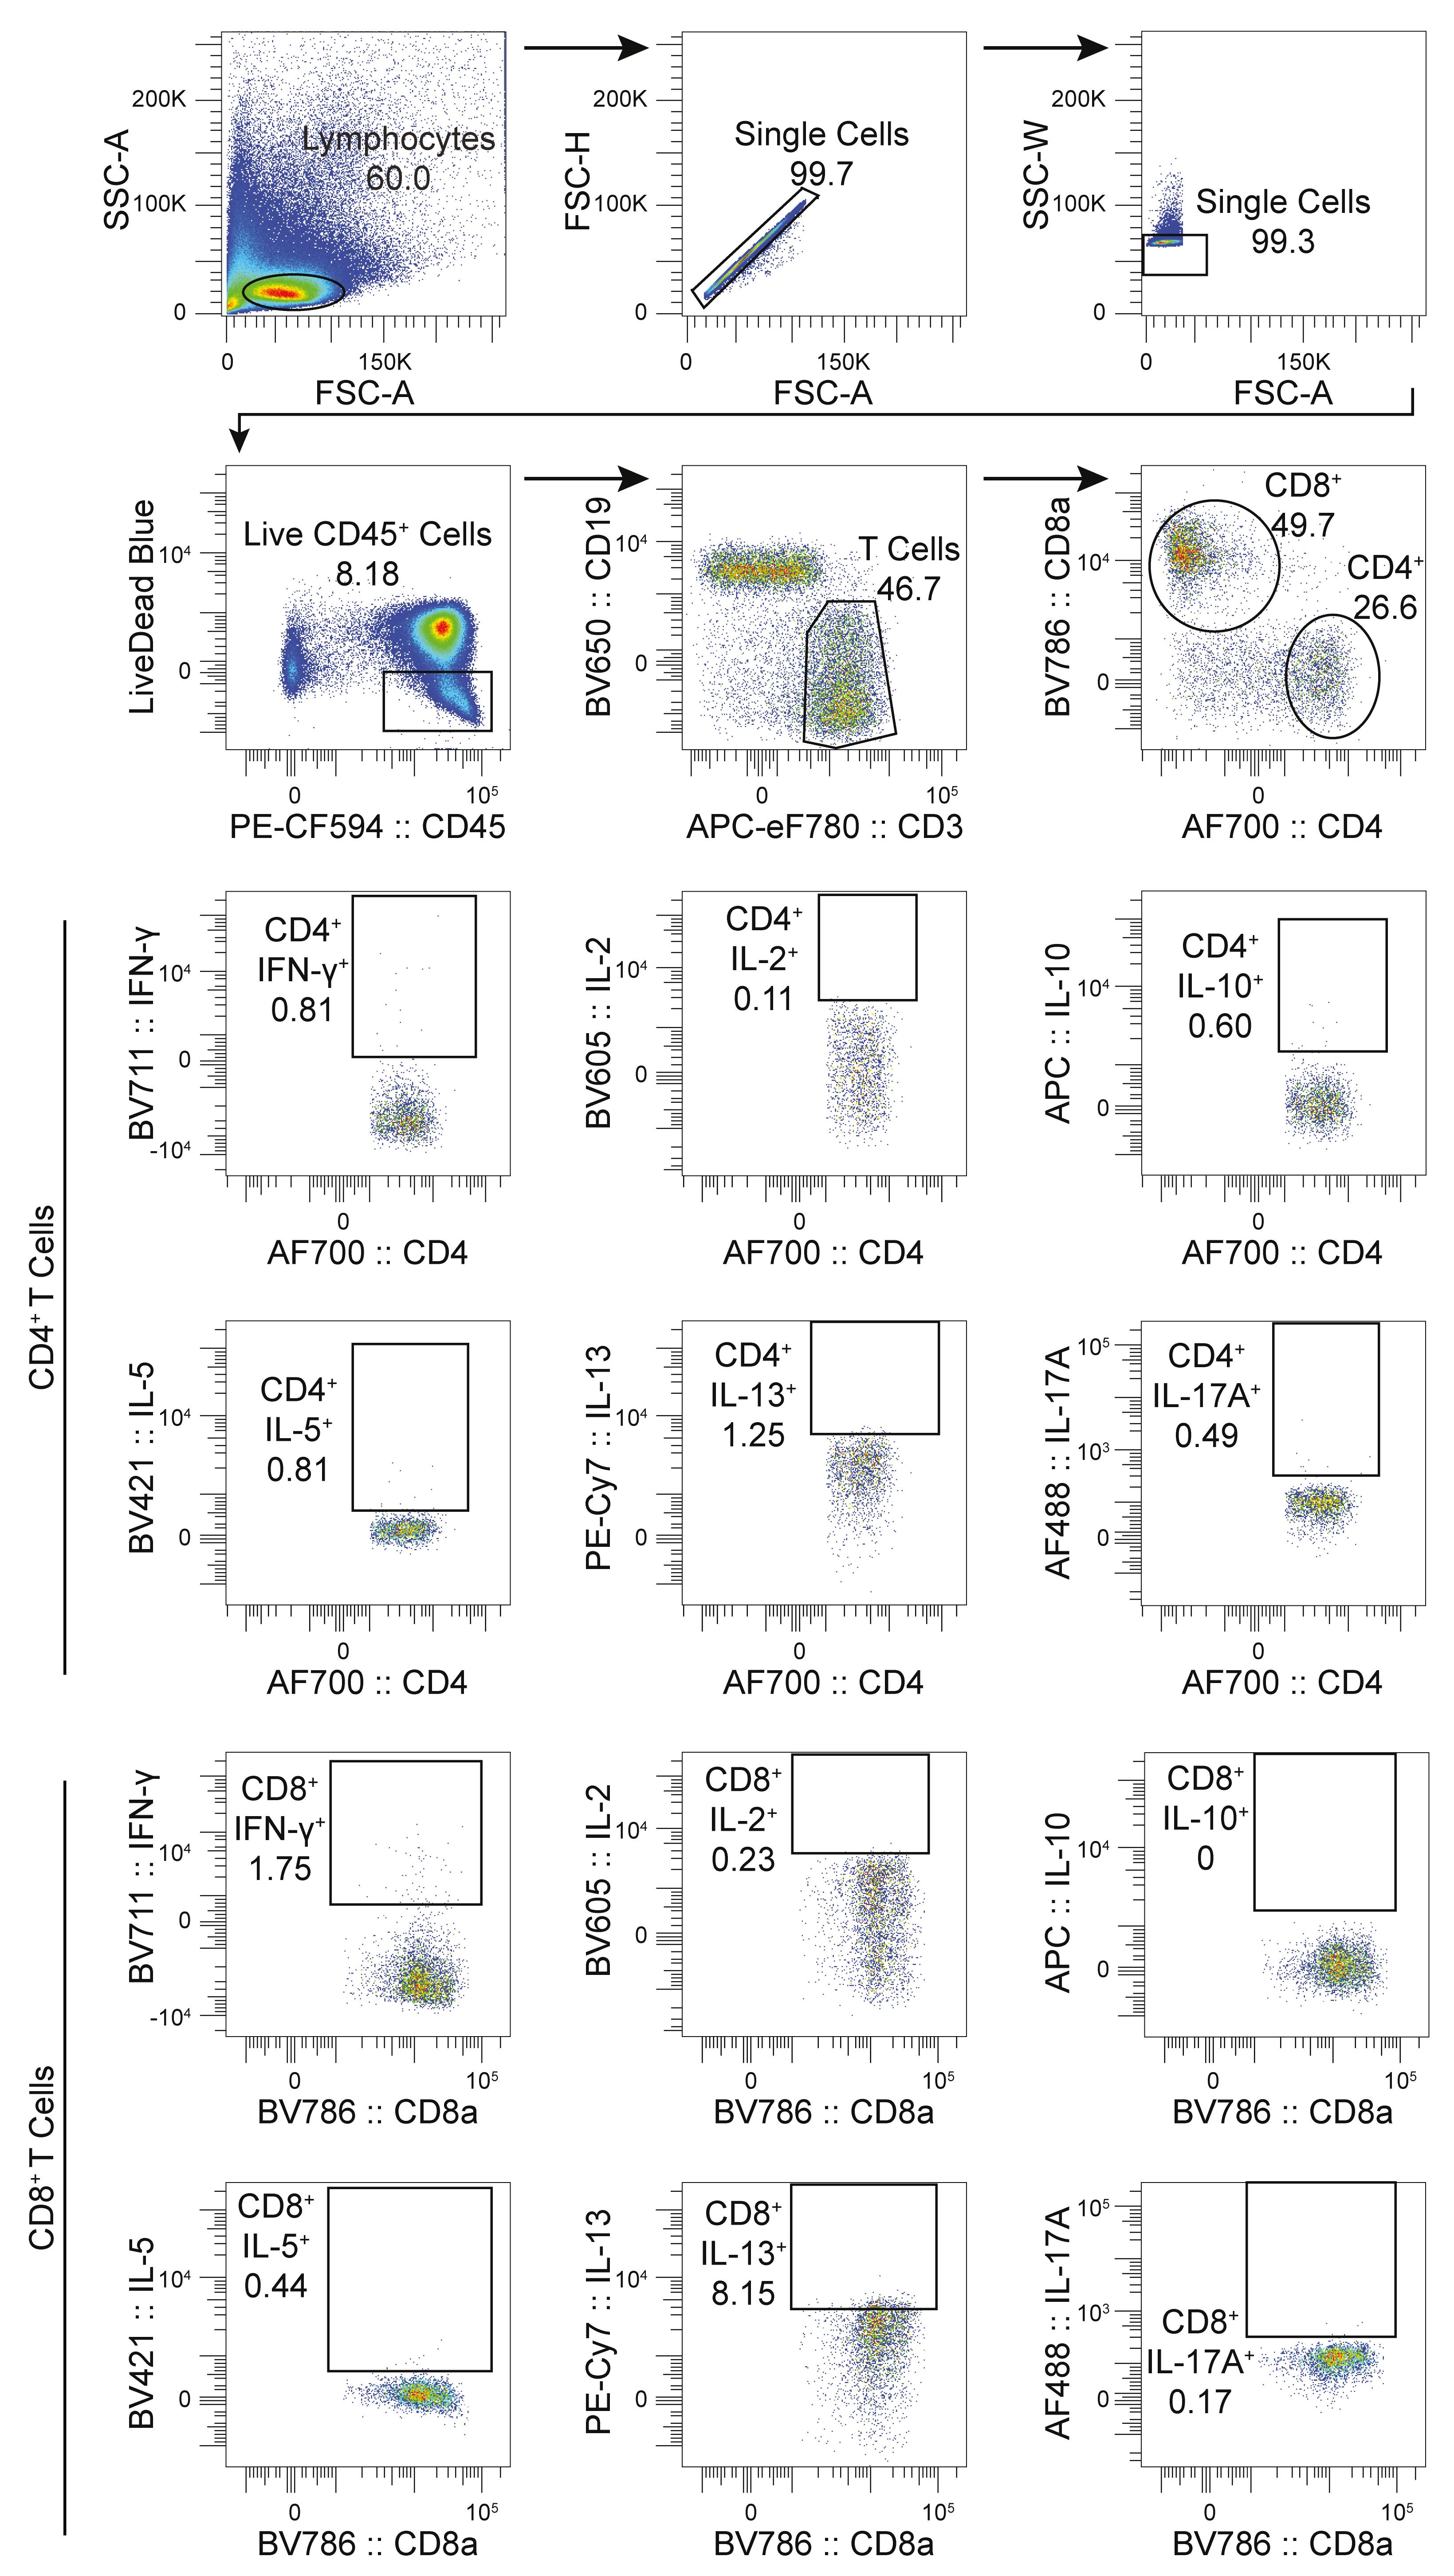
Figure 3. Gating strategy for the “cytokine” panel. Graphs show one representative “aged” sample.
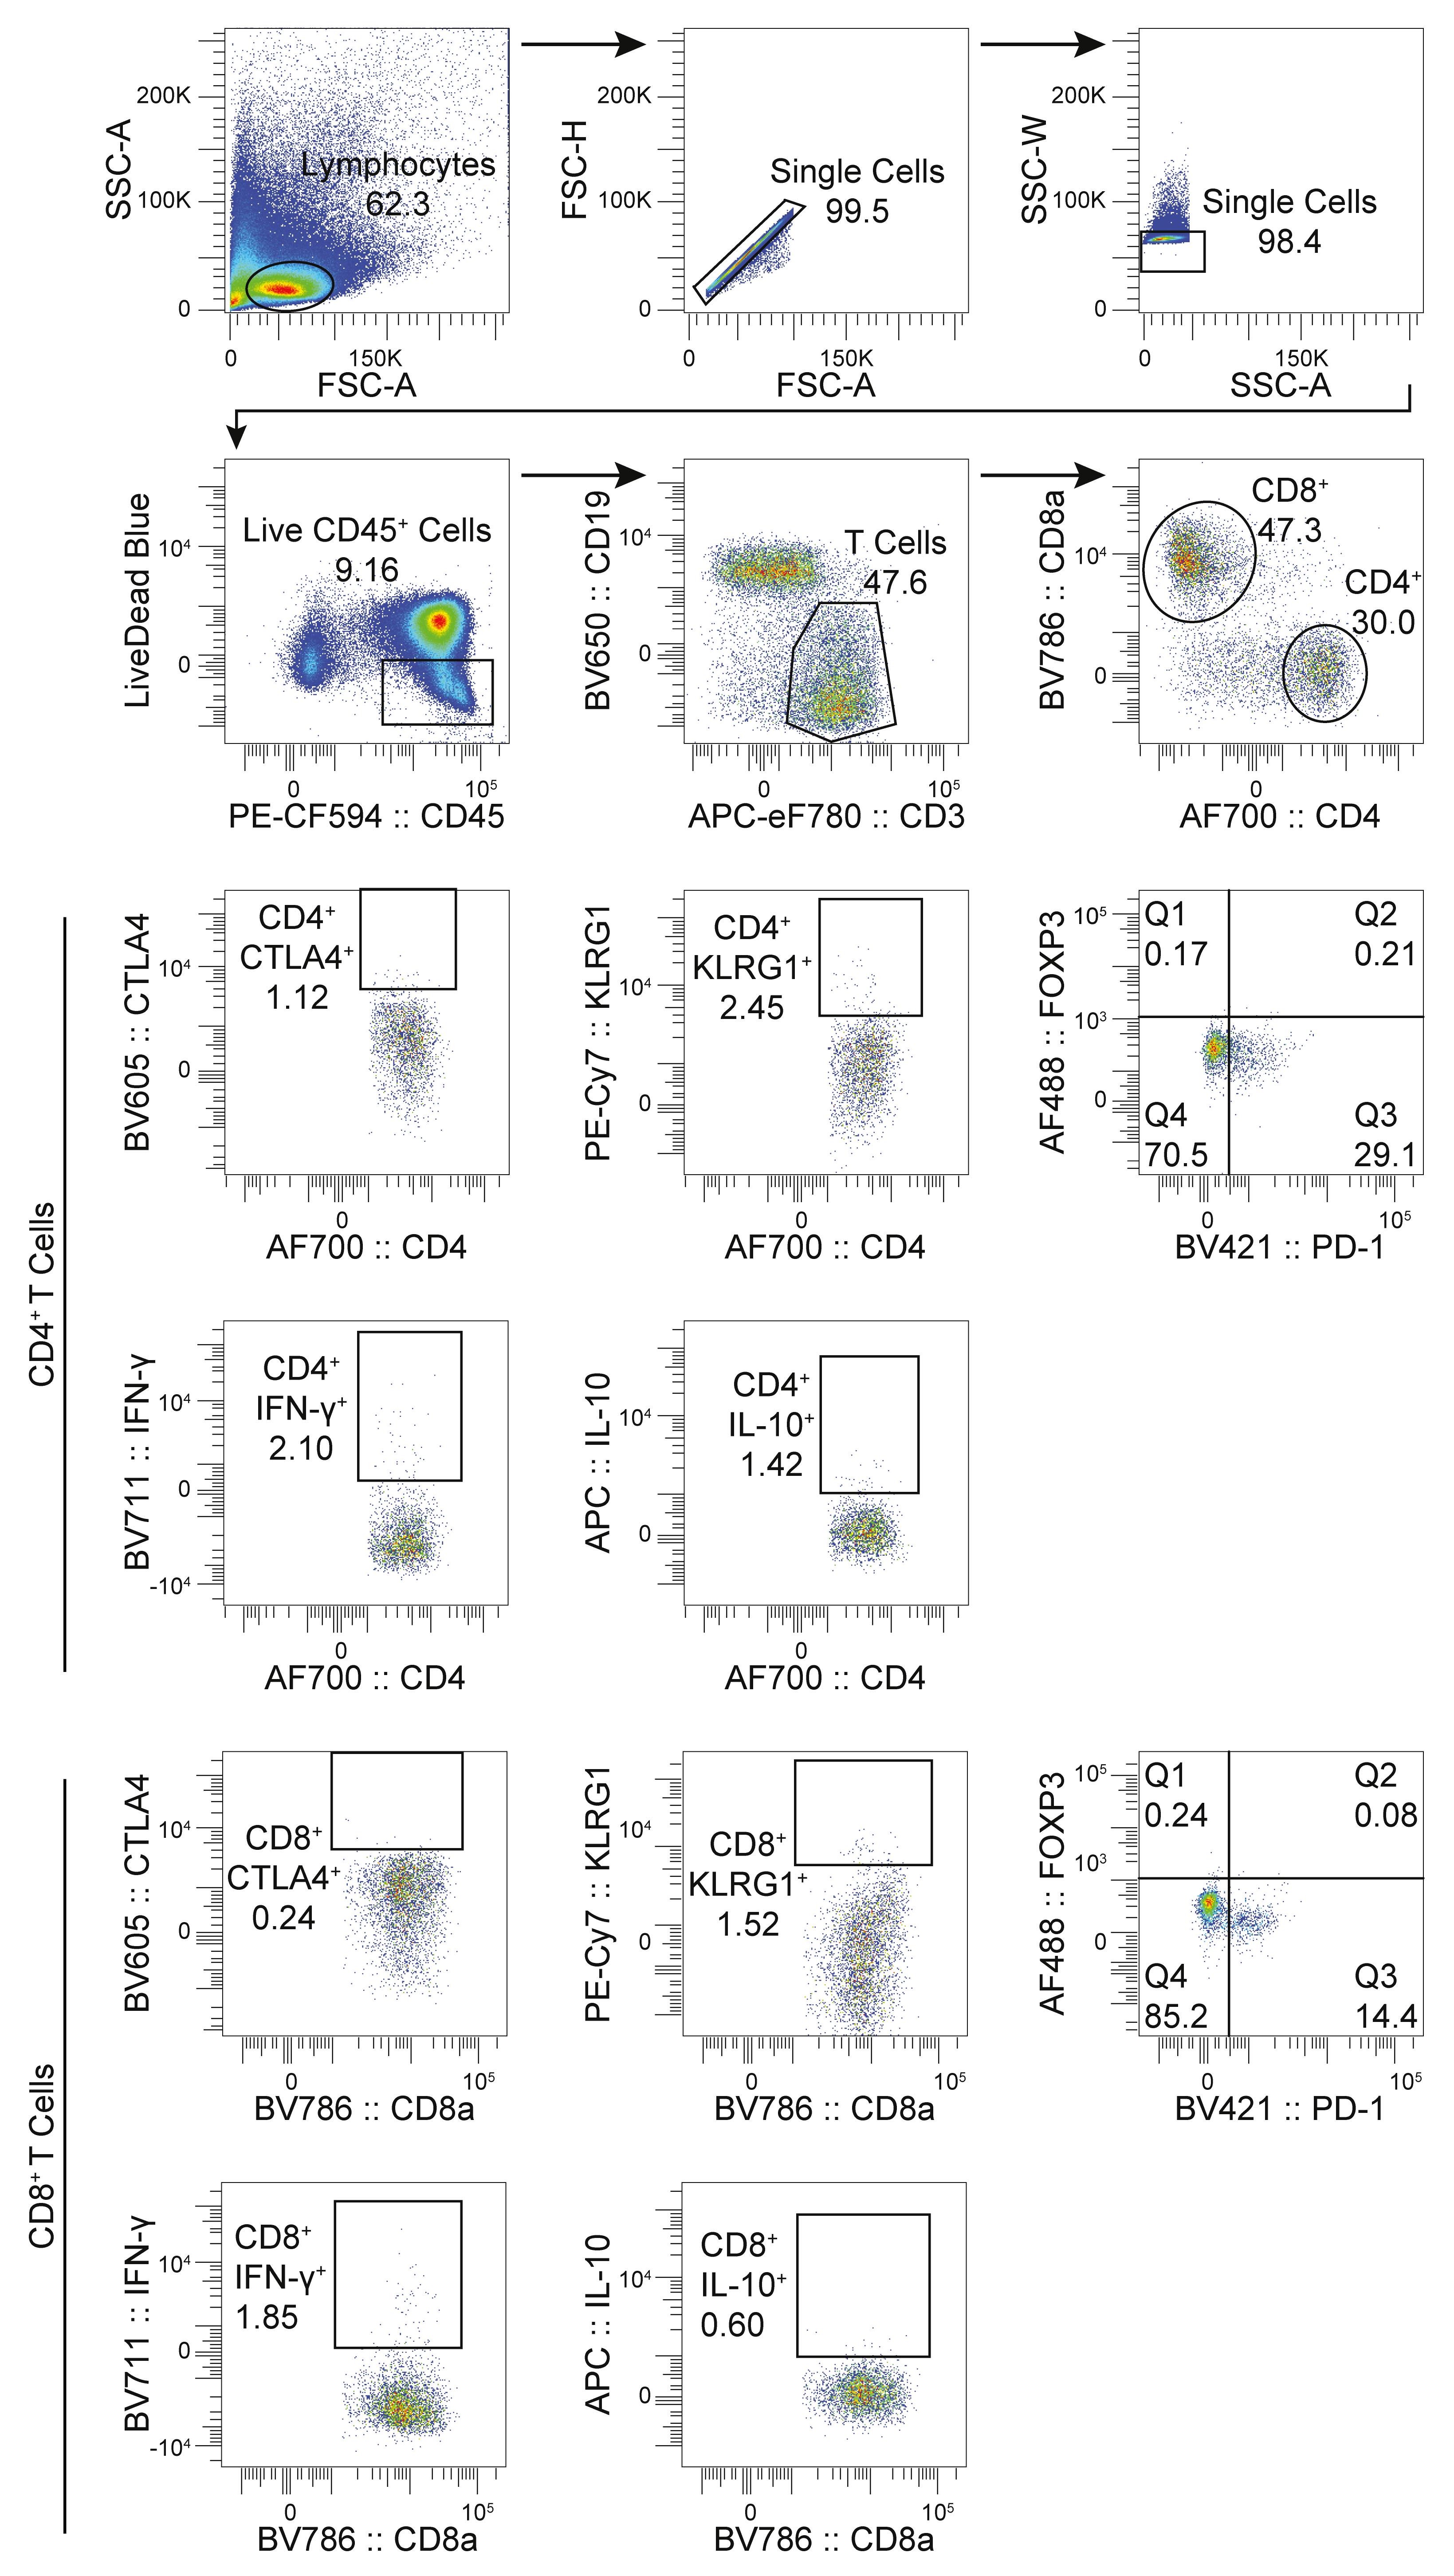
Figure 4. Gating strategy for the “combined” panel. Graphs show one representative “aged” sample. On the FOXP3 versus PD-1 graphs, Q1+Q2 denote FOXP3+ regulatory T cells, Q2+Q3 denote PD-1+ cells, and Q2 denote PD-1+FOXP3+ regulatory T cells.
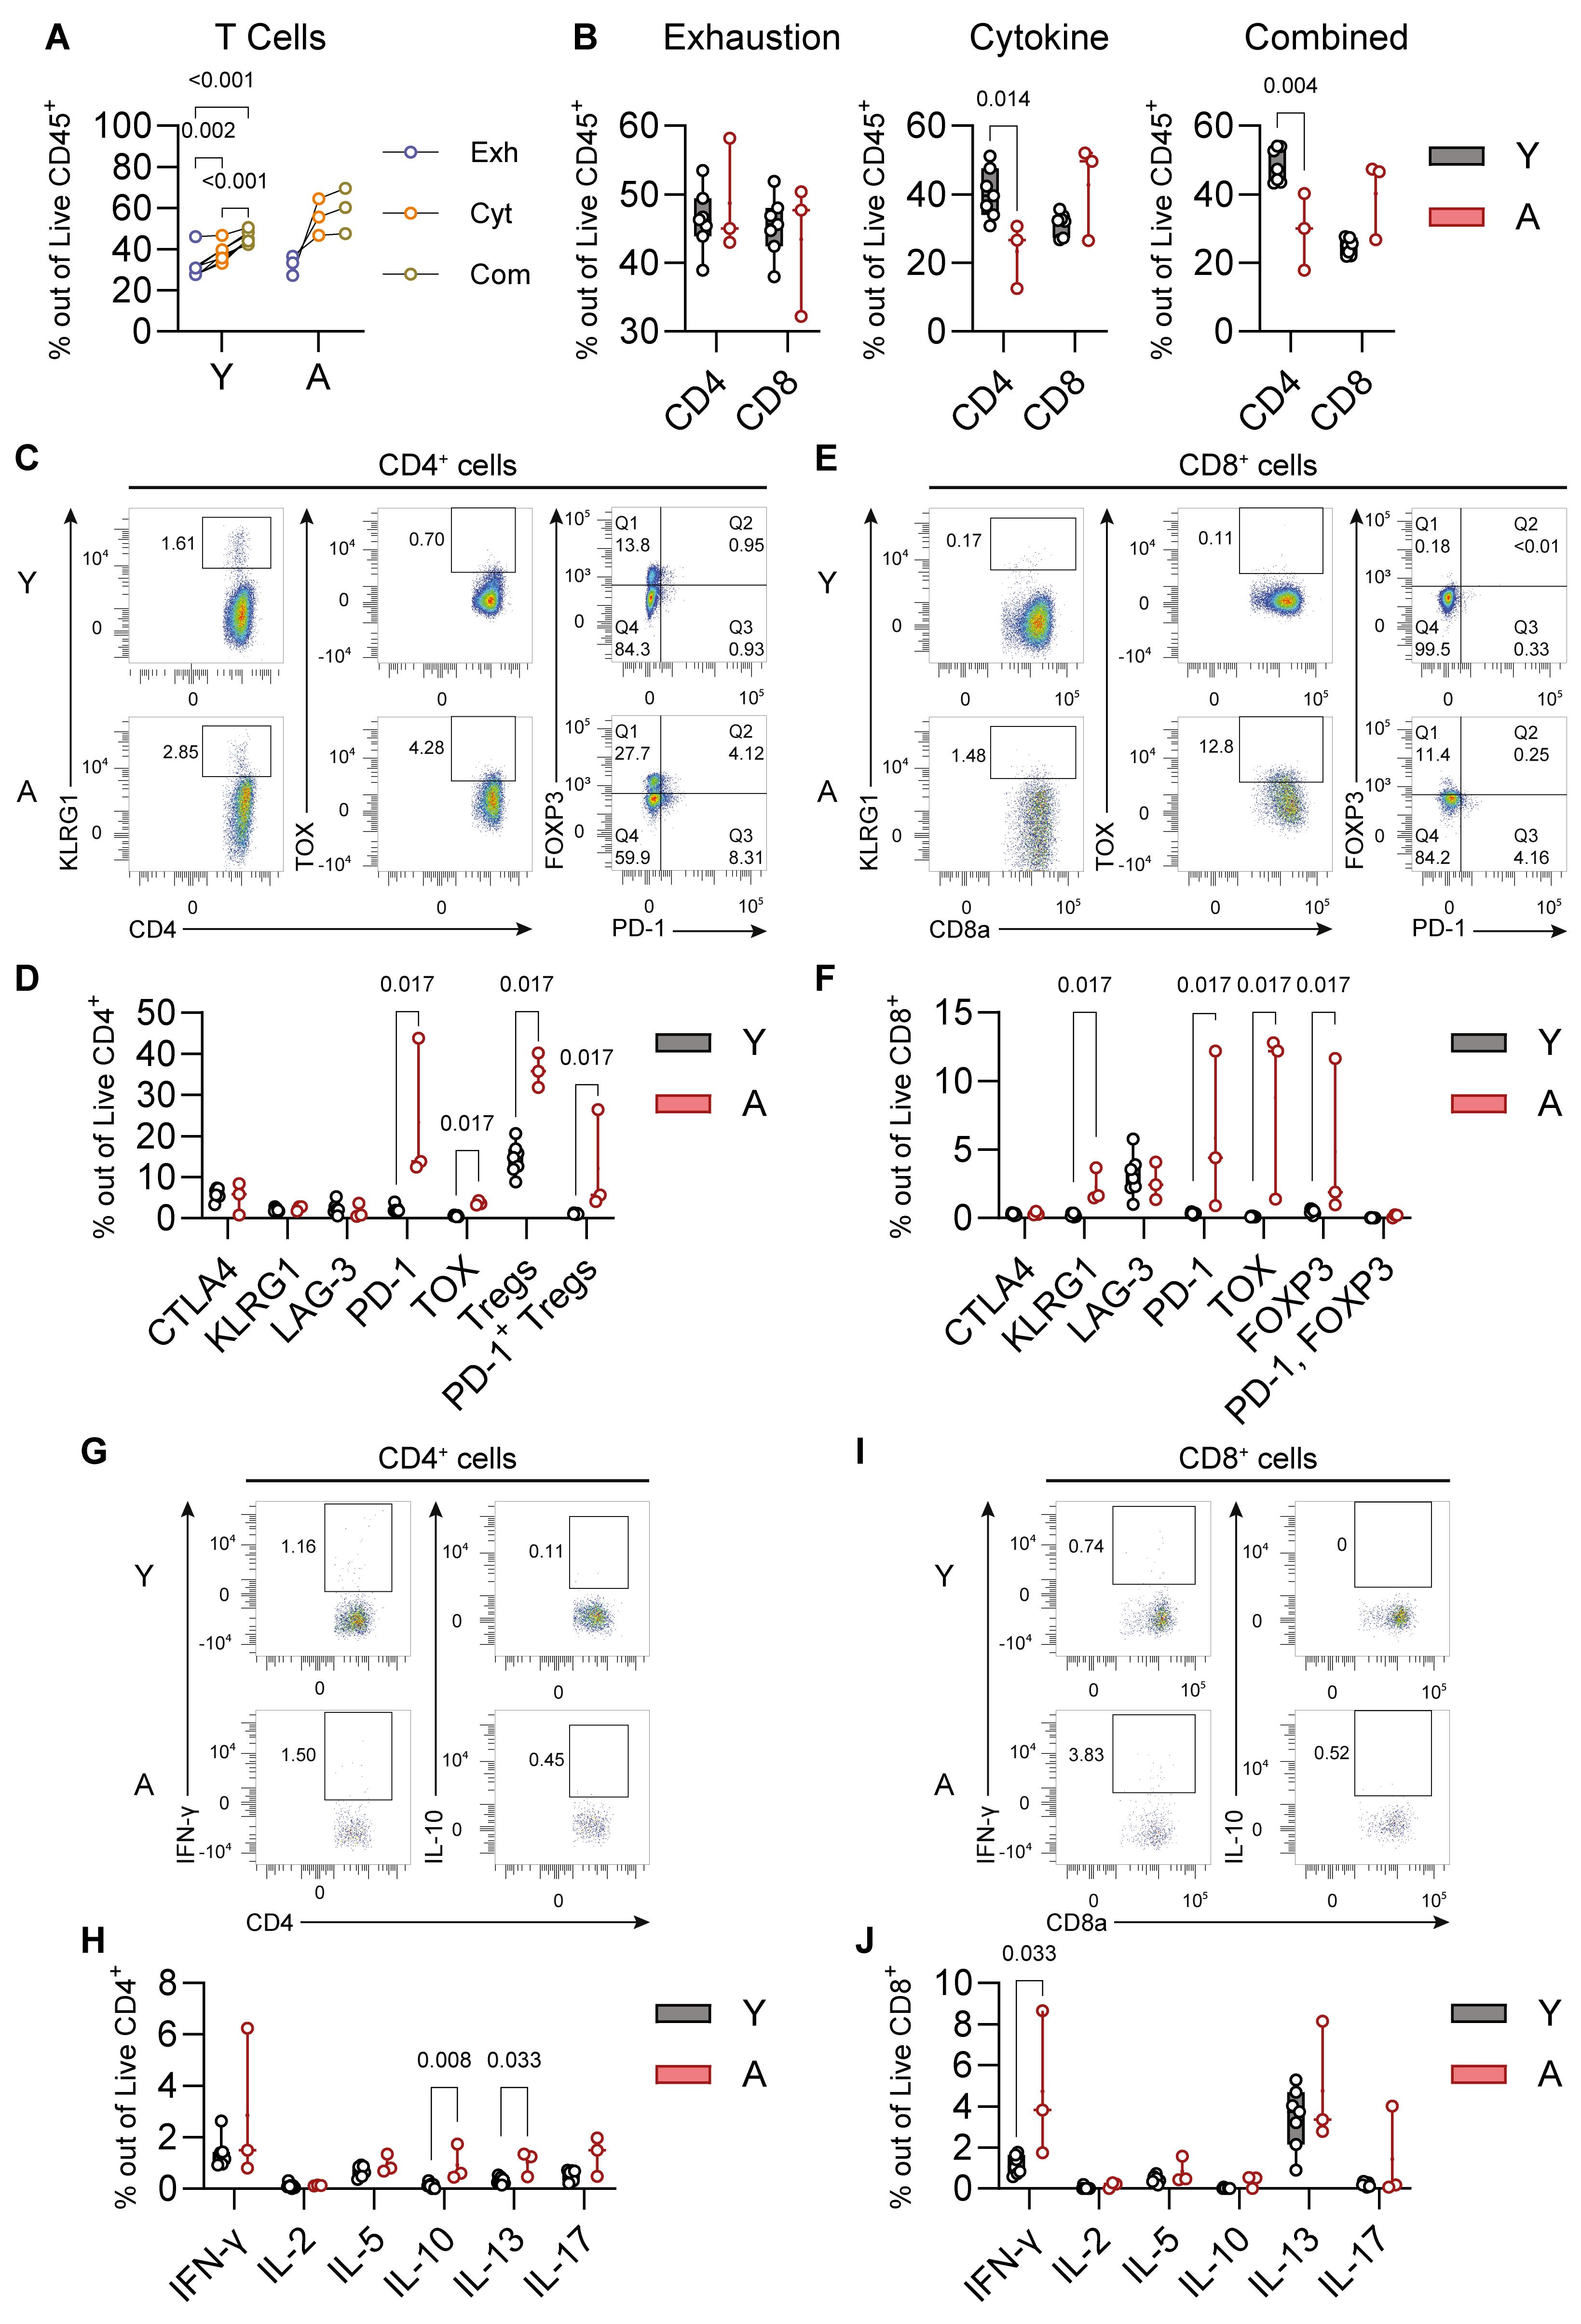
Figure 5. Validation of the “exhaustion” and “cytokine” panels using young and aged mice. (A) Live T-cell recovery in the “exhaustion” (Exh), “cytokine” (Cyt), and “combined” (Com) panels. Black lines connect samples from the same mice. Statistical analyses: repeated-measures two-way ANOVA with Geisser-Greenhouse’s correction followed by Fisher’s LSD post hoc test. (B) Live CD4+ and CD8+ T cell frequencies in the “exhaustion,” “cytokine,” and “combined” panels. Statistical analyses: unpaired Student’s t-test; to compare CD8+ cells in the “cytokine” and “combined” panels, Welch’s correction was used. (C–F) Quantification of exhaustion, immune suppression, and senescence-associated markers in CD4+ (C and D) and CD8+ T cells (E and F) using the “exhaustion” panel. Tregs (T-regulatory) cells define CD4+FOXP3+ double-positive cells. Statistical analyses: Mann–Whitney’s U test. (G–J) Quantification of cytokine production after stimulation in CD4+ (G and H) and CD8+ T cells (I and F) using the “cytokine” panel. Statistical analyses: Mann–Whitney’s U test. (A–J) Sample n: A = 3, Y = 7. (C, E, G, and I) Graphs show representative samples. (C and E) Q1+Q2 denote FOXP3+ regulatory T cells, Q2+Q3 denote PD-1+ cells, and Q2 denote PD-1+FOXP3+ regulatory T cells. (B, D, F, H, and J) The box plots present the minimum and maximum values (whiskers), the first and third quartiles (box boundaries), the median (box internal line), and the mean (cross).
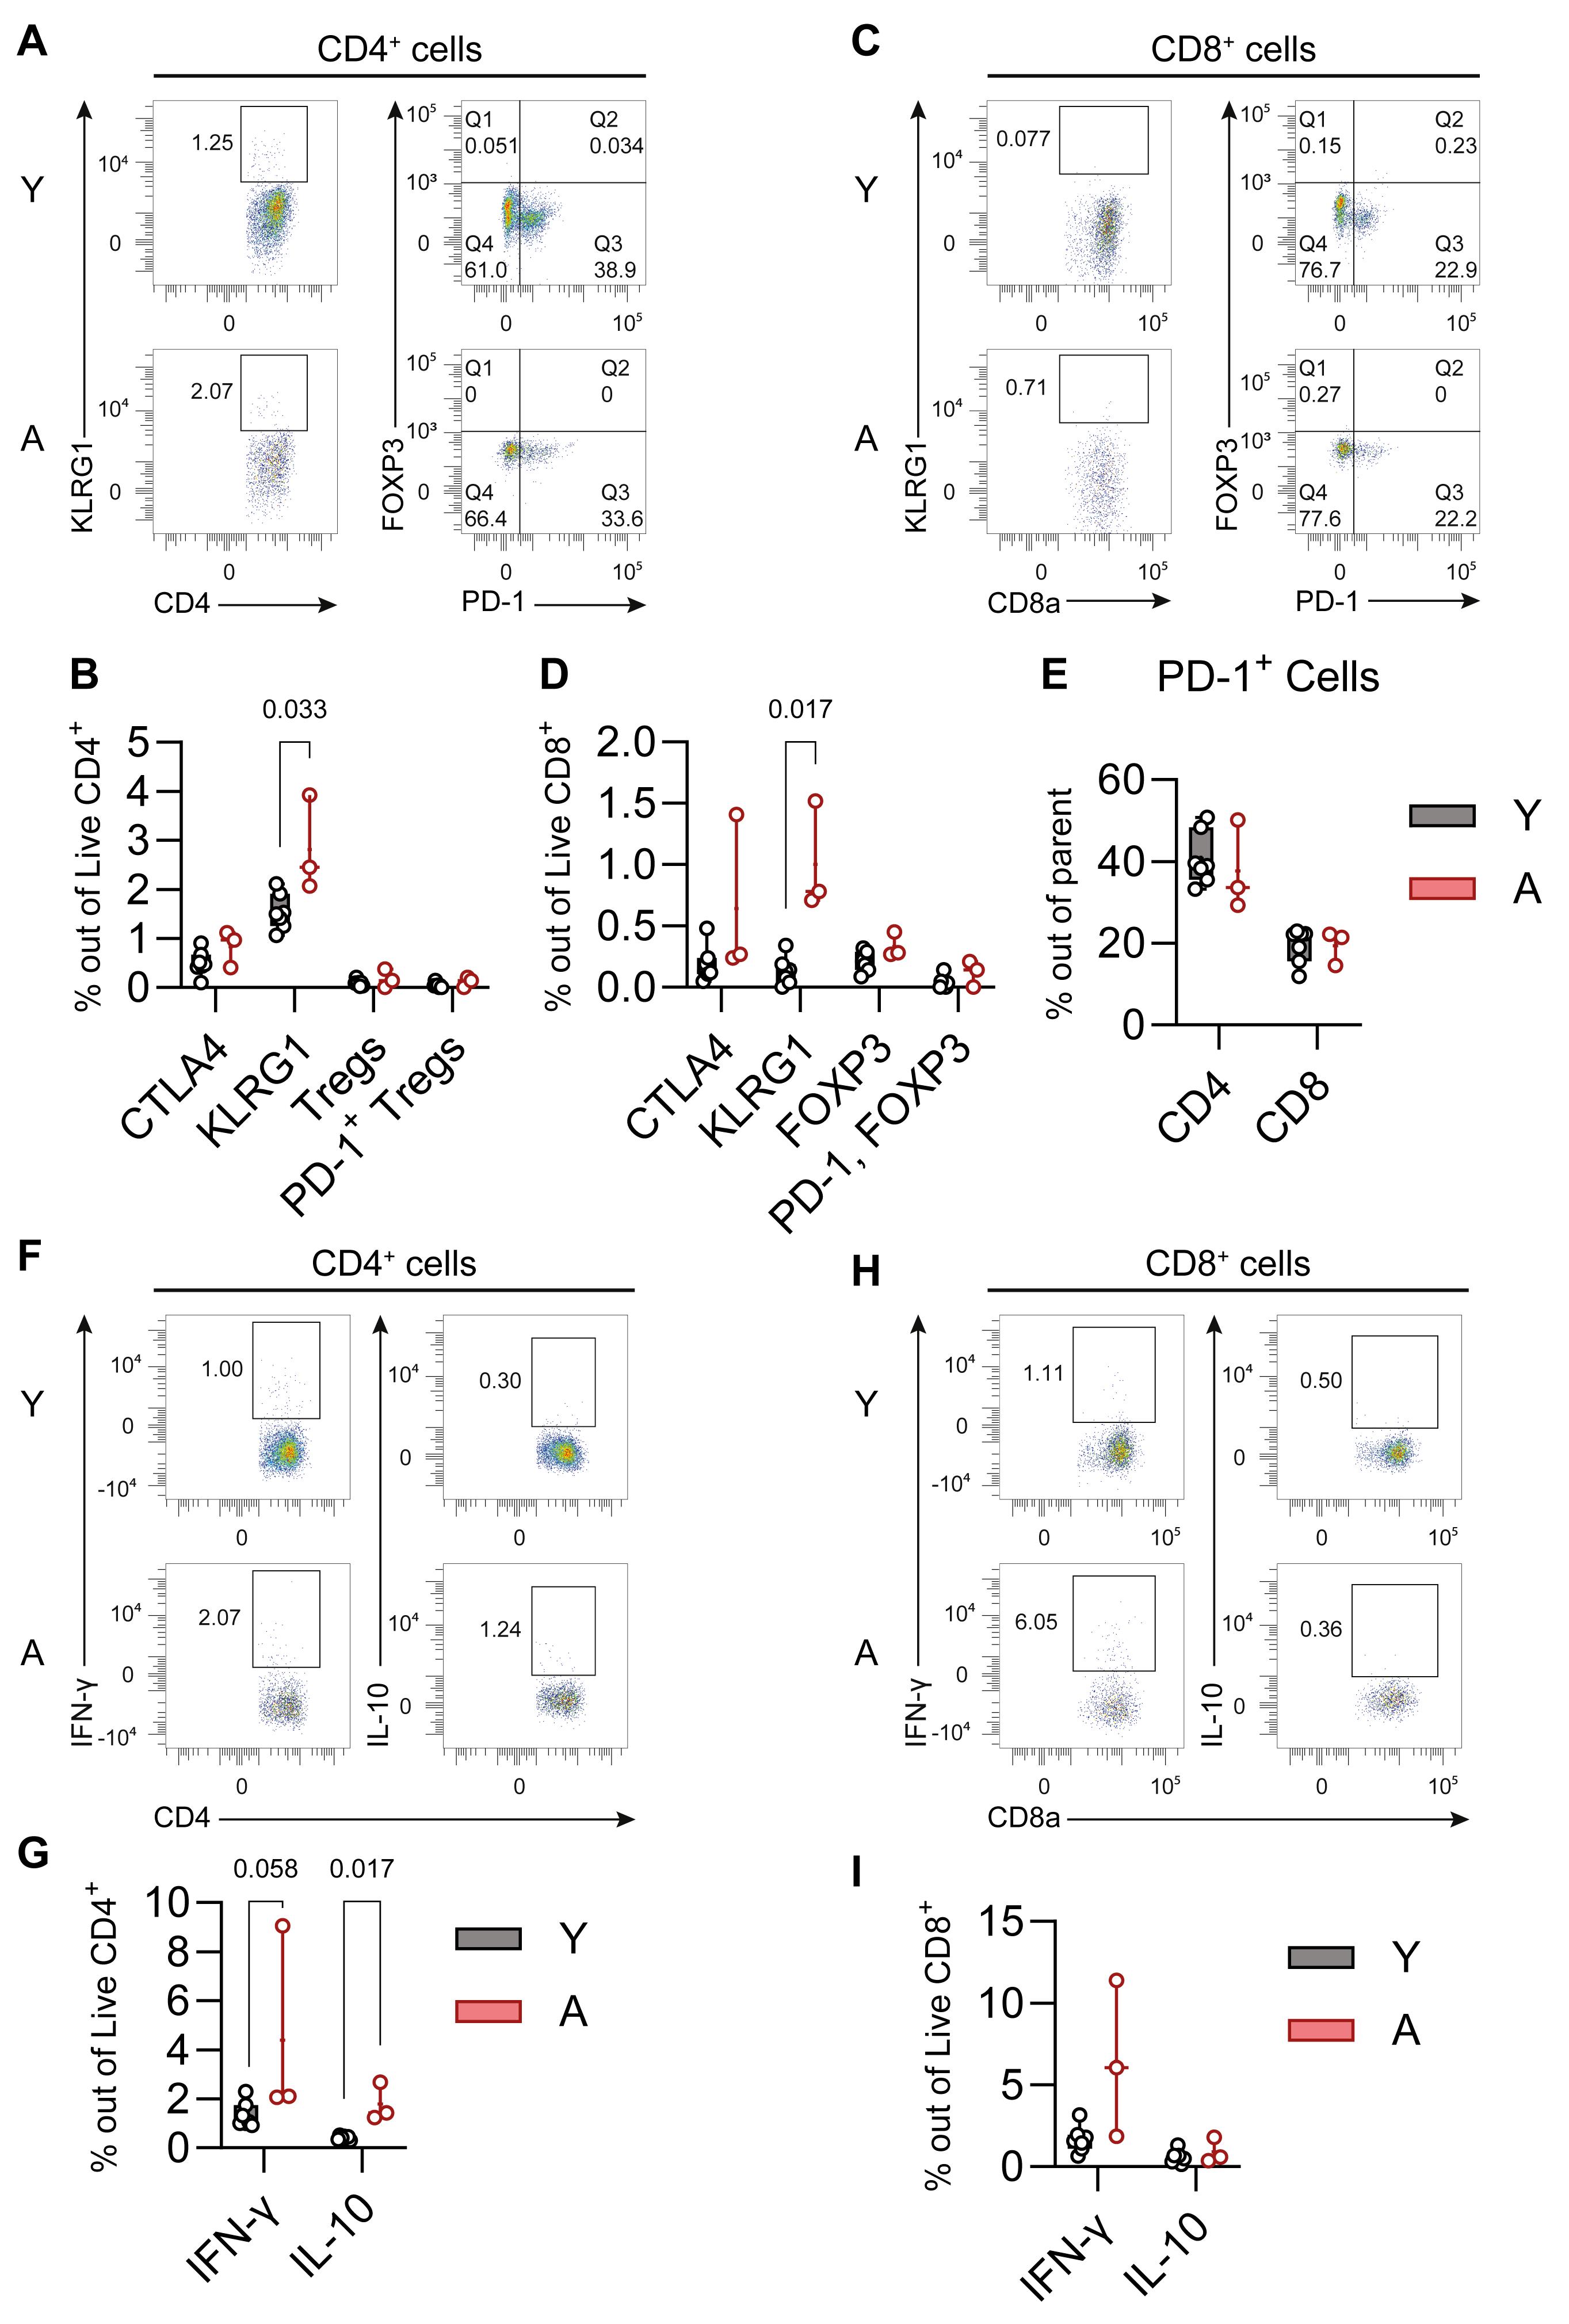
Figure 6. Validation of the “combined” panel using young and aged mice. (A–I) Quantification of exhaustion, immune suppression, and senescence-associated markers (A–E) and cytokine production (F–I) after stimulation in CD4+ (A, B, E, F, and G) and CD8+ T cells (C–E, H, and I) using the “combined” panel. Statistical analyses: Mann–Whitney’s U test. Sample n: A = 3, Y = 7. (A, C, F, and H) Graphs show representative samples. (A and C) Q1+Q2 denote FOXP3+ regulatory T cells, Q2+Q3 denote PD-1+ cells, and Q2 denote PD-1+FOXP3+ regulatory T cells. (B, D, E, G, and I) The box plots present the minimum and maximum values (whiskers), the first and third quartiles (box boundaries), the median (box internal line), and the mean (cross).
Live T-cell recovery was higher under PMA/ionomycin stimulation, with a trend for higher yields in aged mice (Figure 5A). Live CD4+ T-cell frequencies were lower in stimulated cells (Figure 5B). The “exhaustion” panel revealed strongly elevated expression of the inhibitory immune checkpoint PD-1 and the exhaustion-associated transcription factor TOX in both CD4+ and CD8+ T cells in aged mice (Figure 5C–F). Furthermore, aged mice displayed higher frequencies of FOXP3+ T-regulatory cells in both CD4+ and CD8+ compartments, along with increased proportions of PD-1+FOXP3+ double-positive CD4+ T cells, potentially indicating reduced suppressive capacity [13] (Figure 5C–F). Within the CD8+ subset, we also found elevated expression of the senescence-associated marker KLRG1 (Figure 5E, F).
After PMA/ionomycin stimulation, using the “cytokine” panel, we observed increased production of IL-10 and IL-13 in CD4+ T cells, and elevated expression of IFN-γ in CD8+ T cells in aged mice (Figure 5G–J). Compared to the “exhaustion” panel (Figure 5C–F), the “combined” panel revealed elevated KLRG1 expression in CD4+ T cells while confirming the increased levels in CD8+ T cells (Figure 6A–D). Notably, in the “combined” panel, PD-1 expression was strongly elevated, and FOXP3 was almost abrogated compared to the “exhaustion” panel, with no differences between young and aged mice (Figures 5C–F and 6A–E). These discrepancies may reflect PD-1 induction following PMA/ionomycin stimulation and a weak FOXP3 signal after fixation/permeabilization with the BD Cytofix/Cytoperm kit. Finally, the “combined” panel confirmed elevated IL-10 and found significantly increased IFN-γ in CD4+ T cells (Figure 6F, G), whereas IFN-γ showed only a trend for increased expression in CD8+ T cells (Figure 6H, I).
Cytokine data in Figures 5 and 6 should be interpreted with caution due to low event counts (see also Table S3). In particular, for cells stained with the “cytokine” panel, IFN-γ showed the highest event counts in both CD4+ and CD8+ T cells, followed by IL-5 and IL-17A in CD4+ T cells and IL-13 in CD8+ T cells, with mean event counts above 10 across samples (Table S3). For cells stained with the “combined” panel, both IFN-γ and IL-10 exceeded 10 event counts across samples in both CD4+ and CD8+ T cells (Table S3). It should be noted that the data presented here were obtained from one of two aliquots per animal, corresponding to approximately half of the initial spleen cell yield, which was used for three staining panels. Therefore, higher event counts may be obtained by adjusting cell allocation, for example by using fewer panels, the entire cell yield, or pooling aliquots from multiple animals, according to experimental needs.
We also attempted detection of TIGIT and EOMES in the “exhaustion” panel (Figure S2A, B), IL-4 and TNF-α in the “cytokine” panel (Figure S2B, C), and EOMES and IL-17A in the “combined” panel (Figure S2E, F; see also Tables S1 and S3). However, signal resolution for these markers was problematic. TIGIT could not be distinguished reliably from its FMO and isotype controls (Figure S2A) and displayed very low event counts (Table S3). Conversely, EOMES and TNF-α were clearly distinguishable from their respective FMO and, for TNF-α, unstimulated controls (Figure S2B, D, E), and had relatively substantial event counts (Table S3). In particular, EOMES showed a trend toward an increase in both CD4+ and CD8+ T cells in aged mice in the “exhaustion” panel (Figure S2B), which was statistically significant in the “combined” panel (Figure S2E). Similarly, TNF-α displayed an increasing trend in CD4+ T cells and a significant increase in CD8+ T cells in aged mice (Figure S2D). Nonetheless, elevated fluorescence in the negative population in the PerCP channel, used for both EOMES and TNF-α, limits confidence in these measurements. Finally, in the “cytokine” panel, IL-4 could not be resolved clearly from its FMO and unstained controls (Figure S2C) and was associated with very low event counts (Table S3). Furthermore, the IL-4 isotype control displayed high staining (Figure S2C). In the “combined” panel, PE-conjugated IL-17A, though clearly distinguishable from its FMO control, displayed markedly higher staining than its AF488-conjugated version in the “cytokine” panel (Figure S2F and Figure S3). Furthermore, the unstained control in the combined panel displayed a high positive signal in the PE channel. Therefore, both IL-4 in the “cytokine” panel and IL-17A in the “combined” panel, measured using PE-conjugated antibodies, should be interpreted with caution.
General notes and troubleshooting
General notes
Despite the advantages of using cryopreserved splenocytes for immune cell screening, several limitations must be considered. Cryopreservation and thawing processes may selectively affect certain cell populations. Critically, immune properties and marker expression may be affected in a protocol-dependent manner [14–16]. Using this protocol, post-thaw cell viability should be approximately 25% lower than freshly isolated cells, which may introduce a selection bias toward more resilient cell populations. However, cryopreserved cells were not systematically compared with fresh cells across all cell populations and markers. Therefore, users should ideally validate staining conditions using fresh cells when adapting this protocol to their experimental needs.
While this protocol was validated using young and aged male mice, it could potentially be applied to assess immune changes in other biological contexts (e.g., cancer, systemic inflammation, or metabolic disorders). However, protocol performance may vary depending on experimental conditions such as mouse strain, sex, and disease model. In addition, experimental settings, reagent batches, operator, and sample handling may affect sample stability and inter- and intra-assay variability. Inter-/intra-assay variability, coefficients of variation, and interoperator repeatability were not experimentally assessed in the present validation and should therefore not be considered validated characteristics of this protocol under the conditions tested. Therefore, users should validate this protocol according to their experimental context and define acceptance criteria appropriate to the intended applications.
Under the tested conditions, some markers showed limited signals, particularly most cytokines in the “cytokine” panel. Critically, some markers in the “combined” panel showed altered expression, particularly PD-1 and FOXP3 compared to the “exhaustion” panel, and, to a lesser extent, IFN-γ compared to the “cytokine” panel. PMA/ionomycin stimulation and fix/perm reagents may have a significant impact on some markers, as transcription factors typically do not require stimulation but need harsher permeabilization, whereas cytokines require stimulation and milder permeabilization. Therefore, calibrating each marker staining under optimal conditions is necessary in order to evaluate the suitability of the “combined” staining protocol.
Troubleshooting
Problem 1: Low post-thaw viability.
Solution(s): Ensure rapid thawing in a 37 °C water bath until only a small ice crystal remains. Verify benzonase concentration (1:10,000) and prewarm all media to 37 °C. Use gentle pipetting techniques and maintain DMSO concentration below 1% during washing. Consider adjusting cell concentration during freezing (5 × 10⁶–25 × 106 cells/mL) for optimal recovery.
Problem 2: Weak or absent cytokine production after stimulation.
Solution(s): Verify PMA/ionomycin concentrations (final: PMA 50 ng/mL, ionomycin 500 ng/mL) and ensure brefeldin A is at 10 μg/mL final concentration. Confirm a 4-h incubation at 37 °C in 5% CO2. Include positive controls with known cytokine-producing cells. Consider extending stimulation time to 5–6 h for certain cytokines or adjusting cell density (1 × 10⁶ cells per well).
Problem 3: Cell clumping during thawing.
Solution(s): Add benzonase at a 1:10,000 dilution to the thawing medium to prevent DNA-mediated clumping. Use gentle pipetting techniques and avoid vigorous mixing. Filter cell suspension through a 100 μm strainer if necessary. Ensure complete DMSO removal through thorough washing steps.
Problem 4: Cell loss during cryopreservation process.
Solution(s): Ensure the controlled-rate freezing container is properly filled with isopropanol and pre-chilled to 4 °C. Use optimal cell concentration (5 × 10⁶–25 × 106 cells/mL) and avoid overfilling cryotubes. Work quickly during dispensing and transfer immediately to -80 °C. Verify that the freezing medium is freshly prepared (90% FBS, 10% DMSO) and mixed gently to prevent cell damage.
Problem 5: Incomplete red blood cell lysis or cell aggregation during spleen processing.
Solution(s): Do not exceed a 10-min ACK lysis incubation to prevent cell damage. Ensure complete resuspension of the cell pellet in ACK buffer before incubation. Use fresh ACK buffer and maintain room temperature during incubation. If cell aggregation occurs, filter through a 100 μm cell strainer and perform gentle pipetting. Add an extra washing step with FACS buffer if red blood cells remain visible.
Problem 6: High background fluorescence or nonspecific antibody binding.
Solution(s): Ensure proper Fc blocking with CD16/CD32 antibody (1:100 dilution, 10 min incubation). Optimize antibody concentrations by performing titration experiments to determine the minimal effective concentration. Include appropriate isotype controls and FMO controls to distinguish specific from nonspecific binding. Verify that Brilliant Stain Buffer is used for antibody cocktails containing Brilliant Violet dyes.
Problem 7: Poor compensation or spectral spillover affecting data interpretation.
Solution(s): Ensure proper preparation of single-color compensation controls using UltraComp eBeads (vortex for 30 s before use). Include unstained cells and appropriate positive controls for each fluorochrome. Verify that compensation beads are properly resuspended and distributed. Run compensation controls with the same instrument settings as experimental samples. Consider using automated compensation in BD FACSDiva software but manually verify and adjust if necessary. Consider splitting into multiple panels to reduce complexity and improve compensation accuracy.
Supplementary information
The following supporting information can be downloaded here:
1. Figure S1. FMO, isotype, and unstimulated controls for well-resolved low-frequency markers.
2. Figure S2. Markers with limited signal resolution.
3. Table S1. Antibody dilution and panel assignment.
4. Table S2. Optical configuration of the BD LSRFortessa X-20 used for data acquisition.
5. Table S3. Raw and analyzed data corresponding to the protocol’s Figures.
6. Table S4. Detailed statistical results.
Acknowledgments
During the preparation of this work the authors used ChatGPT only to improve the readability of the manuscript. We would like to thank Françoise Guinet (Institut Pasteur) for support on flow cytometry. The Lledo’s lab is supported by the Life Insurance Company AG2R-La Mondiale (“program AG2R Reunica Vivons Velo”), Agence National de la Recherche (ANR-21-CE15-0003 “Brainity”; ANR-22-CE16-0015 “NeuAgeDep” and 10-LBX-73 REVIVE LLEDO ANR 751886). Lledo’s lab also received a E.U. grant: ERA-NET NEURON 2024 “BODYMOOD”.
The Graphical overview was created with BioRender.com and modified in PowerPoint.
Author contributions
Conceptualization, S.S. and M.S.; Investigation, M.S., S.S., and I.L.; Resources, G.E. and P.M.L.; Writing—original draft, S.S. and M.S.; Writing—review and editing, S.S., M.S., G.E., and I.L.; Funding acquisition, A.C.P. and P.M.L.; Supervision, P.M.L. and A.C.P.
Competing interests
The authors declare no conflicts of interest.
Ethical considerations
Experimental procedures were conducted under the strict regulatory compliance of protocols approved by the Committee for Ethics in Animal Experimentation (CETEA; protocol number DAP200025).
References
- Chen, M., Su, Z. and Xue, J. (2025). Targeting T-cell Aging to Remodel the Aging Immune System and Revitalize Geriatric Immunotherapy. Aging Dis. 17(2): 607. https://doi.org/10.14336/ad.2025.0061
- Jenkins, E., Whitehead, T., Fellermeyer, M., Davis, S. J. and Sharma, S. (2023). The current state and future of T-cell exhaustion research. Oxford Open Immunol. 4(1): e1093/oxfimm/iqad006. https://doi.org/10.1093/oxfimm/iqad006
- Rodriguez, I. J., Lalinde Ruiz, N., Llano León, M., Martínez Enríquez, L., Montilla Velásquez, M. d. P., Ortiz Aguirre, J. P., Rodríguez Bohórquez, O. M., Velandia Vargas, E. A., Hernández, E. D., Parra López, C. A., et al. (2021). Immunosenescence Study of T Cells: A Systematic Review. Front Immunol. 11: e604591. https://doi.org/10.3389/fimmu.2020.604591
- Miggelbrink, A. M., Jackson, J. D., Lorrey, S. J., Srinivasan, E. S., Waibl-Polania, J., Wilkinson, D. S. and Fecci, P. E. (2021). CD4 T-Cell Exhaustion: Does It Exist and What Are Its Roles in Cancer? Clin Cancer Res. 27(21): 5742–5752. https://doi.org/10.1158/1078-0432.ccr-21-0206
- Skordos, I., Demeyer, A. and Beyaert, R. (2021). Analysis of T cells in mouse lymphoid tissue and blood with flow cytometry. STAR Protoc. 2(1): 100351. https://doi.org/10.1016/j.xpro.2021.100351
- Duriancik, D. M. and Hoag, K. A. (2009). The identification and enumeration of dendritic cell populations from individual mouse spleen and Peyer's patches using flow cytometric analysis. Cytometry Part A. 75(11): 951–959. https://doi.org/10.1002/cyto.a.20794
- Smith, J. G., Liu, X., Kaufhold, R. M., Clair, J. and Caulfield, M. J. (2001). Development and Validation of a Gamma Interferon ELISPOT Assay for Quantitation of Cellular Immune Responses to Varicella-Zoster Virus. Clin Diagn Lab Immunol. 8(5): 871–879. https://doi.org/10.1128/cdli.8.5.871-879.2001
- Bigby, M., Wang, P., Fierro, J. F. and Sy, M. S. (1990). Phorbol myristate acetate-induced down-modulation of CD4 is dependent on calmodulin and intracellular calcium. J Immunol. 144(8): 3111–3116. https://doi.org/10.4049/jimmunol.144.8.3111
- Roca, C. P., Burton, O. T., Gergelits, V., Prezzemolo, T., Whyte, C. E., Halpert, R., Kreft, Å., Collier, J., Botzki, A., Spidlen, J., et al. (2021). AutoSpill is a principled framework that simplifies the analysis of multichromatic flow cytometry data. Nat Commun. 12(1): e1038/s41467–021–23126–8. https://doi.org/10.1038/s41467-021-23126-8
- Menees, K. B., Earls, R. H., Chung, J., Jernigan, J., Filipov, N. M., Carpenter, J. M. and Lee, J. K. (2021). Sex- and age‐dependent alterations of splenic immune cell profile and NK cell phenotypes and function in C57BL/6J mice. Immun Ageing. 18(1): e1186/s12979–021–00214–3. https://doi.org/10.1186/s12979-021-00214-3
- Hønge, B. L., Petersen, M. S., Olesen, R., Møller, B. K. and Erikstrup, C. (2017). Optimizing recovery of frozen human peripheral blood mononuclear cells for flow cytometry. PLoS One. 12(11): e0187440. https://doi.org/10.1371/journal.pone.0187440
- Law, J. P., Hirschkorn, D. F., Owen, R. E., Biswas, H. H., Norris, P. J. and Lanteri, M. C. (2009). The importance of Foxp3 antibody and fixation/permeabilization buffer combinations in identifying CD4+CD25+Foxp3+ regulatory T cells. Cytometry Part A. 75(12): 1040–1050. https://doi.org/10.1002/cyto.a.20815
- Tan, C. L., Kuchroo, J. R., Sage, P. T., Liang, D., Francisco, L. M., Buck, J., Thaker, Y. R., Zhang, Q., McArdel, S. L., Juneja, V. R., et al. (2020). PD-1 restraint of regulatory T cell suppressive activity is critical for immune tolerance. J Exp Med. 218(1): e20182232. https://doi.org/10.1084/jem.20182232
- Stroh, C., Cassens, U., Samraj, A. K., Sibrowski, W., Schulze‐Osthoff, K. and Los, M. (2002). The role of caspases in cryoinjury: caspase inhibition strongly improves the recovery of cryopreserved hematopoietic and other cells. FASEB J. 16(12): 1651–1653. https://doi.org/10.1096/fj.02-0034fje
- Gad, E., Rastetter, L., Herendeen, D., Curtis, B., Slota, M., Koehniein, M. and Disis, N. (2013). Optimizing the cryopreservation of murine splenocytes for improved antigen-specific T cell function in ELISPOT. J ImmunoTher Cancer. 1: e1186/2051–1426–1–s1–p211. https://doi.org/10.1186/2051-1426-1-s1-p211
- Carlson, P. M., Mohan, M., Patel, R. B., Birstler, J., Nettenstrom, L., Sheerar, D., Fox, K., Rodriguez, M., Hoefges, A., Hernandez, R., et al. (2021). Optimizing Flow Cytometric Analysis of Immune Cells in Samples Requiring Cryopreservation from Tumor-Bearing Mice. J Immunol. 207(2): 720–734. https://doi.org/10.4049/jimmunol.2000656
Article Information
Publication history
Received: Jun 25, 2026
Accepted: Oct 19, 2026
Available online: Nov 15, 2026
Published: Dec 5, 2026
Copyright
© 2026 The Author(s); This is an open access article under the CC BY license (https://creativecommons.org/licenses/by/4.0/).
How to cite
Song, M. H., Lafosse, I., Eberl, G., Petit, A. C., Lledo, P. M. and Suzzi, S. (2026). Flow Cytometry Assessment of T-Cell Exhaustion Markers and Cytokine Production in Cryopreserved Mouse Splenocytes. Bio-protocol 16(23): e5894. DOI: 10.21769/BioProtoc.5894.

 Download Citation in RIS Format
Category
Immunology > Immune cell staining > Flow cytometry
Cell Biology > Cell staining > Whole cell
Do you have any questions about this protocol?
Post your question to gather feedback from the community. We will also invite the authors of this article to respond.
 Post a Question


