


- Protocols

- Articles and Issues
- For Authors
- About
- Become a Reviewer


Cy5-Fluorescent EMSA for Characterization of G-Quadruplex Structures and DNA–Protein Interactions Without Radioisotopes

(*contributed equally to this work) Published: Vol 16, Iss 23, Dec 5, 2026 DOI: 10.21769/BioProtoc.5892 Views: 16
Reviewed by: Jing LiRavi KumarAnonymous reviewer(s)
 PDF
 Ask a question


Protocol Collections
Comprehensive collections of detailed, peer-reviewed protocols focusing on specific topics



Abstract
The characterization of DNA–protein interactions is fundamental to understanding the molecular mechanisms that regulate genome function. G-quadruplexes (G4s) are non-canonical nucleic acid secondary structures that influence diverse biological processes, including DNA replication, transcription, and DNA repair, primarily through their interactions with G-quadruplex-binding proteins (G4BPs). The electrophoretic mobility shift assay (EMSA) is one of the most widely used methods for studying DNA–protein interactions under native conditions. Conventional EMSA protocols commonly employ radioisotope-labeled oligonucleotides, which require specialized laboratory infrastructure, regulatory compliance, and radioactive waste disposal. Here, we describe a fluorescence-based EMSA protocol that uses commercially synthesized Cy5-labeled oligonucleotides for both the characterization of G4 structures and the analysis of DNA–protein interactions without the use of radioisotopes. G-rich oligonucleotides are folded under potassium-containing conditions and resolved by native polyacrylamide gel electrophoresis (PAGE), enabling discrimination between intramolecular and intermolecular G4 conformations based on their electrophoretic mobility. The folded G4 DNA can subsequently be incubated with purified proteins or cell lysates, and relative protein binding is detected by the reduced electrophoretic mobility of DNA–protein complexes. Fluorescent DNA and DNA–protein complexes are directly visualized using standard fluorescence gel imaging systems, eliminating the need for radioactive probe preparation while simplifying sample handling and data acquisition. This protocol provides a simple, sensitive, and reproducible approach for investigating G-quadruplex structures and their interactions with DNA-binding proteins and can be readily adapted to other structured or linear DNA substrates.
Key features
• Non-radioactive fluorescence-based EMSA using Cy5-labeled oligonucleotides for the analysis of DNA secondary structures and DNA-protein interactions.
• Eliminates the need for radioisotopes, reducing the regulatory burden while simplifying probe handling, storage, and waste disposal.
• Preserves native DNA conformation and DNA-protein complexes, enabling the analysis of non B-DNA structure formation and DNA-protein interaction assays.
• Direct visualization and quantitative analysis of fluorescently labeled DNA and DNA-protein complexes using standard fluorescence gel imaging systems.
Keywords: Non-radioactive EMSA G-quadruplex
Cy5
EMSA
DNA–protein interaction
G-quadruplex-binding proteins (G4BPs)
Relative binding
Fluorescent EMSA
Graphical overview
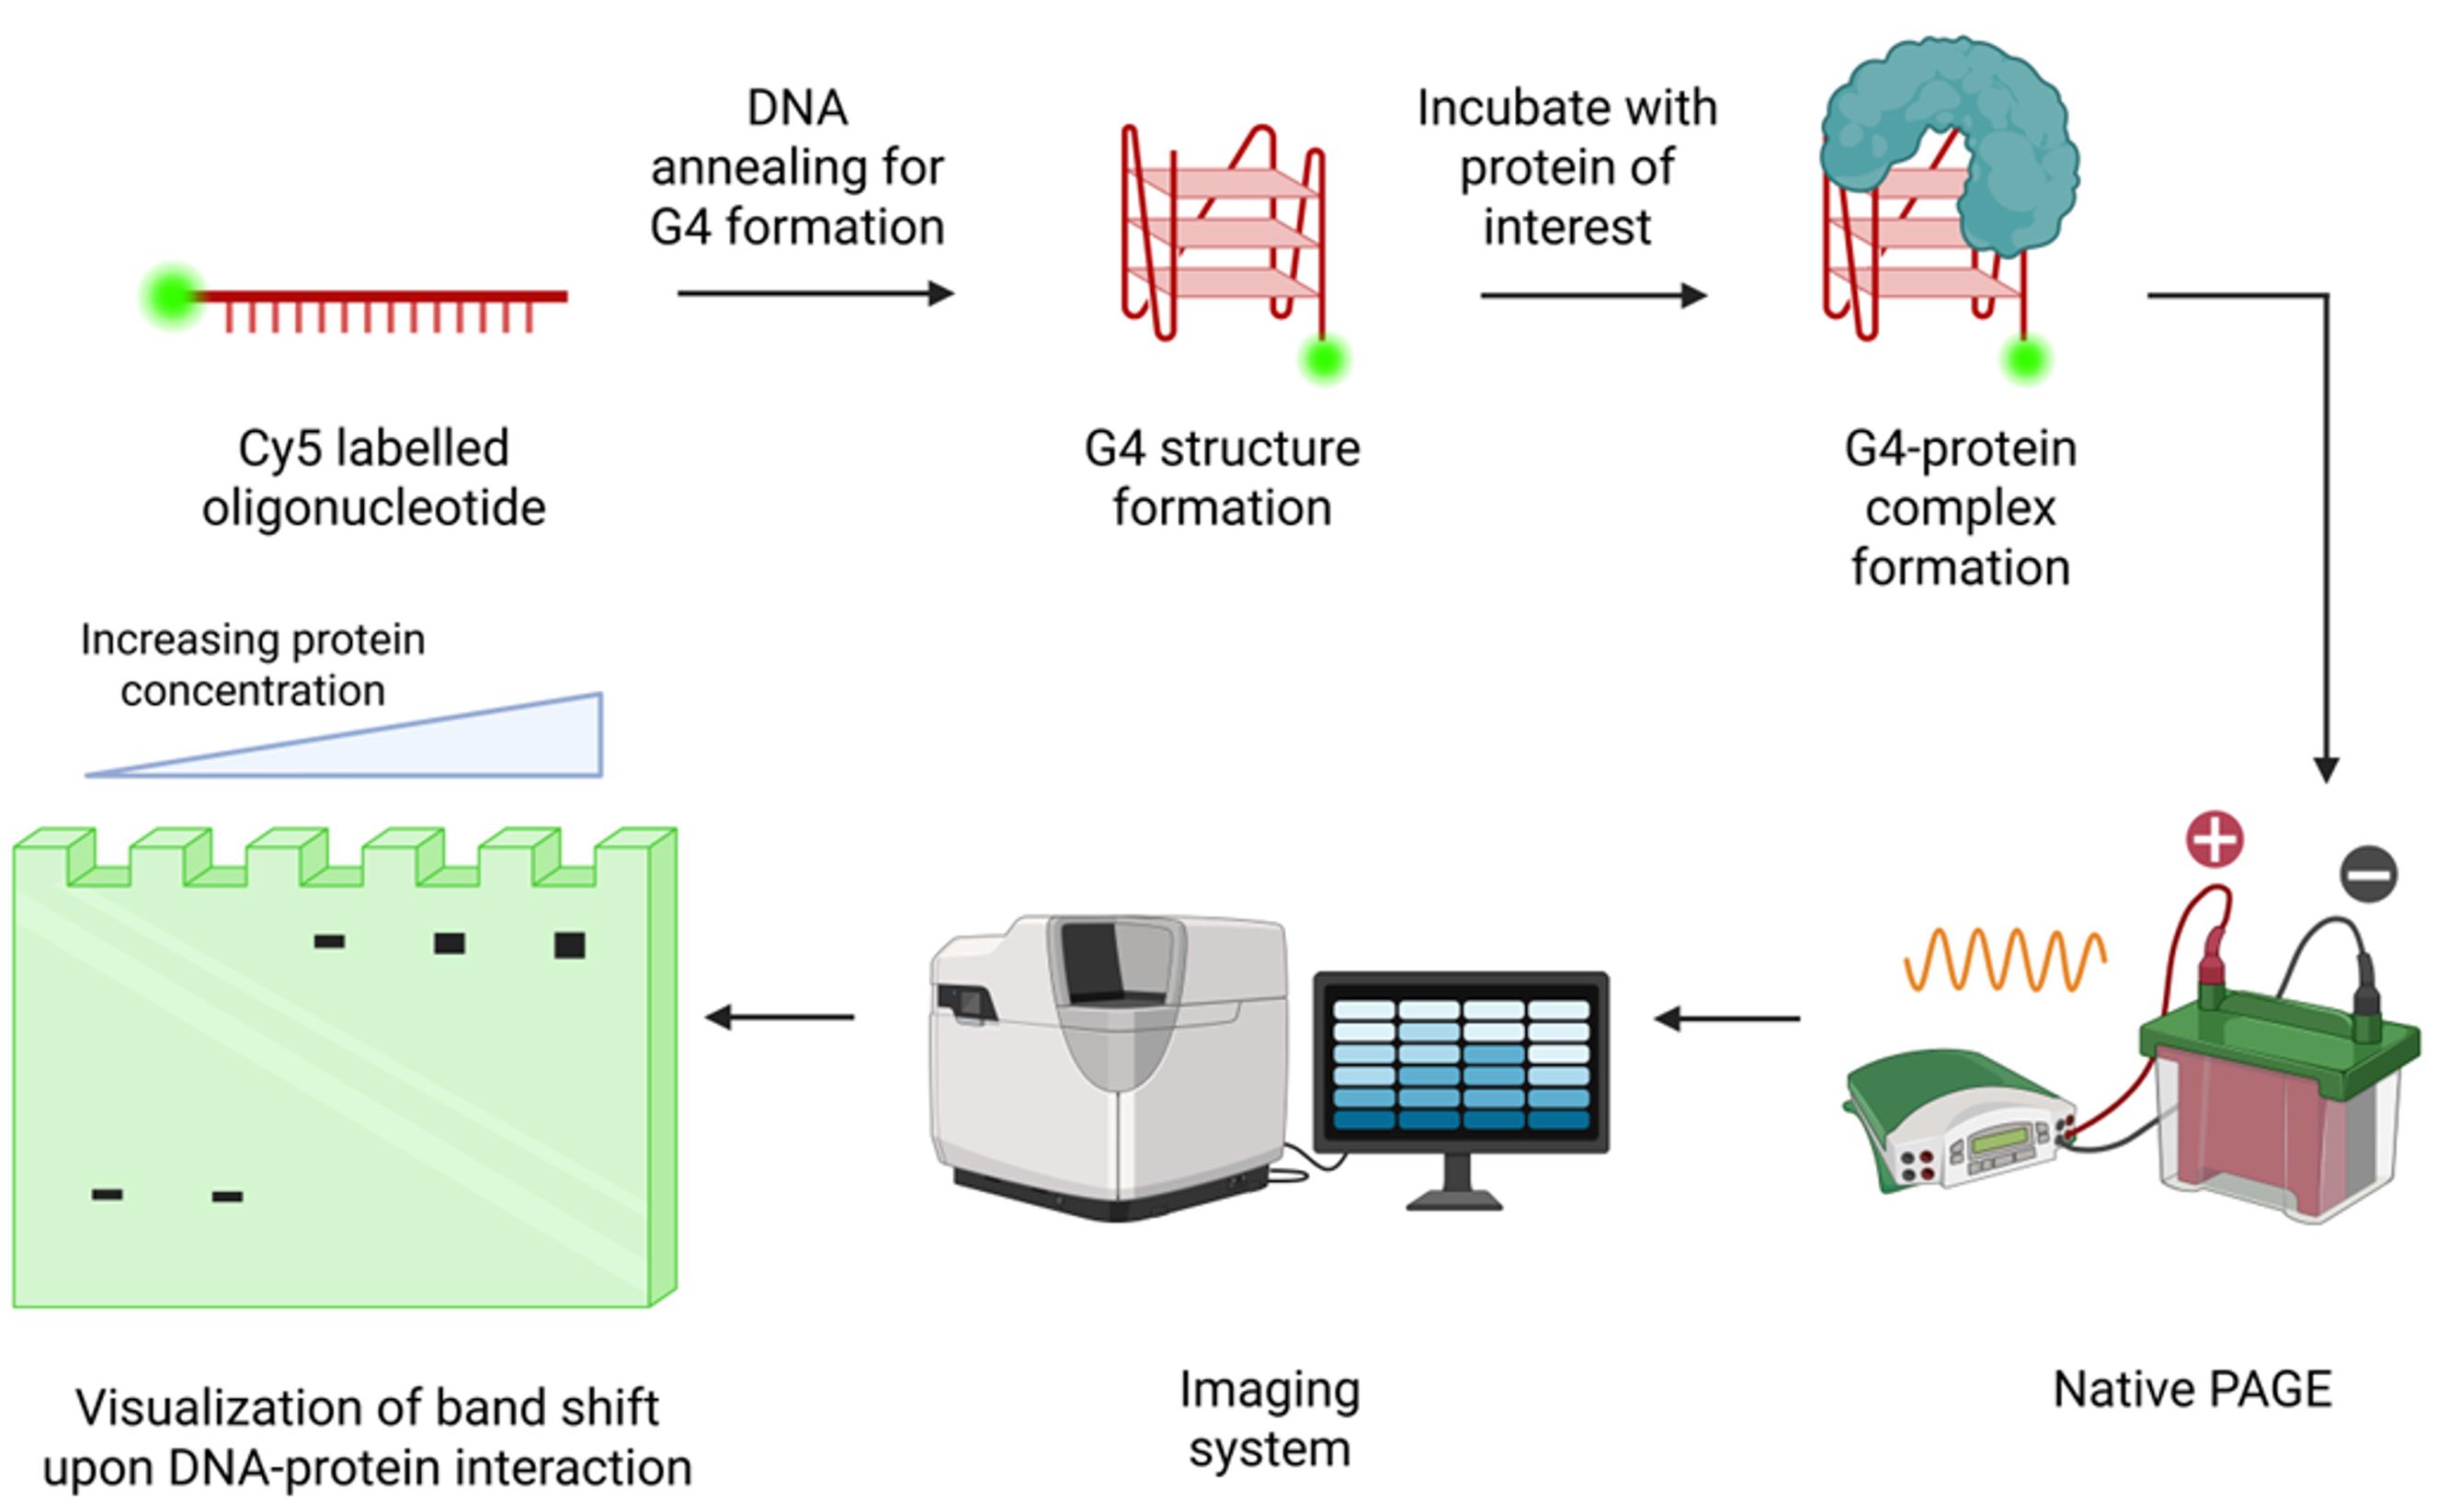
EMSA of Cy5-labeled G-quadruplex (G4) oligonucleotide with protein. The Cy5-labeled oligonucleotide sequences are annealed to form the G4 structure. This G4 form is incubated with the protein of interest or cell lysate and separated by polyacrylamide gel electrophoresis (PAGE) under low voltage at low temperature. The gel is imaged for Cy5 fluorescence using a fluorescence imager to detect mobility-shifted bands resulting from protein–DNA interactions. Created in BioRender, https://BioRender.com/4h275p6.
Background
G quadruplexes (G4s) are non-canonical nucleic acid secondary structures formed by guanine-rich DNA or RNA sequences through Hoogsteen hydrogen bonding. Four guanine bases associate to form a planar G-tetrad, and the stacking of two or more G-tetrads gives rise to a G4 structure [1]. These structures are dynamic and can adopt multiple topologies depending on their sequence composition, loop length, strand orientation, and ionic conditions. Monovalent cations, particularly potassium (K+), stabilize G4 structures by coordinating within the central channel formed by stacked G-tetrads [2].
Over the past two decades, G4s have emerged as important regulators of genome function. Genome-wide studies have demonstrated that G-rich sequences capable of forming G4s are enriched at promoters, telomeres, replication origins, untranslated regions, and other regulatory genomic elements [1,3–5]. G4 formation has been implicated in the regulation of DNA replication, transcription, translation, DNA repair, and epigenetic regulation [6]. Their involvement in these processes has generated considerable interest in exploiting G4 as potential therapeutic targets for cancer and neurodegenerative disorders [7,8].
Many of the biological functions of G4s are mediated through their interactions with G4BPs, which recognize, stabilize, remodel, or resolve these structures [9]. Characterizing these interactions is therefore essential for understanding how G4s influence genome regulation. A variety of biochemical and biophysical techniques have been developed to study DNA–protein interactions [10,11]. Among these, the electrophoretic mobility shift assay (EMSA) remains one of the most widely used methods because of its simplicity, versatility, and ability to directly visualize protein-bound DNA under native conditions. EMSA is routinely employed to evaluate the relative binding or concentration-dependent binding, perform competition assays, and investigate the impact of sequence mutations or DNA structural changes on protein binding [12,13]. Under native electrophoretic conditions, the assay can also resolve distinct DNA conformations, enabling the characterization of both intermolecular and intramolecular G4 structures based on their differential electrophoretic mobility.
Conventional EMSA protocols frequently employ radioactively labeled oligonucleotides generated using T4 polynucleotide kinase (T4 PNK) and γ-32P ATP because of their high sensitivity [14]. However, radioactive assays require specialized laboratory infrastructure, regulatory compliance, isotope handling expertise, and dedicated waste disposal procedures. Furthermore, exposure to radioactivity poses potential health and safety risks and requires stringent handling practices to minimize contamination and accidental exposure. In addition, the limited shelf life of radioisotopes necessitates repeated probe preparation. Fluorescence-based detection provides an effective alternative that eliminates these constraints while enabling direct visualization of DNA and DNA–protein complexes using standard fluorescence imaging systems.
Several fluorescent dyes, including 6-carboxyfluorescein (6-FAM) [15], tetramethylrhodamine (TAMRA) [16], cyanine 3 (Cy3) [17], cyanine 5 (Cy5) [18], and Alexa Fluor dyes (Alexa Fluor 488, 647) [19,20] have been successfully used for fluorescence-based EMSA. In this protocol, Cy5-labeled oligonucleotides are folded under defined ionic conditions, incubated with the protein of interest where required, and resolved by native polyacrylamide gel electrophoresis (PAGE). The assay enables direct visualization of free DNA, intramolecular and intermolecular G4 conformations, and DNA–protein complexes using standard fluorescence imaging systems (Graphical overview). By eliminating the need for radioisotopes, this protocol provides a simple, safe, and broadly accessible approach for investigating G-quadruplex structures and their interactions with DNA-binding proteins.
Materials and reagents
Biological materials
1. Purified protein of interest, protein extract, or cell lysate (as appropriate)
2. E. coli DH5α
3. E. coli Rosetta
Oligonucleotides
1. Cy5-labeled DNA oligonucleotides (commercially synthesized or labeled in-house)
Reagents
1. Tris base (Himedia, catalog number: MB029)
2. Boric acid (Himedia, catalog number: MB077)
3. EDTA (Himedia, catalog number: MB011)
4. Potassium chloride (KCl) (Himedia, catalog number: MB043)
5. Sodium chloride (NaCl) (Himedia, catalog number: GRM853)
6. Magnesium chloride hexahydrate (MgCl2·6H2O) (Himedia, catalog number: MBO40)
7. Dithiothreitol (DTT) (Himedia, catalog number: MB070)
8. Acrylamide (Himedia, catalog number: MB068)
9. N, N’-Methylenebisacrylamide (Himedia, catalog number: MB005)
10. Ammonium persulfate (APS) (Himedia, catalog number: MB003)
11. Glycerol (Himedia, catalog number: MB060)
12. Zinc chloride (ZnCl2) (Himedia, catalog number: TC184)
13. TEMED (Himedia, catalog number: MB026)
14. Purple loading dye (NEB, catalog number: B7025S)
15. Ultrapure water
16. Poly(deoxyinosic-deoxycytidylic) acid sodium salt (Sigma-Aldrich, catalog number: P4929)
Solutions
1. 5× Tris-borate EDTA (TBE) buffer (see Recipes)
2. 40% acrylamide/bis-acrylamide solution (29:1) (see Recipes)
3. 10% ammonium persulfate (APS) (see Recipes)
4. 3 M potassium chloride (KCl) (see Recipes)
5. Tris-EDTA (TE) buffer (see Recipes)
6. 10× protein binding buffer (see Recipes)
7. 50% glycerol (see Recipes)
8. 2 M Tris-HCl (pH 7.5) (see Recipes)
9. 5 M sodium chloride (NaCl) (see Recipes)
10. 0.5 M EDTA (pH 8.0) (see Recipes)
11. 0.1 M DTT (see Recipes)
12. 0.1 M ZnCl2 (see Recipes)
13. 1 M MgCl2 (see Recipes)
14. 1 M KCl (see Recipes)
15. Native polyacrylamide gel (8% or 15%) (see Recipes)
Recipes
1. 5× TBE buffer
| Reagent | Final concentration | Quantity or volume |
|---|---|---|
| Tris base | 445 mM | 54 g |
| Boric acid | 445 mM | 27.5 g |
| 0.5 M EDTA (pH 8.0) | 10 mM | 20 mL |
| Ultrapure water | ----- | To 1 L |
Dissolve Tris base and boric acid in approximately 800 mL of ultrapure water. Add EDTA, adjust the volume to 1 L, mix thoroughly, and store at 4 °C for up to 6 months.
2. 40% acrylamide/bis-acrylamide solution (29:1)
| Reagent | Quantity or volume |
|---|---|
| Acrylamide | 77.32 g |
| N, N’-Methylenebisacrylamide | 2.68 g |
| Ultrapure water | To 200 mL |
Dissolve completely, filter through a 0.45-μm filter, protect from light, and store at 4 °C for up to 1 month (or prepare freshly).
3. 10% APS
| Reagent | Final concentration | Quantity or volume |
|---|---|---|
| APS | 10% (w/v) | 1 g |
| Ultrapure water | ----- | To 10 mL |
Prepare fresh before use or aliquot and store at -20 °C for up to 1 month. Avoid repeated freeze/thaw cycles.
4. 3 M KCl
| Reagent | Final concentration | Quantity or volume |
|---|---|---|
| KCl | 3 M | 22.37 g |
| Ultrapure water | ---- | To 100 mL |
Store at room temperature for up to 6 months.
5. TE buffer
| Reagent | Final concentration | Quantity or volume |
|---|---|---|
| 2 M Tris-HCl (pH 7.5) | 100 mM | 0.5 mL |
| 0.5 M EDTA (pH 8.00) | 10 mM | 0.2 mL |
| Ultrapure water | ----- | To 10 mL |
Store at room temperature for up to 6 months.
6. 10× protein binding buffer
| Reagent | Final concentration | Quantity or volume |
|---|---|---|
| 2 M Tris-HCl (pH 7.5) | 250 mM | 0.125 mL |
| 5 M NaCl | 500 mM | 0.1 mL |
| 1 M MgCl2 | 10 mM | 0.01 mL |
| Glycerol (100%) | 50% (v/v) | 0.5 mL |
| ZnCl2 (0.1 M) | 0.1 mM | 1 μL |
| Ultrapure water | --- | To 1 mL |
Aliquot and store at -20 °C for 2 months.
7. 50% glycerol
| Reagent | Quantity or volume |
|---|---|
| Glycerol | 500 μL |
| Ultrapure water | 500 μL |
Mix thoroughly and store at room temperature for up to 6 months.
8. 2 M Tris-HCl (pH 7.5)
| Reagent | Final concentration | Quantity or volume |
|---|---|---|
| Tris base | 2 M | 12.12 g |
| Concentrated HCl | --- | Adjust to pH 7.5 |
| Ultrapure water | ---- | To 50 mL |
Adjust the pH to 7.5 using concentrated HCl and make up to the final volume. Store at room temperature for up to 6 months.
9. 5 M NaCl
| Reagent | Final concentration | Quantity or volume |
|---|---|---|
| NaCl | 5 M | 14.61 g |
| Ultrapure water | ---- | To 50 mL |
Store at room temperature for up to 6 months.
10. 0.5 M EDTA (pH 8.0)
| Reagent | Final concentration | Quantity or volume |
|---|---|---|
| EDTA disodium salt | 0.5 M | 9.31 g |
| NaOH | ---- | Adjust to pH 8.0 |
| Ultrapure water | --- | To 50 mL |
Adjust the pH to 8.0 with NaOH until EDTA dissolves completely. Bring to the final volume and store at room temperature for up to 6 months.
11. 0.1 M DTT
| Reagent | Final concentration | Quantity or volume |
|---|---|---|
| DTT | 0.1 M | 7.72 mg |
| Ultrapure water | --- | To 0.5 mL |
DTT is light-sensitive. Prepare small aliquots, store at -20 °C protected from light, and use within 1 month. Avoid repeated freeze/thaw cycles.
12. 0.1 M ZnCl2
| Reagent | Final concentration | Quantity or volume |
|---|---|---|
| Anhydrous ZnCl2 | 0.1 M | 136.4 mg |
| Ultrapure water | --- | To 10 mL |
Store at room temperature for up to 6 months.
13. 1 M MgCl2
| Reagent | Final concentration | Quantity or volume |
|---|---|---|
| MgCl2 hexahydrate | 1 M | 2.03 g |
| Ultrapure water | --- | To 10 mL |
Store at room temperature for up to 6 months.
14. 1 M KCl
| Reagent | Final concentration | Quantity or volume |
|---|---|---|
| 3 M KCl solution | 1 M | 3.33 mL |
| Ultrapure water | --- | To 10 mL |
Store at room temperature up to 6 months.
15. Native polyacrylamide gel (8% or 15%)
| Reagent | Final concentration | Quantity or volume |
|---|---|---|
| 5× TBE | 0.5× | 5 mL |
| 40% acrylamide | 8%/15% | 10/18.75 mL |
| 3 M KCl | 0.1 M | 1.66 mL |
| 10% APS | 0.1% | 0.5 mL |
| TEMED | 0.1% | 50 μL |
| Ultrapure water | To 50 mL |
Laboratory supplies
1. Laboratory wipes (KimtechTM Kimwipes or equivalent)
2. 70% (v/v) ethanol
3. Adjustable micropipettes (1,000, 200, 20, and 2 μL) (Eppendorf or equivalent)
4. Sterile pipette tips (1,000, 200, 20 μL) (Tarsons, catalog numbers: 521020B, 521010Y, and 521000 or equivalent)
5. Disposable syringes (5 or 10 mL)
6. Wash bottle (Tarsons, catalog number: 620080 or equivalent)
7. Glass plates, spacers, and combs for native polyacrylamide gel casting (BioBEE Tech, SDS-2 or equivalent)
8. 1.5 mL microcentrifuge tubes
9. 0.2 mL PCR tubes (for use in the thermal cycler)
10. Ice bucket and crushed ice
11. Disposable gloves and laboratory protective equipment
Equipment
1. Fluorescence gel imaging system capable of detecting Cy5 fluorescence (Q9 Alliance imaging system, UVITEC, Cambridge, UK or equivalent)
2. Thermal cycler (Bio-Rad or equivalent)
3. BIOBEE Vertical Gel (PAGE) Electrophoresis System -MIDI (14 cm width × 17 cm height; well capacity 80 μL) or equivalent
4. Microcentrifuge (SpinwinTM MC 100, Tarsons or equivalent)
5. Electrophoresis power supply
6. Analytical balance
7. pH meter
8. Magnetic stirrer with stir bars
9. Refrigerator (4 °C)
10. Freezer (-20 °C)
Software and datasets
1. ImageJ (Wayne Rasband and contributors National Institutes of Health, USA, version 1.54g) (https://imagej.net/ij/index.html)
Procedure
A. Preparation and folding of Cy5-labeled and unlabeled oligonucleotides
The Cy5-labeled oligonucleotides were custom synthesized and procured from Sigma-Aldrich. The synthesis scale for the oligonucleotides is 200 nmols with HPLC purification. Though we have not used the in-house Cy5 labeling, there are several Cy5 labeling kits available, such as Label IT® Nucleic Acid Labeling kit, Cy5 (Mirus Bio, catalog number: MIR 3725) and ReadiLinkTM Cy5 Oligo and ssDNA Labeling kit (AAT Bioquest; catalog number: 17488). These are obtained in lyophilized form and stored at -20 °C. The Cy5-labeled oligonucleotides are folded in the presence of potassium ions (K+) to promote the formation and stabilization of G4 structures prior to electrophoretic analysis or DNA-protein binding assays. The G4-forming sequence used here is 5′-Cy5-CCTTCGGGAGGGGCGGGGATGAGGGGCGGA-3′. G4 formation is confirmed by CD spectroscopy (data not shown). The guanine stretches are mutated to other nucleotides to prevent G4 formation. The mutant sequence used here is 5′-Cy5-CCTTCCCAAGTATCGATAATGAGAAACGGA-3′. The oligonucleotides are labeled preferentially at the terminal end to avoid any interference with protein binding to the structured G4 oligonucleotide. Terminal labeling generally does not affect the folding of G4 topologies.
1. Briefly centrifuge the lyophilized Cy5-labeled oligonucleotides to collect the contents at the bottom of the tube.
2. Resuspend each oligonucleotide in TE buffer to a final concentration of 100 μM (100 pmol/μL), according to the manufacturer’s instructions. Mix thoroughly by gentle pipetting until the oligonucleotides are completely dissolved.
Note: Avoid vigorous vortexing to minimize DNA shearing.
3. Aliquot the oligonucleotide solution into small volumes and store at -20 °C, protected from light.
Note: Cy5 is light-sensitive. Minimize exposure to light during sample preparation and storage. Small aliquots are recommended to avoid repeated freeze/thaw cycles.
4. For each reaction, add 75 pmol of DNA.
Note: Make a master mix for five reactions, using 375 pmol of DNA (75 pmol × 5 reactions), add 2 μL of 1 M KCl (final concentration 100 mM KCl), and bring the volume to 20 μL with TE buffer.
5. For the competition assay, unlabeled DNA (5′- CCTTCGGGAGGGGCGGGGATGAGGGGCGGA -3′) was custom-synthesized and procured from Barcode Biosciences. Unlabeled oligonucleotides were folded separately.
6. Use 18.75, 37.5, 75, 150, and 300 pmol of unlabeled DNA to compete with 75 pmol of labeled DNA.
7. For the competition assay, prepare a master mix by adding 6 μL of 100 μM DNA and 1 μL of 1 M KCl and bring the volume to 10 μL with TE buffer. This gives a final DNA concentration of 60 pmol/μL.
8. Fold the oligonucleotide in a thermal cycler using the following program: denaturation, 95 °C for 5 min; annealing, slow cooling at 0.5 °C/min until 25 °C; hold, 25 °C until use.
9. Briefly centrifuge the tubes and keep the folded oligonucleotides on ice until use.
Pause point: Folded oligonucleotides may be stored at 4 °C for up to 24 h.
B. Cloning, protein expression, and purification
The human CTCF Zinc-finger domain 3–7 (ZF 3–7, residues 320-464) is cloned into the pMal-C2X vector with the MBP tag. E. coli DH5α competent cells are transformed with the ligation mixture and selected on appropriate antibiotics. The positive clones are confirmed by Sanger sequencing.
The protein is expressed and purified from E. coli Rosetta cells. The procedure for protein expression and purification is adapted from Hashimoto et al. [21], except that an MBP-tagged protein is used instead of a GST-tagged protein. Zinc is included in the protein induction and purification buffers to enable Zn2+ coordination during protein folding (specific to zinc-finger-containing proteins). This is a specific requirement for the protein used in the study. Researchers should adjust the ingredients of the buffers or solutions according to the specific conditions compatible with the protein of interest. The protein is purified by amylose affinity chromatography and analyzed by SDS-PAGE (data not shown). The molecular weight of the protein is 59 kDa.
The protein sequence is as follows:
RPHKCPDCDMAFVTSGELVRHRRYKHTHEKPFKCSMCDYASVEVSKLKRHIRSHTGERPFQCSLCSYASRDTYKLKRHMRTHSGEKPYECYICHARFTQSGTMKMHILQKHTENVAKFHCPHCDTVIARKSDLGVHLRKQHSYIE.
C. Preparation of native polyacrylamide gels
An 8% or 15% native polyacrylamide gel is prepared using MIDI gel plates. The gel and running buffer both contain 100 mM KCl to preserve G-quadruplex structures and DNA–protein complexes during electrophoresis.
1. Clean glass plates, spacers, and combs thoroughly with distilled water followed by 70% ethanol. Wipe the glass plates with lint-free laboratory tissue to remove residual dust and contaminants.
2. Assemble the gel casting apparatus according to the manufacturer’s instructions, ensuring the spacers are properly aligned to prevent leaking.
Note: If necessary, the sides of the casting assembly may be additionally sealed using laboratory tape to minimize leaking during gel casting (Figure 1).
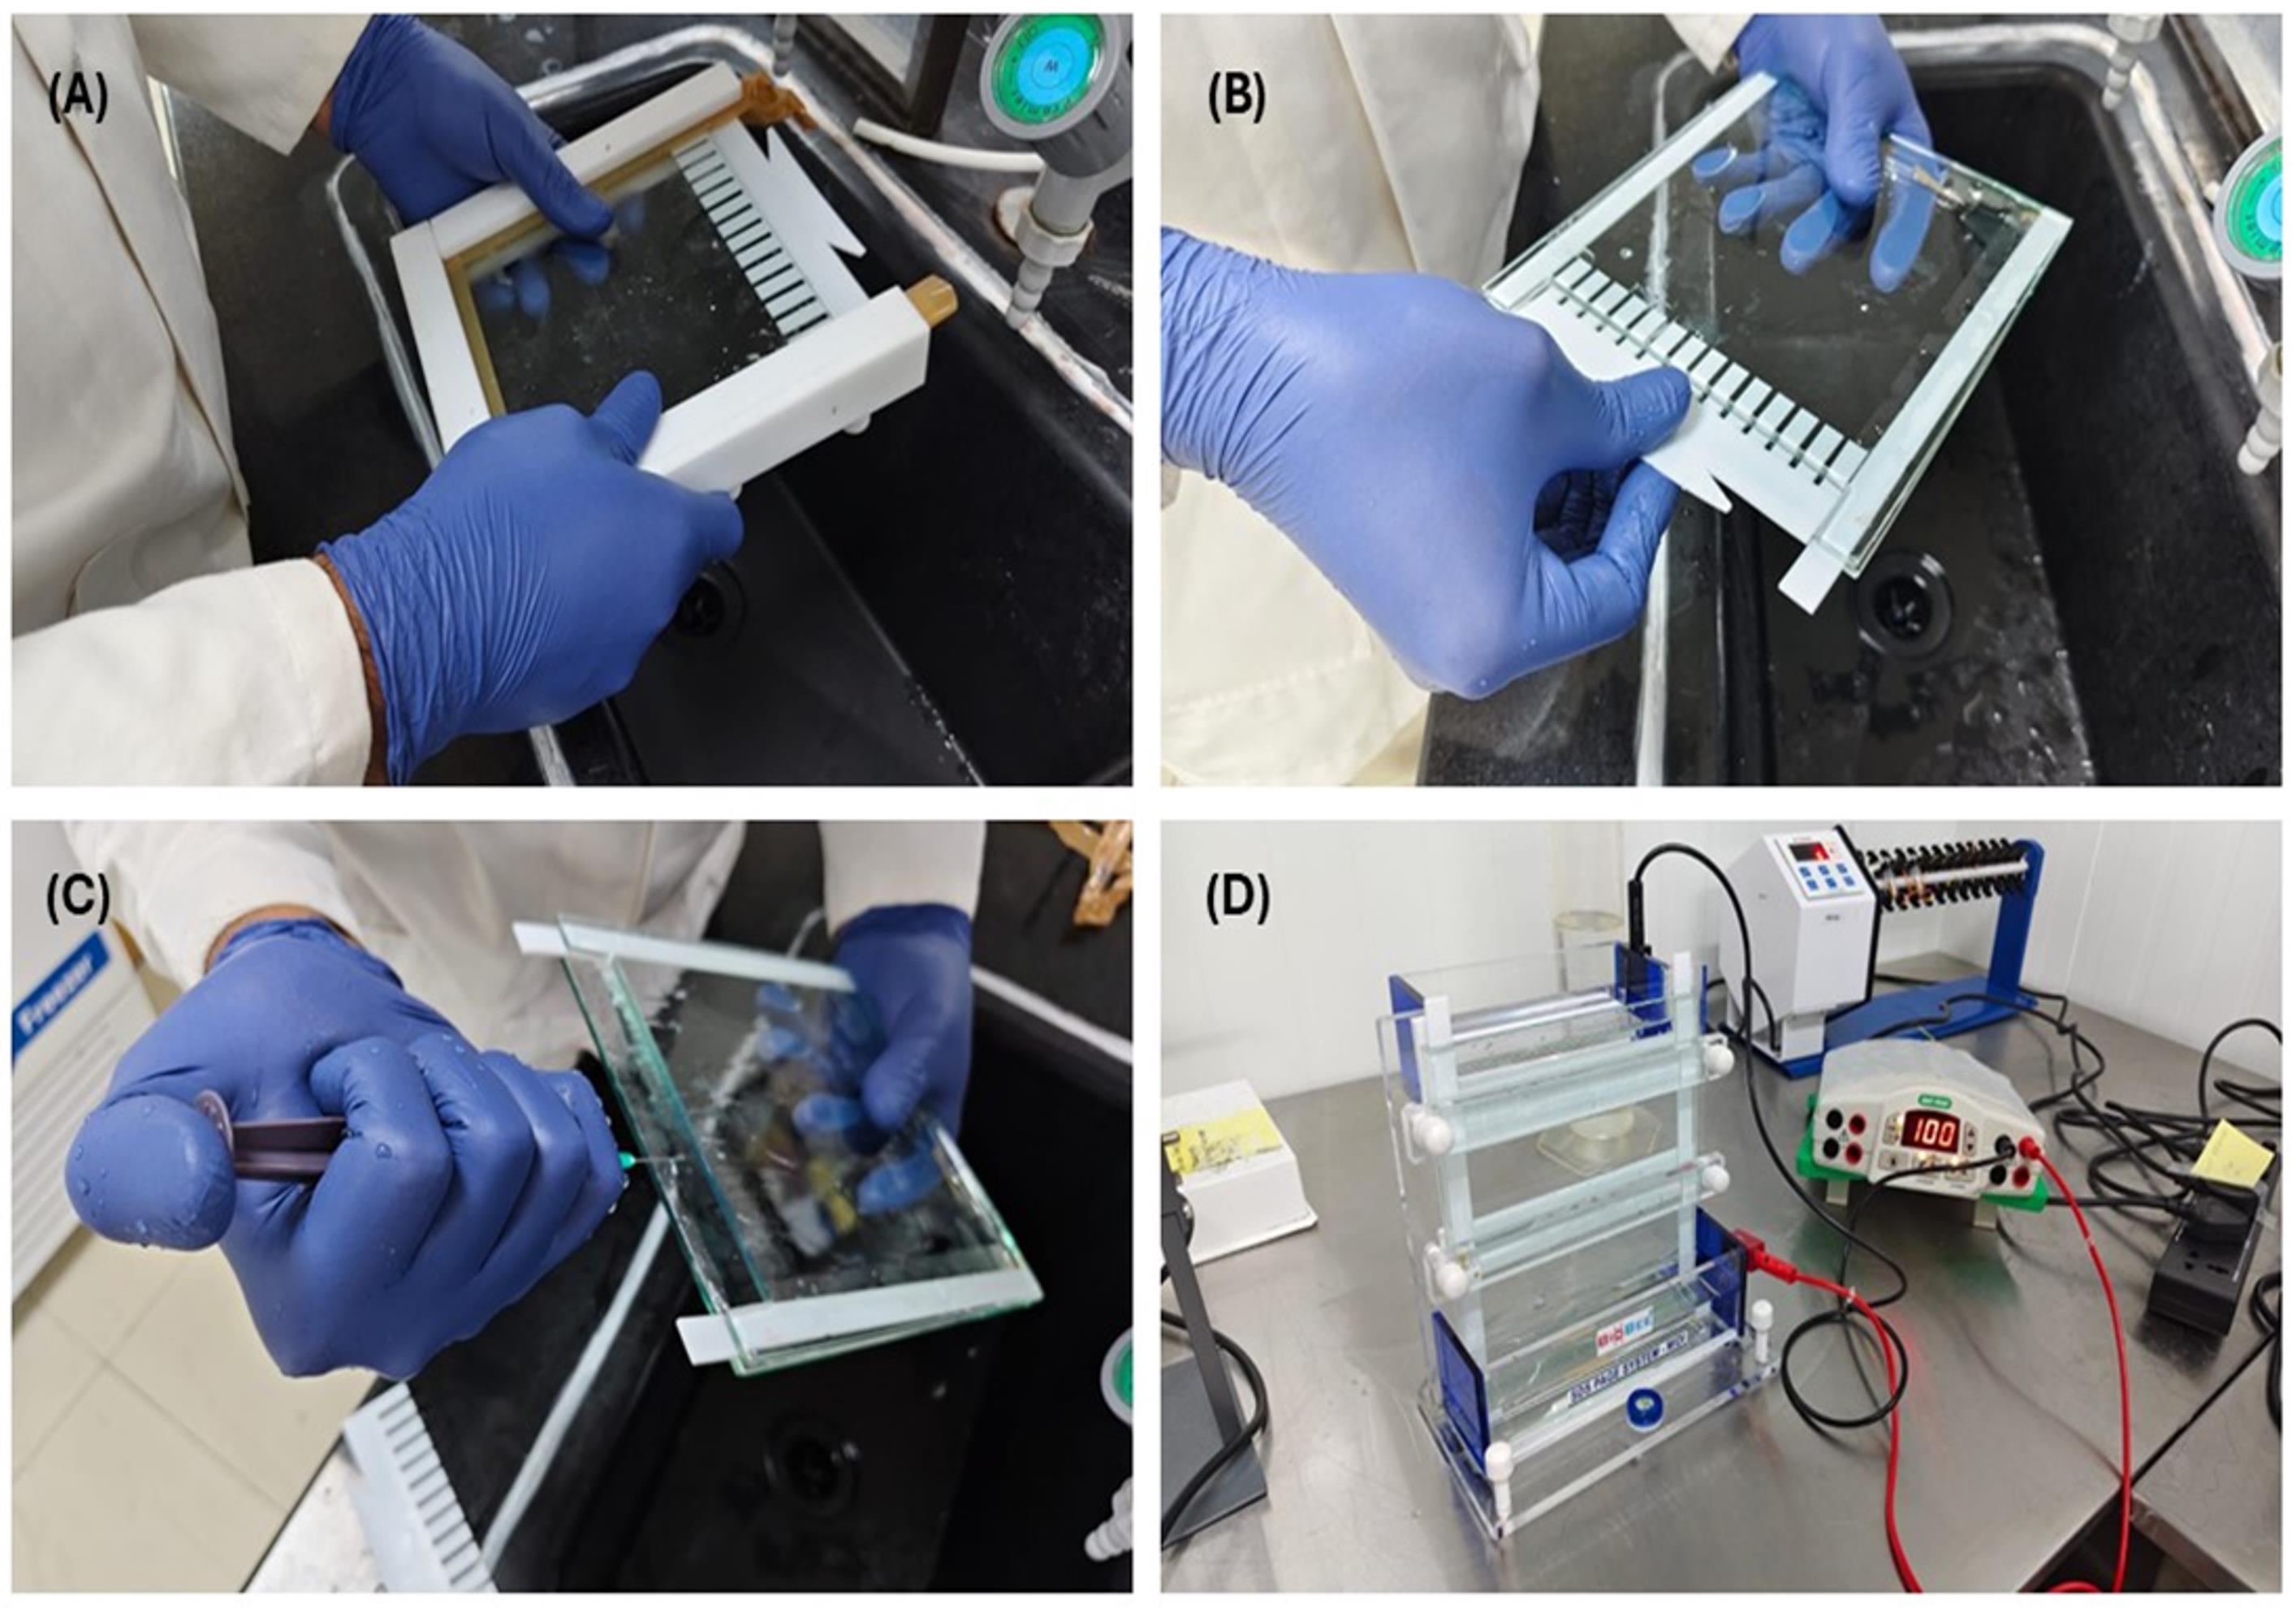
Figure 1. Preparation of the native polyacrylamide gel for Cy5 fluorescence-based EMSA. Representative images showing the assembly of a MIDI gel casting system for native polyacrylamide gel electrophoresis. (A) Assembly of the glass plates, spacers, and comb using the casting frame. (B) Removal of the comb after gel polymerization. (C) Washing of the wells to remove residual acrylamide. (D) Assembly of the gel in the vertical electrophoresis apparatus for pre-running and electrophoretic separation of G4 structures and DNA–protein complexes under native conditions.
3. Prepare 50 mL of 8% or 15% native polyacrylamide gel (sufficient for one MIDI gel) using the reagents listed in Recipe 15.
Note: Add APS and TEMED immediately before pouring the gel.
4. Mix the solution thoroughly without introducing bubbles. Add APS and TEMED and mix again gently.
5. Pour the gel solution between the glass plates and immediately insert the comb. Allow the gel to polymerize for ~45 min at room temperature.
6. Carefully remove the comb and immediately rinse each well thoroughly with 0.5× TBE (running buffer) containing 100 mM KCl using a syringe to remove residual unpolymerized acrylamide.
7. Assemble the gel in the electrophoresis apparatus and fill both the upper and lower chambers with 0.5× TBE with 100 mM KCl. Pre-run the gel at 100 V for 30 min at 4 °C before loading the samples.
8. Immediately before sample loading, rinse the wells once more with fresh running buffer to remove any residual acrylamide.
Note: Maintaining 100 mM KCl in both the gel and the running buffer is essential for preserving G4 structures during electrophoresis.
D. Characterization of G4 structures by native PAGE
Native PAGE enables the resolution of different G4 conformations based on their electrophoretic mobility. Increasing the concentration of G-rich oligonucleotides can promote the formation of intermolecular G4s, allowing both intramolecular and intermolecular species to be resolved within the same gel. G stretches are mutated to other nucleotides to hinder G4 formation. The G4-mutated sequence was used as a control (Figure 2A).
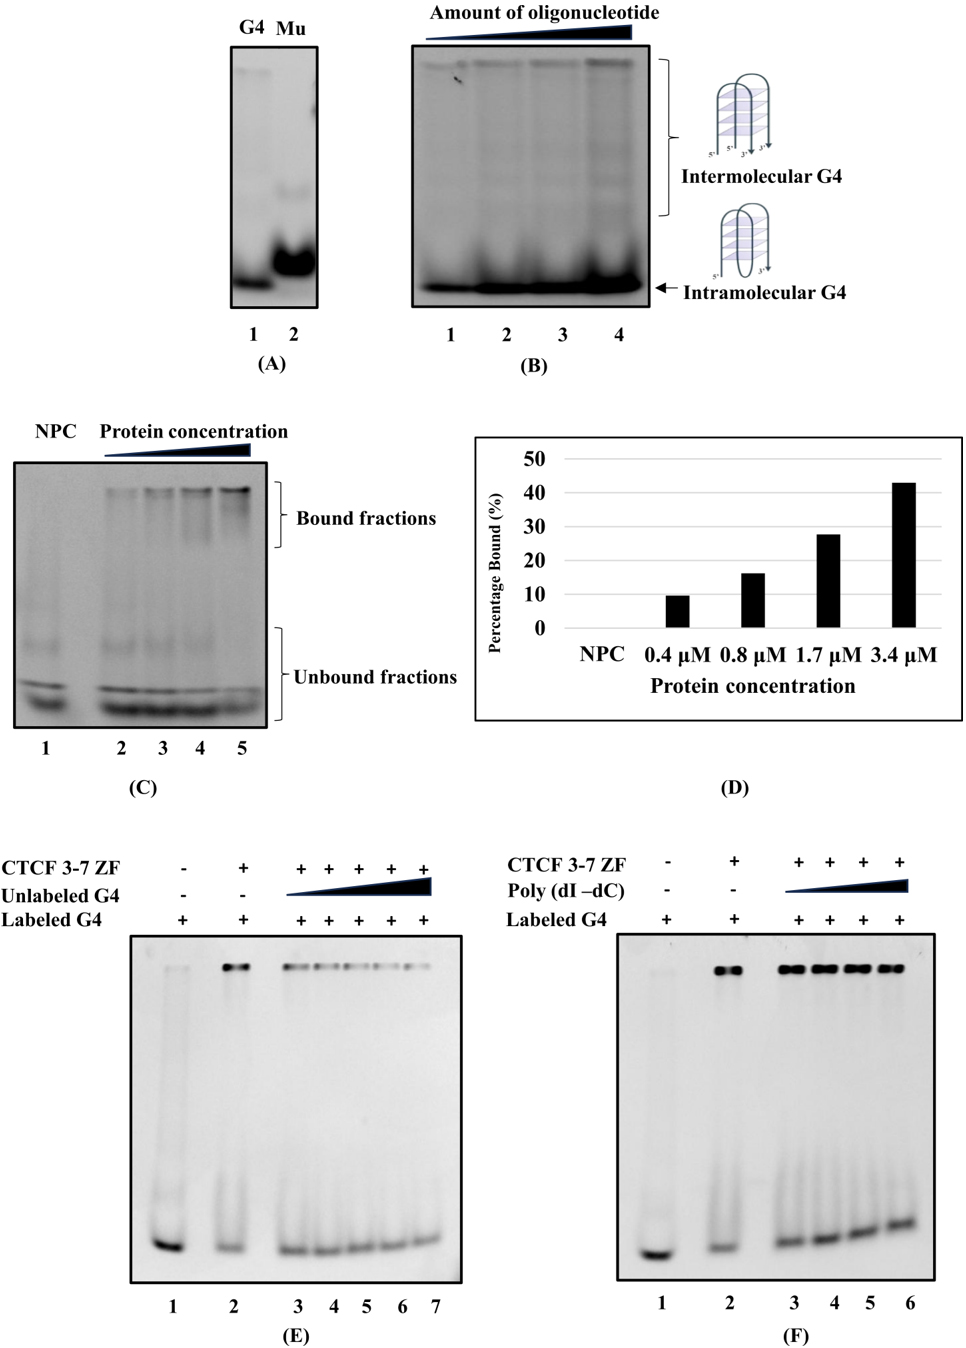
Figure 2. Mobility shift assay using polyacrylamide gel electrophoresis to visualize DNA secondary structures and protein–DNA interactions. (A) 15% native gel showing the G4-forming (lane 1) and non-G4-forming mutant (lane 2) oligonucleotides. (B) 15% native gel showing intramolecular and intermolecular G4s. The amounts of oligonucleotide loaded in lanes 1–4 were 100, 200, 300, and 400 pmol, respectively. (C) 8% native gel showing the binding of CTCF ZF (3–7) to G4 DNA. Lane 1: No-protein control (NPC); lanes 2–5: 0.4, 0.8, 1.7, and 3.4 μM CTCF ZF (3–7), respectively. (D) Quantification of panel C, showing a concentration-dependent increase in the protein-bound fraction. (E) Competition between labeled and unlabeled G4 DNA. Lane 1: no-protein control; lane 2: protein control; lanes 3–7: increasing amounts of unlabeled G4 DNA (18.75, 37.5, 75, 150, and 300 pmol, respectively). (F) Competition between labeled G4 DNA (approximately 0.75 μg) and poly (dI-dC) with increasing concentrations. Lane 1: no-protein control; lane 2: protein control; lanes 3–6: increasing amounts of poly(dI-dC) as a nonspecific competitor (0.75, 1.5, 3, and 6 μg, respectively).
1. Prepare the reactions as shown in Table 1 and Table 2.
Table 1. Reaction setup for analyzing G4 and mutant G4
| Oligos | Volume taken from stock | KCl (1 M) | TE buffer | Final volume | |
|---|---|---|---|---|---|
| 1 | G4 | 100 pmol (1 μL) | 2 μL | 17 μL | 20 μL |
| 2 | Mutant | 100 pmol (1 μL) | 2 μL | 17 μL | 20 μL |
Table 2. Reaction setup for analysis of G4 conformations
| Oligos | Oligo | KCl (1 M) | TE buffer | Final volume | |
|---|---|---|---|---|---|
| 1 | G4 | 100 pmol (1 μL) | 2 μL | 17 μL | 20 μL |
| 2 | G4 | 200 pmol (2 μL) | 2 μL | 16 μL | 20 μL |
| 3 | G4 | 300 pmol (3 μL) | 2 μL | 15 μL | 20 μL |
| 4 | G4 | 400 pmol (4 μL) | 2 μL | 14 μL | 20 μL |
2. Fold each oligonucleotide in a thermal cycler as described in section A. Proceed to section E.
E. Electrophoretic mobility shift assay (EMSA) for DNA–protein interactions
Folded Cy5-labeled G4 DNA is incubated with increasing concentrations of protein (purified protein of interest) and resolved on native polyacrylamide gels. DNA–protein complex formation is detected by reduced electrophoretic mobility relative to free DNA. For EMSA, the reaction setup includes a no-protein control where the protein is not added, followed by adding an increasing amount of protein. For competitive assays, unlabeled DNA and poly (dI-dC) were used in excess to validate the specificity of the interaction. Lower-percentage gels allow the migration of protein–DNA complexes, whereas higher-percentage gels are used to analyze the migration of different G4 conformations.
1. Fold the Cy5-labeled oligonucleotide as described in section A.
2. Prepare the binding reactions according to Table 3.
Table 3. Reaction setup for analysis of G4–protein complex
| Lane | 10× protein binding buffer (μL) | Folded Cy5-labeled DNA (75 pmol*) (μL) | 1 M KCl | 0.1 M DTT (μL) | Protein (μg) | Nuclease-free water |
|---|---|---|---|---|---|---|
| 1 | 2 | 4 | 2 | 0.2 | 0 | To 20 μL |
| 2 | 2 | 4 | 2 | 0.2 | 0.5 | To 20 μL |
| 3 | 2 | 4 | 2 | 0.2 | 1 | To 20 μL |
| 4 | 2 | 4 | 2 | 0.2 | 2 | To 20 μL |
| 5 | 2 | 4 | 2 | 0.2 | 4 | To 20 μL |
*Equivalent to approximately 750 ng of the oligonucleotide used in this study.
Note: Add KCl (100 mM) and DTT (1 mM) to the reaction mixture.
Table 4. Reaction setup for analyzing competition between labeled and unlabeled DNA
| Lane | 10× protein binding buffer (μL) | Unlabeled folded G4 (μL) | Folded Cy5-labeled DNA (75 pmol*) (μL) | 1 M KCl | 0.1 M DTT (μL) | Protein (μg) | Nuclease-free water |
|---|---|---|---|---|---|---|---|
| 1 | 2 | 0 | 4 | 2 | 0.2 | 0 | To 20 μL |
| 2 | 2 | 0 | 4 | 2 | 0.2 | 4 | To 20 μL |
| 3 | 2 | 0.31 | 4 | 2 | 0.2 | 4 | To 20 μL |
| 4 | 2 | 0.625 | 4 | 2 | 0.2 | 4 | To 20 μL |
| 5 | 2 | 1.25 | 4 | 2 | 0.2 | 4 | To 20 μL |
| 6 | 2 | 2.5 | 4 | 2 | 0.2 | 4 | To 20 μL |
| 7 | 2 | 5 | 4 | 2 | 0.2 | 4 | To 20 μL |
Note: For the competition assay, unlabeled DNA (5’-CCTTCGGGAGGGGCGGGGATGAGGGGCGGA -3’) was custom-synthesized and procured from Barcode Biosciences. Refer to Table 4.
Table 5. Reaction setup for analyzing competition between labeled DNA and poly(dI-dC)
| Lane | 10× protein binding buffer (μL) | Poly(dI-dC) (μL) (0.5 μg/μL) | Folded Cy5-labeled DNA (75 pmol*) (μL) | 1 M KCl | 0.1 M DTT (μL) | Protein (μg) | Nuclease-free water |
|---|---|---|---|---|---|---|---|
| 1 | 3 | 0 | 4 | 3 | 0.3 | 0 | To 30 μL |
| 2 | 3 | 0 | 4 | 3 | 0.3 | 4 | To 30 μL |
| 3 | 3 | 1.5 | 4 | 3 | 0.3 | 4 | To 30 μL |
| 4 | 3 | 3 | 4 | 3 | 0.3 | 4 | To 30 μL |
| 5 | 3 | 6 | 4 | 3 | 0.3 | 4 | To 30 μL |
| 6 | 3 | 12 | 4 | 3 | 0.3 | 4 | To 30 μL |
Note: Another competitor used in this study was poly(dI-dC). Poly(dI-dC) was resuspended according to the manufacturer’s protocol. Refer to Table 5.
3. Mix each reaction by pipetting and incubate at 37 °C for 1 h.
Note: Incubation time and temperature may require optimization depending on the DNA-binding protein under investigation.
F. Electrophoresis and fluorescence imaging
1. Following sample preparation (sections C and D), briefly centrifuge the reaction tubes to collect the contents at the bottom.
2. Immediately before loading the samples, rinse the wells with ice-cold running buffer using a syringe.
3. Add 10 μL of 50% glycerol to each 20 μL reaction. For the 30 μL reactions, add 15 μL of 50% glycerol. Pipette to mix well before loading.
Note: After adding glycerol, make sure to mix well. If not, the sample might be lost during loading into the gel. The final concentration of glycerol in each reaction will be 16.7%.
4. Mix gently, briefly centrifuge, and load the samples onto the pre-equilibrated native polyacrylamide gel.
5. Include one lane containing NEB purple loading dye (or an equivalent tracking dye) to monitor electrophoretic migration.
6. Electrophorese the gel in 0.5× TBE containing 100 mM KCl at 100 V for 4–5 h at 4 °C. The gel may be run overnight at 30 V while maintaining the electrophoresis apparatus at 4 °C.
Note: Protect the gel from prolonged light exposure throughout electrophoresis to minimize Cy5 photobleaching.
7. Carefully remove the gel from the glass plates and place it on the imaging platform of a fluorescence gel imaging system.
8. Image the gel using a fluorescence gel imaging system equipped with an appropriate Cy5 filter set (excitation at 633 or 647 nm, or equivalent settings according to the manufacturer’s instructions).
Note: In our work, the parameters used for image acquisition were as follows (these can be adjusted according to your requirements):
a) Exposure time: 30 s
b) Exposure mode: auto
c) Application name: Cy5
d) Sample: Fluorescence mode
e) Sensitivity: High
f) Filter position: 4: F-700
g) Lighting: No light
h) Auto mode: Standard exposure
i) Extended resolution: No
j) Pixel depth: 16 Bit per pixel
G. Expected results
In the presence of potassium ions (K+), the oligonucleotide predominantly forms compact intramolecular G4, which migrates faster during native polyacrylamide gel electrophoresis. Intermolecular G4s exhibit reduced electrophoretic mobility and therefore migrate more slowly because of their larger molecular size. Meanwhile, mutant G4 runs slower than the intramolecular G4.
In the absence of protein, folded G4 DNA migrates according to its conformation. Upon incubation with a G4BP, DNA–protein complexes exhibit reduced electrophoretic mobility, resulting in shifted bands. Increasing protein concentrations produce progressively greater band shifts and reduced intensity of the free DNA band, reflecting concentration-dependent binding.
In the competition assay, unlabeled G4 DNA competes with labeled G4 DNA for binding to the protein; thus, the signal intensity of the bound fraction decreases with increasing concentrations of unlabeled DNA. Poly(dI-dC) is used as a nonspecific competitor control in EMSA studies and is expected to cause little or no reduction in the intensity of the shifted band corresponding to the bound fraction.
Data analysis
The fluorescence intensity of free DNA and DNA–protein complexes can be quantified using ImageJ (22) or equivalent image analysis software.
1. Open the gel image in ImageJ.
2. Draw identical rectangular regions of interest around each band using the rectangle tool.
3. Measure the integrated fluorescence intensity of each band using Analyze > Measure.
4. Subtract the background intensity measured from an adjacent region of the gel.
5. Calculate the fraction of bound DNA using the following equation:
Fraction bound = Ibound
Ibound. + Ifree.
where Ibound is the background-corrected intensity of the shifted DNA–protein complex, and Ifree is the intensity of the unbound DNA band.
6. Plot the fraction of bound DNA against protein concentration using GraphPad Prism, Origin, or equivalent graphing software to evaluate protein–DNA interactions.
Notes:
1. For experiments aimed solely at characterizing G4 conformations, the electrophoretic mobility and relative band intensities of the intramolecular and intermolecular G4 species may be compared qualitatively or quantified using the same workflow to evaluate their relative abundance.
2. All bands corresponding to unbound G4 structures at the bottom of the gel were included in (I free), representing different intermolecular structures formed through the incorporation of additional strands of the same G quadruplex sequence as well as intramolecular G4 species. The shifted bands above were collectively considered as the protein-bound fraction, and their intensities were summed to obtain (Ibound).
Validation of protocol
The protocol was validated using a Cy5-labeled G-rich oligonucleotide capable of forming G4 structures, a non-G4-forming mutant, and purified G4BP, CTCF ZF (3–7). Under native electrophoretic conditions, the folded oligonucleotide resolved into distinct species corresponding to intramolecular and intermolecular G4 conformations. Intramolecular G4s migrated faster than intermolecular species because of their more compact structure [23]. Figure 2A shows that the intramolecular G4 migrated faster than the non-G4-forming mutant. Intermolecular G4s, which have higher molecular weight, migrated more slowly than the intramolecular G4s (Figure 2B). The formation of intermolecular and intramolecular G4s increased with increasing amounts of oligonucleotide (Figure 2B). The multiple bands in the no-protein control represent different intermolecular structures formed through the incorporation of additional strands of the same G-quadruplex sequence as well as intramolecular G4 species. These structures differ in compactness and therefore exhibit different electrophoretic mobilities, with more compact intramolecular G4 structures migrating fastest, whereas intermolecular G4 species formed by the association of two, three, or four strands of the G4 sequence exhibited progressively different mobilities.
To evaluate DNA–protein interactions, the folded G4 DNA was incubated with increasing amounts of CTCF ZF (3–7) prior to electrophoresis. Protein binding resulted in a concentration-dependent reduction in electrophoretic mobility, producing shifted DNA–protein complexes while decreasing the intensity of the free DNA band (Figure 2C, D). To evaluate the specificity of this interaction, competition assays were performed. In one experiment, an excess of unlabeled DNA was used as a competitor, resulting in a decrease in the signal from the bound fraction (Figure 2E). Next, poly(dI-dC) was used as a nonspecific competitor, and no appreciable reduction in the signal from the bound fraction was observed (Figure 2F). Together, these results support the specificity of the interaction. These results demonstrate that the protocol reliably detects both G4 conformations and the interaction of CTCF ZF (3–7) with G4 DNA using Cy5 fluorescence without the use of radioisotopes.
Troubleshooting
| Problem | Possible cause(s) | Solution(s) |
|---|---|---|
| Gel does not polymerize or polymerizes slowly. | APS or TEMED has degraded or was not added immediately before casting. | Prepare fresh 10% APS, use fresh TEMED, and add both immediately before pouring the gel. |
| Gel leaks during casting. | Improper assembly of the casting plates or damaged spacers. | Ensure the glass plates and spacers are correctly aligned and securely clamped before pouring the gel. |
| Distorted or smiling bands. | Excessive heat generated during electrophoresis. | Perform electrophoresis at 4 °C, reduce the running voltage if necessary, and ensure adequate buffer circulation. |
| Irregular band migration. | Uneven electric field, contaminated running buffer, or salt accumulation on the electrodes. | Prepare fresh running buffer and thoroughly clean the electrophoresis apparatus, particularly the electrodes, between runs. |
| DNA–protein complexes remain in the loading wells. | The DNA–protein complex is too large to enter the gel, or the gel percentage is too high. | Reduce the acrylamide concentration or use a gradient gel. Decreasing the protein concentration may also improve resolution. |
| Diffuse or smeared DNA bands. | Incomplete oligonucleotide folding, DNA degradation, or sample overloading. | Prepare fresh folded oligonucleotides, use nuclease-free reagents, and reduce the amount of DNA loaded if necessary. |
| Weak or no fluorescence signal. | Photobleaching of Cy5, insufficient DNA loading, or incorrect imaging settings. | Protect samples from light, increase the amount of Cy5-labeled DNA if required, and verify that the correct Cy5 excitation and emission settings are used during imaging. |
| High background fluorescence. | Contaminated glass plates, dirty imaging surface, or fluorescent contaminants in buffers. | Thoroughly clean the glass plates and imaging platform and prepare fresh buffers using high-purity reagents. |
Acknowledgments
MN acknowledges financial support from CSIR-ASPIRE [37WS(0086)/2023-24/EMR-II/ASPIRE], ICMR (IIRPSG-2024-01-02098), and IISER Thiruvananthapuram. AD acknowledges ANRF for NPDF (PDF/2025/007836). SKRS, AJ, and SS acknowledge their fellowships from UGC (211610133644, 241610064377, and 241610141449, respectively). E.coli DH5α and Rosetta strains were kindly gifted by Dr. Ramanathan Natesh, IISER TVM. The authors thank Ms. Tiyas Sengupta for providing access to BioRender and the research laboratory of Dr. V. Stalin Raj, IISER TVM, for assistance with image acquisition.
The Graphical overview was created in BioRender, https://BioRender.com/4h275p6.
Author contributions
Conceptualization: NM; Methodology: NM, SKRS; Writing—Original Draft: SKRS, AD, NM; Investigation: J.A. (G-quadruplex characterization) and S.S. (DNA–protein interaction/EMSA); Figure preparation: AD (Figures 1, 2), J.A. (Figure 3) and S.S. (Figure 3); Writing—Review & Editing, NM, AD, SKRS; Funding acquisition: NM and AD; Supervision: NM.
Competing interests
The authors declare no conflicts of interest.
References
- Jonchhe, S., Lahiri, S. and Rothenberg, E. (2025). DNA G-quadruplexes: Structural and functional insights. DNA Repair. 156: 103910. https://doi.org/10.1016/j.dnarep.2025.103910
- Spiegel, J., Adhikari, S. and Balasubramanian, S. (2020). The Structure and Function of DNA G-Quadruplexes. Trends Chem. 2(2): 123–136. https://doi.org/10.1016/j.trechm.2019.07.002
- Esnault, C., Zine El Aabidine, A., Robert, M. C., Cucchiarini, A., Magat, T., Pigeot, A., Bouchouika, S., Garcia-Oliver, E., Gawron, K., Basyuk, E., et al. (2025). G-quadruplexes are promoter elements controlling nucleosome exclusion and RNA polymerase II pausing. Nat Genet. 57(8): 1981–1993. https://doi.org/10.1038/s41588-025-02263-6
- Rhodes, D. and Lipps, H. J. (2015). G-quadruplexes and their regulatory roles in biology. Nucleic Acids Res. 43(18): 8627–8637. https://doi.org/10.1093/nar/gkv862
- Kumari, S., Bugaut, A., Huppert, J. L. and Balasubramanian, S. (2007). An RNA G-quadruplex in the 5′ UTR of the NRAS proto-oncogene modulates translation. Nat Chem Biol. 3(4): 218–221. https://doi.org/10.1038/nchembio864
- Varshney, D., Spiegel, J., Zyner, K., Tannahill, D. and Balasubramanian, S. (2020). The regulation and functions of DNA and RNA G-quadruplexes. Nat Rev Mol Cell Biol. 21(8): 459–474. https://doi.org/10.1038/s41580-020-0236-x
- Roy, S., Pramanik, P. and Bhattacharya, S. (2025). Exploring the role of G-quadruplex DNA, and their structural polymorphism, in targeting small molecules for the design of anticancer therapeutics: Progress, challenges, and future directions. Biochimie. 234: 120–145. https://doi.org/10.1016/j.biochi.2025.04.004
- Hänsel-Hertsch, R., Di Antonio, M. and Balasubramanian, S. (2017). DNA G-quadruplexes in the human genome: detection, functions and therapeutic potential. Nat Rev Mol Cell Biol. 18(5): 279–284. https://doi.org/10.1038/nrm.2017.3
- Meier-Stephenson, V. (2022). G4-quadruplex-binding proteins: review and insights into selectivity. Biophys Rev. 14(3): 635–654. https://doi.org/10.1007/s12551-022-00952-8
- Savinkova, L. K., Sharypova, E. B. and Kolchanov, N. A. (2021). In Vitro Methods Used to Study DNA–Protein Interactions. Biol Bull Rev. 11(4): 344–357. https://doi.org/10.1134/s2079086421040071
- Cozzolino, F., Iacobucci, I., Monaco, V. and Monti, M. (2021). Protein–DNA/RNA Interactions: An Overview of Investigation Methods in the -Omics Era. J Proteome Res. 20(6): 3018–3030. https://doi.org/10.1021/acs.jproteome.1c00074
- Fried, M. and Crothers, D. M. (1981). Equilibria and kinetics of lac repressor-operator interactions by polyacrylamide gel electrophoresis. Nucleic Acids Res. 9(23): 6505–6525. https://doi.org/10.1093/nar/9.23.6505
- Garner, M. M. and Revzin, A. (1981). A gel electrophoresis method for quantifying the binding of proteins to specific DNA regions: application to components of the Escherichia coli lactose operon regulatory system. Nucleic Acids Res. 9(13): 3047–3060. https://doi.org/10.1093/nar/9.13.3047
- Mansouri-Noori, F. and Bayfield, M. A. (2024). Electrophoretic mobility shift assays (EMSAs) for in vitro detection of protein-nucleic acid interactions. STAR Protoc. 5(2): 103128. https://doi.org/10.1016/j.xpro.2024.103128
- Wang, K., Gao, Y., Peng, X., Yang, G., Gao, F., Li, S. and Zhu, Y. (2009). Using FAM labeled DNA oligos to do RNA electrophoretic mobility shift assay. Mol Biol Rep. 37(6): 2871–2875. https://doi.org/10.1007/s11033-009-9841-7
- Timofeyeva, N. A., Ryazanova, A. Y., Norkin, M. V., Oretskaya, T. S., Fedorova, O. S. and Kubareva, E. A. (2018). Kinetic Basis of the Bifunctionality of SsoII DNA Methyltransferase. Molecules. 23(5): 1192. https://doi.org/10.3390/molecules23051192
- He, Z., Wang, Z., Lu, Z., Gao, C. and Wang, Y. (2024). An electrophoretic mobility shift assay using the protein isolated from host plants. Plant Methods. 20(1): e1186/s13007–024–01201–7. https://doi.org/10.1186/s13007-024-01201-7
- Ruscher, K., Reuter, M., Kupper, D., Trendelenburg, G., Dirnagl, U. and Meisel, A. (2000). A fluorescence based non-radioactive electrophoretic mobility shift assay. J Biotechnol. 78(2): 163–170. https://doi.org/10.1016/s0168-1656(00)00207-8
- Janoušková, E., Nečasová, I., Pavloušková, J., Zimmermann, M., Hluchý, M., Marini, V., Nováková, M. and Hofr, C. (2015). Human Rap1 modulates TRF2 attraction to telomeric DNA. Nucleic Acids Res. 43(5): 2691–2700. https://doi.org/10.1093/nar/gkv097
- Nakatani, Y. and Hisatomi, O. (2018). Quantitative analyses of the equilibria among DNA complexes of a blue-light-regulated bZIP module, Photozipper. Biophys Physicobiol. 15: 8–17. https://doi.org/10.2142/biophysico.15.0_8
- Hashimoto, H., Wang, D., Horton, J. R., Zhang, X., Corces, V. G. and Cheng, X. (2017). Structural Basis for the Versatile and Methylation-Dependent Binding of CTCF to DNA. Mol Cell. 66(5): 711–720.e3. https://doi.org/10.1016/j.molcel.2017.05.004
- Schneider, C. A., Rasband, W. S. and Eliceiri, K. W. (2012). NIH Image to ImageJ: 25 years of image analysis. Nat Methods. 9(7): 671–675. https://doi.org/10.1038/nmeth.2089
- Nambiar, M., Goldsmith, G., Moorthy, B. T., Lieber, M. R., Joshi, M. V., Choudhary, B., Hosur, R. V. and Raghavan, S. C. (2010). Formation of a G-quadruplex at the BCL2 major breakpoint region of the t(14;18) translocation in follicular lymphoma. Nucleic Acids Res. 39(3): 936–948. https://doi.org/10.1093/nar/gkq824
Article Information
Publication history
Received: Aug 7, 2026
Accepted: Oct 19, 2026
Available online: Nov 16, 2026
Published: Dec 5, 2026
Copyright
© 2026 The Author(s); This is an open access article under the CC BY-NC license (https://creativecommons.org/licenses/by-nc/4.0/).
How to cite
Prasanth, S., Dutta, A., Sreya, S., Johna, A. and Nishana, M. (2026). Cy5-Fluorescent EMSA for Characterization of G-Quadruplex Structures and DNA–Protein Interactions Without Radioisotopes. Bio-protocol 16(23): e5892. DOI: 10.21769/BioProtoc.5892.

 Download Citation in RIS Format
Do you have any questions about this protocol?
Post your question to gather feedback from the community. We will also invite the authors of this article to respond.
 Post a Question


