


- Protocols

- Articles and Issues
- For Authors
- About
- Become a Reviewer


A Hybrid Gait Analysis System for Robust and Efficient Estimation of the Sciatic Functional Index in Rats

Published: Vol 16, Iss 22, Nov 20, 2026 DOI: 10.21769/BioProtoc.5889 Views: 19
Reviewed by: Shubham GargAnonymous reviewer(s)
 PDF
 Ask a question

Original research article
The authors used this protocol in:

Jun 2026

Protocol Collections
Comprehensive collections of detailed, peer-reviewed protocols focusing on specific topics



Related protocols
Abstract
The Sciatic Functional Index (SFI) is one of the most widely used quantitative measures of functional recovery following peripheral nerve injury in rodents. Conventional paper–ink walking tracks, frustrated total internal reflection (fTIR)-based gait-analysis systems, and ventral video-based imaging provide complementary information for SFI estimation but frequently fail to determine one or more SFI parameters under normal and, especially, pathological conditions. Here, we describe and validate a hybrid gait-analysis system that combines fTIR imaging of plantar contact areas with simultaneous visualization of selected plantar anatomical landmarks using additional oblique white-light illumination. The accompanying Gait2SFI software automatically detects plantar contact areas, assists the identification of anatomical landmarks, performs quality control, and calculates the classical SFI. The software supports SFI estimation from the maximum contact area, the total print area, or a composite footprint generated from the minimum number of consecutive contact frames required to identify all anatomical landmarks necessary for SFI estimation. Validation demonstrated that the hybrid system is fully compatible with the conventional SFI methodology while substantially increasing the proportion of analyzable gait cycles under both physiological and pathological conditions. Simultaneous access to contact and anatomical information enabled reliable determination of print length, toe spread, and intermediary toe spread in gait cycles that could not be analyzed using conventional contact-based approaches alone. The hybrid system also reduced repeated recordings and improved experimental throughput. Overall, the protocol provides a reproducible, low-cost, and efficient approach for robust estimation of the classical Sciatic Functional Index in rats while maintaining compatibility with existing SFI methodologies.
Key features
• Hybrid fTIR+WL imaging combines paw contact and anatomical information and enables classical SFI estimation when contact-only footprints are incomplete.
• Improves SFI measurability in both healthy and sciatic nerve–injured rats.
• Supports maximum contact area, total print area, and composite footprints.
• Reduces within-session variability compared with the paper–ink method.
Keywords: Sciatic Functional Index Gait analysis
Frustrated total internal reflection (fTIR)
Hybrid imaging
Peripheral nerve injury
Walking track analysis
Rodents
Graphical overview
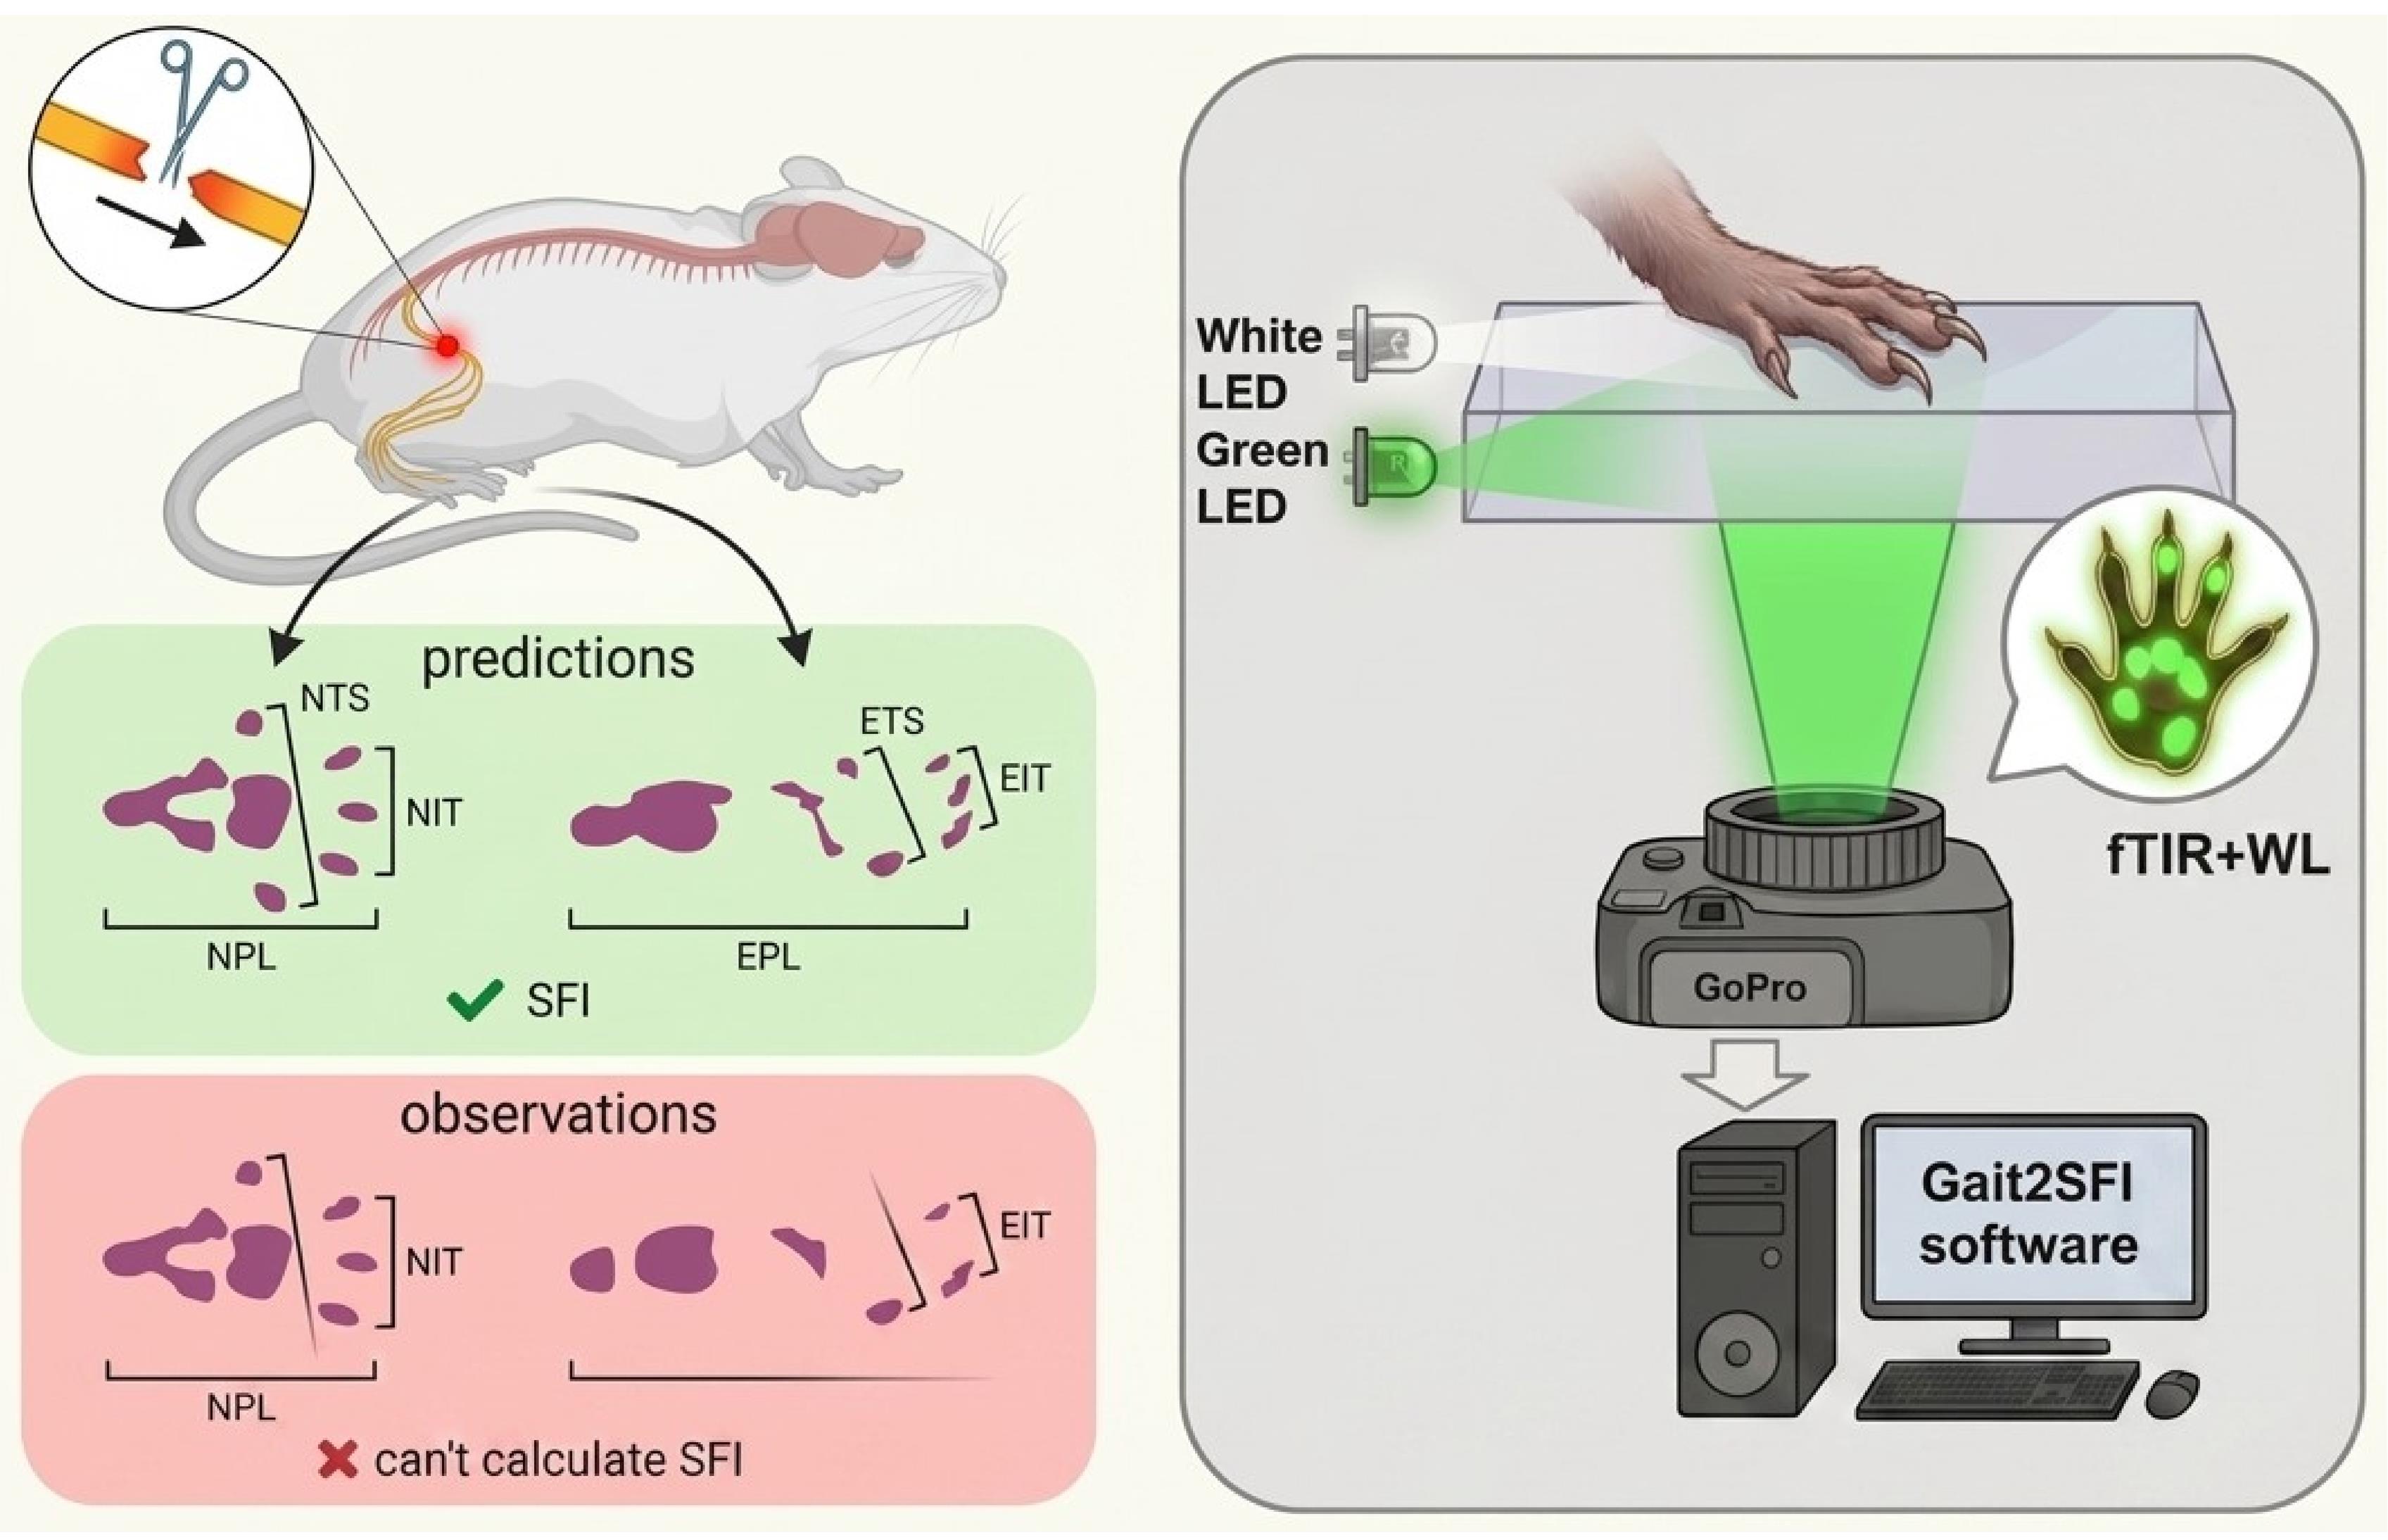
Principle of hybrid frustrated total internal reflection (fTIR)+white-light (WL) imaging for Sciatic Functional Index (SFI) measurement. Conventional fTIR and paper–ink recordings may fail to reveal one or more plantar pads and may show contacts from other paw structures that complicate anatomical interpretation, even in healthy animals, with these limitations becoming more pronounced after sciatic nerve injury (left). Print length, toe spread, and intermediary toe spread are shown for the experimental (EPL, ETS, EIT) and contralateral normal (NPL, NTS, NIT) hindpaw footprints. Hybrid fTIR+WL imaging retains fTIR information on genuine paw–glass contacts (green in the footprint, right), while WL identifies the anatomical structures corresponding to fTIR-positive contacts and reveals pads and plantar regions that do not contact the glass (brown in the footprint, right). The combined information enables calculation of the classical SFI when fTIR alone is insufficient.
Background
Functional gait analysis remains one of the principal methods for evaluating recovery following peripheral nerve injury in experimental rodents. Among the available behavioral tests, the Sciatic Functional Index (SFI), originally introduced by de Medinaceli and subsequently modified by Bain and colleagues, has become the most widely used quantitative index for assessing recovery after sciatic nerve injury because it integrates several aspects of hindlimb motor function into a single numerical parameter [1–3]. Owing to its non-invasive nature, simplicity, and sensitivity to functional deficits, SFI has been extensively employed to evaluate surgical repair techniques, nerve guidance conduits, biomaterials, electrical stimulation, pharmacological interventions, and rehabilitation strategies [4,5]. Recent advances in peripheral nerve regeneration, particularly the development of engineered hydrogels and multifunctional nerve-guidance conduits, further emphasize the importance of reliable functional assessment for evaluating therapeutic efficacy [6–8]. Nevertheless, conventional paper–ink walking-track analysis remains in use even in this technologically advanced field, highlighting the need for accessible, cost-effective approaches that improve the reliability of SFI measurements without requiring expensive specialized equipment.
The classical SFI is calculated from three geometric parameters extracted from hindpaw footprints: print length (PL), toe spread (TS), and intermediary toe spread (ITS). Although these parameters appear straightforward, their reliable determination becomes increasingly difficult following sciatic nerve injury. Loss of toe spreading, altered paw posture, foot dragging, joint contractures, and dorsum walking frequently produce incomplete or distorted footprints, making these parameters difficult or impossible to determine [3–5]. In severe injuries, conventional walking-track analysis often becomes unmeasurable, and arbitrary SFI values have historically been assigned to represent complete functional loss [2].
During the last two decades, digital gait-analysis systems have largely replaced conventional paper–ink walking tracks. Among them, frustrated total internal reflection (fTIR)-based systems, such as CatWalk XT, have become the most widely used because they automatically detect paw contact with the walking surface while simultaneously providing numerous spatiotemporal gait parameters [9,10]. More recently, ventral video-based systems, such as DigiGait, have provided an alternative approach by imaging the projected contour of the plantar surface during locomotion on a transparent treadmill [11]. Although these systems have substantially improved automation and experimental throughput, reliable estimation of the classical SFI remains strongly dependent on the method used to acquire paw footprints. Existing approaches differ not only in the way footprints are recorded but also in the physical and biomechanical information they capture, resulting in systematic differences in the determination of SFI parameters and limiting direct comparison between studies.
The classical paper–ink walking-track method records an integrated footprint accumulated throughout the entire stance phase. While this approach formed the basis of the original SFI, the resulting footprint does not correspond to any specific moment of gait but rather represents the cumulative contact pattern produced throughout stance. Moreover, footprint quality is influenced by smearing, dragging, incomplete transfer of digit pads, and variations in the animal's walking speed. Importantly, the clearest footprints are frequently obtained when animals slow down, hesitate, or briefly stop. Such footprints no longer represent physiological locomotion but instead reflect static or quasi-static paw placement. Consequently, they often contain extensive posterior plantar contact, including heel and tarsal regions, producing artificially increased PL values compared with footprints generated during continuous walking. Because only the final footprint is available for analysis, it is impossible to determine retrospectively whether the animal was walking normally, accelerating, decelerating, or standing still when the footprint was produced.
FTIR-based systems overcome many limitations of paper–ink methods by recording genuine load-bearing plantar contact during locomotion with high temporal resolution. However, they visualize only load-bearing contact areas rather than the entire plantar surface. Consequently, anatomical landmarks required for estimation of the classical SFI are detected only when they physically contact the walking surface. This limitation becomes particularly important because individual plantar pads contact the substrate asynchronously during the stance phase. As a result, all digit and metatarsal pads are frequently not visible simultaneously within a single fTIR frame, even during physiological locomotion. In practice, SFI is commonly estimated either from the frame corresponding to the maximum contact area or from another frame in which the required digit pads happen to be visible. However, these approaches are not equivalent. The maximum contact area represents one well-defined biomechanical instant within the stance cycle but may lack critical digit contacts, whereas frames selected to maximize pad visibility may correspond to different phases of stance. Consequently, individual SFI parameters may be measured at different biomechanical moments, reducing standardization and increasing variability.
An alternative representation available in fTIR-based systems is the total print area, obtained by accumulating all plantar contacts throughout the stance phase. Unlike a single frame, the total print area integrates contact information from the entire stance and therefore more closely resembles the classical ink footprint. However, it no longer represents a single biomechanical instant and may be influenced by paw sliding, paw rotation, or progressive changes in paw position during stance. Furthermore, even the total print area may fail to contain all digit pads required for SFI estimation when individual digits never contact the walking surface, as frequently occurs after peripheral nerve injury. Consequently, there is currently no consensus regarding which footprint representation—maximum contact area, another individual contact frame, or total print area—is most appropriate for estimation of the classical SFI parameters.
A conceptually different approach is implemented in ventral video systems such as DigiGait, which image the plantar contour while animals walk on a transparent treadmill at a constant speed. Although treadmill locomotion improves the reproducibility of gait, DigiGait does not measure genuine plantar contact areas. Instead, SFI is estimated from ventral images of the paw rather than from contact footprints, making the resulting measurements conceptually different from the classical SFI originally developed using paper–ink walking tracks. Consequently, values obtained using contour-based and contact-based methods should not necessarily be considered directly equivalent.
Another unresolved methodological issue concerns the determination of print length (PL). Classical SFI defines PL as a footprint-derived parameter; however, following peripheral nerve injury, the posterior border of the footprint may correspond to different anatomical structures, including metatarsal pads, tarsal pads, the anatomical heel, plantar skin, or even joints contacting the walking surface. Furthermore, while some studies define PL anatomically as the distance from the heel to the third toe [3,4], contact-based gait-analysis systems determine it from the most posterior contact point. Consequently, different studies effectively measure PL from different anatomical landmarks, introducing additional variability and complicating direct comparison of SFI values obtained using different gait-analysis methodologies.
These methodological limitations become considerably more pronounced after sciatic nerve injury. Abnormal gait may include loss of toe spreading, posterior displacement of plantar loading, heel walking, dragging, joint contractures, dorsum walking, or complete absence of contact by individual digits. Under these conditions, one or more of the parameters required for SFI calculation frequently cannot be determined, resulting in exclusion of individual gait cycles or even entire animals from analysis [3,4,12]. Consequently, both the reliability and efficiency of SFI estimation decrease precisely in those experimental models where accurate functional assessment is most critical.
To overcome these limitations, we developed a hybrid gait-analysis system. The system combines fTIR-derived plantar contact information with simultaneous visualization of selected plantar anatomical landmarks required for robust estimation of the classical Sciatic Functional Index using additional oblique white-light illumination. This hybrid acquisition strategy provides complementary contact and anatomical information while preserving compatibility with conventional SFI methodology. Rather than introducing a new functional index, the hybrid approach was designed to improve the robustness and efficiency of estimating the classical SFI by enabling reliable determination of PL, TS, and ITS even when some anatomical landmarks are absent from conventional contact-based footprints. The accompanying Gait2SFI software supports estimation of the classical SFI using different footprint representations, including the maximum contact area, the total print area, or a composite footprint generated by combining the minimum number of consecutive contact frames beginning with the maximum contact area frame that is sufficient to visualize all anatomical landmarks required for SFI estimation. This latter representation preserves a well-defined temporal reference while minimizing smearing, dragging, and changes in paw position associated with integrating contact information over the entire stance phase. In the present study, we describe the hybrid gait-analysis system and validate its performance under both physiological and pathological conditions, including direct comparison with the classical paper–ink walking-track method.
Materials and reagents
Biological materials
1. Male Wistar rats (2–5 months old, 200–450 g), bred in the vivarium of the O.O. Bogomolets Institute of Physiology, NAS of Ukraine (Kyiv, Ukraine). Animals were used in multiple gait-analysis experiments, with some rats contributing to more than one dataset. Data were obtained from a total of 29 rats, including 15 with experimentally induced sciatic nerve injury (SNI). The number of animals included in each validation experiment is specified in the corresponding section.
Reagents
1. Non-toxic watercolor paint (KITE, catalog number: BF_3789335): used to obtain rat paw prints (any other watercolor paint can be used instead)
2. Glass-cleaning solution without ethanol (Clin, catalog number: MD_218910); applied between recordings to remove paw marks, debris, and residues (can be replaced with any glass cleaner without ethanol)
Equipment
1. Custom fTIR walking-track walkway: built in-house (glass platform with green and white LED edge lighting + red tunnel ceiling lighting (Figure 1); assembly described in Procedure, steps A1–3)
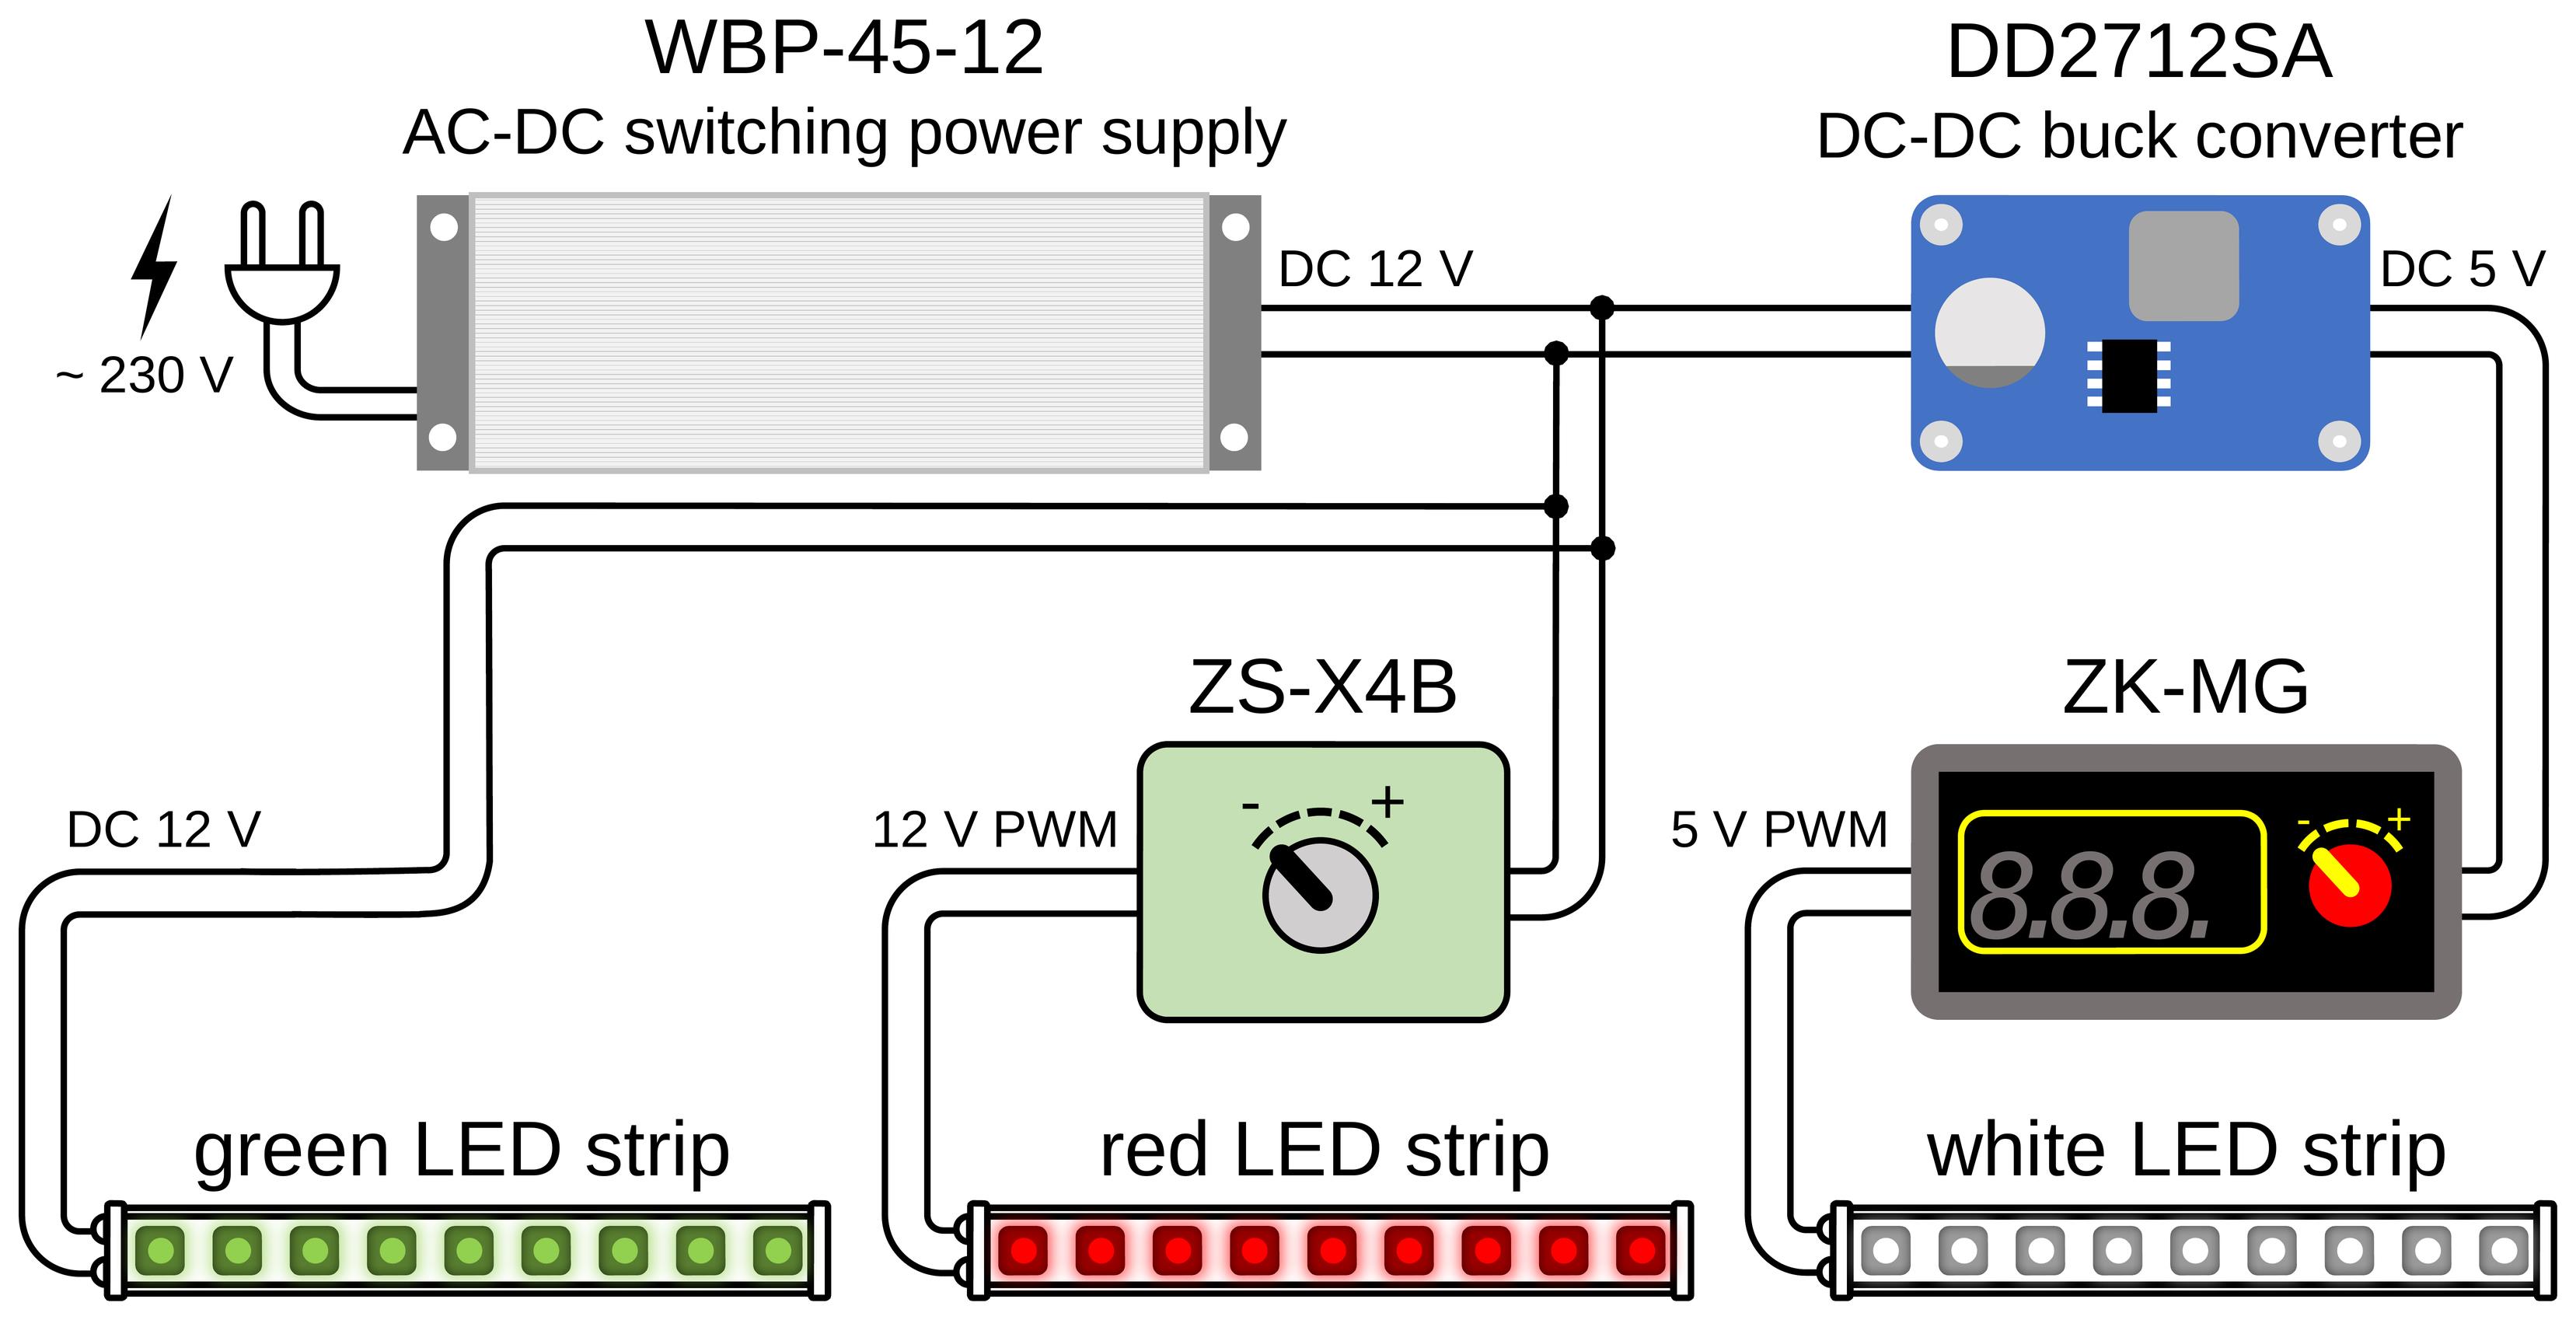
Figure 1. Block diagram of the electrical connections of the LED illumination. A single sealed 12 V, 45 W power supply (Biom WBP-45-12) drives the three LED channels. The green LED strip (fTIR edge illumination of the walking platform) is connected directly to the 12 V output. The red LED strip (tunnel-ceiling illumination) is powered through a ZS-X4B controller that sets its intensity. The white LED strip (oblique white-light illumination) is supplied through a DD2712SA step-down (buck) converter that reduces the voltage to 5 V, followed by a ZK-MG controller that regulates its brightness.
2. High-resolution camera (GoPro, model: HERO10 Black; 5,312 × 2,988 pixels, 50 frames/s)
3. LED power supply; BIOM Professional 12 V DC, 45 W, WBP-45-12, 3.7 A 02095
4. Buck step-down voltage regulator module (Eletechsup, catalog number: DD2712SA)
5. Regulator ZK-MG; PWM controller module (generic)
6. Regulator ZS-X4B; PWM speed controller/LED dimmer (Excellway)
7. LED green (SMD2835, 120 LEDs/m, 9.6 W/m, IP20, 12 V)
8. LED white (ROLUM SX, 6 × 12 mm, 6 W, 5 V, IP67, neutral white 3800–4300 K)
9. LED red (SMD2835, 120 LEDs/m, 12 V, IP20, 1012089)
10. Support stand/darkened enclosure (in-house)
11. Computer for video acquisition and analysis (HP 250 G10)
Software and datasets
1. Gait2SFI.py: Footprint detection and parameter-measurement GUI (this study; https://github.com/olbmv/Gait2SFI; accessed: 17 August 2026)
2. SFI.py: SFI calculation tool with logging to data.csv (this study; https://github.com/olbmv/Gait2SFI; accessed: 17 August 2026)
3. Python 3.10.11 (Python Software Foundation)
4. All data and code have been deposited in GitHub: https://github.com/olbmv/Gait2SFI (accessed: 17 August 2026)
Procedure
This section describes the hybrid gait-recording system, acquisition of gait recordings, measurement of hindpaw print parameters, and calculation of the Sciatic Functional Index (SFI) using Gait2SFI software.
A. Hybrid gait-analysis system
Conventional fTIR imaging visualizes only regions of the plantar surface that directly contact the transparent floor and may therefore fail to reveal all anatomical landmarks required for measurement of PL, TS, and ITS. To provide complementary anatomical information while preserving genuine plantar contact information, modify the fTIR system by adding oblique white-light illumination as described below.
A1. Construction of the hybrid system
1. Assemble the gait-analysis system as shown in Figure 2. The system consists of a walking corridor with a ceiling illuminated by red LEDs with a transparent glass floor mounted on a supporting frame, green LEDs for fTIR illumination, white LED strips for oblique illumination of the paws, a goal box at the end of the corridor, and a camera positioned beneath the glass walkway. Enclose the space beneath the walkway with a dense fabric screen to minimize interference from ambient light (Figure 2B, C).
2. Introduce green light into the edge of the glass walkway plate so that it propagates within the glass by total internal reflection. At sites where the plantar surface contacts the glass, total internal reflection is frustrated, and green light is scattered toward the camera positioned beneath the walkway, producing bright images of genuine plantar contact areas (Figure 2A), as in the commercial and customized fTIR-based systems.
3. Position two white LED strips symmetrically outside the long sides of the walking corridor (Figure 2B, D). Each strip is approximately 4 mm wide, with its centerline located approximately 5 mm above the glass floor and 50 mm from the corresponding corridor side wall. Orient the strips so that the central direction of light emission is parallel to the glass surface. The LEDs emit light over a broad angular range of approximately 90°. A portion of this light enters the 100-mm-wide, 1,000-mm-long walking corridor through narrow gaps of approximately 2 mm between the side walls and the glass floor. Light entering at shallow angles of about 6° is reflected from the glass surface and propagates obliquely into the corridor. This arrangement produces illuminated bands extending up to approximately 30 mm above the floor along the corridor walls, with maximum brightness approximately 10 mm above the glass (Figure 3B). During locomotion, the paws are typically located approximately 20–30 mm from the side walls, where the oblique light preferentially illuminates their lower portions, within approximately 5–10 mm of the glass surface (Figure 3C, D).
Importantly, the white LED strips must remain outside the walking corridor. This arrangement minimizes direct and stray white light reaching the camera beneath the glass floor, so that the recorded white-light signal originates predominantly from light reflected by the animal's lower body and paws. Positioning the LEDs inside the corridor would increase background illumination and reduce the contrast of both the green fTIR-derived contact signals and the white-light-derived plantar anatomical features. The camera records these complementary signals simultaneously within the same video frame.
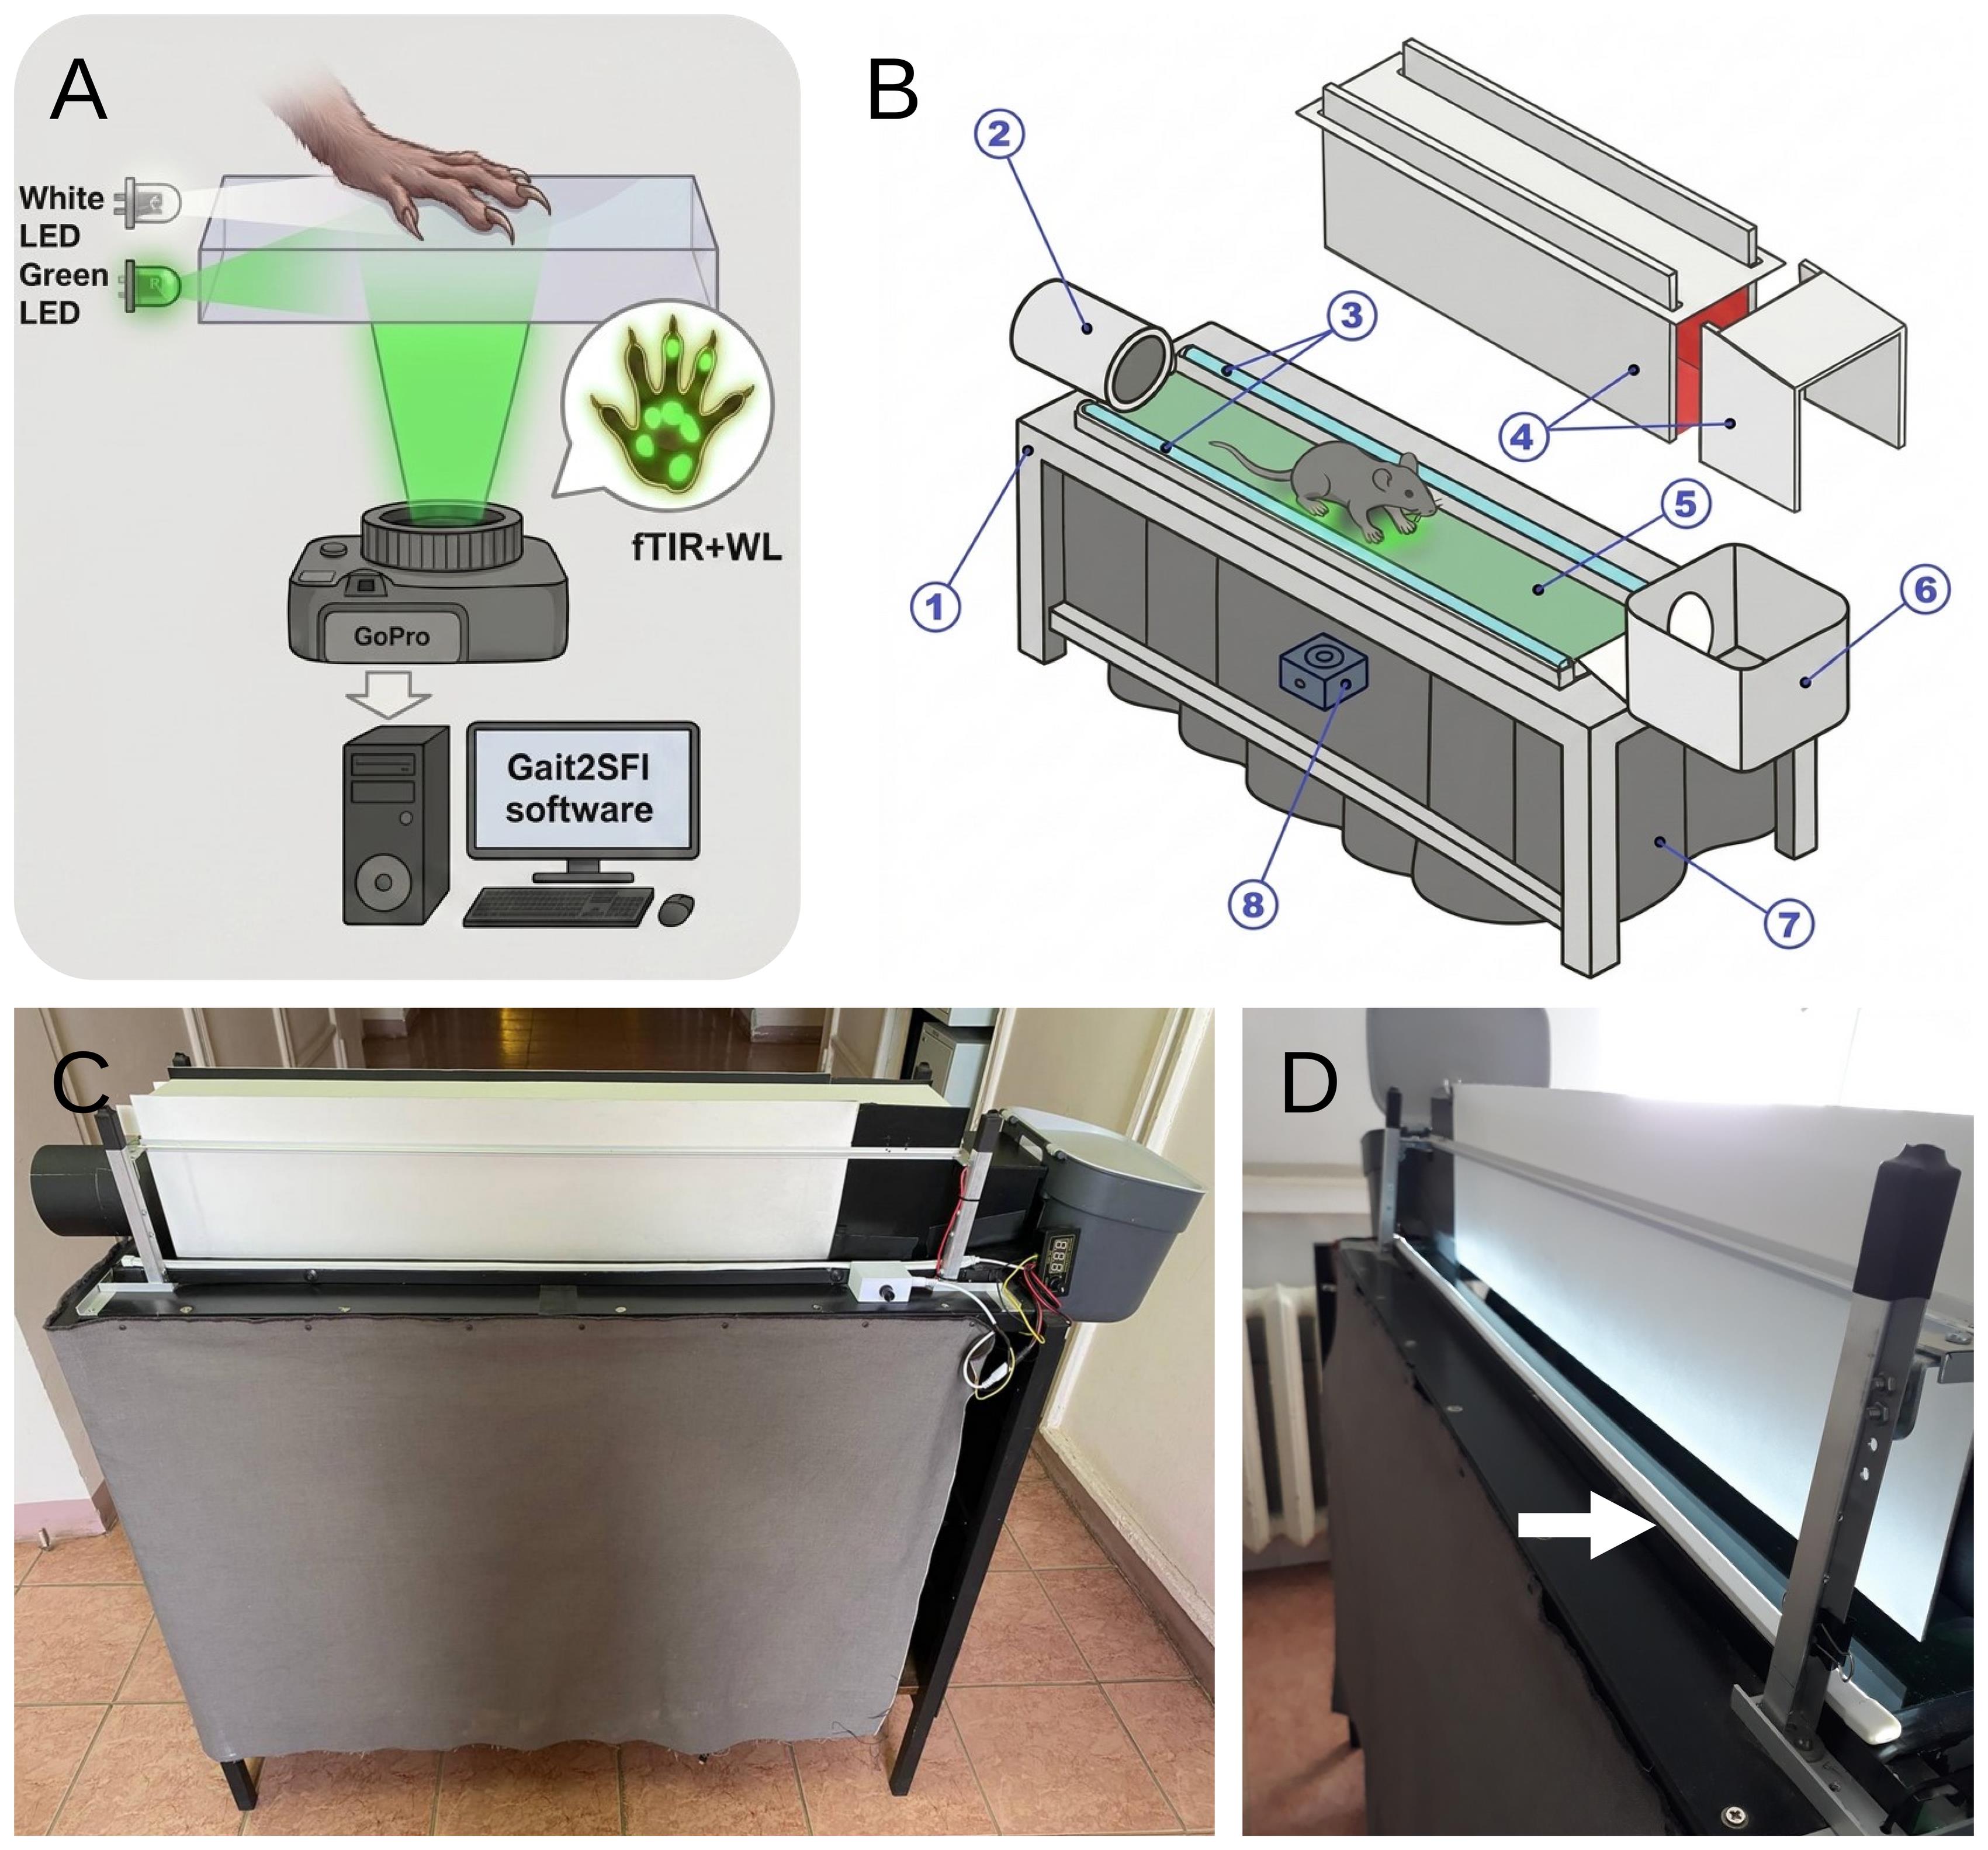
Figure 2. Hybrid gait-analysis system. (A) Optical principle of hybrid imaging. Green light introduced into the edge of the glass walkway plate propagates within the glass by total internal reflection and is released at paw–glass contact sites by frustrated total internal reflection (fTIR), producing bright images of genuine plantar contact areas. Simultaneously, oblique white-light illumination of the paw provides reflected light from the plantar surface, allowing visualization of anatomical structures regardless of whether they are in direct contact with the glass. A single camera positioned beneath the walkway therefore records fTIR-derived plantar contact areas and white-light-derived plantar anatomy in the same frame. (B) Schematic of the hybrid gait-analysis system: 1, supporting frame; 2, entry tunnel through which the animal enters the walking corridor; 3, white LED strips positioned along the long sides of the glass walkway; 4, components of the removable corridor cover; 5, transparent glass walkway plate; 6, goal box at the far end of the corridor; 7, dense fabric screen shielding the camera and optical path from ambient light; 8, camera positioned beneath the glass walkway. (C) Side view of the assembled gait-analysis system. (D) Arrangement of the white-light illumination. White LED strips (approximately 4 mm wide) are positioned symmetrically outside the walking corridor, with their centerlines approximately 5 mm above the glass floor and 50 mm from the corridor side walls. The central direction of light emission is parallel to the glass surface, with a broad angular distribution of approximately 90°. A portion of the emitted light enters through narrow gaps (approximately 2 mm) between the side walls and the glass floor and, after reflection from the glass, propagates obliquely (at a 6° angle) into the corridor. External positioning of the LED strips minimizes direct and stray white light reaching the camera, preserving the contrast of both the green fTIR contact signals and the white-light-derived plantar anatomical features.
A2. Setup and verification of hybrid illumination
1. Dim the lighting of the testing room or darken it completely to minimize interference from ambient light. For conventional fTIR imaging, lower the corridor walls completely and keep the red background illumination uniform and at the lowest intensity that still allows the animal to be monitored. For hybrid imaging, raise the corridor side walls slightly to leave a gap of approximately 2–5 mm above the glass walkway (approximately 2 mm in the illustrated configuration), allowing oblique white light to enter the walking corridor from both sides.
The arrangement shown in Figure 2 produces two complementary illumination conditions within the walking corridor (Figure 3). Under conventional fTIR conditions, green signals identify sites where the plantar surface contacts the glass. Red illumination of the enclosed corridor provides low-level background illumination that allows the position and movement of the animal to be monitored without substantially interfering with visualization of the green fTIR-derived contact areas (Figure 3A).
2. For hybrid imaging, switch on the additional white LED strips positioned outside the walking corridor as described in Section A1. As shown in Figure 2D, white light is directed toward the glass at a shallow angle and, after reflection from the glass surface, enters the walking corridor obliquely through the narrow gaps between the floor and the side walls. The resulting illumination is visible as bright bands along the lower parts of the corridor walls (Figure 3B). This geometry directs white light toward the ventral surface of the animal while minimizing direct illumination of the camera positioned beneath the walkway.
During locomotion, the oblique white light illuminates the plantar surface of the paws and is reflected toward the camera through the transparent floor (Figure 3C, D). Consequently, anatomical structures of the plantar surface may be visualized even when they are not in direct contact with the glass, whereas areas of actual paw–glass contact remain simultaneously highlighted by green fTIR illumination. Thus, the white-light-derived image provides anatomical information about the plantar surface, while the green fTIR signal identifies genuine contact areas. The two signals are acquired simultaneously by the same camera and are therefore spatially and temporally registered within each video frame.
Critical: Before experimental recordings, verify the illumination using an animal walking through the corridor. Adjust the white-light intensity and angle, if necessary, so that the plantar anatomical landmarks required for SFI measurement are sufficiently visible without obscuring the green fTIR-derived contact signal. Representative views of the animal and hindpaw under simultaneous fTIR and oblique white-light illumination are shown in Figure 3C, D.
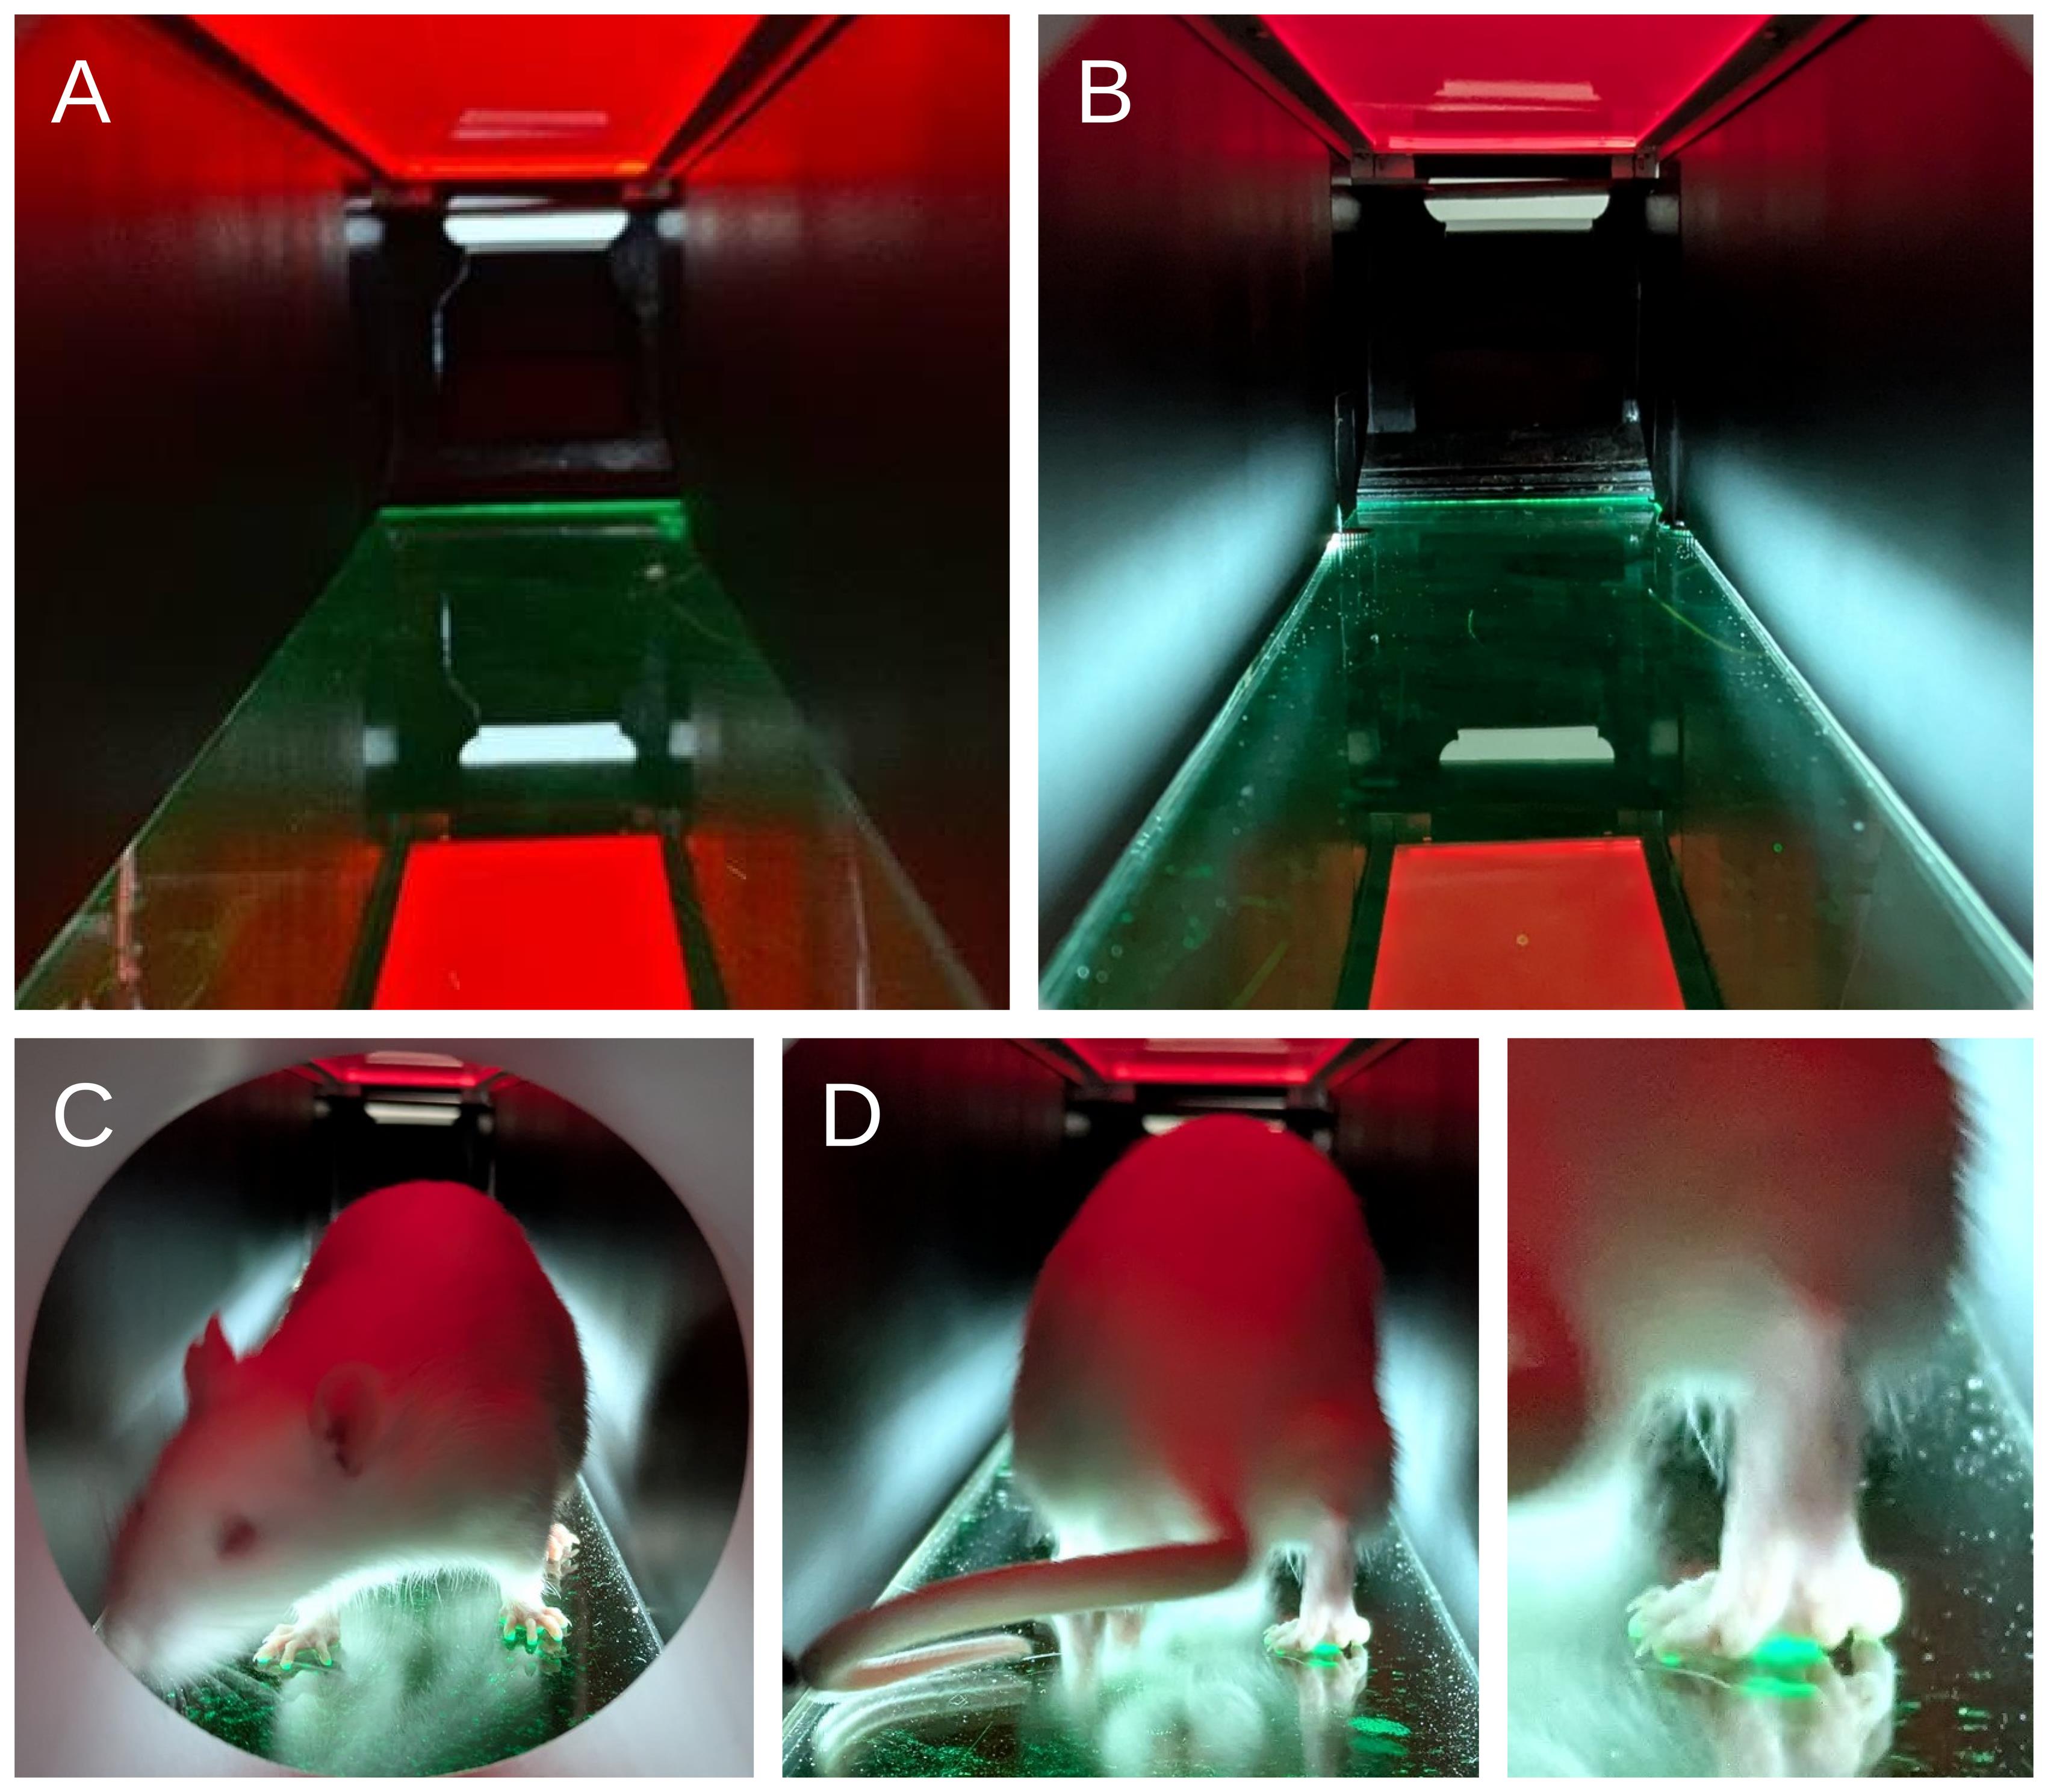
Figure 3. Illumination of the walking corridor and animal during hybrid gait recording. (A) Interior of the walking corridor under conventional fTIR conditions. Red background illumination allows visualization of the animal, while green light propagates within the glass walkway. (B) Corridor with additional oblique white-light illumination. Bright bands along the lower side walls indicate white light entering the corridor after reflection from the glass floor. (C) Front view of a rat under hybrid illumination, showing simultaneous white-light illumination of the paws and green fTIR-derived paw–glass contact areas. (D) Rear view of the rat during locomotion under hybrid illumination (left) and enlarged view of a hindpaw (right), demonstrating simultaneous visualization of the white-light-illuminated paw and green fTIR-derived contact areas.
A3. Camera setup and verification of hybrid images
1. Set the camera to 4K resolution at 25 or 50 frames/s, ISO 1600, flat color profile, linear lens mode, and natural white balance. Position the camera beneath the transparent walkway and adjust its field of view so that the required length of the walking corridor is visible throughout the recording.
Note: A GoPro HERO10 was used in the present study. Other cameras can be used provided that they support 4K recording at a frame rate of at least 25 frames/s and allow manual control of the relevant recording parameters.
2. Record representative gait sequences with the camera positioned beneath the transparent walkway and inspect the acquired frames under conventional fTIR and hybrid illumination (Figure 4). Under conventional fTIR illumination, verify that regions of the paws contacting the glass produce a distinct green signal, whereas non-contacting regions of the plantar surface remain poorly visible or invisible (Figure 4A, C, E). Under hybrid illumination, verify that the additional oblique white light reveals plantar anatomical structures while preserving the green fTIR-derived signal from genuine paw–glass contact areas (Figure 4B, D, F).
3. Examine the paw region at higher magnification (Figure 4C–F). Verify that the hybrid image permits identification of plantar anatomical landmarks, including digit pads that may not be represented in the corresponding fTIR contact image. At the same time, ensure that green fTIR signals from contacting plantar structures, including the metatarsal pads, remain clearly distinguishable from the surrounding white-light-derived anatomical image.
Critical: Before collecting experimental recordings, verify that both components of the hybrid image are simultaneously resolved: (i) green fTIR-derived signals clearly identify genuine plantar contact areas, and (ii) white-light illumination provides sufficient anatomical information to identify the landmarks required for PL, TS, and ITS measurement. If either component is inadequately resolved, adjust the intensity and/or angle of the white illumination and repeat the verification before proceeding.
Examples of inadequate hybrid illumination are shown in Figure 4G, H: Insufficient white-light intensity results in poor visualization of plantar anatomical structures (Figure 4G), whereas excessive white-light intensity reduces the contrast of green fTIR-derived contact signals (Figure 4H). See Troubleshooting, Problem 1, for corrective adjustments.
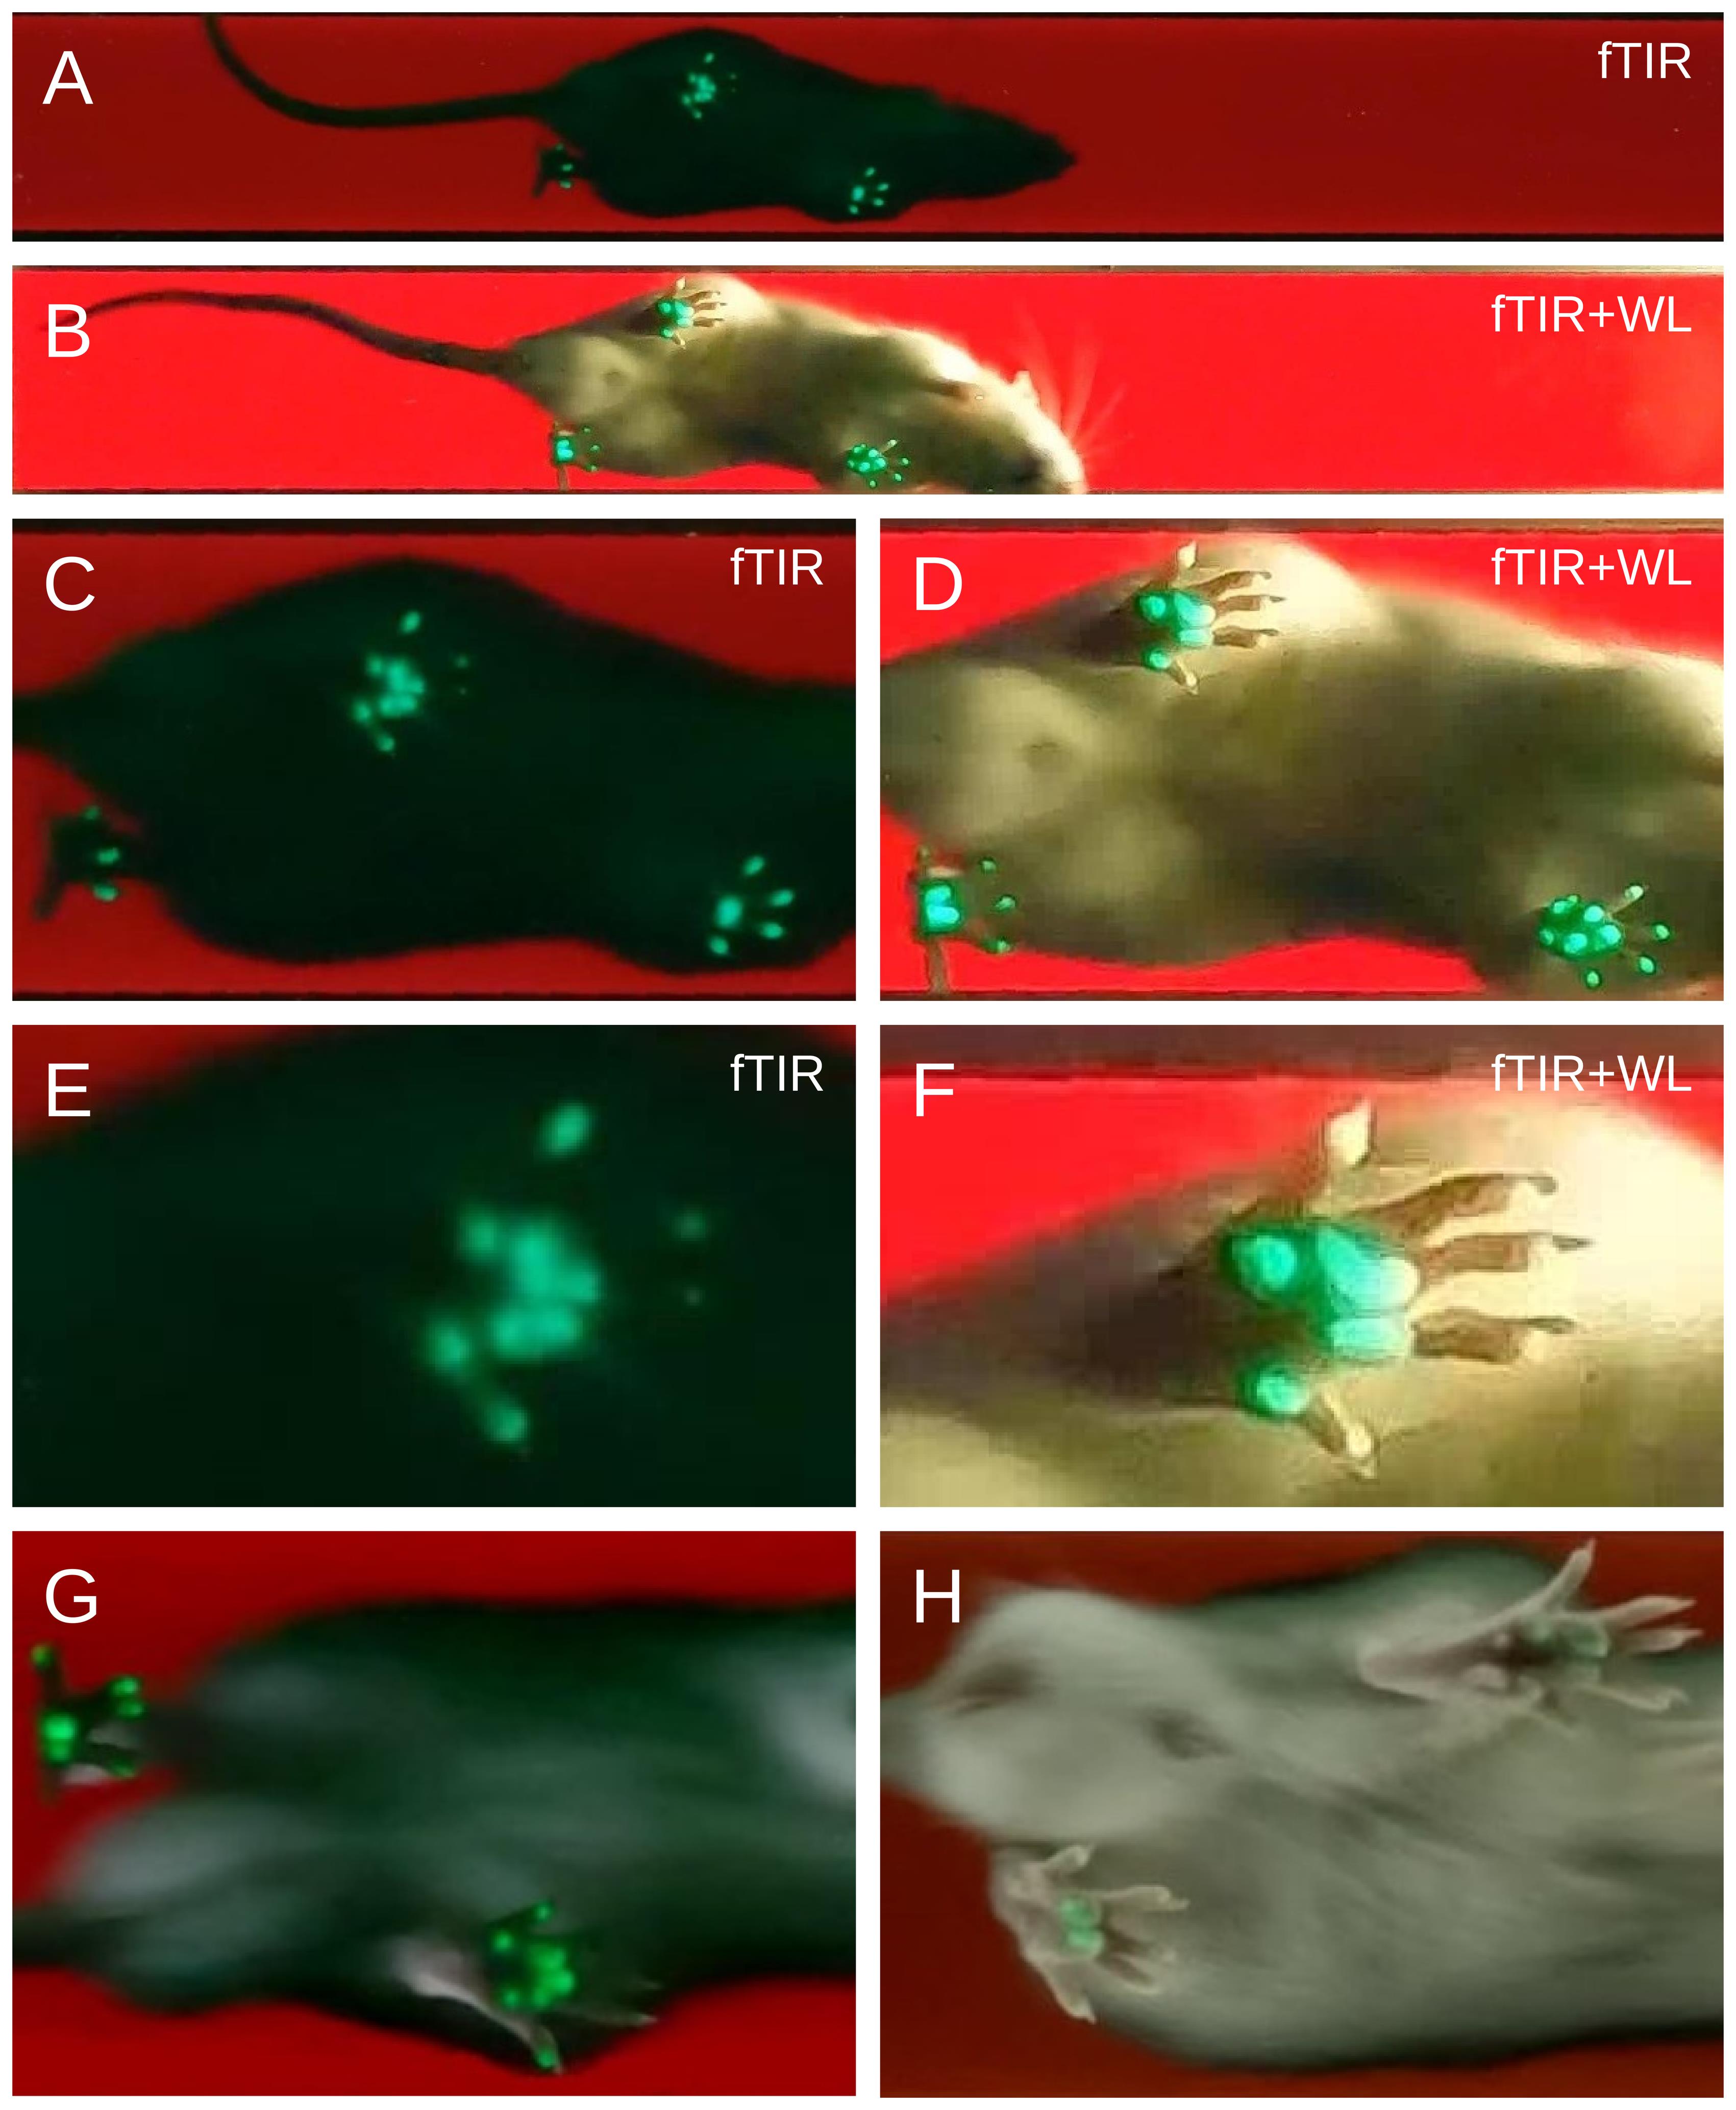
Figure 4. Plantar contact and anatomical information recorded by conventional fTIR and hybrid imaging. Representative recordings of the same healthy rat during separate runs acquired using conventional fTIR (A, C, E) or hybrid fTIR plus oblique white-light illumination (B, D, F). (A, B) Overall view of the animal during locomotion. (C, D) Enlarged views of the paw region. (E, F) Higher-magnification views of a representative hindpaw. Conventional fTIR selectively visualizes genuine paw–glass contact areas as green signals but may not reveal digit pads that do not contact the glass (E). Additional oblique white-light illumination reveals plantar anatomical structures, including non-contacting digits and their pads, while mainly preserving the fTIR-derived green signals from genuine contact areas, including metatarsal-pad contacts (F). (G) Example of insufficient white-light illumination. (H) Example of excessive white-light obscuring fTIR.
B. Animal preparation and habituation
Note on surgical procedure: For experiments involving sciatic nerve injury, rats underwent complete sciatic nerve transection followed by immediate end-to-end epineurial neurorrhaphy, as described by Bomikhov et al. (2026) [13]. Details of the surgical procedure, anesthesia, and postoperative care are provided in that publication.
1. Allow the animals to acclimatize to the animal facility for at least one week before testing. Handle each animal daily for at least three days before habituation to the gait-analysis apparatus.
2. Habituate each animal to the gait-analysis apparatus for at least two days before experimental recordings. In the present study, each habituation session lasted approximately 15–20 min per animal and was performed at a consistent time of day (e.g., 10:00–13:00) to minimize circadian variation in spontaneous locomotor activity.
3. Position the start box at the entrance of the walking corridor and allow the animal to enter the corridor voluntarily. If necessary, tilt one corner of the box downward to form a ramp leading to the corridor entrance.
4. Allow the rat to traverse the full length of the walking corridor from the start box to the goal box and to explore the corridor and goal box freely. Perform several trial runs during each habituation session.
5. If the rat pauses for more than 30 s before entering the goal box, encourage forward movement gently by slightly lifting one of the side walls of the corridor. If the rat turns around, temporarily block the start end of the corridor with a small piece of acrylic.
6. Perform at least three complete corridor traversals during each habituation session. Continue daily habituation until the animal crosses the corridor at a steady pace without freezing, stopping, or turning around.
7. Identify each animal individually before experimental testing. In the present study, rats were identified by small holes punched along the margins of the external ears.
Note: In our experiments, no food or liquid reward was used. The dark goal box at the end of the corridor served as the natural motivational endpoint, consistent with the rats’ preference for enclosed spaces.
C. Acquisition of hybrid gait recordings
1. Before each recording session, clean the transparent glass walkway with a glass-cleaning solution and ensure that the surface is free of smudges, debris, and residues that could interfere with visualization of plantar contact areas or anatomical landmarks.
2. Set the apparatus to the hybrid illumination conditions established in Section A2 and verified according to Section A3. Confirm that the green fTIR-derived contact signal and the white-light-derived plantar anatomical image are both clearly visible before beginning experimental recordings.
3. Position the rat in the start box and align the box with the entrance to the walking corridor as during habituation. Allow the animal to enter the corridor voluntarily and traverse it toward the goal box.
4. Monitor the animal during locomotion using the live camera preview. In the present study, the manufacturer's mobile application was used for live monitoring and remote control of the camera (GoPro Quik).
5. Start video recording a few seconds before the rat enters the walking corridor and continue recording until the animal has completely entered the goal box.
6. Record the identification code of the animal for each recording, either in written experimental notes or by stating it aloud at the beginning of the video, so that each video file can subsequently be assigned unambiguously to the corresponding animal and experimental session.
7. Record 1–2 complete corridor traversals per animal per experimental session, with the goal of obtaining at least 5–10 analyzable gait cycles per hindpaw. Between recordings, clean the glass walkway if paw marks, debris, or other contamination become visible.
8. Accept a traversal for subsequent analysis only when the animal exhibits continuous forward locomotion without stopping, turning around, or other non-locomotor behavior during the portion of the recording from which gait cycles are selected. Repeat the traversal if these criteria are not met.
Critical: Do not modify the illumination or camera settings between animals or experimental groups within the same study unless image quality requires correction. If adjustment is necessary, repeat the verification described in Sections A2–A3 before continuing data acquisition.
D. Installation of Gait2SFI and loading of gait recordings
1. Download and install Gait2SFI from the repository (https://github.com/olbmv/Gait2SFI), following the installation instructions provided with the software.
2. Launch Gait2SFI from a terminal of the operating system:
python Gait2SFI.py
3. Click Select Video and select the gait recording to be analyzed. The recording is displayed in the main Gait2SFI window (Figure 5).
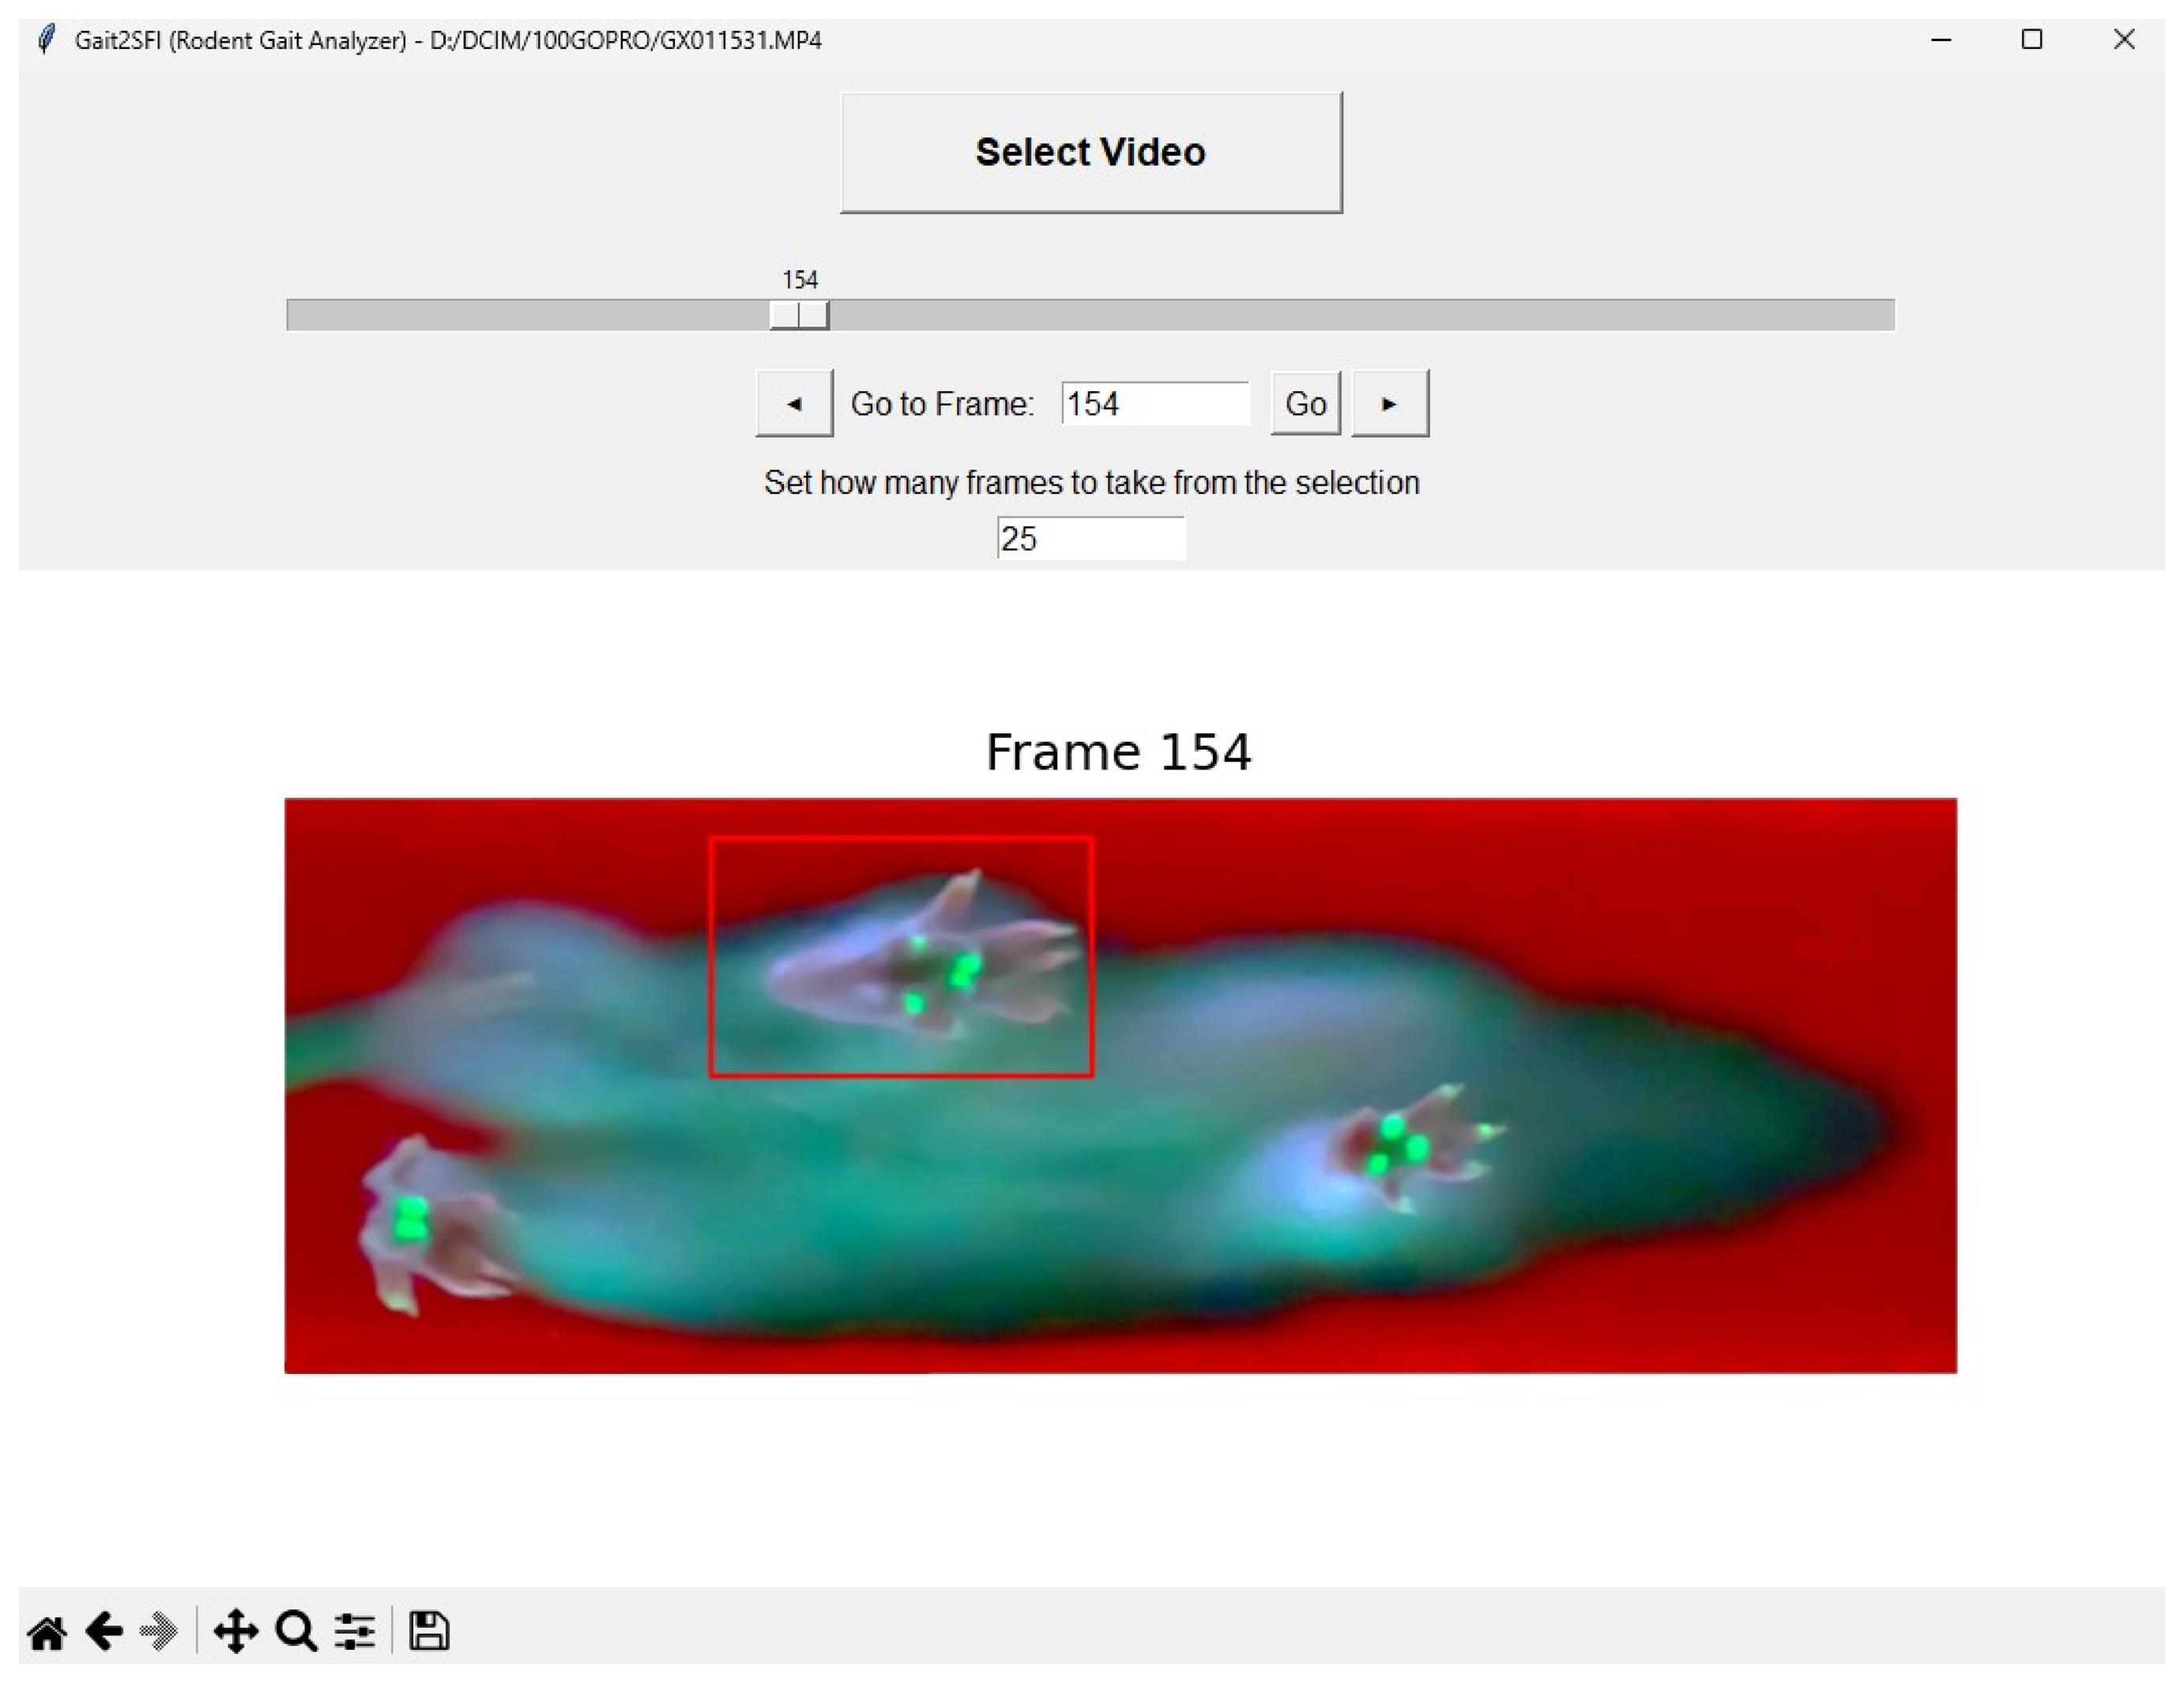
Figure 5. Main Gait2SFI interface for navigation through a gait recording and selection of a hindpaw region. The loaded video frame is displayed in the upper panel, and the magnified image of the selected hindpaw region is shown below. The red rectangle in the original frame indicates the selected region of the contralateral (intact) hindpaw. The frame slider, navigation buttons, and Go to Frame field allow navigation through the recording and selection of the frames containing the stance to be analyzed.
4. Navigate through the recording using the frame slider, the ◄ and ► buttons, or by entering a frame number in the Go to Frame field and clicking Go. The frame slider spans the complete recording from frame 0 to frame N - 1.
5. In the Set how many frames to take from the selection field, specify the number of consecutive frames to be included in the analysis window after selection of a paw region. The default value is 15 frames; values from 2 to 100 can be selected.
Note: Select an analysis window sufficiently long to encompass the complete stance phase of the hindpaw. At 50 frames/s, 15 frames correspond to 300 ms and were sufficient to encompass a typical stance phase under the recording conditions used in this study.
E. Selection of the experimental and contralateral hindpaws
1. Navigate through the recording to a frame in which the contralateral (normal) hindpaw is clearly visible. Draw a rectangular region around the contralateral (normal) hindpaw (mouse left-click).
2. Navigate through the recording to a frame in which the experimental hindpaw is clearly visible in the same gait cycle and repeat the procedure. Ensure that each selected region contains the entire hindpaw throughout the stance phase, including the digits and the posterior plantar region required for subsequent measurement of PL, TS, and ITS.
3. Verify that the experimental and contralateral hindpaws are assigned correctly in the Selected Areas window before proceeding with footprint analysis.
Critical: Select a region sufficiently large to contain the complete hindpaw throughout the analyzed stance, but avoid unnecessarily large regions containing other paws or unrelated image features that could interfere with subsequent contact-area analysis.
F. Choice of footprint representation
1. Inspection of the stance sequence: In the Selected Areas window (Figure 6), navigate through the predefined analysis interval (15 frames by default; see step D5) and identify the complete stance phase of each selected hindpaw. The experimental and contralateral regions can be navigated independently using their respective sliders and ◄ and ► buttons; the keyboard arrow keys move both regions. Inspect the individual frames to determine how plantar contact changes during the stance.
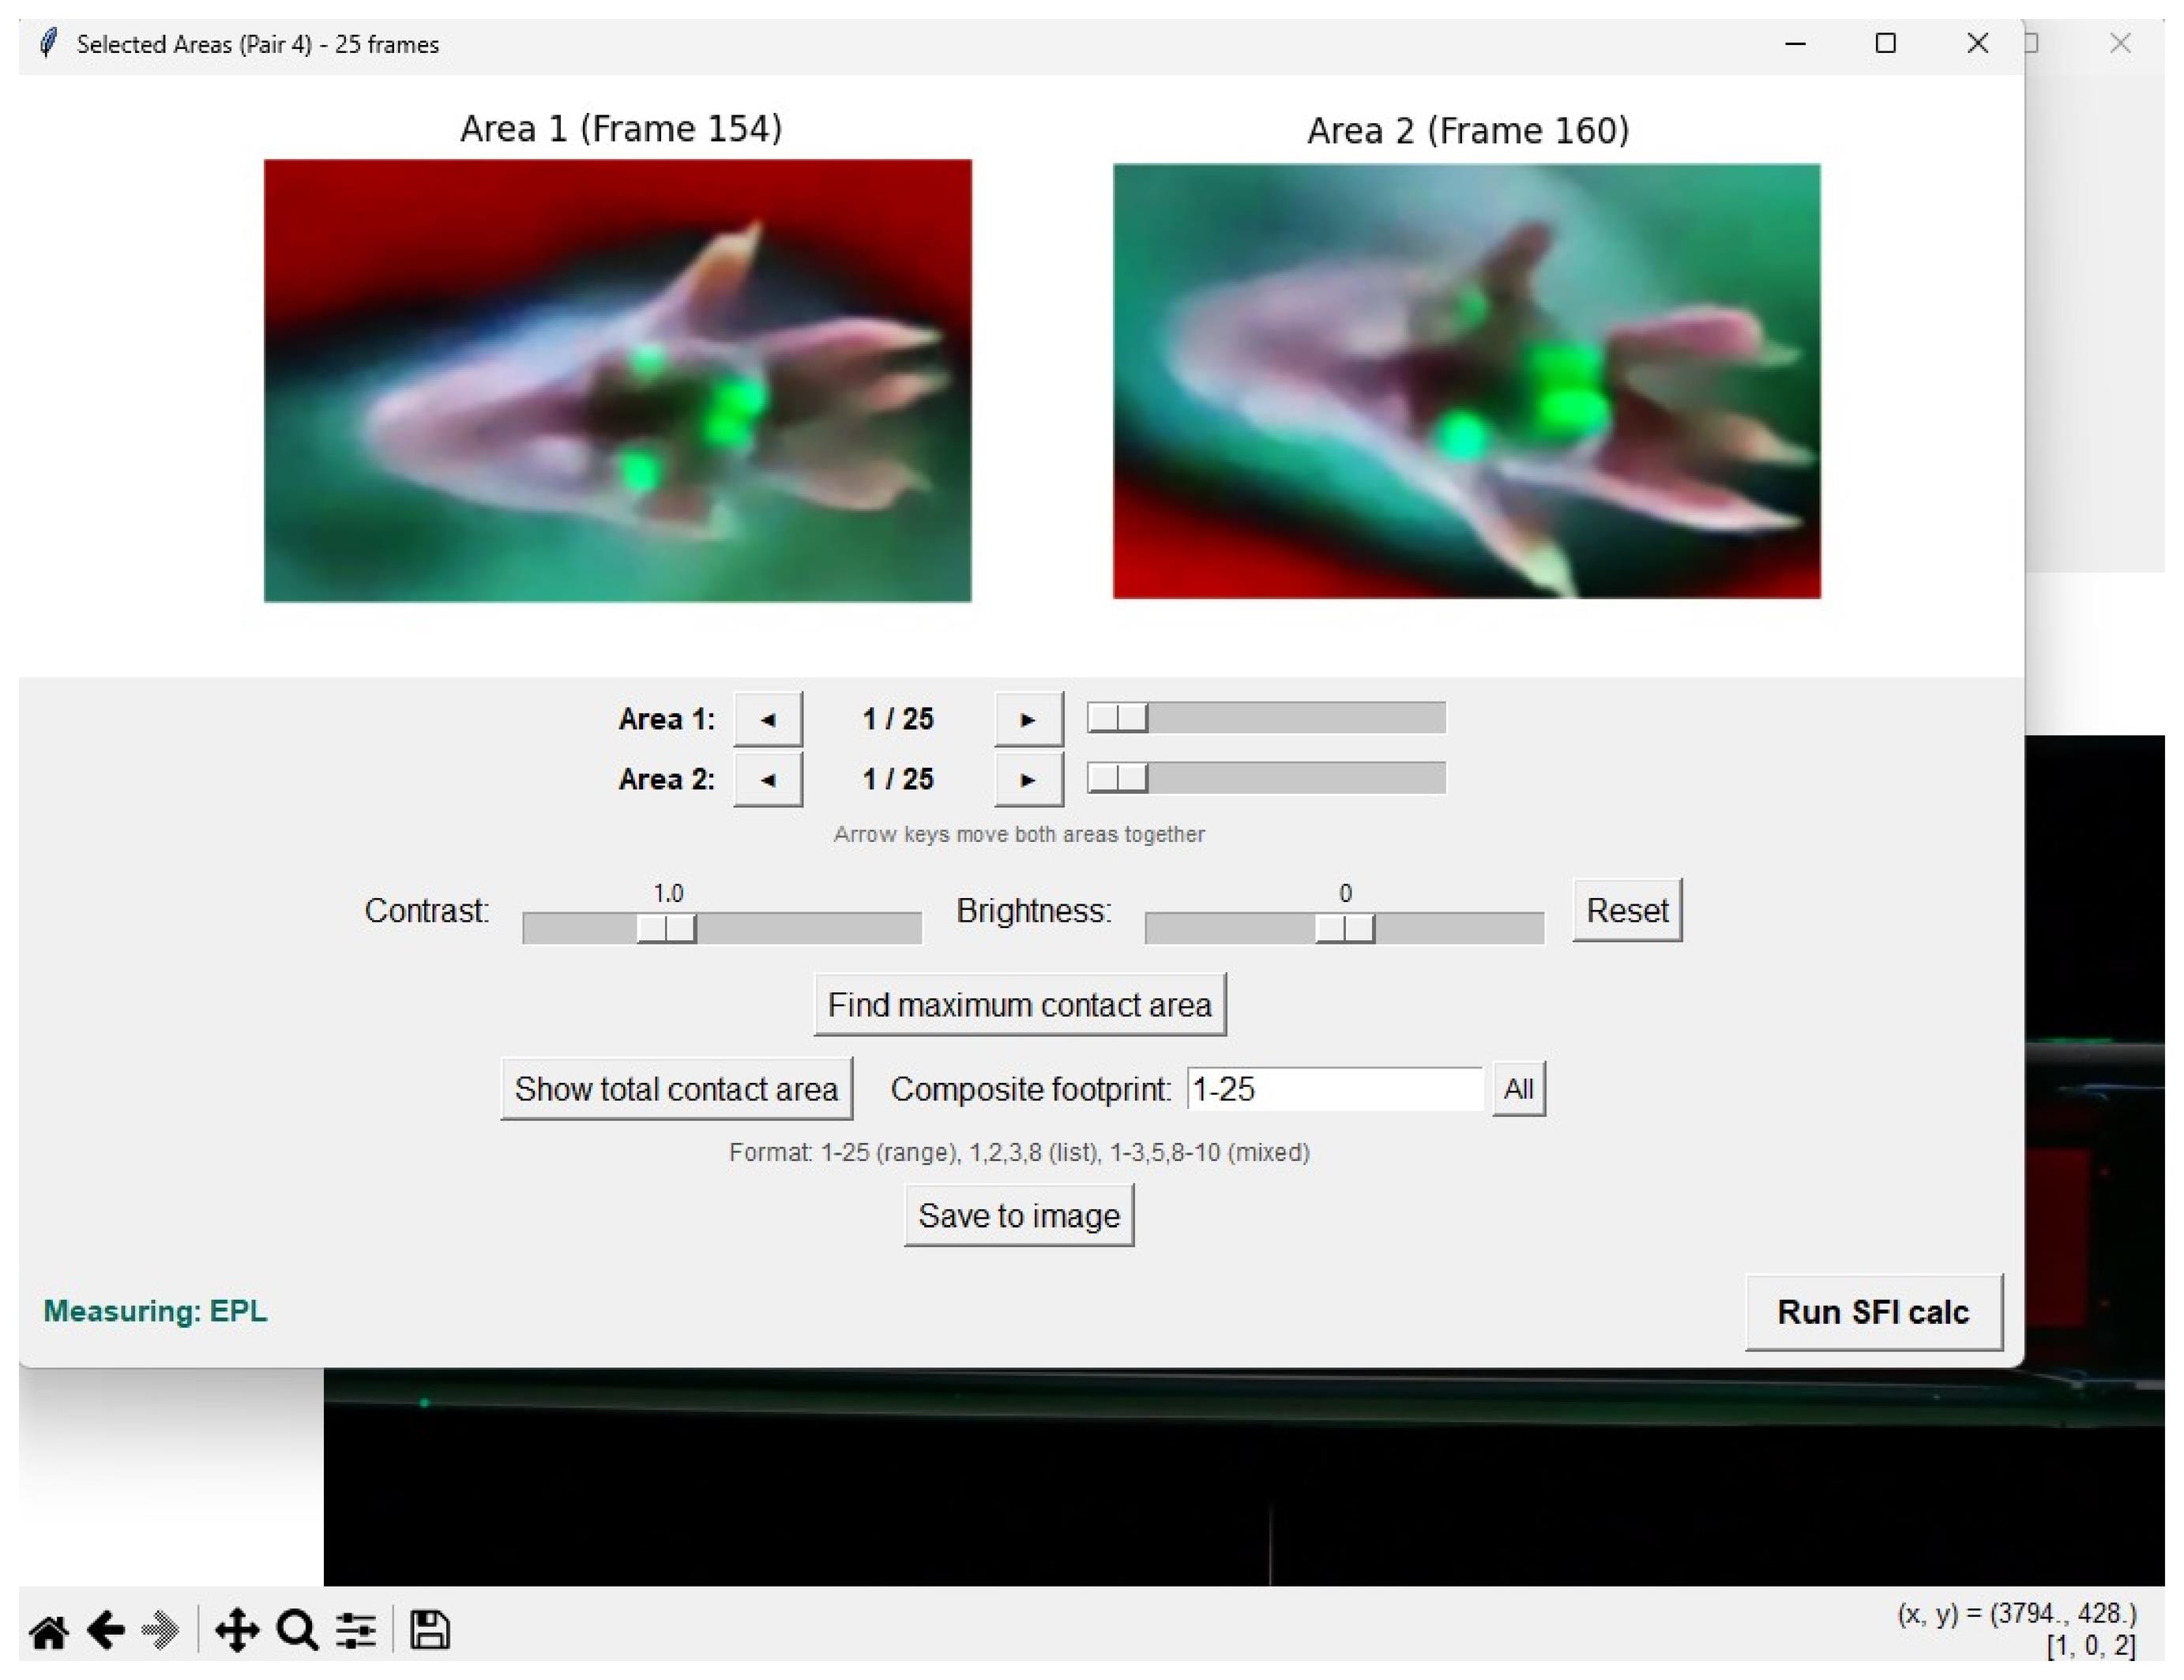
Figure 6. Selected Areas window of Gait2SFI for paired hindpaw analysis. The selected regions containing the contralateral (Area 1) and experimental (Area 2) hindpaws are displayed side by side. Each region has independent navigation controls for inspection of the corresponding frame sequence within the predefined analysis interval. The window allows the operator to navigate through the stance, identify the maximum contact area frame, and generate alternative footprint representations such as the total or composite contact area for subsequent measurement of SFI parameters.
2. Maximum contact area footprint. Click Find maximum contact area. Gait2SFI examines the frames within the selected analysis interval separately for each hindpaw and displays the frame containing the largest total plantar contact area. The number of green pixels representing the detected contact area is reported for each region. This frame represents the maximum contact area footprint and can be used for measurement of PL, TS, and ITS when the required anatomical landmarks are identifiable.
Note: Once identified, the maximum contact area frame is retained during subsequent image operations unless the corresponding region is moved deliberately using its navigation controls.
3. Total print area. To generate the total print area, click Show total contact area. Gait2SFI combines the plantar contact areas detected in the stance frames into a single image representing all regions of the plantar surface that contact the glass during the stance.
4. Composite footprint. To generate a composite footprint for SFI measurement, begin with the maximum contact area frame and combine the minimum number of consecutive frames required to identify all anatomical landmarks necessary for measurement of PL, TS, and ITS. Add consecutive frames only until all required landmarks are identifiable; do not include additional frames once this criterion has been met.
Note: In the Composite footprint field, frames can be specified as a range (e.g., 3–8), as individual frame numbers separated by commas (e.g., 1, 2, 3, 8), or as a combination of ranges and individual frames (e.g., 1–3, 5, 8–10).
5. Image adjustment, if required. Use the Contrast and Brightness controls when necessary to improve visualization of plantar anatomical landmarks and contact areas. These adjustments affect only the displayed image; detection and quantification of the green fTIR-derived contact area are performed on the unmodified frames. Click Reset to restore the default display settings.
G. Measurement of the SFI parameters
1. After selecting the footprint representation to be analyzed as described in Section F, click Run SFI calc. The SFI calculator opens within Gait2SFI, and an indicator showing the parameter to be measured appears in the lower part of the Selected Areas window (Figure 7).
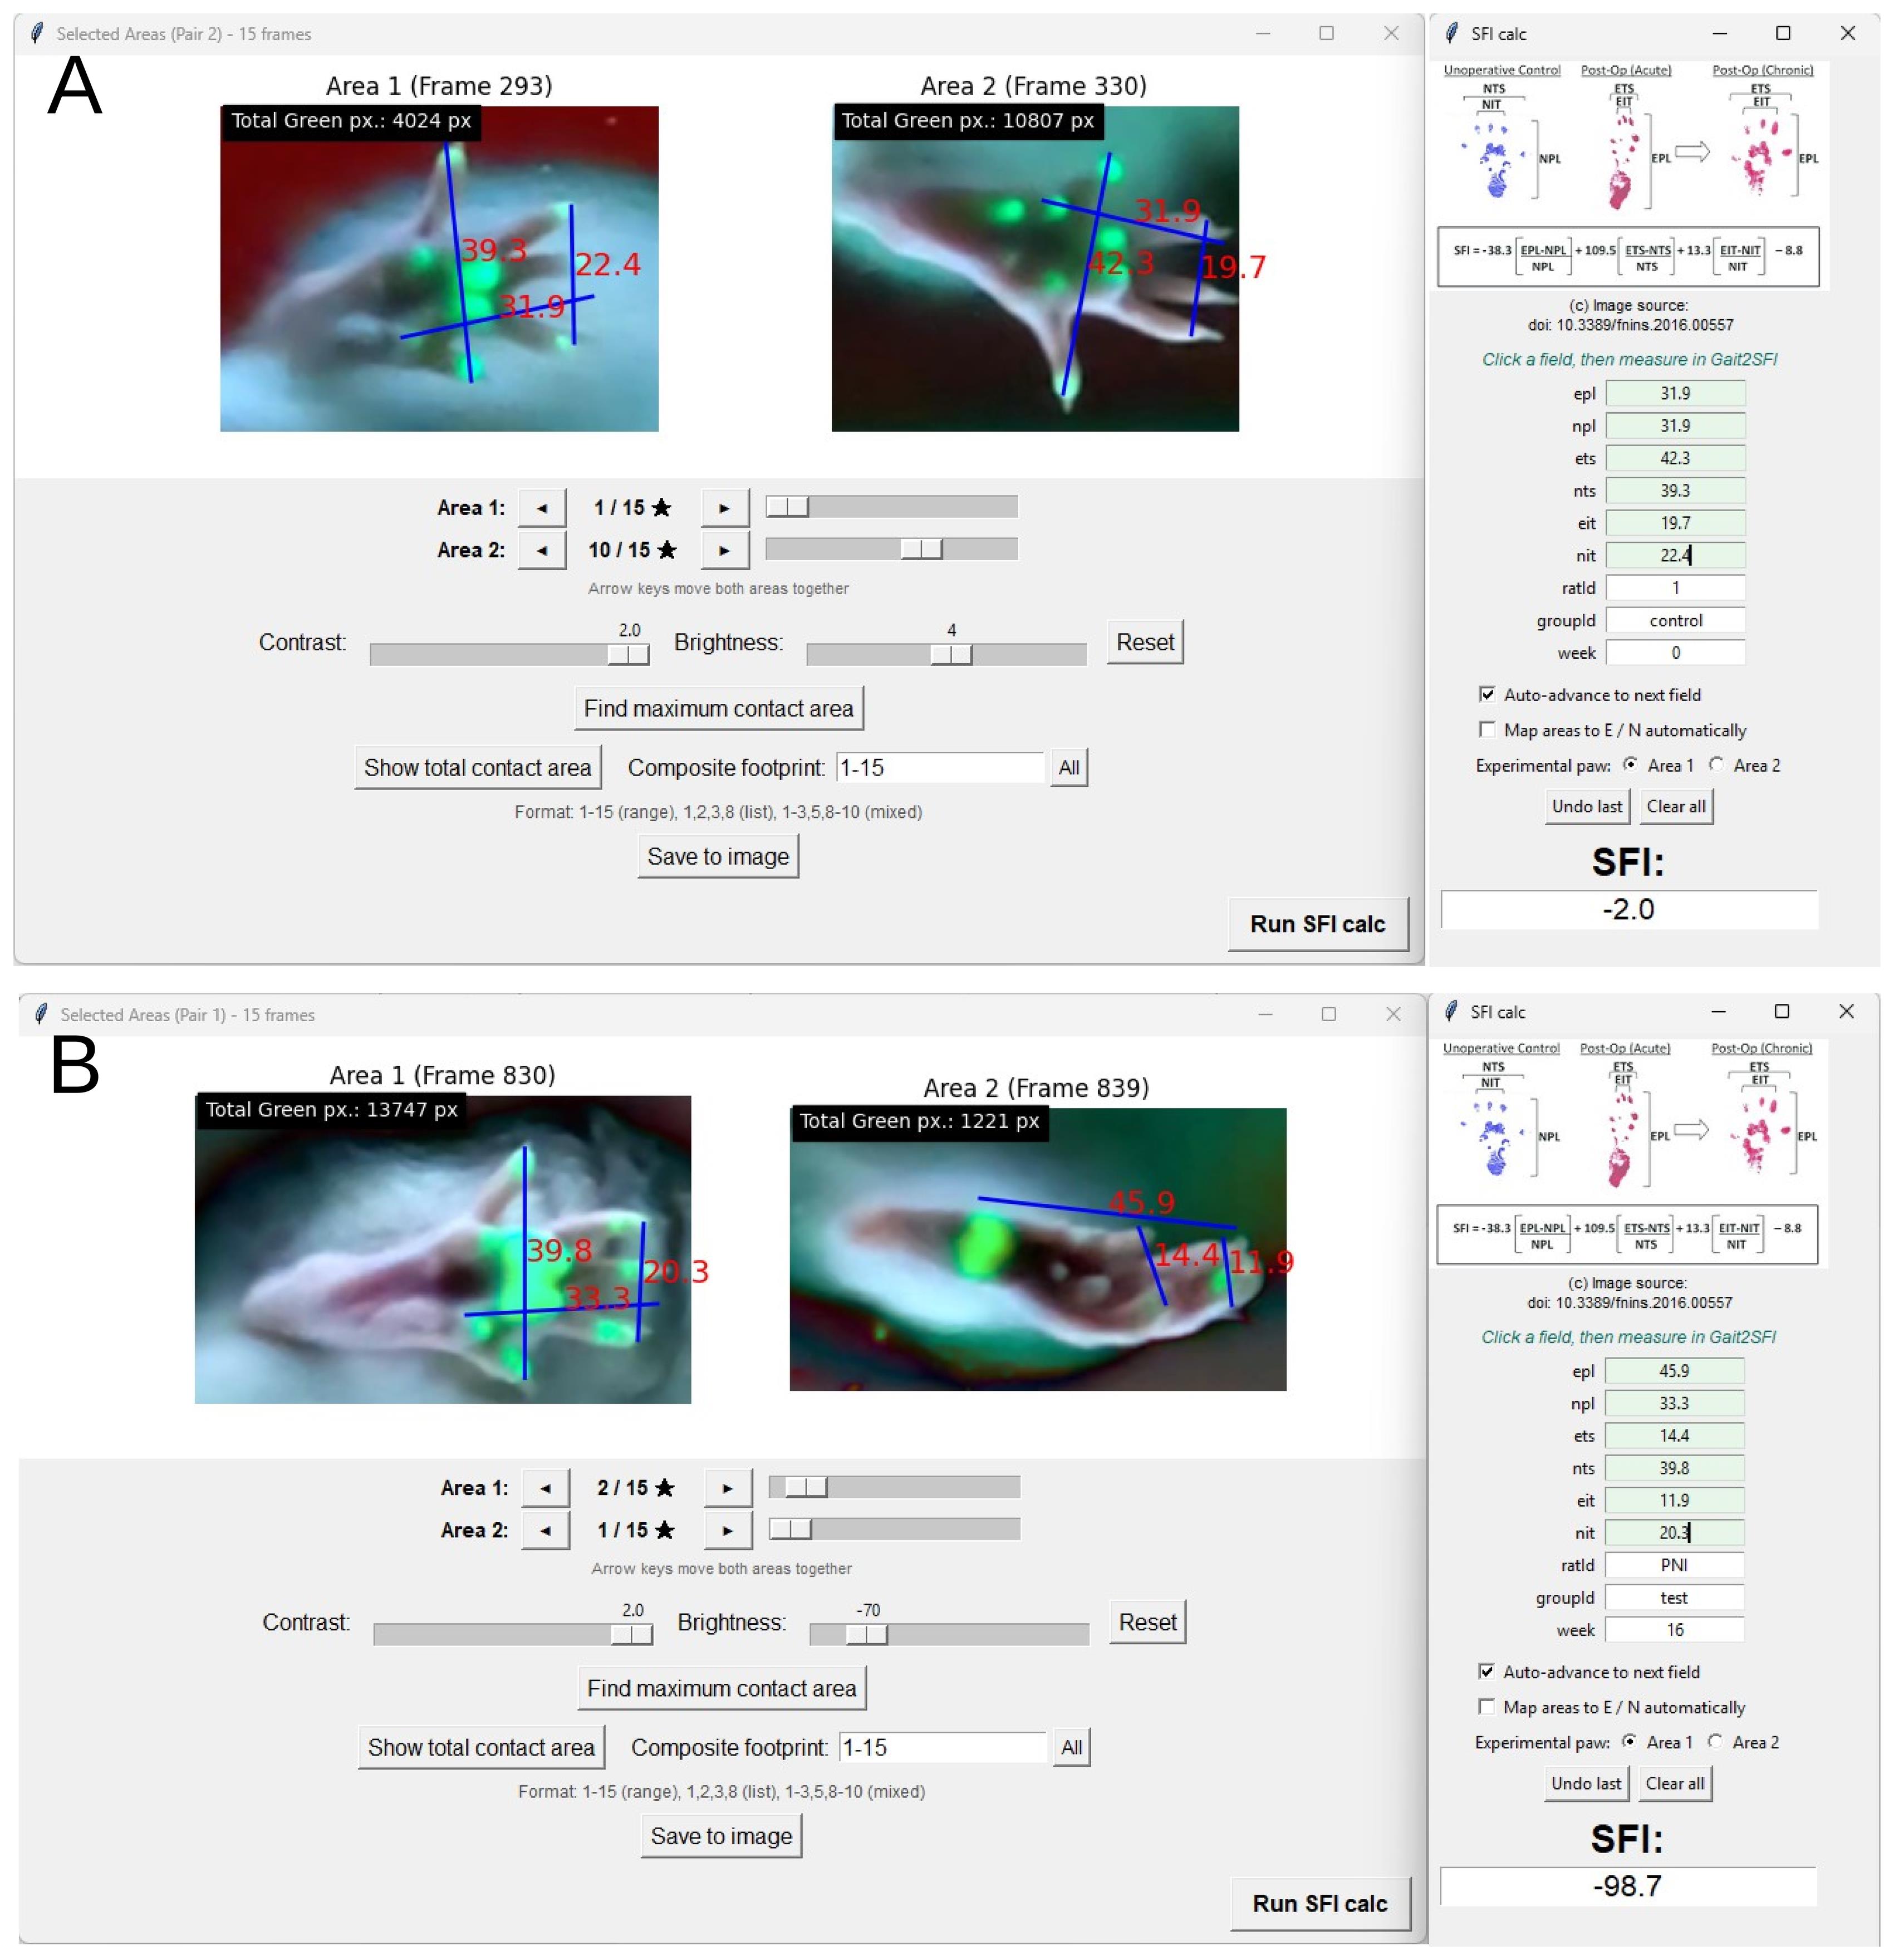
Figure 7. Measurement of SFI parameters in Gait2SFI. (A) Example of SFI calculation for a healthy rat. (B) Example of SFI calculation for a rat with peripheral nerve injury. The selected experimental and contralateral hindpaw footprints are displayed in the Selected Areas window. Linear segments corresponding to print length (PL), toe spread (TS), and intermediary toe spread (IT) are defined by selecting the corresponding anatomical landmarks. PL is measured from the posterior plantar reference point to the pad of the third digit identified in the hybrid image, TS between the distal ends of the pads of the first and fifth digits, and IT between the distal ends of the pads of the second and fourth digits. Measured values are transferred to the corresponding experimental (E) and contralateral (N) fields of the SFI calculator for subsequent calculation of the Sciatic Functional Index.
2. Measure each linear parameter by clicking the two anatomical landmarks defining the corresponding segment with the left mouse button. The first click defines the beginning and the second click the end of the segment. The measured segment and its value are displayed on the image.
3. Measure the three parameters required for SFI calculation on both the experimental and contralateral hindpaws:
a. PL (print length): Distance along the longitudinal axis of the footprint from the posterior plantar reference point to the distal end of the third digit pad.
b. TS (toe spread): Distance between the distal ends of the first and fifth digit pads.
c. IT (intermediary toe spread; ITS in the conventional SFI literature): Distance between the distal ends of the second and fourth digit pads.
The prefix E denotes measurements from the experimental hindpaw (EPL, ETS, EIT), and the prefix N denotes measurements from the contralateral hindpaw (NPL, NTS, NIT).
4. Use the complementary fTIR and white-light information to identify the landmarks required for SFI measurement. First, use the WL image to determine the anatomical identity of fTIR-positive regions and retain only anatomically appropriate plantar contacts as SFI landmarks; fTIR-positive regions corresponding to other contacting paw structures should not be used. For PL, define the posterior reference as the most posterior anatomically appropriate plantar contact identified by fTIR and the distal reference as the pad of the third digit identified in the hybrid image. For TS and IT, use all digit-pad information available from fTIR and supplement missing landmarks with their anatomical positions revealed by WL. Apply the same criteria to the experimental and contralateral hindpaws throughout the study.
5. If a measurement is placed incorrectly, click the right mouse button to clear the measurement segments and repeat the measurement. The selected footprint representation remains unchanged.
Note: Gait2SFI reports linear measurements in internally scaled units. Because SFI is calculated from ratios of experimental and contralateral measurements, an identical linear scaling factor applied to both paws does not affect the calculated SFI. Calibration against a reference object of known length is required only when absolute dimensions are to be reported. Gait2SFI automatically applies the same magnification factor to the selected ROIs of the ipsilateral and contralateral paws, regardless of their original dimensions, thereby ensuring identical image scaling for both paws during SFI measurements.
Critical: Identify anatomical landmarks according to the same criteria for the experimental and contralateral hindpaws and across all animals and experimental groups. If a required landmark cannot be identified reliably in the selected footprint representation, do not estimate its position; use another predefined footprint representation or exclude the gait cycle according to the study's inclusion criteria.
H. Calculating and exporting the SFI
1. After Run SFI calc is selected, the EPL field is highlighted and the indicator Measuring: EPL appears in the Selected Areas window. Measure the corresponding parameter as described in Section G. The measured value is transferred automatically to the highlighted field of the SFI calculator.
2. When Auto-advance to next field is enabled (default), the calculator advances automatically through the six required measurements in the following order: EPL → NPL → ETS → NTS → EIT → NIT. Continue measuring the corresponding segments until all six fields have been completed.
3. To correct an incorrectly transferred value, click Undo last and repeat the corresponding measurement. Click Clear all to remove all six measurements and restart the measurement sequence.
Note: Values can also be entered manually into the calculator fields. The SFI calculator can be launched independently by running python SFI.py; in this mode, values are entered manually.
4. Enter the animal and experimental identifiers in the ratId, groupId, and week fields. After all six measurements have been entered, click the SFI field to calculate the Sciatic Functional Index according to the Bain, Mackinnon, and Hunter equation:
SFI = -38.3 × (EPL - NPL)/NPL + 109.5 × (ETS - NTS)/NTS + 13.3 × (EIT - NIT)/NIT - 8.8
The calculated SFI is rounded to one decimal place and displayed in the SFI field.
5. If the SFI cannot be calculated, Gait2SFI displays an error indicating whether one or more measurements are missing, a field contains a non-numerical value, or a denominator (NPL, NTS, or NIT) is zero. Correct the indicated field and repeat the calculation.
6. Each successful calculation is automatically appended as a new row to the data.csv file in the working directory. The exported record includes the video file name, the six measured parameters (EPL, NPL, ETS, NTS, EIT, and NIT), date and time of calculation, animal and experimental identifiers, calculated SFI, sequential footprint-pair number, and the frames used for measurement.
Note: The frame information is stored separately for Area 1 and Area 2. When a footprint generated from multiple frames is analyzed, the corresponding frame range is recorded, allowing the source frames used for each SFI calculation to be identified retrospectively.
7. To save the analyzed footprint pair as an image, click Save to image. Gait2SFI saves the displayed pair as a PNG file at 300 dpi. Individual displayed frames can also be exported using the save function in the image toolbar.
8. To analyze another footprint pair or animal, close the Selected Areas window and repeat Sections E–H. Gait2SFI automatically increments the pair number.
Note on terminology: The abbreviation IT is used in the Gait2SFI interface and data.csv file; the same parameter is frequently referred to as ITS (intermediary toe spread) in the literature.
Data analysis
The data analysis workflow follows the steps described in the Procedure section (Sections F–H) and illustrated in Figures 6 and 7, which show the selection of footprint representations and placement of PL, TS, and IT landmarks, respectively. Only periods of continuous forward locomotion were analyzed. Gait cycles in which the animal stopped, hesitated, turned, groomed, accelerated, or decelerated were excluded. A recording session was considered valid when the necessary number of corridor traversals (1–3 in our experiments) were obtained for the animal, providing several analyzable stances per paw. A stance was considered analyzable for SFI estimation only when all anatomical landmarks required for print length (PL), toe spread (TS), and intermediary toe spread (IT) could be identified in the selected footprint representation (the maximum contact area frame or the total print area or a composite footprint); stances in which one or more required landmarks could not be identified were classified as unmeasurable. For the comparison with the classical paper–ink method, sessions in which the ink footprint did not permit a complete set of measurements (paw dragging, poorly defined digit impressions, or absence of measurable toe spread) were not discarded but were assigned the conventional floor value of SFI = -100 to represent a complete functional deficit; these floor-assigned values were flagged and reported separately (see Validation of protocol). Gait2SFI yielded graded, calculated SFI values in all analyzed sessions and did not require floor assignment.
Each animal should be treated as a biological replicate. Multiple SFI measurements obtained from different gait cycles within the same recording session represent repeated measurements within an animal and should not be treated as independent biological replicates. For group or longitudinal analyses, repeated SFI measurements obtained within a recording session should be summarized to obtain one session-level SFI value for each animal. In the present study, the mean of the repeated SFI measurements was used as the animal-session value.
The same footprint representation (maximum contact area frame, total print area, or composite footprint) and measurement criteria should be applied consistently throughout a study and across experimental groups.
Validation of protocol
The hybrid gait-analysis approach was validated in a stepwise manner according to the principal methodological limitations addressed by the protocol. First, we determined whether conventional contact-only fTIR recordings consistently visualize the plantar landmarks required for calculation of the classical SFI in healthy rats and after sciatic nerve injury (SNI). Second, we examined whether simultaneous acquisition of fTIR-derived contact information and white-light-derived plantar anatomical information increases the proportion of maximum contact area frames suitable for complete SFI estimation in healthy animals. Third, we tested whether the hybrid approach enables SFI estimation after SNI, when pathological changes in hindpaw placement substantially reduce digit-pad contact. Finally, SFI values obtained using hybrid fTIR+WL imaging were compared with those obtained using the classical paper–ink walking-track method in a longitudinal study before and after SNI.
Additional validation data for the SFI measurements obtained with Gait2SFI are available in Bomikhov et al. (2026) [13], specifically in Figures 1 and 4 (longitudinal SFI dynamics in isoflurane and ketamine/xylazine anesthesia groups). For quantitative validation of image acquisition, recorded gait sequences were additionally analyzed using a custom MATLAB algorithm. The algorithm identified individual paws, segmented fTIR-derived contact areas according to pixel color and intensity, tracked paw contacts throughout the stance, and quantified contact area and pixel-intensity distributions in individual frames. Contact area was expressed as the number of detected pixels and was used to objectively identify the maximum contact area frame for each stance. The resulting images were also used to determine whether the digit-pad contacts and anatomical landmarks required for SFI measurement were identifiable. The same analytical criteria were applied to conventional fTIR and hybrid fTIR+WL recordings.
Efficiency of the fTIR-based system for SFI estimation
We first examined plantar contact patterns recorded using conventional fTIR imaging. Representative recordings and stance sequences from a healthy rat are shown in Video 1 and Figure 8A–D. Frames spanning individual forepaw and hindpaw stances within the same gait cycle were analyzed, and the fTIR-derived contact area was quantified in each frame. This allowed the maximum contact area frame to be identified objectively rather than selected visually. Six representative frames from each stance, including the maximum contact area frame, are shown in Figure 7B–D.
Forepaw recordings served as an internal control for the ability of the fTIR system to detect digit-pad contacts. All four forepaw digit pads were detected in the maximum contact area frame in 72.6% (146/201) of analyzed stances. In contrast, hindpaw digit-pad contact varied markedly throughout the stance. At least one of the five hindpaw digit pads was absent from the maximum contact area frame in 87.6% of analyzed stances; accordingly, all five digit pads were detected in only 12.4% (25/201) of maximum contact area frames (Figure 8I). The difference between forepaw and hindpaw detection success was large and highly significant (mean paired difference, 57.7 percentage points; Wilcoxon signed-rank test, P = 1.7 × 10⁻⁶; n = 25 rats, 30 videos). Thus, even in healthy rats, conventional fTIR imaging provided a maximum contact area frame containing the complete set of hindpaw digit-pad landmarks required for SFI estimation in only a small proportion of stances.

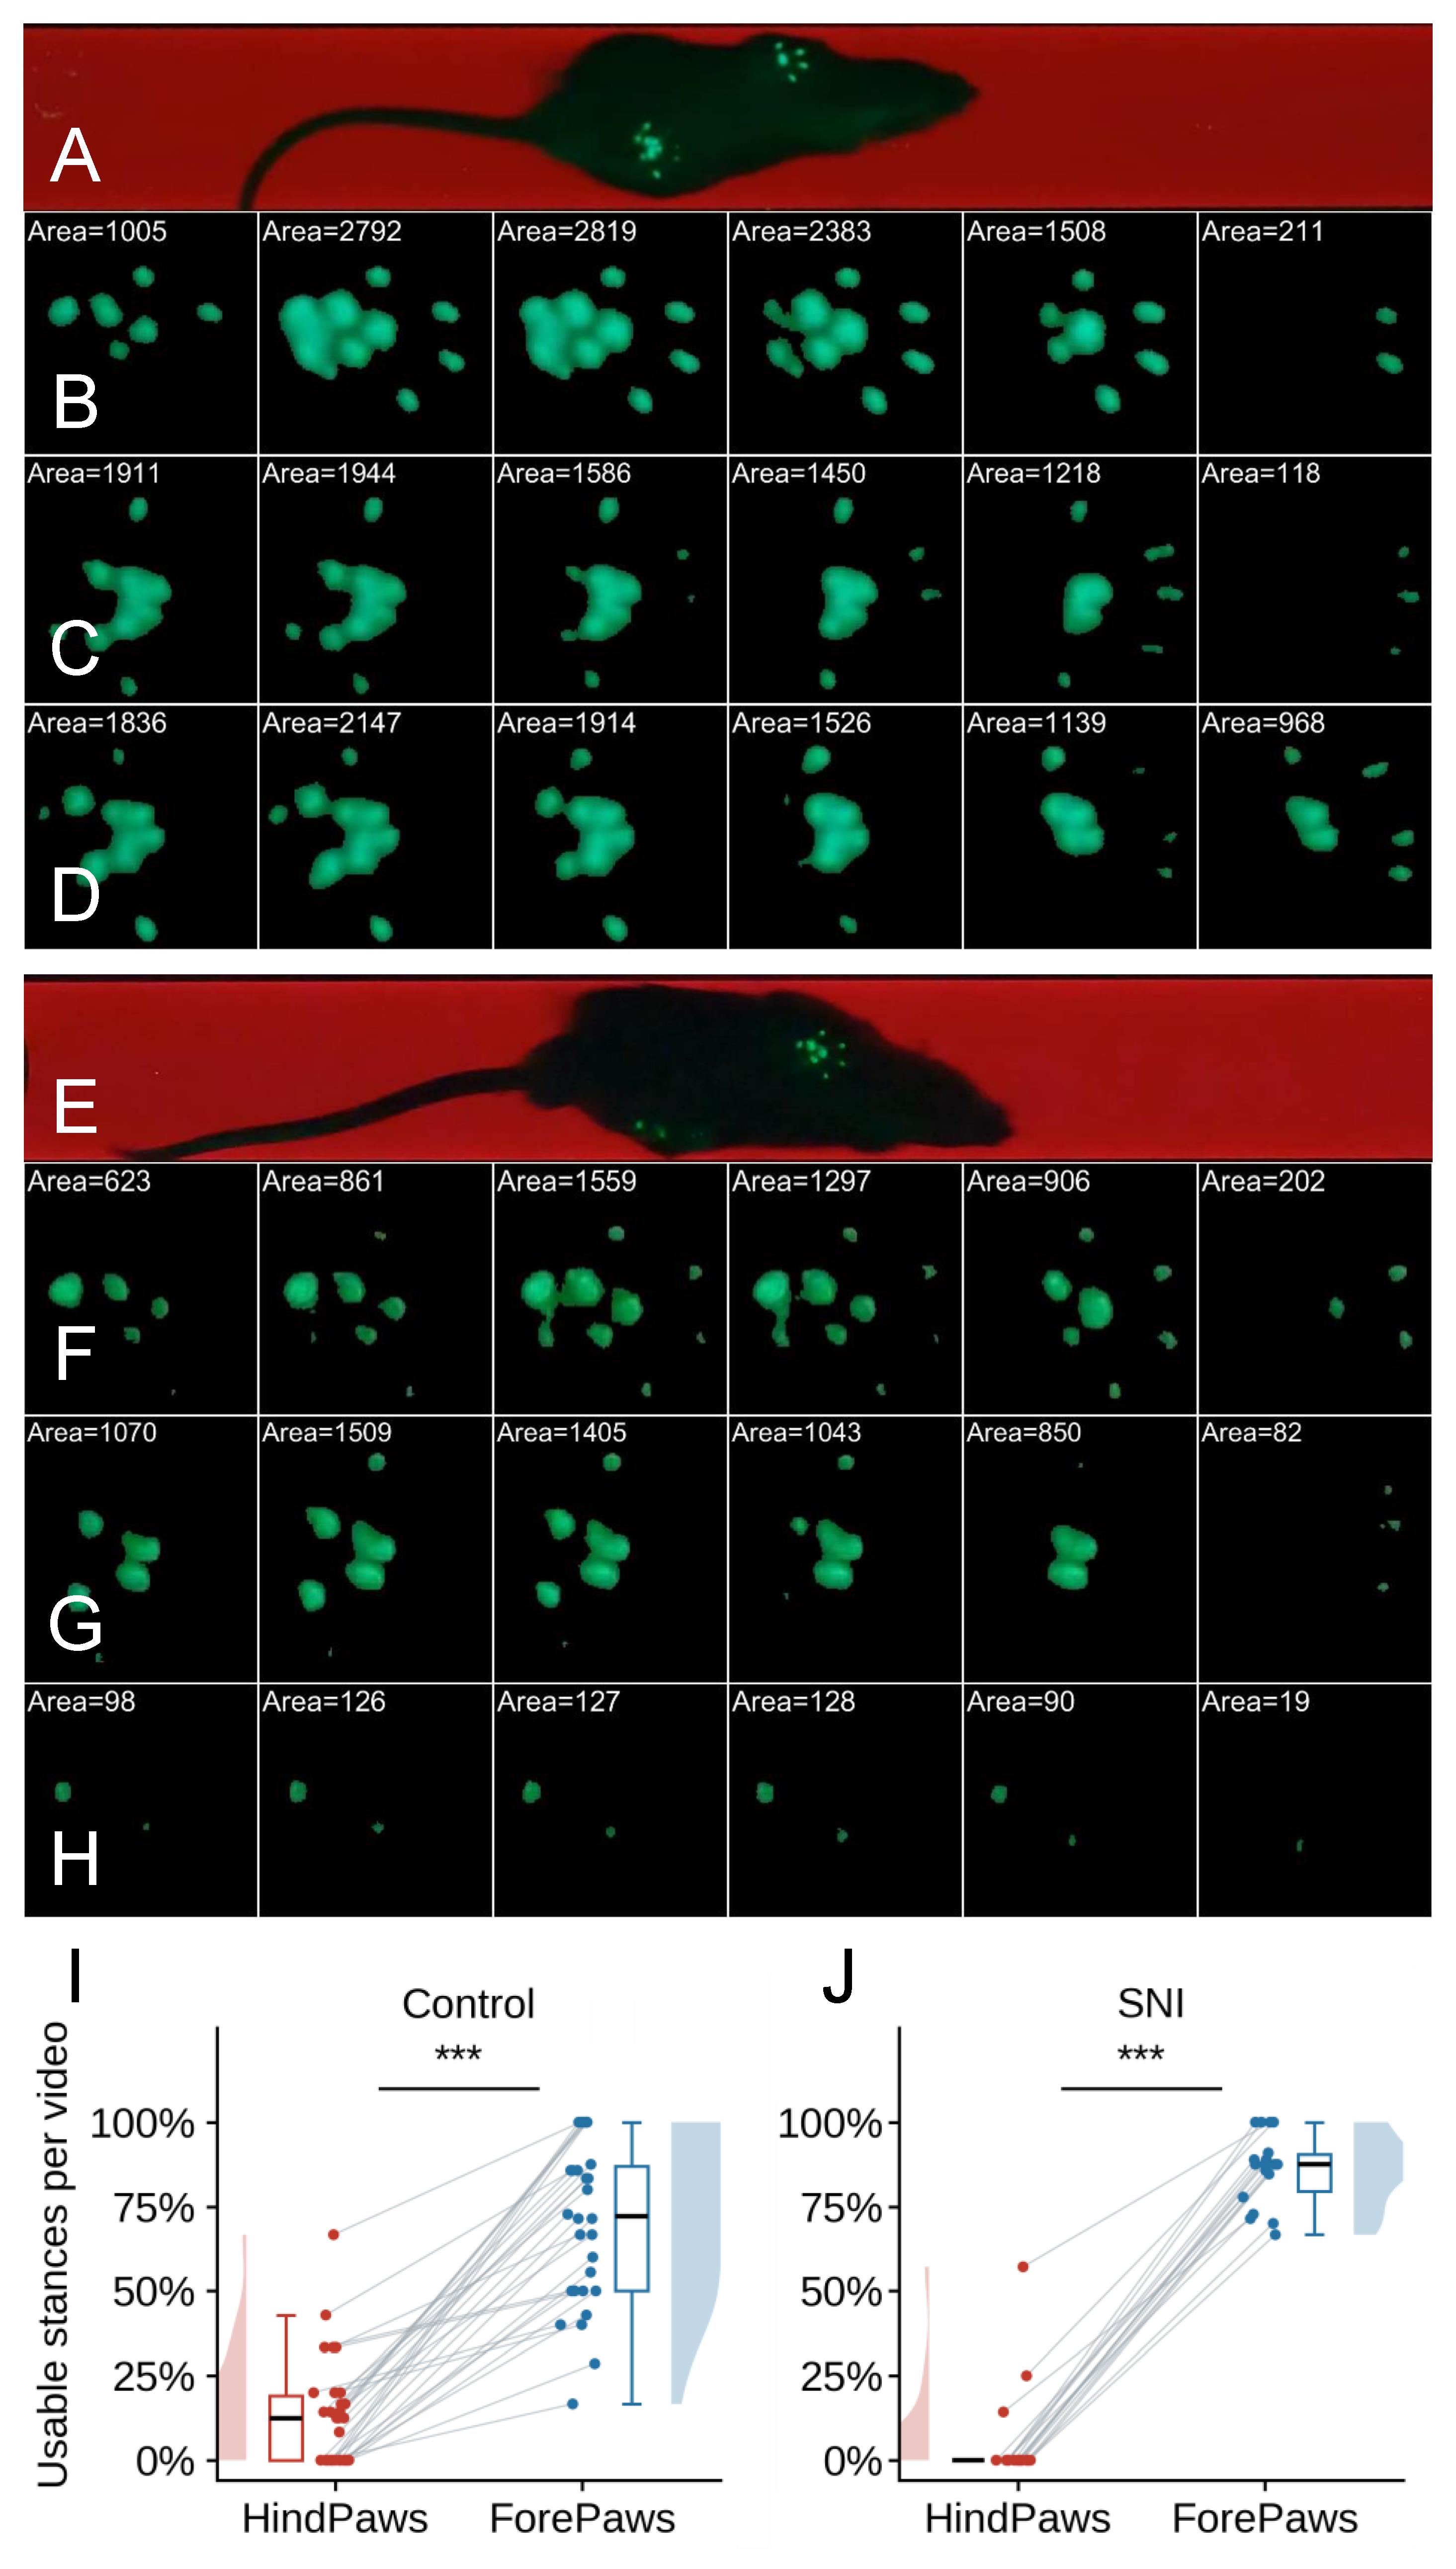
Figure 8. Dynamic plantar contact patterns recorded by conventional fTIR imaging in healthy and sciatic nerve–injured rats. Representative fTIR recordings illustrate paw–glass contact during individual stance phases. The contact area in each frame, expressed as the number of detected fTIR-positive pixels, is indicated above the corresponding footprint and was used to objectively identify the maximum contact area frame within each stance. (A–D) Healthy control rat. (A) Representative frame showing the animal during normal locomotion. (B) Six representative frames spanning a forepaw stance. The four forepaw digit pads are clearly represented during the stance, including in the maximum contact area frame. (C, D) Six representative frames spanning the stance phases of the left and right hindpaws, respectively. In contrast to the forepaw, hindpaw digit-pad contact changes markedly during stance, and one or more of the five digit pads may be absent from individual frames, including the maximum contact area frame. Thus, the frame with the largest total plantar contact area does not necessarily contain all digit-pad landmarks required for SFI measurement. (E–H) Rat after sciatic nerve injury (SNI). (E) Representative frame showing locomotion after SNI. (F) Six representative frames spanning a forepaw stance, demonstrating preserved detection of the four forepaw digit pads by fTIR. (G) Six representative frames spanning the stance of the contralateral hindpaw. Although plantar contact is readily detected, individual digit-pad contacts vary throughout the stance and are not necessarily all represented in the maximum contact area frame. (H) Six representative frames spanning the stance of the injured hindpaw. Plantar contact is markedly reduced, with several digit pads remaining absent throughout the illustrated stance, including in the maximum contact area frame. (I) Percentage of maximum contact area frames in which all digit pads were detected in forepaw and hindpaw stances of healthy control rats. Data are presented as per-video percentages, with individual videos shown as points and paired values connected by lines; box plots and marginal distributions summarize the distributions. All four forepaw digit pads were detected in 72.6% (146/201) of stances, whereas all five hindpaw digit pads were detected in 12.4% (25/201) of stances (n = 25 rats, 30 videos; Wilcoxon signed-rank test, ***P < 0.001). (J) Percentage of maximum contact area frames in which all digit pads were detected in forepaw and injured-hindpaw stances after SNI. Recordings obtained at 16–24 weeks after neurorrhaphy were pooled. All four forepaw digit pads were detected in 85.3% (133/156) of stances, whereas all five digit pads of the injured hindpaw were detected in only 3.8% (6/156) of stances (n = 15 rats, 18 videos; Wilcoxon signed-rank test, ***P < 0.001).
The same limitation was substantially more pronounced after sciatic nerve injury (SNI). SNI was produced in male Wistar rats by complete sciatic nerve transection followed by immediate end-to-end neurorrhaphy using interrupted epineurial sutures [1]. Representative sequences spanning forepaw and hindpaw stances from an SNI rat are shown in Figure 8E–H. Across recordings obtained at 16–24 weeks after SNI, all four forepaw digit pads were detected in the maximum contact area frame in 85.3% (133/156) of stances, again demonstrating efficient detection of digit-pad contact by the fTIR system. In contrast, all five digit pads of the injured hindpaw were detected in only 3.8% (6/156) of maximum contact area frames (Figure 8J; Wilcoxon signed-rank test, P = 1.9 × 10⁻⁴; n = 14 rats, 18 videos). Thus, after SNI, the maximum contact area frame obtained by conventional fTIR imaging almost never contained the complete set of injured hindpaw digit-pad landmarks required for SFI estimation.
These results demonstrate that the limitation of conventional fTIR imaging for classical SFI estimation does not primarily reflect inadequate detection of paw–glass contact: forepaw digit contacts were efficiently visualized using the same optical system and recording conditions. Rather, the dynamic contact pattern of the rat hindpaw means that the anatomical landmarks required for SFI measurement do not necessarily contact the walking surface simultaneously, even at the objectively defined moment of maximum plantar contact. Following SNI, this dissociation becomes even more pronounced because pathological paw placement further reduces or alters digit-pad contact with the glass.
Digit pads absent from the maximum contact area frame may contact the glass during other phases of the stance, particularly in healthy animals. Gait2SFI can therefore generate alternative footprint representations by combining contact information from multiple frames, including the total print area and composite footprint. These representations were not included in the quantitative success-rate comparisons presented here, which were deliberately restricted to the maximum contact area frame as a single, objectively defined moment of stance. Importantly, however, even multi-frame fTIR representations did not consistently contain all landmarks required for SFI estimation: incomplete landmark representation was observed in a proportion of healthy-rat stances and in the majority of injured-hindpaw stances after SNI (data not shown). Thus, combining fTIR contact information across multiple frames can improve landmark availability but does not eliminate the fundamental limitation of contact-only imaging, particularly after nerve injury.
Hybrid fTIR+WL imaging increases the efficiency of SFI estimation in healthy rats
We next examined whether simultaneous visualization of plantar anatomy using oblique white-light illumination could overcome the limitations of contact-only fTIR while preserving objective identification of the maximum contact area frame. Representative hybrid recordings from a healthy rat are shown in Figure 9 and Video 2.
For each selected stance, all frames spanning the stance were analyzed, and six representative frames are shown in Figure 9A–C. For each frame, the original hybrid fTIR+WL image was processed to obtain the segmented fTIR-derived contact area and a pixel-intensity map restricted to the segmented contact area. The number of detected contact pixels was calculated for each frame and used to objectively identify the maximum contact area frame. Thus, identification of the maximum contact area frame was based exclusively on fTIR-derived paw–glass contact and was independent of the additional anatomical information provided by white-light illumination.
The representative sequences demonstrate that plantar contact changes substantially throughout the stance (Figure 9B, C). In the hindpaw, individual digit pads do not necessarily contact the glass simultaneously, and one or more digit pads may contribute little or no fTIR signal in individual frames, including the maximum contact area frame. However, under hybrid illumination, the anatomical positions of these digits and their pads remain clearly visible in the simultaneously acquired white-light image. At the same time, the green fTIR signal continues to identify genuine regions of paw–glass contact, including contacts of the metatarsal/tarsal region.
The advantage of hybrid imaging is not simply the visualization of additional paw structures. Rather, the fTIR and WL signals provide complementary information required for reliable identification of SFI landmarks. All usable fTIR information is retained as evidence of paw–glass contact, while the simultaneously acquired WL image identifies the anatomical structures producing these contacts and supplies the positions of digit pads that are not contacting the glass and are therefore absent from the fTIR footprint. This distinction is important because an fTIR-positive region does not necessarily represent a plantar pad appropriate for SFI measurement; depending on paw position, other paw structures may also contact the glass. Anatomical information from WL therefore allows appropriate plantar contacts to be selected and inappropriate fTIR-positive regions to be excluded.
This complementary information is particularly important for PL measurement. The posterior PL reference is defined from the most posterior anatomically appropriate plantar contact identified by fTIR, thereby preserving a genuine contact-based PL, whereas WL identifies the distal third-digit landmark even when the corresponding digit pad is not in contact with the glass. Similarly, WL supplements missing digit-pad information required for TS and IT. Thus, fTIR+WL imaging preserves genuine contact information while providing the complete anatomical landmark set required for calculation of the classical SFI.
Quantitative analysis confirmed the improvement in SFI measurability. Using conventional fTIR imaging, all landmarks required for complete SFI estimation were identifiable in the maximum contact area frame in 12.4% (25/201) of healthy-rat hindpaw stances. With hybrid fTIR+WL imaging, this proportion increased to 94.3% (66/70) of stances (Figure 9G; Hodges–Lehmann shift 85.7 percentage points; Mann–Whitney test, P = 8.4 × 10⁻⁷; n = 25 rats, 30 videos, 201 stances for conventional fTIR vs. n = 6 rats, 11 videos, 70 stances for hybrid fTIR+WL), corresponding to an approximately 8-fold increase in the success rate of SFI estimation.
The maximum contact area frame was therefore used as the principal footprint representation for quantitative validation of the hybrid approach. From the same stance sequence, the software can generate a total print area by integrating plantar contacts over the complete stance (Figure 9E) or a composite footprint by combining the minimum number of consecutive frames beginning with the maximum contact area frame required to identify all landmarks necessary for SFI measurement (Figure 9F). These alternative representations can be used for SFI estimation when appropriate for a particular experimental application but were not included in the quantitative success-rate comparison in the present validation.
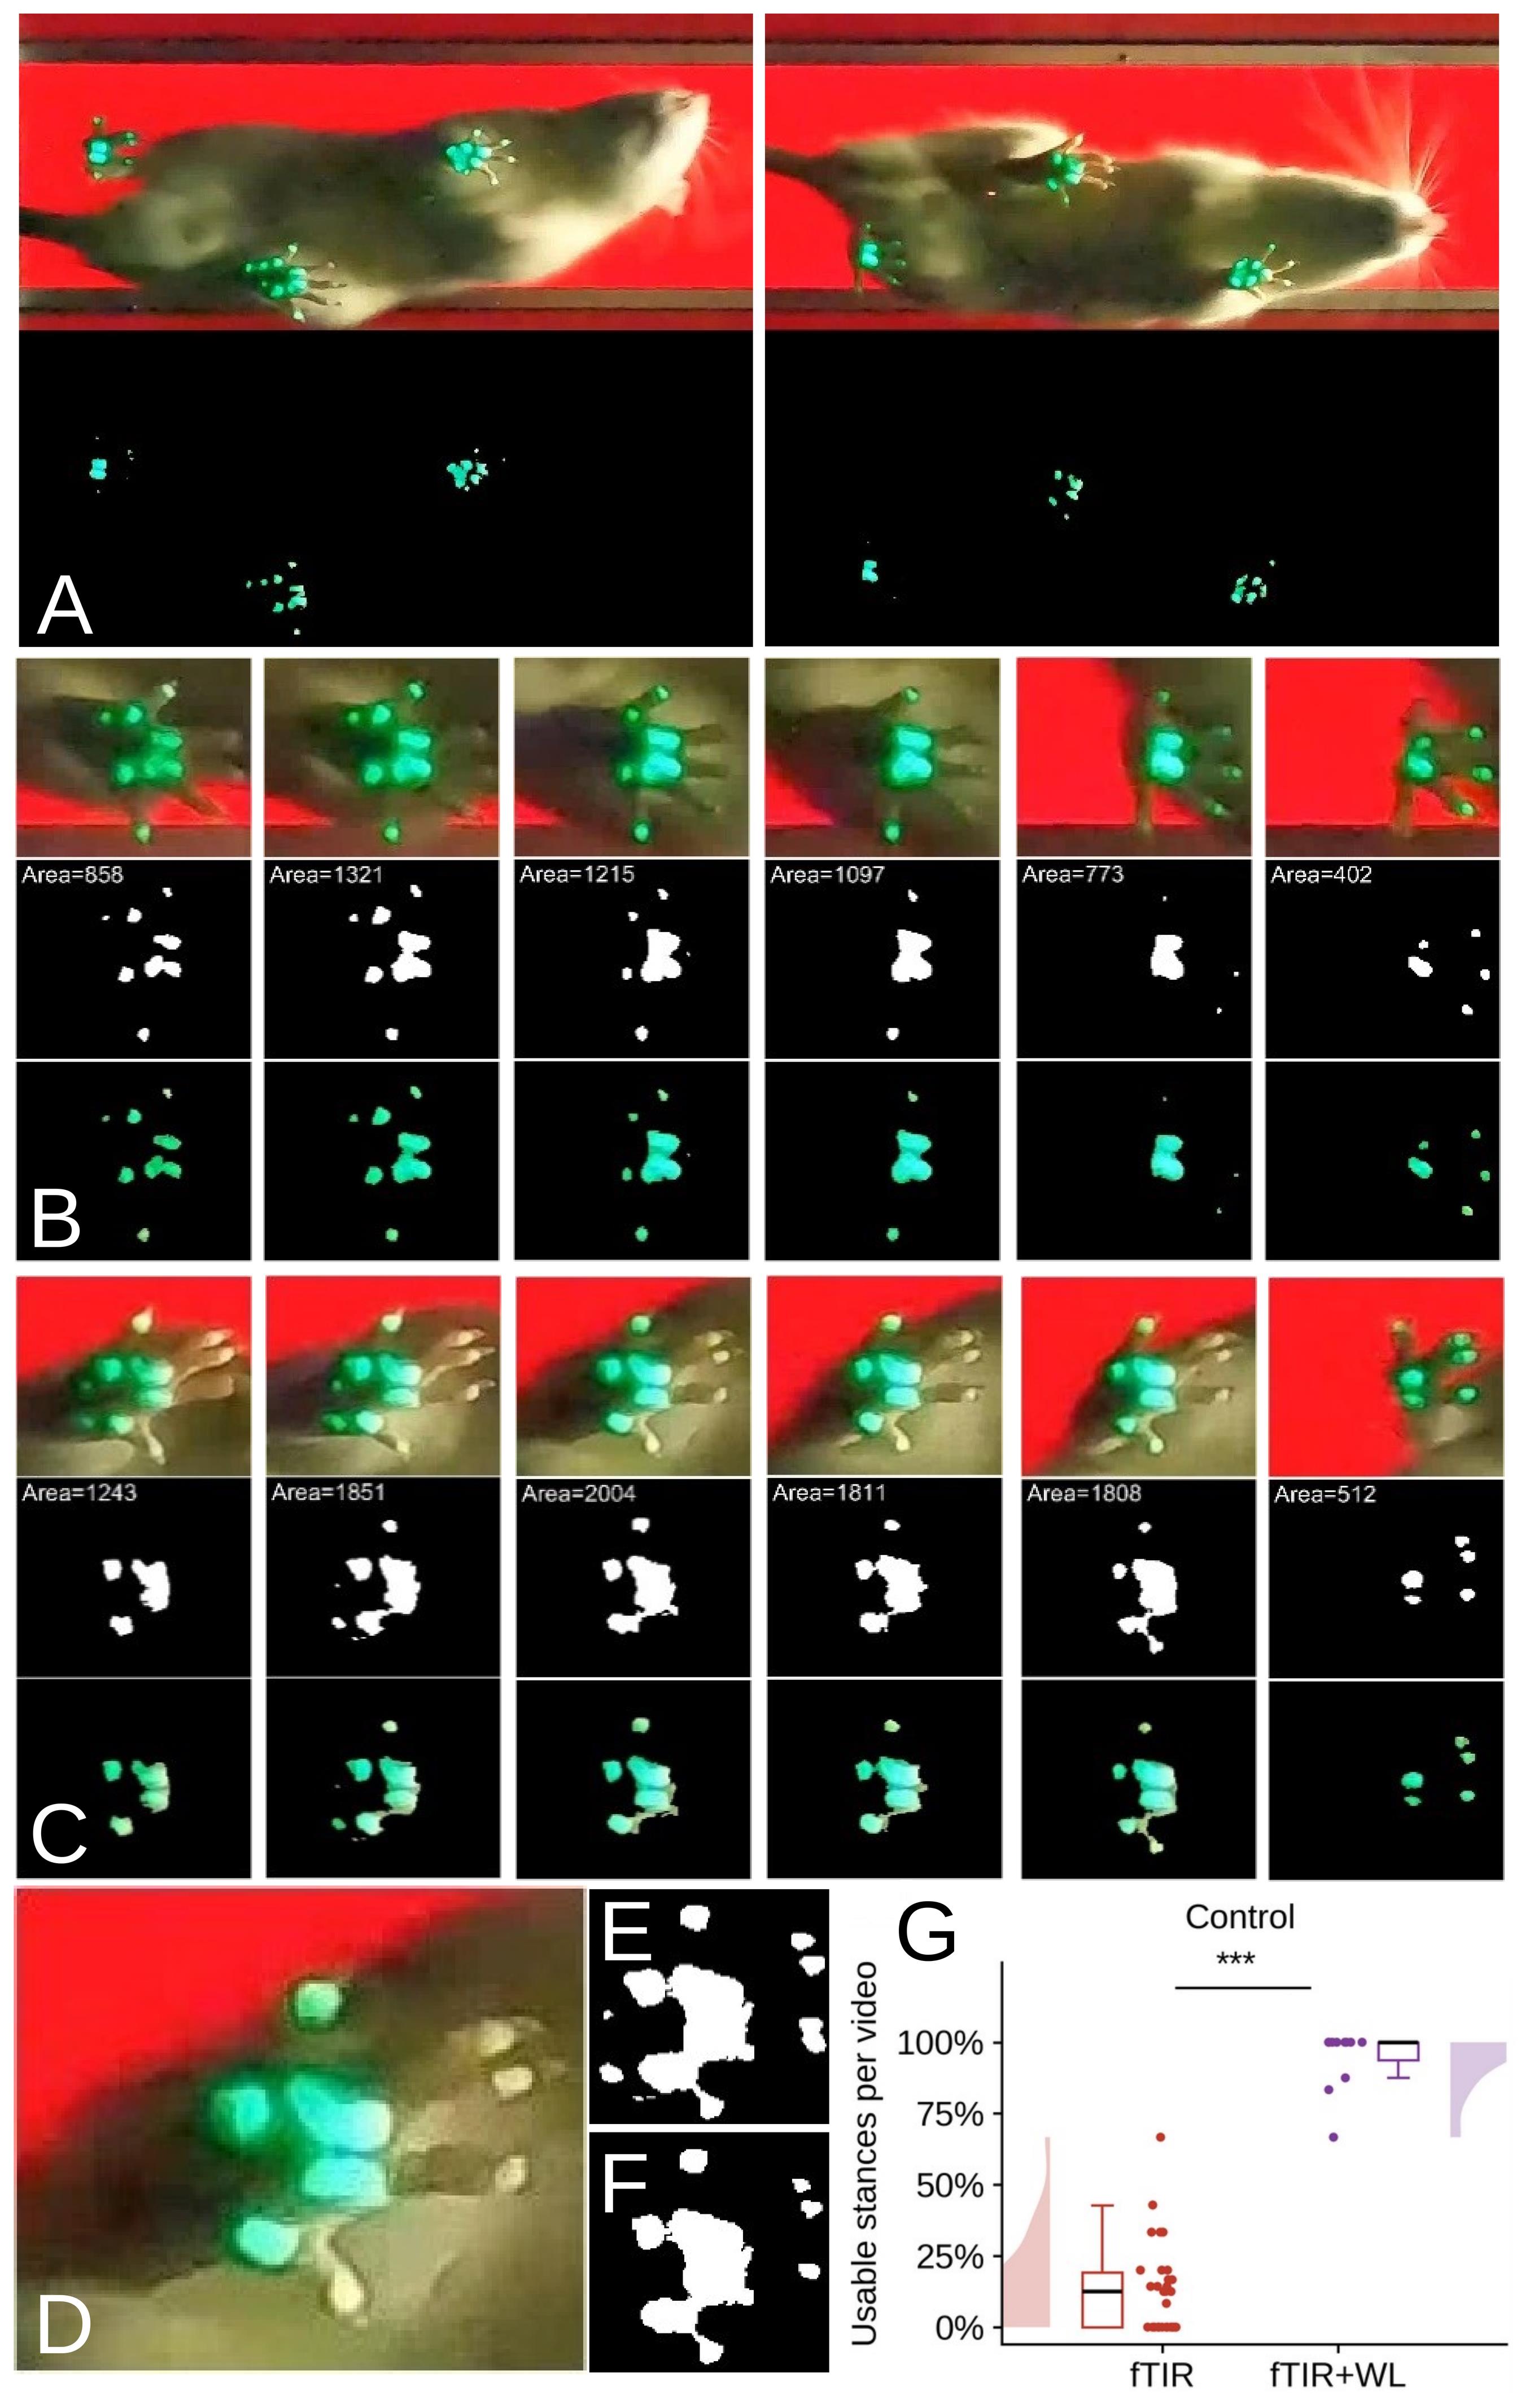
Figure 9. Dynamic visualization of plantar anatomy and contact and efficiency of SFI estimation using hybrid fTIR and white-light imaging in a healthy rat. (A) Representative views of a healthy rat during normal locomotion using simultaneous fTIR and oblique white-light (WL) illumination. The corresponding processed images show automatically detected paw-contact regions. (B) Six representative frames from an analyzed forepaw stance. For each frame, the original hybrid fTIR+WL image is shown together with the segmented fTIR-derived contact area and the corresponding pixel-intensity map restricted to the segmented contact area. All frames spanning the stance were analyzed; six representative frames are displayed. The contact area, expressed as the number of detected pixels, was calculated for each frame and used to objectively identify the maximum contact area frame. (C) Six representative frames from an analyzed hindpaw stance, displayed in the same format. Hindpaw digit-pad contact changes throughout the stance, and not all digit pads contribute to the fTIR-derived contact area simultaneously. Nevertheless, WL reveals the anatomical positions of the digits and their pads, while fTIR identifies genuine paw–glass contact. Together, these signals provide the landmarks required for PL, TS, and IT measurement in the maximum contact area frame. (D–F) Alternative representations of the same hindpaw stance. (D) Hybrid fTIR+WL image of the maximum contact area frame. (E) Total print area generated by integrating fTIR-derived contacts over the complete stance. (F) Composite footprint generated from the minimum number of consecutive frames beginning with the maximum contact area frame required to identify all landmarks necessary for SFI measurement. (G) Percentage of hindpaw stances suitable for complete SFI estimation from the maximum contact area frame using conventional fTIR and hybrid fTIR+WL imaging. Data are presented as per-video percentages, with individual videos shown as points; Mann–Whitney U = 330, ***P < 0.001 (n = 25 rats, 30 videos, 201 stances for fTIR and n = 6 rats, 11 videos, 70 stances for fTIR+WL).
Hybrid fTIR+WL imaging enables SFI estimation after sciatic nerve injury
We next examined whether hybrid fTIR+WL imaging enables SFI estimation under pathological gait conditions after sciatic nerve injury and neurorrhaphy. This represents a more stringent test of the approach because conventional fTIR recordings of the injured hindpaw frequently lack the digit-pad contacts required for measurement of the classical SFI parameters. As shown above (Figure 8), this limitation persisted throughout the examined post-injury period, and the complete set of digit-pad contacts was rarely observed in the maximum contact area frame of the injured hindpaw.
Representative recordings from a rat at 16 weeks after neurorrhaphy are shown in Figure 10 and Video 3. For each selected stance, all frames spanning the stance were analyzed, and six representative frames are shown in Figure 10B and C. As in healthy animals, the maximum contact area frame was identified objectively from the number of pixels within the segmented fTIR-derived contact area. In the injured hindpaw, plantar contact was markedly altered, and several digit pads were absent from the fTIR-derived contact footprint. Nevertheless, the simultaneously acquired white-light image revealed the anatomical positions of the corresponding digits and their pads, while the fTIR signal identified the regions of genuine paw–glass contact.
Consequently, the hybrid maximum contact area frame provided complementary anatomical and contact information even when the fTIR footprint of the injured paw was severely incomplete. The white-light-derived image permitted identification of the digit landmarks required for TS and IT measurement, whereas the fTIR signal identified genuine plantar contacts and, together with WL anatomical information, allowed the appropriate posterior plantar reference for PL measurement to be selected (Figure 10D, E). Thus, the landmarks necessary for calculation of the classical SFI could be identified without requiring simultaneous contact of all digit pads with the glass.
Quantitative analysis confirmed the increased efficiency of the hybrid approach. Across recordings obtained at 16–24 weeks after neurorrhaphy, 3.8% (6/156) of injured-hindpaw stances were suitable for complete SFI estimation from the maximum contact area frame using conventional fTIR information alone, compared with 75.4% (52/69) of stances using hybrid fTIR+WL imaging (Figure 10F; Hodges–Lehmann shift 71.4 percentage points; Mann–Whitney test, P = 1.9 × 10⁻⁶; n = 14 rats, 18 videos, 156 stances for conventional fTIR vs. n = 4 rats, 11 videos, 69 stances for hybrid fTIR+WL). Hybrid imaging therefore raised the proportion of analyzable injured-hindpaw stances from 3.8% to 75.4% (an approximately 20-fold increase).
These results extend the observations obtained in healthy animals and demonstrate that the principal advantage of hybrid imaging is retained under pathological gait conditions. The approach preserves an objectively defined maximum contact area frame while allowing anatomical landmarks that do not contribute to the contact footprint to be identified from simultaneously acquired WL information. It therefore enables calculation of the classical SFI in a substantial proportion of injured-hindpaw stances that are unmeasurable using contact-only fTIR imaging.
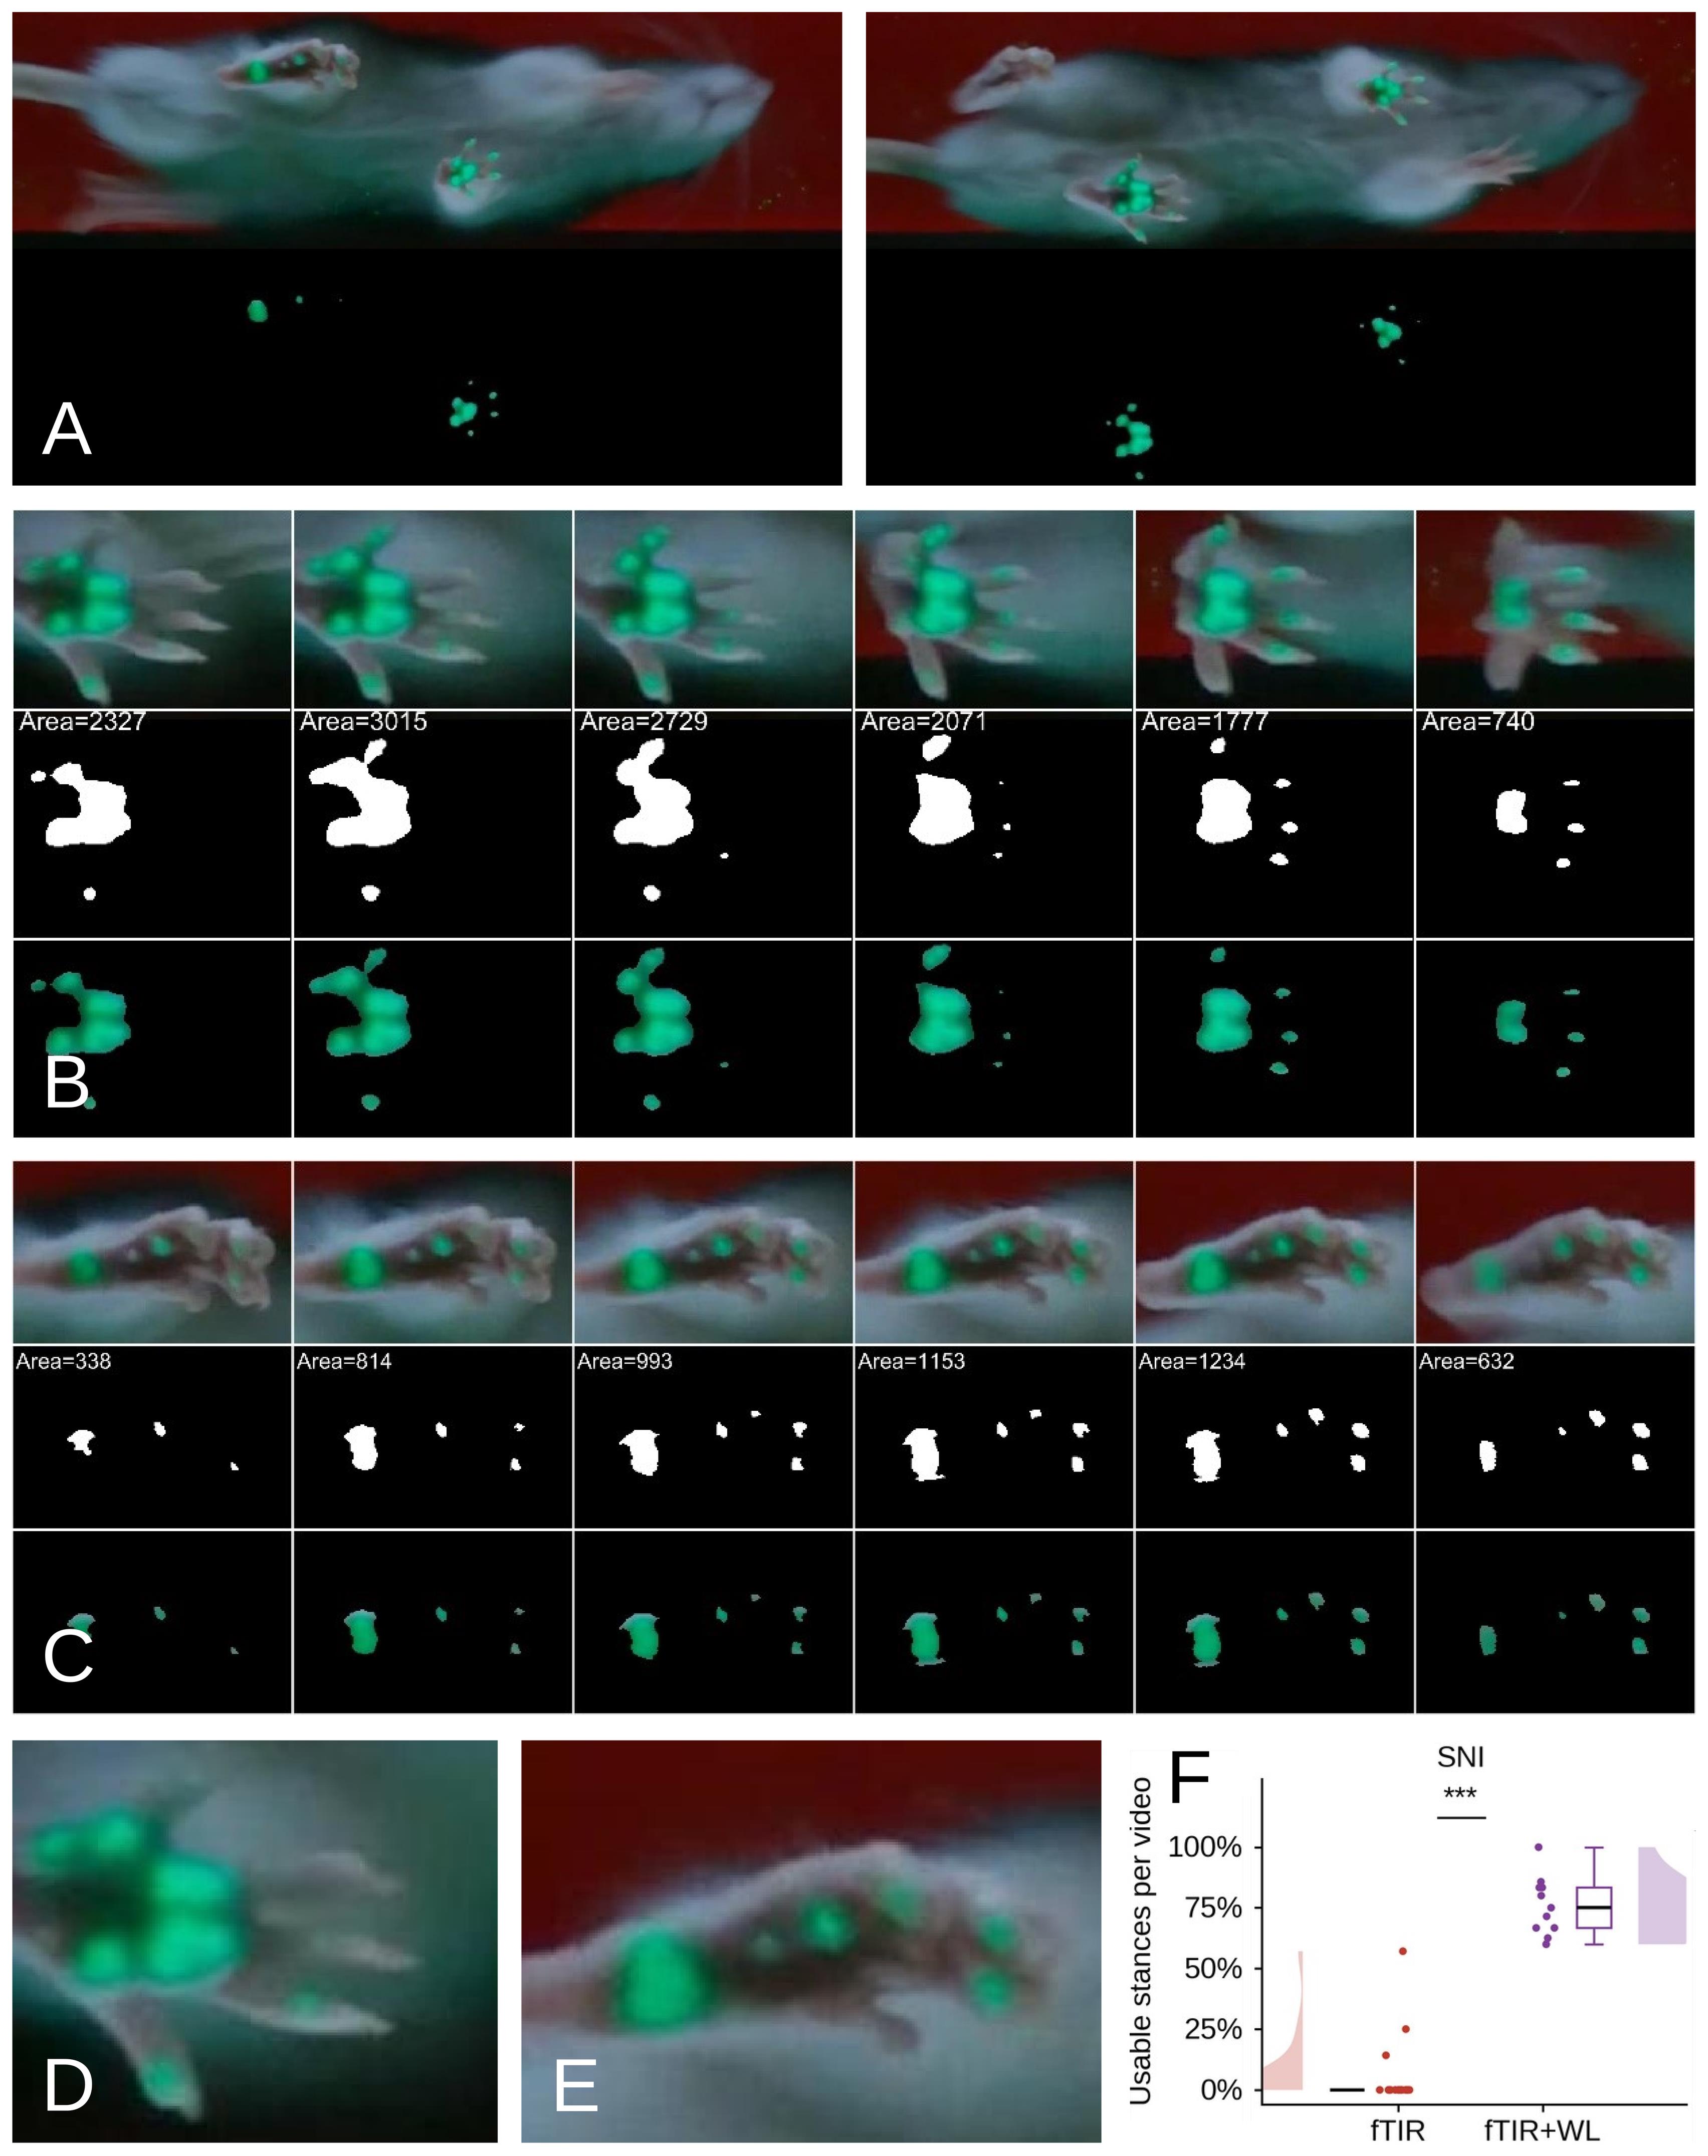
Figure 10. Hybrid fTIR+white-light (WL) imaging enables SFI estimation after sciatic nerve injury. (A) Representative views of a rat at 16 weeks after sciatic nerve injury and neurorrhaphy during locomotion using simultaneous fTIR and oblique WL illumination. The corresponding processed images show automatically detected paw-contact regions. (B) Six representative frames from an analyzed contralateral hindpaw stance. For each frame, the original hybrid fTIR+WL image is shown together with the segmented fTIR-derived contact area and the corresponding pixel-intensity map restricted to the segmented contact area. All frames spanning the stance were analyzed; six representative frames are displayed. The contact area, expressed as the number of detected pixels, was calculated for each frame and used to objectively identify the maximum contact area frame. (C) Six representative frames from an analyzed injured-hindpaw stance, displayed in the same format. Plantar contact is markedly altered after sciatic nerve injury, and several digit pads may be absent from the fTIR-derived contact footprint. Nevertheless, WL reveals their anatomical positions, while fTIR identifies genuine paw–glass contact. (D, E) Enlarged hybrid images of representative contralateral (D) and injured (E) hindpaws, illustrating the complementary contact and anatomical information available for identification of the landmarks required for PL, TS, and IT measurement. (F) Percentage of injured-hindpaw stances suitable for complete SFI estimation from the maximum contact area frame using conventional fTIR and hybrid fTIR+WL imaging. Data are presented as per-video percentages, with individual videos shown as points; Mann–Whitney U = 198, ***P < 0.001 (n = 14 rats, 18 videos, 156 stances for fTIR vs. n = 4 rats, 11 videos, 69 stances for fTIR+WL).
Comparison of Gait2SFI with the classical paper–ink method
To validate Gait2SFI against the classical walking-track approach, four rats were examined using both hybrid fTIR+WL imaging and the paper–ink method before sciatic nerve injury and at 4, 8, 12, and 16 weeks after neurorrhaphy, providing 20 paired rat–time-point observations. Multiple footprints were obtained within each recording session to assess within-session variability. Paper–ink footprints were obtained as previously described [14] and analyzed using both direct ruler measurements and Gait2SFI, allowing the same SFI calculation procedure to be applied to both types of recordings.
A representative paired measurement illustrates an important difference between the two approaches (Figure 11A). In the paper–ink footprint, smearing and distortion of the digit impressions introduced uncertainty in the positions of the anatomical landmarks used for SFI calculation, particularly those defining toe spread. In the corresponding hybrid recording, the digit pads were directly visible in the plantar image, allowing the landmarks to be positioned on the recorded plantar anatomy. In this example, the paper–ink footprint yielded an SFI of -57.5, whereas Gait2SFI yielded -99.7. Thus, distortion of the ink footprint resulted in a less negative SFI and an apparent underestimation of the functional deficit.
Both methods detected near-normal sciatic nerve function before injury and a marked functional deficit after neurorrhaphy (Figure 11B). Repeated-measures ANOVA demonstrated a significant overall effect of time (P = 0.002), with no significant method × time interaction (P = 0.24), indicating that the overall temporal profiles obtained with the two methods were not statistically different. However, analysis restricted to the post-injury period revealed a significant change over time with Gait2SFI (repeated-measures ANOVA, P = 0.009), with SFI values at weeks 8, 12, and 16 significantly higher than the week-4 value (Holm-corrected paired comparisons). No significant post-injury change over time was detected with the paper–ink method (repeated-measures ANOVA, P = 0.48), although the two methods did not differ significantly at any individual time point after correction for multiple comparisons. Thus, the present data support longitudinal detection of post-injury functional change with Gait2SFI, but do not demonstrate a statistically significant difference between the recovery trajectories obtained with the two methods.
An important limitation of the paper–ink method became evident in animals with severe functional impairment. In 8 of the 20 rat–time-point observations (40%), paper–ink footprints did not permit complete measurement of the parameters required for SFI calculation because of paw dragging, poorly defined digit impressions, or absence of measurable toe spread. In these cases, an SFI value of -100 was assigned rather than calculated from a complete set of footprint measurements. In contrast, hybrid fTIR+WL imaging provided measurable PL, TS, and IT parameters and, therefore, a calculated, graded SFI value in all 20/20 observations. Gait2SFI thus retained quantitative resolution under conditions of severe impairment in which the paper–ink method reached an assigned floor value.
Gait2SFI also showed substantially lower within-session variability than the paper–ink method (Figure 11C). The median within-session standard deviation of repeated SFI measurements was 5.2 SFI units with Gait2SFI compared with 12.5 units with paper–ink analysis (Wilcoxon signed-rank test, P < 0.001). The lower within-session variability indicates greater measurement precision and suggests that fewer repeated measurements may be required to obtain a stable session-level SFI estimate using the hybrid approach.
Within the range in which both methods yielded measurable SFI values, their measurements were strongly associated (Pearson r = 0.93). Together, these results demonstrate that Gait2SFI reproduces the expected functional consequences of sciatic nerve injury, provides graded SFI measurements when paper–ink footprints become unmeasurable, and substantially reduces within-session measurement variability.
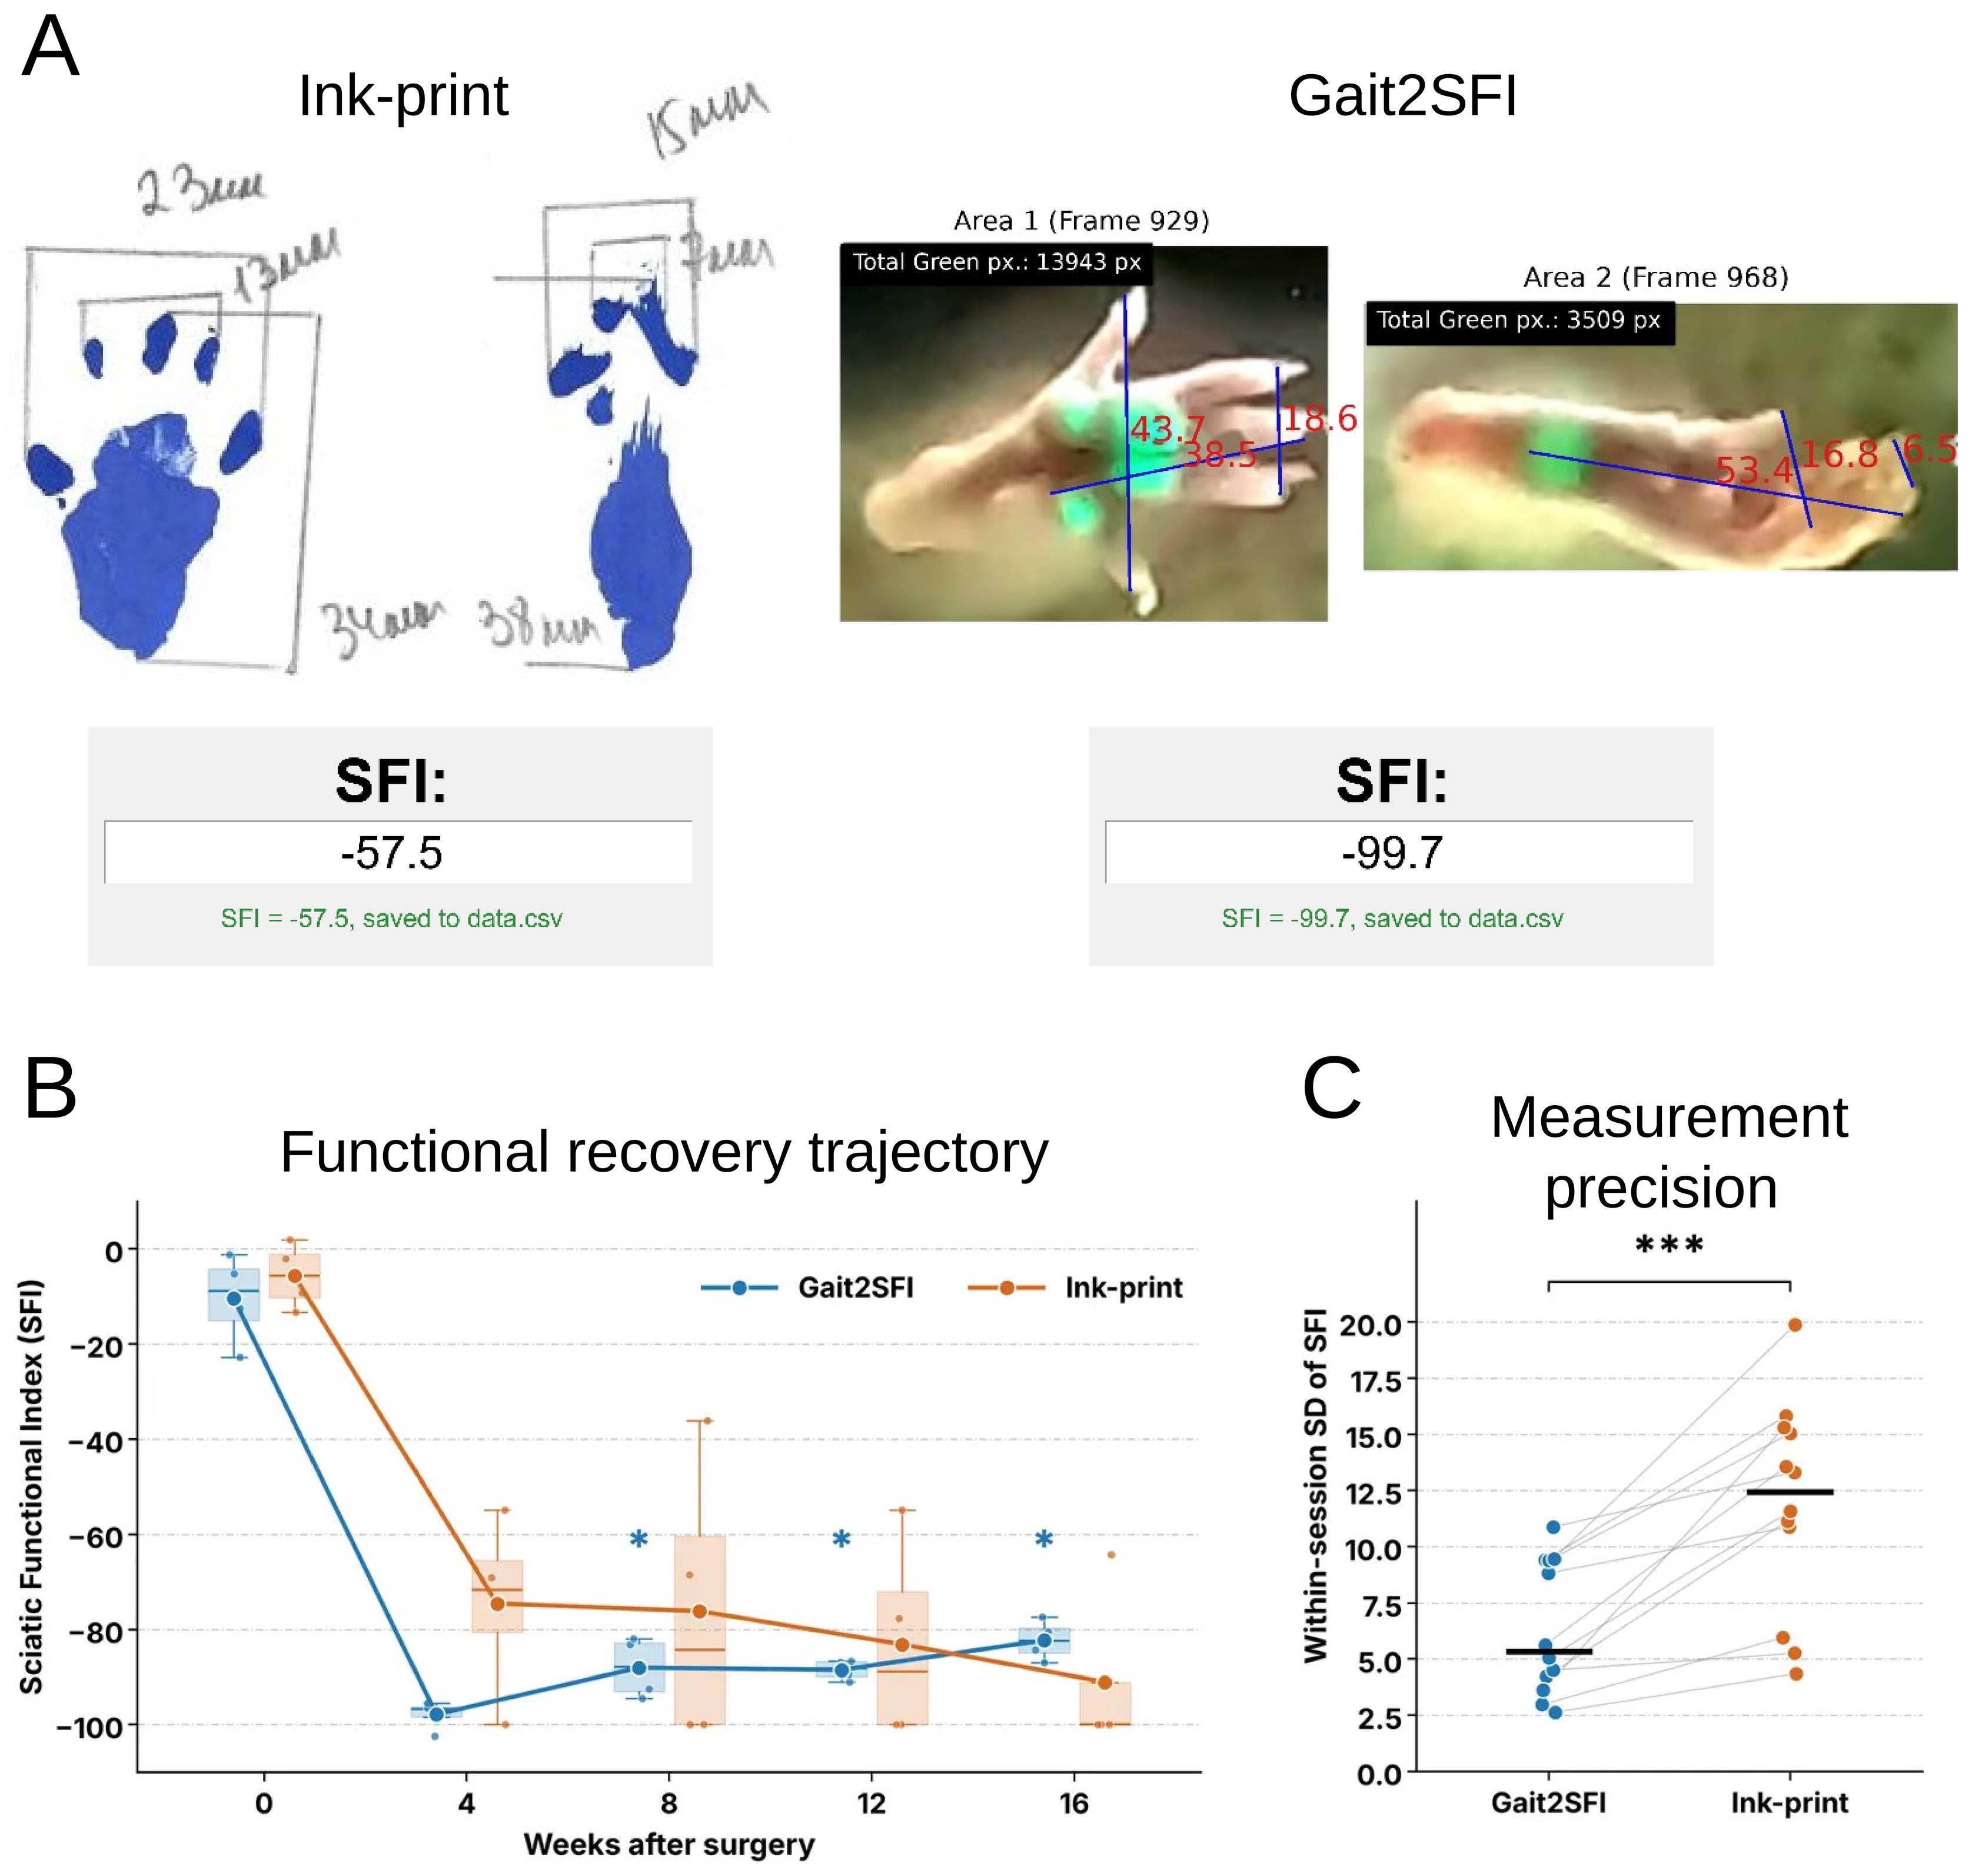
Figure 11. Comparison of Gait2SFI with the classical paper–ink method for assessment of sciatic nerve function. (A) Representative paired SFI measurement obtained from the same rat using the paper–ink method (left) and hybrid fTIR+WL imaging analyzed with Gait2SFI (right). Smearing and distortion of the ink footprint affect identification of the anatomical landmarks used for SFI calculation, particularly toe spread, yielding an SFI of -57.5. Direct visualization of plantar anatomy with Gait2SFI permits positioning of the corresponding PL, TS, and IT landmarks and yields an SFI of -99.7. (B) Longitudinal SFI measurements obtained with Gait2SFI and the paper–ink method before injury (week 0) and at 4, 8, 12, and 16 weeks after sciatic nerve injury and neurorrhaphy (n = 4 rats). Box plots show the distribution of repeated SFI measurements at each time point; symbols indicate the median values, boxes indicate the interquartile ranges, and whiskers indicate the respective ranges. Asterisks indicate significant differences from week 4 for Gait2SFI after correction for multiple comparisons (*P < 0.05). (C) Within-session variability of repeated SFI measurements obtained with Gait2SFI and the paper–ink method. Connected points represent paired rat–time-point observations; horizontal black bars indicate median values. Median within-session SD was 5.2 SFI units for Gait2SFI and 12.5 units for paper–ink measurements (Wilcoxon signed-rank test, ***P < 0.001; n = 20 paired rat–time-point observations).
Overall, the validation results demonstrate that hybrid fTIR+WL imaging overcomes a fundamental limitation of contact-only SFI assessment by combining genuine plantar contact information with the anatomical information required to identify the appropriate SFI landmarks. This substantially increases the proportion of gait cycles suitable for classical SFI estimation in both healthy and sciatic nerve–injured rats. Gait2SFI reproduces the expected functional consequences of sciatic nerve injury, provides graded SFI measurements when conventional paper–ink footprints become unmeasurable, and reduces within-session measurement variability.
This protocol or parts of it has been used and validated in the following research article:
• Bomikhov et al. [13]. Influence of general anesthesia and surgical procedure on functional recovery following rat sciatic nerve transection and repair. Ukr Neurosurg J. 32(2): 80–92. https://doi.org/10.25305/unj.354660
General notes and troubleshooting
General notes
1. Compatibility with the classical paper–ink method: Although Gait2SFI was developed for the hybrid gait-analysis system, it can also be used to estimate the classical Sciatic Functional Index (SFI) from conventional paper–ink walking-track recordings. High-resolution scans or digital images of paper–ink footprints can be imported directly into the software and analyzed using the same semi-automatic workflow. In the present study, Gait2SFI was used to analyze both hybrid and paper–ink recordings, enabling direct comparison between the two approaches.
2. Choice of footprint representation: The hybrid gait-analysis system supports estimation of the classical SFI from the maximum contact area frame, the total print area, or a composite footprint generated from the minimum number of consecutive frames required to visualize all anatomical landmarks necessary for SFI estimation. These representations characterize different biomechanical aspects of the stance phase and should not be considered interchangeable. The same footprint representation should be used consistently within a study.
3. Applicability of the protocol: The protocol was developed and validated in rats but can be adapted for use in mice by appropriate adjustment of the optical geometry, camera magnification, and image-processing parameters. The hybrid acquisition principle is also applicable to other gait-analysis studies requiring simultaneous visualization of plantar contact areas and anatomical landmarks, including models of peripheral nerve injury, spinal cord injury, stroke, musculoskeletal disorders, and rehabilitation.
4. Sources of variability: The hybrid acquisition strategy substantially reduces several important sources of variability affecting conventional SFI estimation by simultaneously visualizing plantar contact areas and the anatomical landmarks required for measurement of PL, TS, and ITS. This minimizes ambiguity associated with asynchronous digit-pad contact, incomplete toe contact, altered paw posture, heel walking, and foot dragging, thereby improving measurement reproducibility, particularly under pathological conditions.
5. Semi-automatic analysis: The current implementation of Gait2SFI performs semi-automatic rather than fully automatic estimation of the classical SFI. Plantar contact areas are detected automatically, whereas the operator confirms the anatomical landmarks required for PL, TS, and ITS measurements. Although this approach requires more processing time than fully automated systems such as CatWalk XT, it prioritizes accurate estimation of the classical SFI and may reduce the number of gait cycles that need to be recorded to obtain a sufficient number of analyzable measurements, particularly under pathological conditions. Because the hybrid acquisition strategy already provides both contact and anatomical information, future AI-based software development may enable automated landmark recognition while preserving the same hybrid acquisition hardware and analytical workflow.
6. Cost and comparison with commercial systems: The total cost of the described hybrid system is approximately $1,000 USD, including the GoPro HERO10 camera (~$350), supporting frame and walkway (~$250), LED illumination system (~$200), and other components (~$200). This is substantially lower than the estimated cost of commercial automated gait-analysis systems such as CatWalk XT and DigiGait (~$50,000–100,000, depending on configuration). The semi-automatic analysis workflow requires more operator time per video than fully automated commercial systems but provides direct access to the classical SFI parameters that are frequently unavailable from automated contact-only output.
7. Applicability to mice: The protocol was developed and validated in rats. Adaptation to mice should be feasible but may require: (i) a smaller walkway (approximately 50 × 7 cm vs. 100 × 10 cm for rats); (ii) closer camera positioning to provide sufficient magnification of the smaller plantar surface; (iii) optimization of oblique white-light illumination geometry and intensity to ensure adequate visualization of smaller plantar anatomical landmarks while preserving the fTIR contact signal; and (iv) a higher video acquisition frame rate to capture sufficient frames during the shorter mouse stance phase. These modifications represent proposed adaptations rather than experimentally validated requirements. The optical principle of hybrid acquisition and the Gait2SFI software workflow remain unchanged.
Troubleshooting
Problem 1: Hybrid images do not provide additional information compared with conventional fTIR images.
Possible cause(s): The oblique white-light illumination is improperly aligned or has insufficient intensity, preventing visualization of plantar anatomical landmarks.
Solution(s): Verify the position and intensity of the white-light illumination. Proper alignment should allow simultaneous visualization of plantar contact areas and anatomical landmarks in the same frame. If the plantar surface is as dark as the animal’s underside (Figure 4G), increase the intensity of the white-light illumination. Conversely, if the paw prints appear gray rather than green (Figure 4H), decrease the intensity of the white-light illumination. If the paw contours do not contrast sufficiently with the animal’s underside, narrow the gap between the side walls. If the image is generally dark and noisy, increase the camera exposure rather than the intensity of the white-light illumination.
Problem 2: Analysis is slower than expected.
Possible cause(s): The current implementation requires operator confirmation of anatomical landmarks before automatic SFI calculation.
Solution(s): This semi-automatic step is an intentional component of the protocol and prioritizes accurate estimation of the classical SFI over processing speed. Future software versions may automate landmark recognition while preserving the same hybrid acquisition workflow.
Problem 3: The software identifies the maximum contact area frame, but some anatomical landmarks necessary for SFI estimation are not clearly visible.
Possible cause(s): Oblique illumination may not illuminate all paws equally, resulting in differences in landmark visibility. Parts of the animal's body may also obstruct the path of the oblique illumination.
Solution(s): Adjust the image contrast and brightness to improve landmark visibility. Display-level contrast/brightness adjustment cannot recover anatomical information that was not captured during data acquisition. However, it can improve the visibility of the region of interest within a particular gait cycle, making anatomical structures sufficiently bright and their contours more distinct, depending on the individual experimenter's visual sensitivity. If the required landmarks remain insufficiently visible, select another gait cycle. Finally, if none of the gait cycles in the entire recording session provides sufficient information for SFI estimation, readjust the illumination (see Problem 1) and repeat the recording session with the same animal from the beginning.
Problem 4: Too few gait cycles are suitable for SFI estimation.
Possible cause(s): The animal stopped, turned, groomed, accelerated, or exhibited irregular locomotion during recording.
Solution(s): Record additional walking sequences and analyze only periods of continuous forward locomotion. The hybrid system substantially reduces the number of excluded gait cycles compared with conventional methods but cannot compensate for non-locomotor behavior.
Acknowledgments
This work was supported by the National Research Foundation of Ukraine (Project No. 2021.01/0328), by the long-term program of support of the Ukrainian research teams at the Polish Academy of Sciences carried out in collaboration with the U.S. National Academy of Sciences with the financial support of external partners (PAN.BFB.S.BWZ.405.022.2023), and by grants from the National Academy of Sciences of Ukraine (NASU; Project Nos. 0124U001556, 0124U001557, and 0125U002426).
Parts of this protocol were previously used and validated in the following research article [13].
The authors acknowledge the use of generative AI (ChatGPT\Claude) to improve the grammar, clarity, and readability of the manuscript and to identify redundancies. The scientific concepts, research objectives, data analysis, interpretation of the results, and all substantive intellectual content were developed by the investigators. All authors reviewed the AI-assisted edits and confirmed that the final text accurately reflects their work and conclusions.
Author contributions
O.B., investigation, conceptualization, software and hardware development, writing—original draft, writing—review & editing; Y.S., investigation, conceptualization, hardware development, writing—review & editing; I.C., conceptualization, software development; V.Y., T.P., Z.M., and V.M., animal surgery, investigation, data processing; N.V., funding acquisition, supervision, conceptualization; P.B., funding acquisition, supervision, conceptualization, writing—original draft, writing—review & editing.
Competing interests
The authors declare no conflicts of interest.
Ethical considerations
All procedures involving animals were carried out with the approval of the Animal Ethics Committee of the Bogomolets Institute of Physiology (Kyiv, Ukraine; Protocol No. 3/22, approved 16 November 2022) in accordance with the European Commission Directive (86/609/EEC), ethical guidelines of the International Association for the Study of Pain, and the Society for Neuroscience Policies on the Use of Animals and Humans in Neuroscience Research.
References
- de Medinaceli, L., Freed, W. J. and Wyatt, R. J. (1982). An index of the functional condition of rat sciatic nerve based on measurements made from walking tracks. Exp Neurol. 77(3): 634–643. https://doi.org/10.1016/0014-4886(82)90234-5
- de Medinaceli, L., DeRenzo, E. and Wyatt, R. J. (1984). Rat sciatic functional index data management system with digitized input. Comput Biomed Res. 17(2): 185–192. https://doi.org/10.1016/0010-4809(84)90031-4
- Bain, J. R., Mackinnon, S. E. and Hunter, D. A. (1989). Functional Evaluation of Complete Sciatic, Peroneal, and Posterior Tibial Nerve Lesions in the Rat. Plast Reconstr Surg. 83(1): 129–136. https://doi.org/10.1097/00006534-198901000-00024
- Varejão, A. S., Meek, M. F., Ferreira, A. J., Patrı́cio, J. A. and Cabrita, A. M. (2001). Functional evaluation of peripheral nerve regeneration in the rat: walking track analysis. J Neurosci Methods. 108(1): 1–9. https://doi.org/10.1016/s0165-0270(01)00378-8
- Navarro, X. (2015). Functional evaluation of peripheral nerve regeneration and target reinnervation in animal models: a critical overview. Eur J Neurosci. 43(3): 271–286. https://doi.org/10.1111/ejn.13033
- Garg, S., Jana, A., Gupta, S., Arshi, M. U., Khan, J., Gharai, P., Roy, R. and Ghosh, S. (2025). Engineered Neuro‐Regenerative Peptide Hydrogel for Directed Neural Lineage Reprograming and Regeneration of Sciatic Nerve Injury. Adv Healthcare Mater. 15(4): e202503429. https://doi.org/10.1002/adhm.202503429
- Qiao, D., Yang, N., Shi, L., Chen, L., Gu, J., Peng, X., Chen, C. and Sun, D. (2025). Interface modifiable bacterial cellulose hydrogel based nerve guidance conduit effectively rehabilitate sciatic nerve injured rat. Biomacromolecules. 26(11): 7434–7446. https://doi.org/10.1021/acs.biomac.5c00984
- Yang, X., Liang, X., Wang, B., Gao, X., Yang, W., Li, J., Cai, H., Tong, Z. and Chen, Y. (2025). Engineered nerve guide conduit enhances peripheral nerve regeneration by modulating the microenvironment through macrophage-triggered cascade reactions. Bioact Mater. 51: 46–69. https://doi.org/10.1016/j.bioactmat.2025.04.033
- Hamers, F. P., Lankhorst, A. J., van Laar, T. J., Veldhuis, W. B. and Gispen, W. H. (2001). Automated Quantitative Gait Analysis During Overground Locomotion in the Rat: Its Application to Spinal Cord Contusion and Transection Injuries. J Neurotrauma. 18(2): 187–201. https://doi.org/10.1089/08977150150502613
- Chen, H., Du, J., Zhang, Y., Barnes, K. and Jia, X. (2017). Establishing a reliable gait evaluation method for rodent studies. J Neurosci Methods. 283: 92–100. https://doi.org/10.1016/j.jneumeth.2017.03.017
- Xu, Y., Tian, N. X., Bai, Q. Y., Chen, Q., Sun, X. H. and Wang, Y. (2019). Gait Assessment of Pain and Analgesics: Comparison of the DigiGaitTM and CatWalkTM Gait Imaging Systems. Neurosci Bull. 35(3): 401–418. https://doi.org/10.1007/s12264-018-00331-y
- Schiaveto de Souza, A., da Silva, C. A. and Del Bel, E. A. (2004). Methodological Evaluation to Analyze Functional Recovery after Sciatic Nerve Injury. J Neurotrauma. 21(5): 627–635. https://doi.org/10.1089/089771504774129955
- Bomikhov, O. V., Yarynka, V. V., Petriv, T. I., Melikov, Z. K., Voitenko, N. V., Medvediev, V. V. and Belan, P. V. (2026). Influence of general anesthesia and surgical procedure on functional recovery following rat sciatic nerve transection and repair. Ukr Neurosurg J. 32(2): 80–92. https://doi.org/10.25305/unj.354660
- Goncharuk, O., Savosko, S., Petriv, T., Tatarchuk, M., Medvediev, V. and Tsymbaliuk, V. (2020). Epineurial sutures, polyethylene glycol hydrogel and fibrin glue in the sciatic nerve repair in rats: functional and morphological assessments in experiment. Georgian Med News. (309): 124–131. https://pubmed.ncbi.nlm.nih.gov/33526741/
Article Information
Publication history
Received: Aug 27, 2026
Accepted: Oct 25, 2026
Available online: Nov 12, 2026
Published: Nov 20, 2026
Copyright
© 2026 The Author(s); This is an open access article under the CC BY-NC license (https://creativecommons.org/licenses/by-nc/4.0/).
How to cite
Bomikhov, O., Sheremet, Y., Chizhmakov, I., Yarynka, V., Petriv, T., Melikov, Z., Medvediev, V., Voitenko, N. and Belan, P. (2026). A Hybrid Gait Analysis System for Robust and Efficient Estimation of the Sciatic Functional Index in Rats. Bio-protocol 16(22): e5889. DOI: 10.21769/BioProtoc.5889.

 Download Citation in RIS Format
Category
Neuroscience > Sensory and motor systems
Biological Sciences > Biological techniques
Do you have any questions about this protocol?
Post your question to gather feedback from the community. We will also invite the authors of this article to respond.
 Post a Question


