


- Protocols

- Articles and Issues
- For Authors
- About
- Become a Reviewer


A Simplified Method for Verifying Tocopherol Biosynthesis-Related Genes by Transient Expression in Nicotiana benthamiana

Published: Vol 16, Iss 23, Dec 5, 2026 DOI: 10.21769/BioProtoc.5887 Views: 38
Reviewed by: Shweta PanchalPooja VermaAnonymous reviewer(s)
 PDF
 Ask a question

Original research article
The authors used this protocol in:
Feb 2025

Protocol Collections
Comprehensive collections of detailed, peer-reviewed protocols focusing on specific topics



Abstract
Tocopherols are lipid-soluble antioxidants essential for both plants and animals that are present in all photosynthetic organisms. While most enzymes involved in the tocopherol biosynthesis pathway have been identified, those responsible for phytol production remain incompletely characterized, particularly across different plant species. To facilitate rapid screening of candidate genes involved in tocopherol synthesis, we present a protocol that combines Agrobacterium-mediated transient expression of exogenous proteins in Nicotiana benthamiana leaves with subsequent western blotting, subcellular colocalization analysis, and HPLC-based tocopherol quantification. This protocol allows researchers to assess whether a candidate protein is expressed, localizes to the chloroplast (the site of tocopherol biosynthesis), and alters tocopherol accumulation within 5–7 days. This method can also be applied for studying various other metabolites in transient assays, especially when stable transgenic lines are challenging to acquire.
Key features
• Combines transient expression, protein detection, subcellular localization, and functional assay in a single pipeline.
• Enables rapid screening of candidate enzymes for tocopherol biosynthesis within one week with no need for time-consuming generation of stable transgenic lines.
• Uses the well-established Nicotiana benthamiana agroinfiltration system for high-level transient protein expression.
• Allows parallel testing of multiple candidate genes or constructs.
Keywords: Tocopherol Vitamin E
Transient expression
Nicotiana benthamiana
Agroinfiltration
Western blotting
Confocal imaging
HPLC
Graphical overview
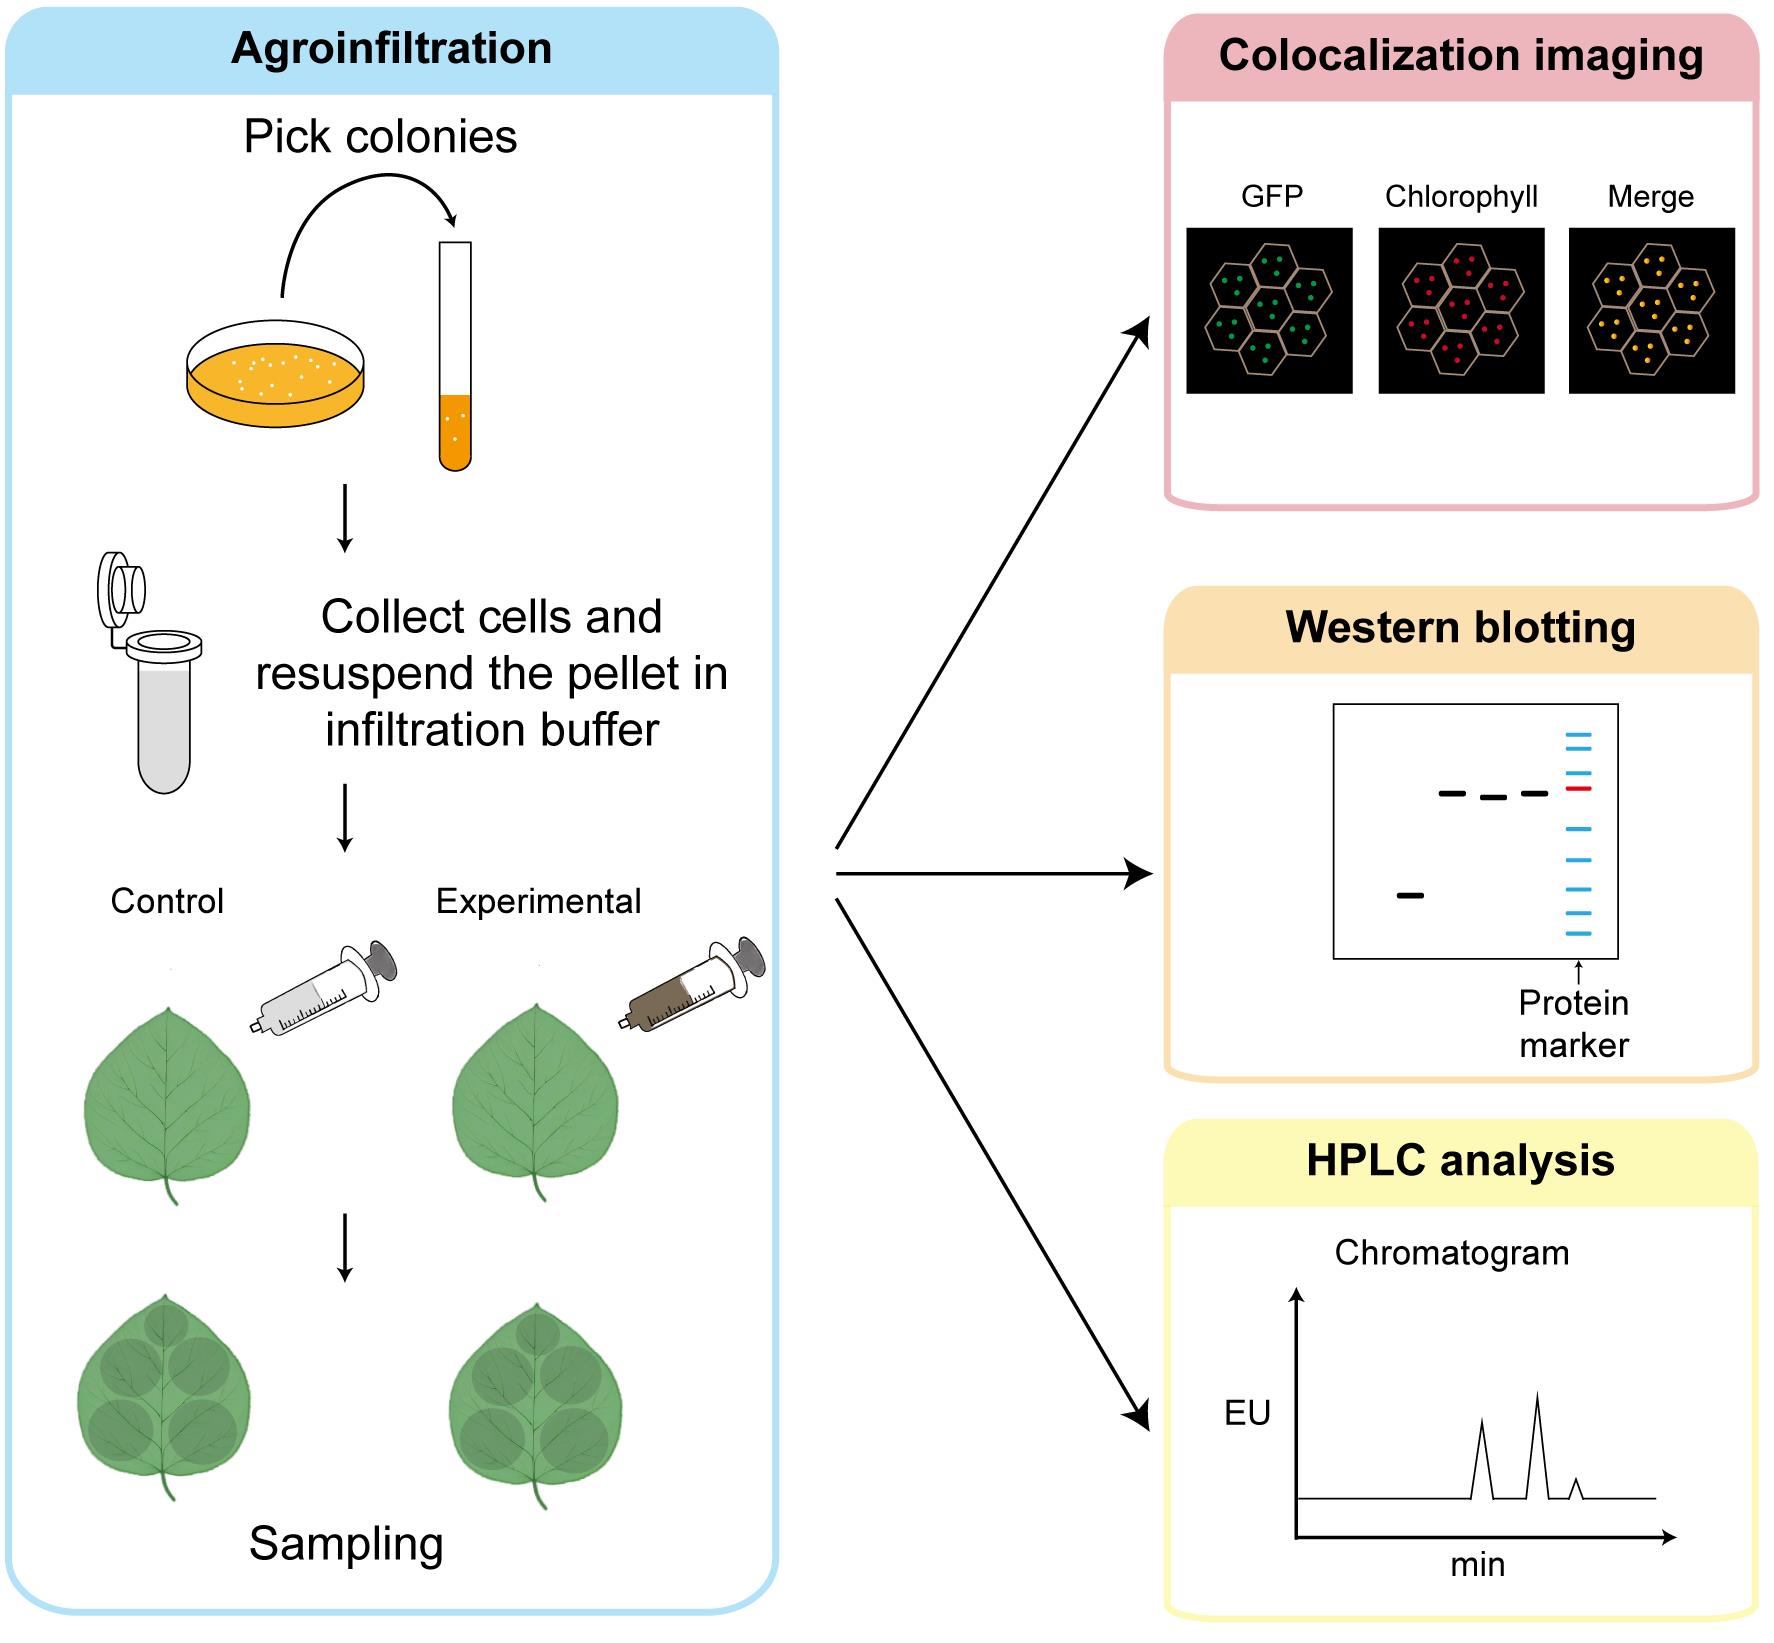
Simplified workflow for transient assay in tobacco. Agroinfiltration, sample collection, colocalization imaging, western blotting, and HPLC analysis.
Background
Tocopherols (vitamin E) are essential lipid-soluble antioxidants that protect photosynthetic organisms from oxidative stress [1,2]. The tocopherol biosynthesis pathway in plants has been largely elucidated, with most enzymatic steps identified [3–5]. However, the complete set of enzymes responsible for generating phytol—a key substrate for tocopherol synthesis—has not been fully characterized [6–8]. Whether different species employ distinct enzymes for phytol production remains an open question [9–11].
Traditional approaches for identifying enzymes involved in tocopherol biosynthesis rely on stable genetic transformation, which is time-consuming and labor-intensive [6,12–15]. Transient expression via Agrobacterium-mediated infiltration of Nicotiana benthamiana leaves offers a rapid alternative. This system has been widely used for protein subcellular localization, protein–protein interaction studies, and recombinant protein production. By combining transient expression with western blotting, fluorescent microscopy, and HPLC-based tocopherol quantification, researchers can quickly evaluate whether a candidate protein is expressed, correctly localizes to the plastid, and functionally impacts tocopherol accumulation.
This protocol provides a streamlined workflow for the rapid functional screening of candidate proteins potentially involved in tocopherol biosynthesis, addressing the need for efficient tools to mine novel enzymes in this important metabolic pathway. However, it has several limitations. Heterologous overexpression in Nicotiana benthamiana may not fully reproduce endogenous expression levels, tissue-specific regulation, or species-specific protein interactions in the species of origin. In addition, fluorescent tags and transient overexpression may affect protein localization or stability, while Agrobacterium-mediated infiltration itself may influence plant physiology and metabolite accumulation. Therefore, this protocol is intended primarily as a rapid screening approach, and promising candidate genes should be further validated using stable genetic materials and/or biochemical assays in the corresponding plant species.
Materials and reagents
Biological materials
1. Tobacco (Nicotiana benthamiana) plants (4–6 weeks old, grown in soil under a 16/8 h light/dark cycle at 22–24 °C, light density at 90 μmol m-2·s-1)
2. Agrobacterium tumefaciens strain GV3101 carrying a construct expressing the gene of interest fused to YFP (which is detectable with confocal imaging or western blotting); the vector used in this protocol is pCAMBIA1300 carrying kanamycin resistance in bacteria
Reagents
1. Tryptone (Sangon Biotech, catalog number: A505250-0500)
2. Yeast extract (Sangon Biotech, catalog number: A515245-0500)
3. Sodium chloride (NaCl) (Sangon Biotech, catalog number: A501218-0005)
4. MES [2-(N-morpholino) ethanesulfonic acid] (Sangon Biotech, catalog number: A420766-0500)
5. MgCl2·6H2O (Sigma-Aldrich, catalog number: M9272)
6. AS (acetosyringone) (Coolaber Science & Technology, catalog number: CA1061-10g)
7. SDS (sodium dodecyl sulfate) (Sigma-Aldrich, catalog number: L5750-500G)
8. Tris (Sangon Biotech, catalog number: A501492-0005)
9. HCl (Sinopharm Chemical Reagent, catalog number: 10011018)
10. 30% acrylamide (Sangon Biotech, catalog number: B546018-0500)
11. Ammonium persulfate (APS) (Sangon Biotech, catalog number: A600072-0025)
12. Tetramethylethylenediamine (TEMED) (Beyotime, catalog number: ST728)
13. Glycine (Sangon Biotech, catalog number: A502065-0005)
14. Kanamycin sulfate (Sangon Biotech, catalog number: A600286-0025)
15. Gentamycin sulfate (Sangon Biotech, catalog number: A620217-0005)
16. Rifampicin (Sangon Biotech, catalog number: A600812-0025)
17. Tween-20 (Sangon Biotech, catalog number: A600560-0500)
18. KCl (Bidepharm, catalog number: BD148754-500g)
19. Na2HPO4 (Jiuding Chemical Reagent, catalog number: SR443-500g)
20. KH2PO4 (Sangon Biotech, catalog number: A501728-0500)
21. Glycerol (Sangon Biotech, catalog number: A100854-0500)
22. Coomassie Brilliant Blue R-250 (Sangon Biotech, catalog number: A610037-0025)
23. Glacial acetic acid (Sinopharm Chemical Reagent, catalog number: 10000218)
24. Methanol (Titan Scientific, catalog number: G75851C)
25. 5× protein loading buffer (with β-mercaptoethanol) (Coolaber Science & Technology, catalog number: SL1180-10ml)
26. Non-fat milk (Wondersun)
27. Liquid nitrogen
28. Rabbit anti GFP-Tag pAb (ABclonal, catalog number: AE011)
29. HRP-conjugated goat anti-rabbit IgG (H+L) (ABclonal, catalog number: AS014)
30. ECL western blotting detection substrate (Share-bio, catalog number: SB-WB011)
31. HPLC-grade methanol (Sangon Biotech, catalog number: A601618-0004)
32. HPLC-grade chloroform (Adamas-beta, catalog number: 75915R)
33. HPLC-grade H2O (Amethyst Chemicals, catalog number: 187553)
34. HPLC-grade tert-Butyl methyl ether (MTBE) (Innochem, catalog number: M9010)
35. α-tocopherol standard (Solarbio, catalog number: ST9440-20mg)
36. γ-tocopherol standard (TargetMol, catalog number: T8293-5mg)
37. DL-α-tocopherol acetate (internal standard) (TargetMol, catalog number: TMSM-1050_1-25mg)
38. Butylated hydroxytoluene (BHT) (Sinopharm Chemical Reagent, catalog number: 31000628)
Solutions
1. LB medium (see Recipes)
2. Infiltration buffer (see Recipes)
3. 10× PBS buffer (see Recipes)
4. 1× PBST buffer (see Recipes)
5. Lysis buffer (see Recipes)
6. 10× running buffer (see Recipes)
7. 10× transfer buffer (see Recipes)
8. Protein gel (2 gels) (see Recipes)
9. Coomassie Brilliant Blue R250 protein stain reagent (see Recipes)
10. Coomassie Brilliant Blue R250 protein destain reagent (see Recipes)
11. Tocopherol extraction buffer (see Recipes)
Recipes
1. LB medium
| Reagent | Final concentration | Quantity or volume |
|---|---|---|
| Tryptone | 10 g/L | 10 g |
| Yeast extract | 5 g/L | 5 g |
| NaCl | 5 g/L | 5 g |
| Total | n/a | 1,000 mL |
Adjust the pH to 7.0 with 1 M NaOH and autoclave at 121 °C for 20 min.
2. Infiltration buffer
| Reagent | Final concentration | Quantity or volume |
|---|---|---|
| 1 M MgCl2 | 10 mM | 200 μL |
| 0.5 M MES pH 5.7 | 10 mM | 400 μL |
| 100 mM acetosyringone | 150 μM | 30 μL |
| Total | n/a | 20 mL |
Prepare fresh.
3. 10× PBS buffer
| Reagent | Final concentration | Quantity or volume |
|---|---|---|
| NaCl | 80 g/L | 80 g |
| KCl | 2 g/L | 2 g |
| Na2HPO4 | 14 g/L | 14 g |
| KH2PO4 | 2.4 g/L | 2.4 g |
| Total | n/a | 1,000 mL |
Adjust the pH to 7.4 with 1 M NaOH or KOH.
4. 1× PBST buffer
| Reagent | Final concentration | Quantity or volume |
|---|---|---|
| 10× PBS buffer | n/a | 100 mL |
| Tween-20 | n/a | 1 mL |
| Total | n/a | 1,000 mL |
5. Lysis buffer
| Reagent | Final concentration | Quantity or volume |
|---|---|---|
| 1 M Tris-HCl pH 7.5 | 50 mM | 50 mL |
| NaCl | 11.7 g/L | 11.7 g |
| Glycerol | 10% (v/v) | 100 mL |
| Total | n/a | 1,000 mL |
6. 10× running buffer
| Reagent | Final concentration | Quantity or volume |
|---|---|---|
| Tris | 30.3 g/L | 30.3 g |
| Glycine | 144.4 g/L | 144.4 g |
| SDS | 10 g/L | 10 g |
| Total | n/a | 1,000 mL |
7. 10× transfer buffer
| Reagent | Final concentration | Quantity or volume |
|---|---|---|
| Tris | 30.25 g/L | 30.25 g |
| Glycine | 144.1 g/L | 144.1 g |
| SDS | 2.5 g/L | 2.5 g |
| Total | n/a | 1,000 mL |
8. Protein gel (2 gels)
| Resolving gel 10 mL | 10% | Stacking gel 5 mL | 5% |
|---|---|---|---|
| 1.5 M Tris-HCl (pH 8.8) | 2.5 mL | 1.5 M Tris-HCl (pH 6.8) | 1.25 mL |
| 30% acrylamide | 3.3 mL | 30% acrylamide | 0.85 mL |
| ddH2O | 4.1 mL | ddH2O | 2.85 mL |
| 10% SDS | 100 μL | 10% SDS | 50 μL |
| 10% APS | 75 μL | 10% APS | 37.5 μL |
| TEMED | 12 μL | TEMED | 6 μL |
After adding and mixing the first four components, add 10% APS and TEMED, mix briefly, and immediately pour the gel into the gel cassette before polymerization begins.
9. Coomassie Brilliant Blue R250 protein stain reagent
| Reagent | Final concentration | Quantity or volume |
|---|---|---|
| Coomassie brilliant blue R250 | 1 g/L | 1 g |
| Methanol | n/a | 300 mL |
| Glacial acetic acid | n/a | 100 mL |
| Total | n/a | 1,000 mL |
10. Coomassie Brilliant Blue R250 protein destain reagent
| Reagent | Final concentration | Quantity or volume |
|---|---|---|
| Methanol | n/a | 300 mL |
| Glacial acetic acid | n/a | 100 mL |
| Total | n/a | 1,000 mL |
11. Tocopherol extraction buffer
| Reagent | Final concentration | Quantity or volume |
|---|---|---|
| HPLC-grade methanol | n/a | 30 mL |
| HPLC-grade chloroform | n/a | 15 mL |
| BHT | 1% (w/v) | 450 mg |
| 5 mg/mL tocopherol acetate | 100 μg/mL | 900 μL |
Prepare fresh.
Laboratory supplies
1. Needleless 1 mL syringe
2. 0.22 μm organic syringe filter (BKMAM)
3. Polyvinylidene difluoride transfer membranes, 0.22 μm (PVDF membranes) (Merck Millipore, catalog number: IPVH00010)
4. 1.5/2 mL centrifuge tubes (LENGRUI)
5. 10 mL bacterial culture tubes (SUPIN)
6. Coverslips (CITOTEST)
7. Microscope slides (CITOTEST)
8. Glass beads
Equipment
1. Spectrophotometer for OD600 measurement (Eppendorf BioPhotometer Plus)
2. Centrifuge (Sangon Biotech, model: HICO 21)
3. 4 °C centrifuge (DLAB, model: D1524R)
4. Gel electrophoresis chamber (Share-bio)
5. Tissue homogenizer (SCIENTZ-48)
6. Transference decoloring shaker (Kylin-Bell, model: TS-8S)
7. SDS-PAGE electrophoresis apparatus (Share-bio)
8. Western blotting electrotransfer apparatus (Share-bio)
9. Chemiluminescence imaging system (Tanon, model: 4160)
10. Confocal laser scanning microscope (Olympus, model: FV3000)
11. HPLC system (Waters, model: e2695)
12. Fluorescence detector for HPLC detection (Waters, model: e2475)
13. HPLC column (Waters YMC Carotenoid S-3 3.0 × 100 mm Column, catalog number: HCAC358555YMC)
14. HPLC vial (JIEDAO)
15. Rotary evaporator (Scientific Products, model: Genevac EZ-2 4.0)
16. Ultrasonic cleaner (Kunshanshumei, model: KQ-500DM)
Procedure
A. Agroinfiltration of tobacco leaves
Note: For each experiment, include an empty vector (EV) as the control. Water the plants thoroughly after infiltration.
1. Verify the candidate gene sequence by Sanger sequencing and then transfer the construct into Agrobacterium strain GV3101. Pick the colonies and culture in 5 mL of LB medium (see Recipes) containing appropriate antibiotics.
2. Incubate overnight at 28 °C with shaking (200–220 rpm) until the culture reaches an OD600 of 0.6–0.8.
3. Harvest 2 mL of bacterial cells in tubes by centrifugation at 13,680× g for 30 s.
4. Discard the supernatant and resuspend the pellet in 1 mL of infiltration buffer (see Recipes); then, add another 1 mL of infiltration buffer and mix well.
5. Using a needleless 1 mL syringe, gently press the syringe tip against the abaxial surface of the selected tobacco leaf (4–6-week-old, healthy, fully expanded). Slowly infiltrate the bacterial suspension into the leaf tissue by applying gentle pressure on the upper surface of the leaf. For leaves that are difficult to infiltrate, a gentle prick on the lower epidermis with a sterile syringe needle can facilitate the entry of the bacterial suspension; inject directly at the pricked location.
6. Successful infiltration results in a visible water-soaked area spreading across the leaf. Repeat infiltration at multiple spots on the same leaf or on different leaves for each construct.
7. Mark the infiltrated areas with a permanent marker or label the leaves. After infiltration, cover the plants with a black plastic bag and keep them in the dark for 24 h, as established in our experimental procedure, and then return the plants to the growth chamber (16/8 h light/dark, 22–24 °C). Please note that keeping the plants in the dark for 24 h is optional.
B. Subcellular colocalization analysis
Note: Plastids are the site of tocopherol biosynthesis; thus, colocalization of the candidate protein with chloroplasts supports its potential role in this pathway [6,12,14].
1. Prepare fresh leaf pieces from infiltrated areas at 2 days post-infiltration (dpi), avoiding visibly wilted, damaged, or necrotic regions, as these areas may show compromised cell integrity and abnormal fluorescence signals.
2. Mount the leaf piece on a microscope slide with the abaxial side facing up, add a drop of water, and cover with a coverslip.
3. Observe under a confocal laser scanning microscope. Fluorescence signals were detected with the following settings: excitation at 488 nm and emission at 500–550 nm for YFP; excitation at 488 nm and emission at 620–720 nm for chlorophyll autofluorescence.
4. Capture images and merge channels to assess colocalization of the candidate protein with chloroplasts.
C. Protein extraction and western blotting
Note: Protein quantification is not required for this qualitative screening protocol. In the representative experiment, 15 μL of 35S-CLD3-YFP, 35S-VTE7-YFP, and negative-control samples and 3 μL of 35S-YFP were loaded. Because 35S-YFP is expressed at a much higher level than the YFP fusion proteins, a smaller volume was loaded to avoid signal saturation. Total protein staining was used to assess loading consistency. For quantitative comparisons, see General note 1.
1. Add two 3.5 mm glass beads into each 2 mL tube. Harvest 5–10 mg of infiltrated leaf tissue at 2 dpi into 2 mL tubes. If not used immediately, quick-freeze in liquid nitrogen and store at -80 °C until extraction.
2. Homogenize the samples using a tissue homogenizer (45 Hz, 40 s) (Figure 1). Chill the shaker adaptor in liquid nitrogen to avoid protein degradation. Repeat this step twice.
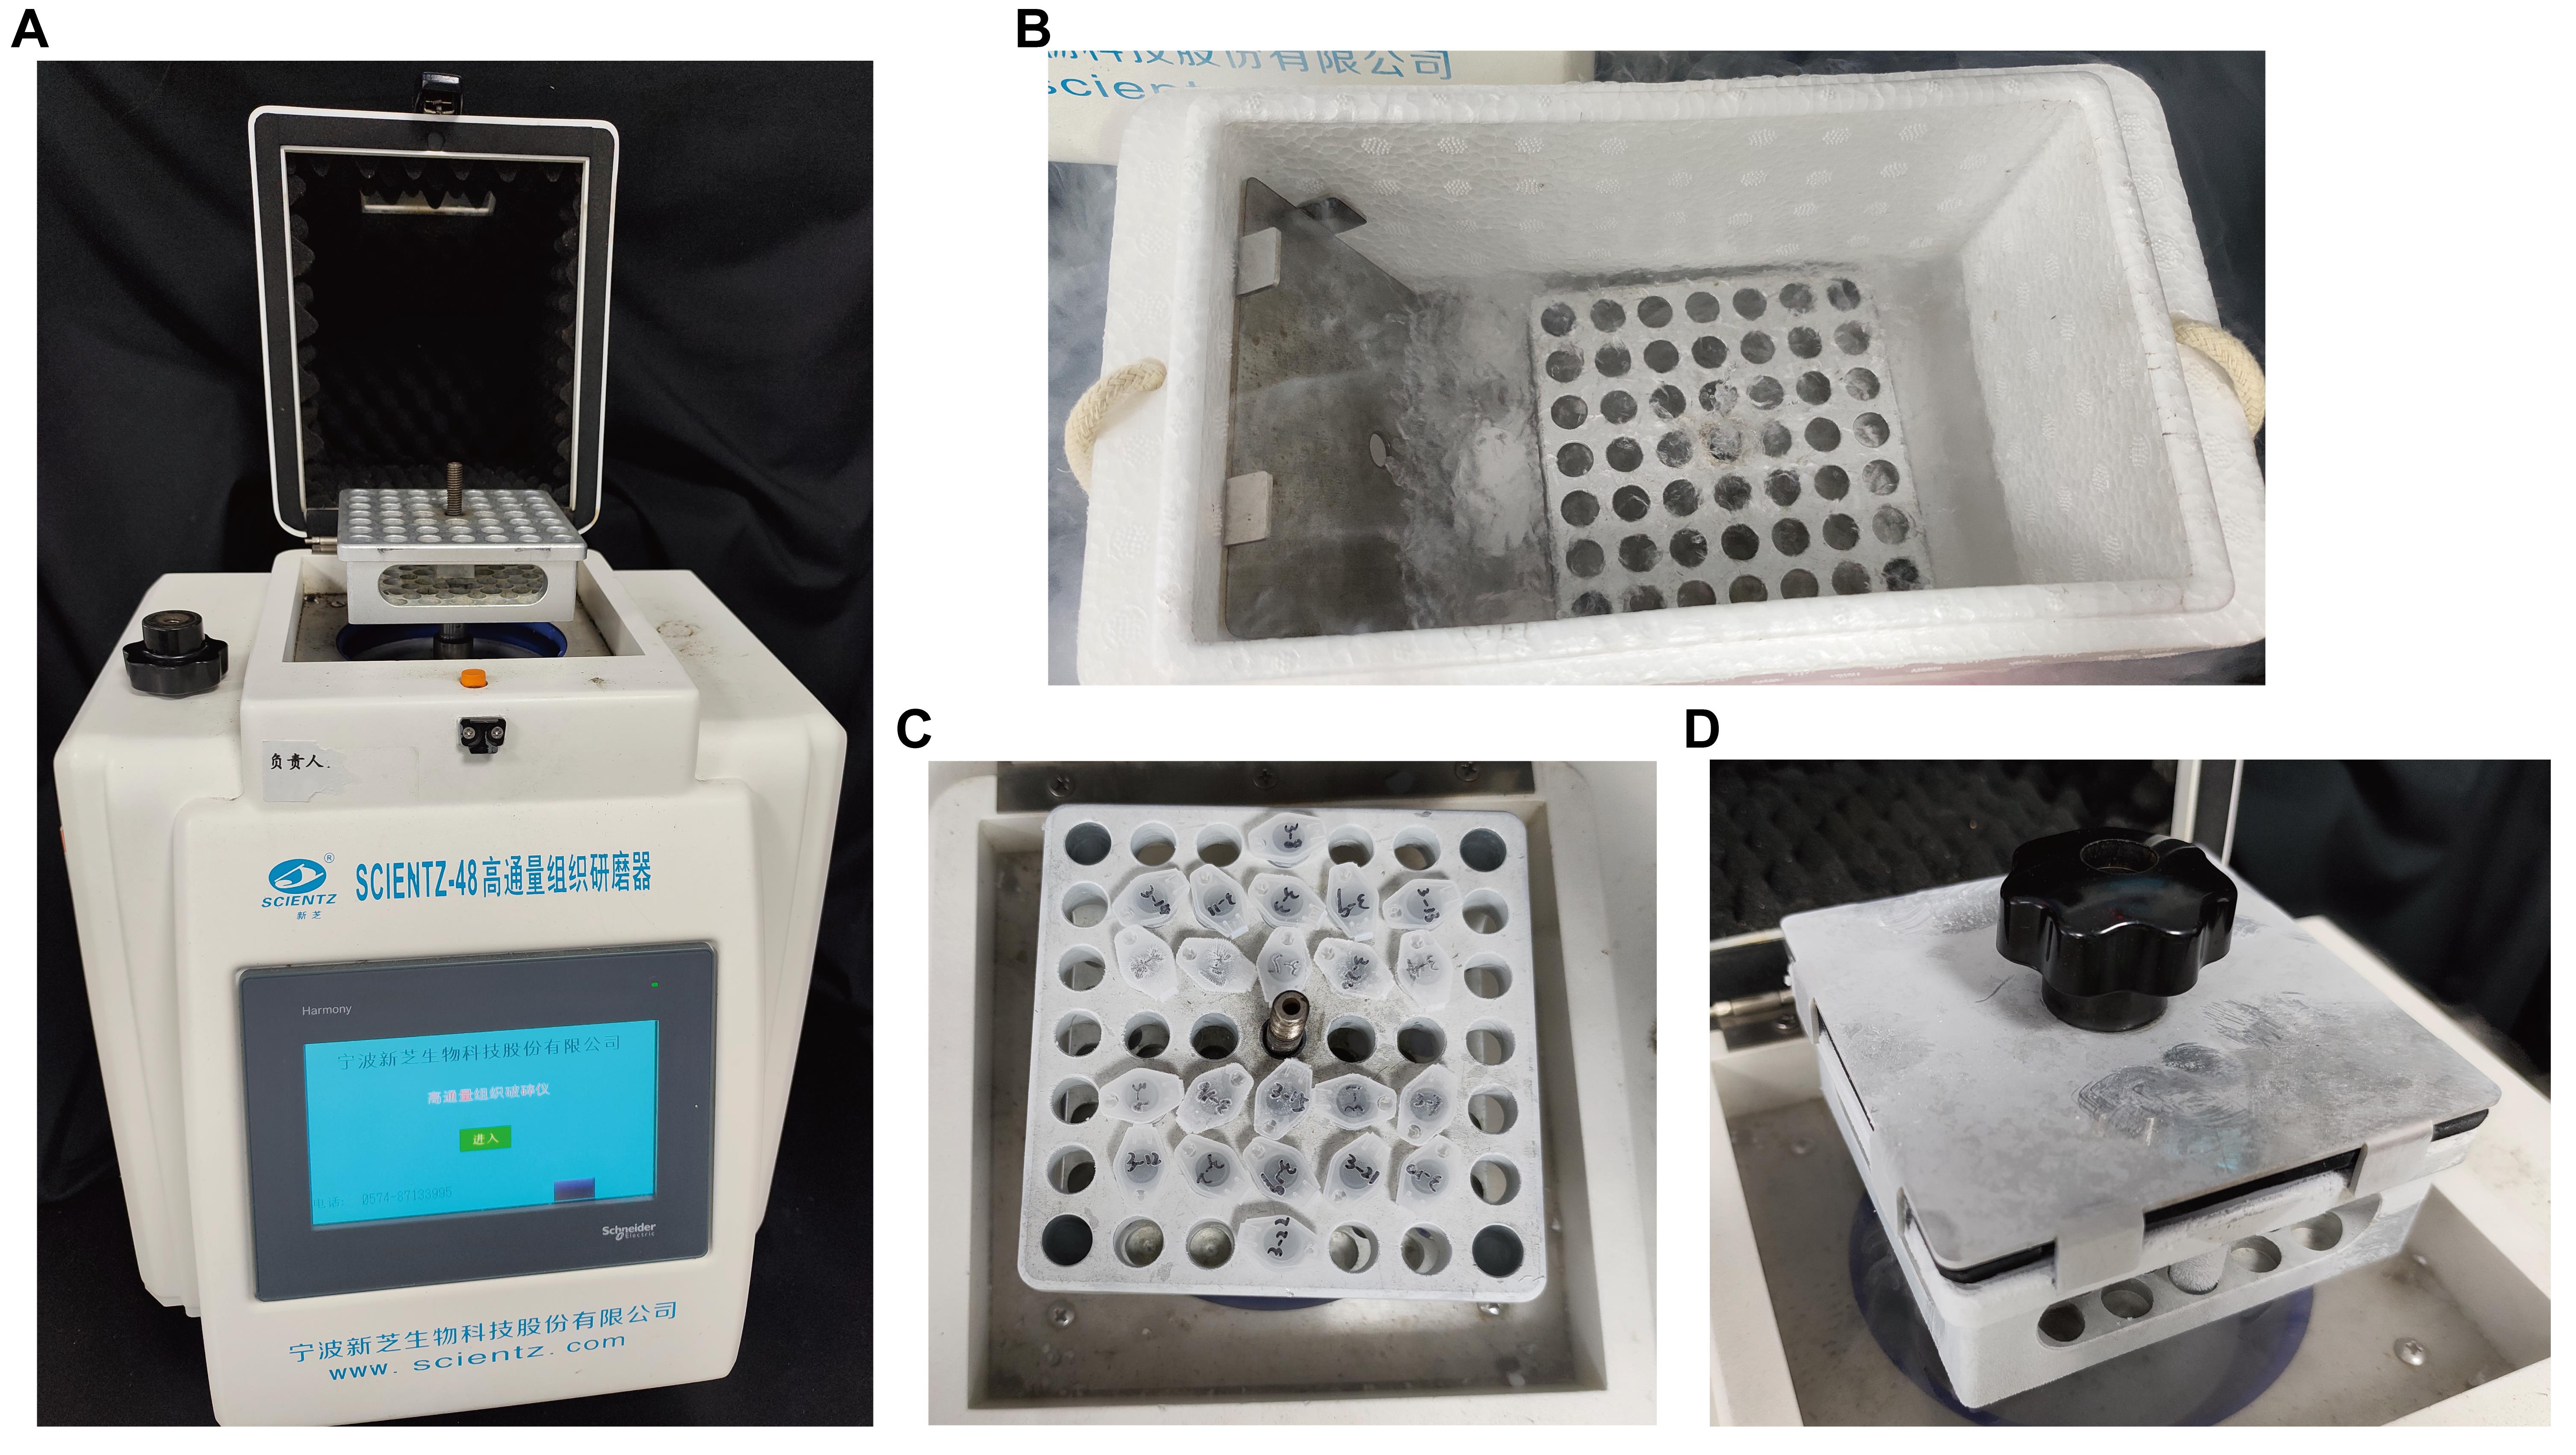
Figure 1. Setup of the tissue homogenizer. (A) Overview of the tissue homogenizer and setup of the shaker adaptor. (B) Chill the shaker adaptor and lid in liquid nitrogen. (C) Place the sample tubes in the adaptor in a balanced arrangement. (D) Cover the adaptor with a foam pad and secure it by closing the lid and tightening the black locking knob. If a tissue homogenizer is not available, the leaf tissue can be ground manually in liquid nitrogen using a pre-chilled mortar and pestle, and the resulting powder can then be transferred to a tube for protein extraction or tocopherol extraction.
3. Dilute 5× protein loading buffer with lysis buffer (see Recipes) to 1× protein loading buffer. Add an equal volume of 1× protein loading buffer to the leaf tissue powder (e.g., 200 μL of buffer added to 200 μL of leaf tissue powder). Vortex until the sample is homogenized, then denature at 95 °C for 5 min.
4. Load and separate proteins by SDS-PAGE on a protein gel (see Recipes) using 1× running buffer [diluted from 10× running buffer (see Recipes)] (100 V for 30 min and then 120 V for 60 min).
5. Transfer proteins to a PVDF membrane using 1× transfer buffer [diluted from 10× transfer buffer (see Recipes)] by wet transfer method (constant 90 V for 80 min).
6. Block the membrane with 10% non-fat milk dissolved in PBST for 1 h at room temperature with agitation (10–20 rpm).
7. Incubate with primary antibody (anti-GFP, 1:5,000, 5% milk) overnight at 4 °C with gentle agitation (generally less than 5 rpm).
8. Wash the membrane five times with PBST for 5 min each with agitation (40 rpm). Collect the primary antibody for reuse.
9. Incubate with HRP-conjugated secondary antibody (anti-rabbit, 1: 10,000, 5% milk) for 1 h (no more than 1.5 h) at room temperature with agitation (40 rpm).
10. Wash the membrane five times with PBST for 5 min each with agitation (40 rpm).
11. Detect signals using ECL substrate and the chemiluminescence imaging system (Tanon 4160).
12. Use Coomassie Brilliant Blue R250 protein stain reagent (see Recipes) to stain the membrane for 5–10 min with gentle agitation. Then, wash the membrane with water and use Coomassie Brilliant Blue R-250 protein destain reagent (see Recipes) to destain the membrane for approximately 20–30 min with agitation (40 rpm).
13. Acquire images of the stained membrane. This step is used to confirm equal protein loading.
D. Tocopherol extraction and quantification by HPLC
Note: Perform all steps under dim light (avoid direct light) to prevent tocopherol degradation. When performing the extraction process for the first time, add 3–4 blank samples (containing only extraction buffer) and extract in the same fashion. Include tocopherol acetate as an internal standard at a final concentration of 100 μg/mL in both the extraction buffer and the tocopherol standard solutions.
1. Add three 3.5 mm glass beads to each tube. Harvest 150–200 mg of infiltrated leaf tissue at 2 dpi and transfer it to 2 mL tubes. If not to be used for extraction immediately, quick-freeze in liquid nitrogen and store at -80 °C until extraction.
2. Homogenize the samples using a tissue homogenizer (45 Hz, 60 s). Chill the shaker adaptor in liquid nitrogen before use. Perform this step twice in total.
3. Add 1 mL of extraction buffer (see Recipes) and homogenize the samples (40 Hz, 300 s). Briefly centrifuge the tubes (quick spin) to bring down any solvent splashed onto the lids.
4. Add 300 μL of HPLC-grade water and 300 μL of HPLC-grade chloroform to each tube.
5. Put in a tissue homogenizer (40 Hz, 100 s) for homogenization. Centrifuge at 3,420× g for 5 min at 4 °C.
6. Carefully transfer 400 μL of the lower organic (chloroform) phase to a new tube.
7. Add 200 μL of HPLC-grade chloroform to each tube and repeat step D5. Carefully transfer 200 μL of the lower organic (chloroform) phase to the previous tube.
8. Evaporate the combined organic phase using a rotary evaporator. Also, evaporate five 1,000 μL aliquots of extraction buffer containing the internal standard in tubes using the same procedure to calculate the 100% recovery rate.
9. Resuspend the dried residue in 1,000 μL of HPLC-grade methanol and use an ultrasonic cleaner to dissolve the residue.
10. Filter the methanol solution through a 0.22 μm syringe filter into a new tube and store at -20 °C until HPLC detection.
11. Transfer 200 μL of the sample to an HPLC vial for injection onto the column.
12. Run HPLC with the following conditions (from [16] with modifications):
a. Column: Waters YMC Carotenoid S-3 (3.0 × 100 mm, 3 μm), column temperature 30 °C.
b. Mobile phase A: 100% MTBE; B: methanol:water (90:10, v/v). Degas by ultrasonication before use.
c. 27-min run, 0.4 mL/min gradient (time, B%): 0–2 min, 100; 2–17 min, 76; 17–18 min, 0; 18–21 min, 0; 21–22 min, 100; 22–27 min, 100.
d. Detection: Fluorescence (excitation 290 nm, emission 325 nm).
e. Injection volume: 20 μL.
13. Prepare α-tocopherol and γ-tocopherol standard solutions at concentrations of 0.0625, 0.125, 0.25, 0.5, 1, and 2 μg/mL, each containing 100 μg/mL tocopherol acetate internal standard to generate a standard curve.
14. Identify tocopherol peaks by comparing their retention times with those of the standards. Calculate tocopherol concentrations based on the standard curve and normalize the values to tissue fresh weight.
Data analysis
1. Colocalization analysis: Determine the candidate proteins’ colocalization with plastids by merging GFP/fluorescent signal with chloroplast autofluorescence (Figure 2A).
2. Western blotting analysis: Check the molecular weight of the candidate protein based on its protein sequence or CDS. Make sure that the candidate protein is successfully expressed in tobacco leaves by detecting a protein band of the expected molecular weight (Figure 2B).
3. Tocopherol quantification: Generate a standard curve by plotting the ratio of the peak area of α-tocopherol or γ-tocopherol to tocopherol acetate against α-tocopherol or γ-tocopherol concentration. Calculate tocopherol content in each sample using the standard curve equation. Normalize tocopherol content to fresh weight (μg/g FW). Calculate total tocopherol content by summing α-tocopherol and γ-tocopherol concentrations and calculate the mean and standard deviation (SD) from at least three biological replicates (Figure 3). Perform statistical analysis (e.g., Student's t-test or one-way ANOVA) to compare tocopherol levels between experimental groups and control groups. A significant increase or decrease in tocopherol content in candidate-expressing samples compared to EV controls suggests the candidate protein may be involved in tocopherol biosynthesis (Figure 2C).
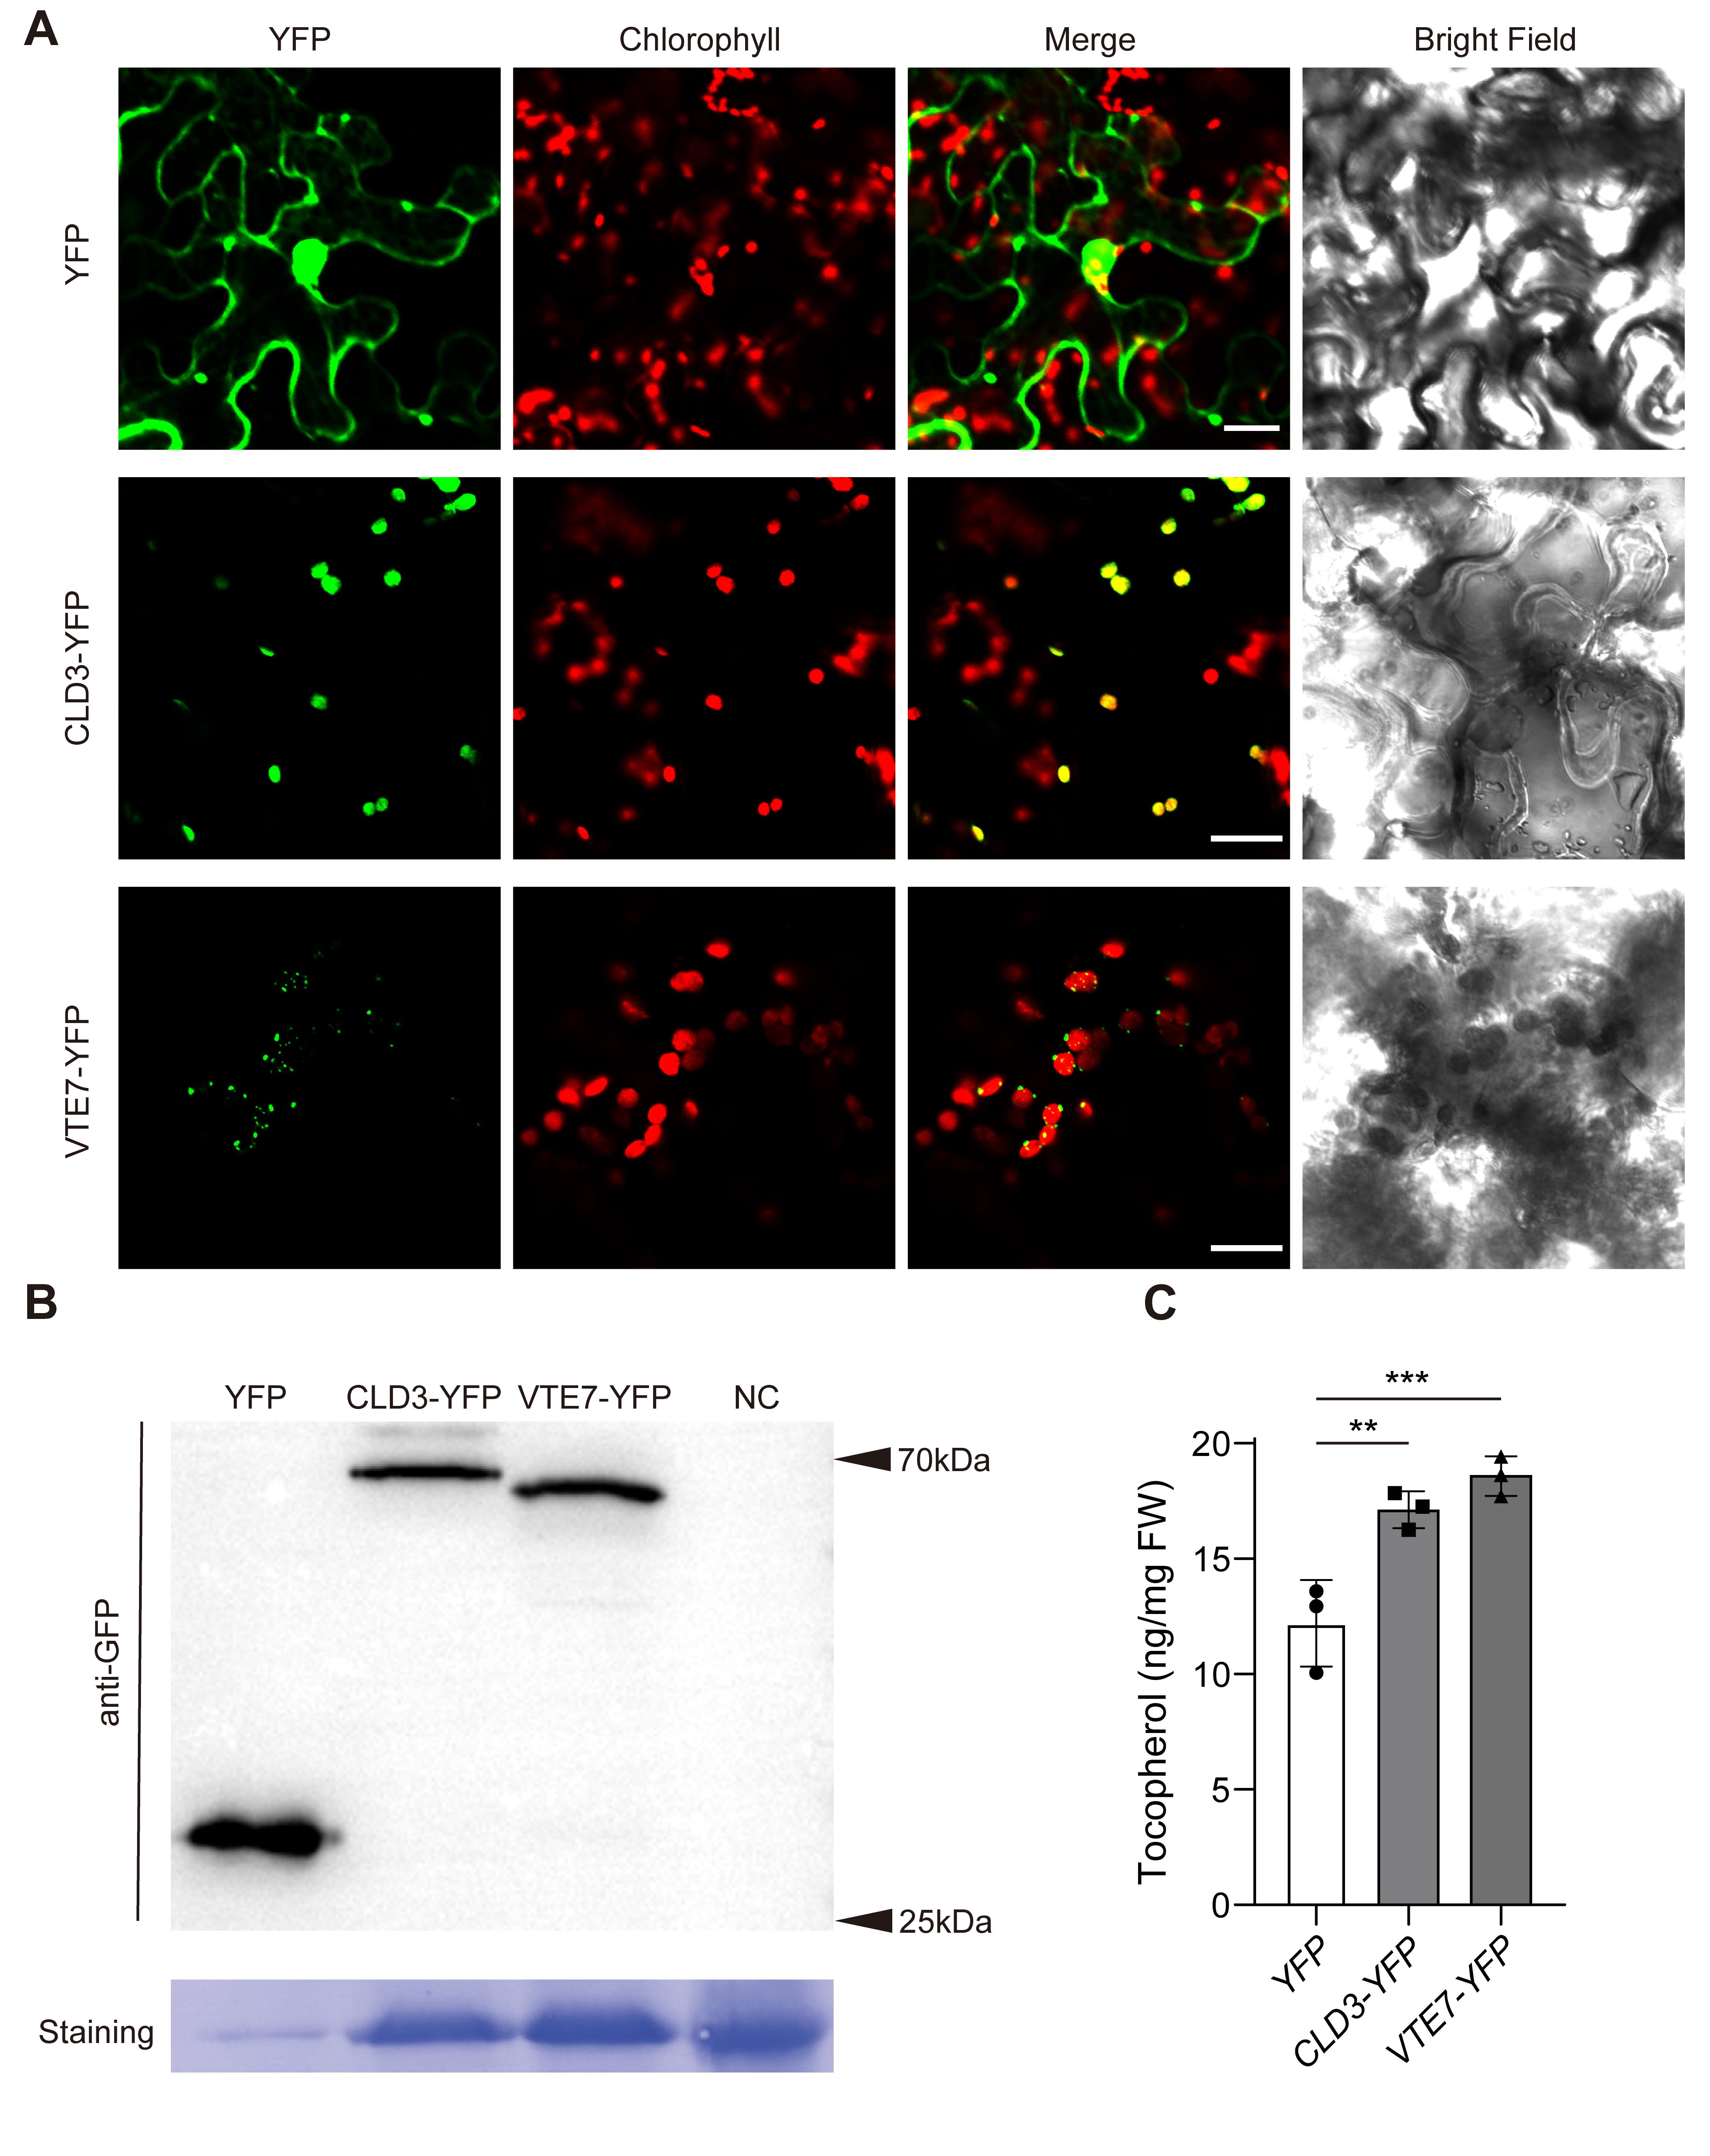
Figure 2. Combination of confocal imaging, immunoblotting, and HPLC to verify candidate genes involved in tocopherol biosynthesis. (A) Protein localization of 35S-YFP, 35S-CLD3-YFP, and 35S-VTE7-YFP transiently expressed in tobacco and imaged by confocal microscopy. The four panels are: YFP (green), chlorophyll autofluorescence (red), merge of green and red channels, and brightfield. Scale bars, 20 μm. (B) Immunoblot analysis for YFP, CLD3-YFP, VTE7-YFP, and NC (negative control; tobacco leaves without agroinfiltration), using antibodies against GFP. The loading amounts for 35S-YFP, 35S-CLD3-YFP, 35S-VTE7-YFP, and NC are 3, 15, 15, and 15 μL, respectively. Coomassie staining is used as a loading control. (C) Quantification of tocopherol levels for the tobacco leaves transiently expressing YFP, CLD3-YFP, or VTE7-YFP. n = 3; data are means ± SD. Student’s t-test; **P < 0.01, ***P < 0.001.
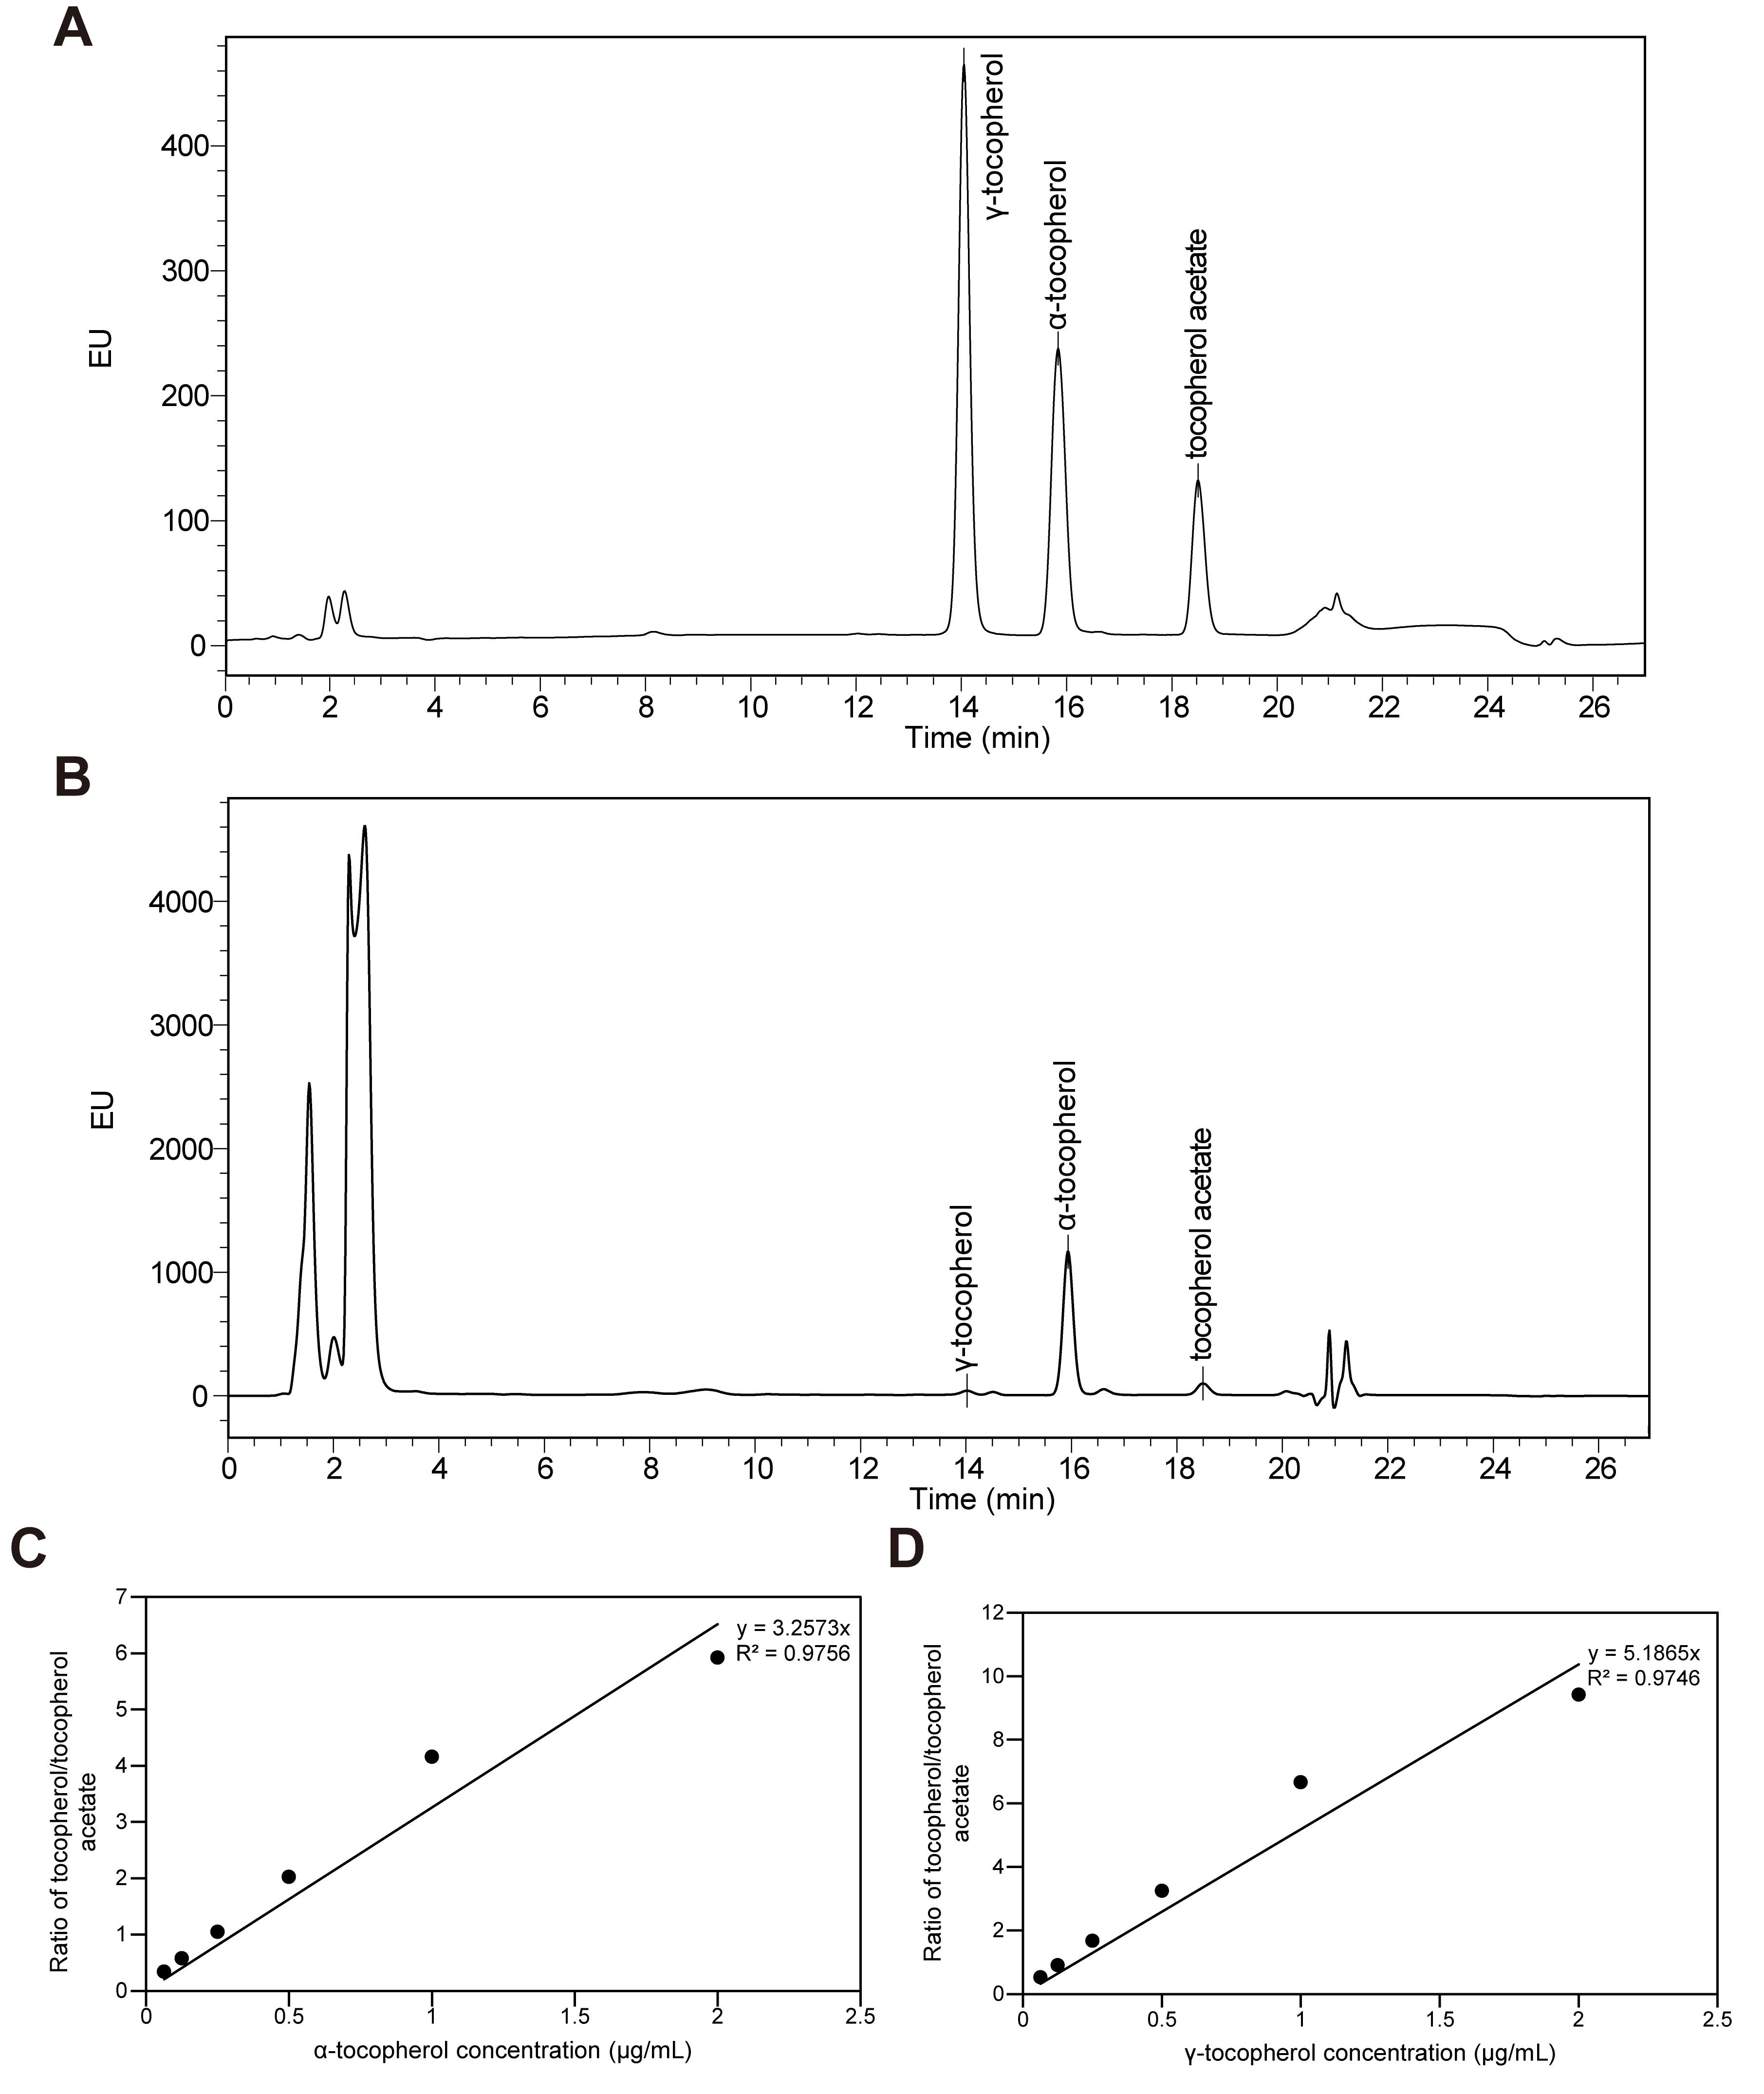
Figure 3. HPLC chromatograms and standard curves generated by plotting the ratio of the peak area of tocopherols to tocopherol acetate. (A, B) HPLC chromatograms for standard (A) and samples (B). The retention times for each tocopherol and internal standard using our experimental procedure are as follows: γ-tocopherol, 14.072 min; α-tocopherol, 15.862 min; tocopherol acetate, 18.522 min. (C, D) Standard curve of α-tocopherol (C) and γ-tocopherol (D) ranging from 0.0625 to 2 μg/mL.
Validation of protocol
This protocol (or parts of it) is an optimized version of our previous vitamin E quantification protocol, which was used and validated in the following research article:
• Bao et al. [16]. High-throughput profiling of tocochromanols in leaves and seeds of Arabidopsis and Maize. Plant Methods, 16(1), 126. (Figure 4a–c; Figure 5)
This protocol (or parts of it) has been used and validated in the following research article:
• Bao et al. [6]. A family of α/β hydrolases removes phytol from chlorophyll metabolites for tocopherol biosynthesis in Arabidopsis. Plant Cell, 37(2). (Figure 4C; Figure 5B; Figure 8C)
General notes and troubleshooting
General notes
1. For rapid qualitative screening of candidate protein expression, protein concentration measurement is not mandatory in this protocol. Comparable amounts of leaf tissue and the same tissue-to-extraction-buffer ratio should be used for all samples, and total protein staining can be used to assess loading consistency. When comparing the functional effects of different candidate proteins, total protein concentration should be determined using an appropriate assay (e.g., BCA or Bradford assay) to ensure equal protein loading. In addition, differences in candidate protein expression levels should be considered when interpreting tocopherol accumulation. For more detailed quantitative comparisons, candidate protein abundance can be quantified and tocopherol accumulation compared at comparable protein expression levels.
2. For plastid localization analysis, 35S-CLD3-YFP can be used as a positive control, as CLD3 has previously been demonstrated to localize to plastids [6]. 35S-YFP can be used as a negative control for specific plastid localization.
3. For confocal imaging, select healthy tissue within the infiltrated area and avoid visibly wilted, mechanically damaged, or necrotic regions. Major leaf veins should also be avoided when possible.
4. For experiments involving environmental stress or signaling treatments, treatment conditions and sampling time should be kept consistent among samples. Confocal acquisition parameters, including laser power, detector gain, and emission settings, should be kept identical for samples being quantitatively compared.
5. For weak fluorescence signals, background fluorescence should be determined using an appropriate positive and negative control under the same imaging settings. Fluorescence intensity can be quantified from defined regions of interest using Fiji/ImageJ after background subtraction. Avoid pixel saturation and excessive photobleaching during image acquisition.
Troubleshooting
Problem 1: Leaf tissue is difficult to infiltrate.
Possible cause: The leaf may be too old or unsuitable for infiltration.
Solution: Use healthy, fully expanded leaves. Apply gentle and even pressure with the syringe; if necessary, gently prick the lower epidermis before infiltration.
Problem 2: Weak or no YFP fluorescence is detected.
Possible causes: Low transient expression, incorrect sampling area, or tissue damage.
Solution: Confirm that tissue is collected from the infiltrated region and verify protein expression by western blotting. If necessary, optimize the sampling time or Agrobacterium density for the specific construct.
Problem 3: The fluorescence signal is difficult to distinguish from the background.
Possible cause: Low expression or high autofluorescence/background signal.
Solutions: Optimize imaging parameters using controls, but keep the parameters identical among samples used for quantitative comparison. Determine background using non-fluorescent tissue under identical acquisition settings. Use Fiji/ImageJ software to subtract background and quantify weak fluorescence.
Problem 4: The expected band is weak or absent in western blotting.
Possible causes: Low expression, protein degradation, or insufficient loading.
Solutions: Keep samples cold during homogenization and minimize sample handling time. Check total protein staining and optimize the loading amount in a subsequent run if necessary.
Problem 5: Tocopherol measurements show large variation among replicates.
Possible causes: Inconsistent sampling, extraction efficiency, or recovery of the organic phase.
Solutions: Use comparable infiltrated leaf regions and fresh weights, carefully collect the same volume of the organic phase, and use the internal standard to assess extraction recovery.
Acknowledgments
This work was supported by the Science and Technology Commission of Shanghai Municipality (23ZR1427700), the China Postdoctoral Science Foundation under the 79th General Program (2026M792927), and the joint seed grant from Shanghai Jiao Tong University and Adelaide University. We also thank the research facilities at Shanghai Jiao Tong University for providing technical support. This protocol was used in [6,16].
Author contributions
Conceptualization, Y.B.; Investigation, K.X.; Writing—Original Draft, K.X.; Writing—Review & Editing, Y.B.; Funding acquisition, Y.B., K.X.; Supervision, Y.B.
Competing interests
The authors declare no competing interests.
References
- Mesa, T. and Munné-Bosch, S. (2023). α-Tocopherol in chloroplasts: Nothing more than an antioxidant? Curr Opin Plant Biol. 74: 102400. https://doi.org/10.1016/j.pbi.2023.102400
- Muñoz, P. and Munné-Bosch, S. (2019). Vitamin E in Plants: Biosynthesis, Transport, and Function. Trends Plant Sci. 24(11): 1040–1051. https://doi.org/10.1016/j.tplants.2019.08.006
- Li, Y., Yang, D., Ren, Y., Luo, Y., Zheng, H., Liu, Y., Wang, L. and Zhang, L. (2025). Vitamin E in Plants: Biosynthesis Pathways, Biofortification Strategies, and Regulatory Dynamics. Int J Mol Sci. 26(7): 3380. https://doi.org/10.3390/ijms26073380
- Niu, Y., Zhang, Q., Wang, J., Li, Y., Wang, X. and Bao, Y. (2022). Vitamin E synthesis and response in plants. Front Plant Sci. 13: e994058. https://doi.org/10.3389/fpls.2022.994058
- Shirvani, S. and Dörmann, P. (2026). Regulation of tocopherol (vitamin E) biosynthesis in Arabidopsis. J Exp Bot. e1093/jxb/erag182. https://doi.org/10.1093/jxb/erag182
- Bao, Y., Magallanes-Lundback, M., Kim, S. S., Deason, N., Niu, Y., Johnny, C., Froehlich, J. and DellaPenna, D. (2025). A family of α/β hydrolases removes phytol from chlorophyll metabolites for tocopherol biosynthesis in Arabidopsis. Plant Cell. 37(2): e1093/plcell/koaf021. https://doi.org/10.1093/plcell/koaf021
- Gutbrod, K., Romer, J. and Dörmann, P. (2019). Phytol metabolism in plants. Prog Lipid Res. 74: 1–17. https://doi.org/10.1016/j.plipres.2019.01.002
- vom Dorp, K., Hölzl, G., Plohmann, C., Eisenhut, M., Abraham, M., Weber, A. P., Hanson, A. D. and Dörmann, P. (2015). Remobilization of Phytol from Chlorophyll Degradation Is Essential for Tocopherol Synthesis and Growth of Arabidopsis. Plant Cell. 27(10): 2846–2859. https://doi.org/10.1105/tpc.15.00395
- Lira, B. S., Rosado, D., Almeida, J., de Souza, A. P., Buckeridge, M. S., Purgatto, E., Guyer, L., Hörtensteiner, S., Freschi, L., Rossi, M., et al. (2016). Pheophytinase Knockdown Impacts Carbon Metabolism and Nutraceutical Content Under Normal Growth Conditions in Tomato. Plant Cell Physiol. 57(3): 642–653. https://doi.org/10.1093/pcp/pcw021
- Quiles, C., Viera, I. and Roca, M. (2022). Multiomics Approach To Decipher the Origin of Chlorophyll Content in Virgin Olive Oil. J Agric Food Chem. 70(12): 3807–3817. https://doi.org/10.1021/acs.jafc.2c00031
- Takatani, N., Uenosono, M., Hara, Y., Yamakawa, H., Fujita, Y. and Omata, T. (2022). Chlorophyll and Pheophytin Dephytylating Enzymes Required for Efficient Repair of PSII in Synechococcus elongatus PCC 7942. Plant Cell Physiol. 63(3): 410–420. https://doi.org/10.1093/pcp/pcac006
- Albert, E., Kim, S., Magallanes-Lundback, M., Bao, Y., Deason, N., Danilo, B., Wu, D., Li, X., Wood, J. C., Bornowski, N., et al. (2022). Genome-wide association identifies a missing hydrolase for tocopherol synthesis in plants. Proc Natl Acad Sci USA. 119(23): e2113488119. https://doi.org/10.1073/pnas.2113488119
- Lin, Y. P. and Charng, Y. y. (2017). Supraoptimal activity of CHLOROPHYLL DEPHYTYLASE1 results in an increase in tocopherol level in mature arabidopsis seeds. Plant Signal Behav. 12(11): e1382797. https://doi.org/10.1080/15592324.2017.1382797
- Lin, Y. P., Wu, M. C. and Charng, Y. y. (2016). Identification of a Chlorophyll Dephytylase Involved in Chlorophyll Turnover in Arabidopsis. Plant Cell. 28(12): 2974–2990. https://doi.org/10.1105/tpc.16.00478
- Romer, J., Gutbrod, K., Schuppener, A., Melzer, M., Müller-Schüssele, S. J., Meyer, A. J. and Dörmann, P. (2023). Tocopherol and phylloquinone biosynthesis in chloroplasts requires the phytol kinase VITAMIN E PATHWAY GENE5 (VTE5) and the farnesol kinase (FOLK). Plant Cell. 36(4): 1140–1158. https://doi.org/10.1093/plcell/koad316
- Bao, Y., Magallenes-Lundback, M., Deason, N. and DellaPenna, D. (2020). High throughput profiling of tocochromanols in leaves and seeds of Arabidopsis and Maize. Plant Methods. 16(1): 126. https://doi.org/10.1186/s13007-020-00671-9
Article Information
Publication history
Received: Aug 19, 2026
Accepted: Oct 22, 2026
Available online: Nov 12, 2026
Published: Dec 5, 2026
Copyright
© 2026 The Author(s); This is an open access article under the CC BY-NC license (https://creativecommons.org/licenses/by-nc/4.0/).
How to cite
Xu, K. and Bao, Y. (2026). A Simplified Method for Verifying Tocopherol Biosynthesis-Related Genes by Transient Expression in Nicotiana benthamiana. Bio-protocol 16(23): e5887. DOI: 10.21769/BioProtoc.5887.

 Download Citation in RIS Format
Do you have any questions about this protocol?
Post your question to gather feedback from the community. We will also invite the authors of this article to respond.
 Post a Question


