


- Protocols

- Articles and Issues
- For Authors
- About
- Become a Reviewer


H2DCFDA Fluorescent Tracing and NMT for Real-Time Detection of Long-Distance H2O2 Signaling in Paspalum vaginatum

Published: Vol 16, Iss 22, Nov 20, 2026 DOI: 10.21769/BioProtoc.5886 Views: 19
Reviewed by: Kishwar Jahan ShethiAnonymous reviewer(s)
 PDF
 Ask a question


Protocol Collections
Comprehensive collections of detailed, peer-reviewed protocols focusing on specific topics



Related protocols
Abstract
This protocol describes an integrated methodology combining H2DCFDA fluorescent labeling and non-invasive micro-test technology (NMT) for real-time detection of long-distance H2O2 signaling in Paspalum vaginatum. H2DCFDA enables tissue-level reactive oxygen species (ROS) visualization via confocal microscopy, while NMT provides quantitative H2O2 flux measurement across chloroplast membranes. The protocol details hydroponic plant cultivation, salt stress (200 mM NaCl) treatments, diphenyleneiodonium chloride (DPI) stem injection for NADPH oxidase inhibition, H2DCFDA staining and Zeiss laser scanning microscope (LSM) imaging, chloroplast isolation and NMT flux recording, and integrated data analysis. This dual-technology approach generates complementary spatial and quantitative evidence for investigating bidirectional root-leaf H2O2 signaling in monocot plants.
Key features
• Integrates H2DCFDA fluorescent labeling and non-invasive micro-test technology (NMT) for dual validation of spatial and quantitative H2O2 detection in monocot plants.
• Establishes a standardized stem-injection protocol for DPI-mediated NADPH oxidase inhibition in Paspalum vaginatum, enabling signaling-deficient controls.
• Provides a complete workflow from hydroponic cultivation to chloroplast isolation and real-time H2O2 flux measurement, suitable for systemic ROS signaling studies.
• Demonstrates bidirectional root-leaf H2O2 transmission under salt stress and heat shock, with complementary fluorescence imaging and electrochemical quantification.
Keywords: H2O2 signaling H2DCFDA
NMT
Paspalum vaginatum
Salt stress
NADPH oxidase
Chloroplast
Confocal microscopy
ROS wave
Background
Hydrogen peroxide (H2O2) serves as a critical signaling molecule in plant systemic stress responses. Under abiotic stress, localized H2O2 bursts propagate through the vasculature as ROS waves, activating defense networks in distal organs within seconds to minutes [1,2]. This signaling is primarily driven by plasma membrane–localized NADPH oxidases (respiratory burst oxidase homologs, RBOHs), which produce apoplastic superoxide rapidly dismutated to H2O2 [3].
Paspalum vaginatum is a halophytic warm-season turfgrass with exceptional salt tolerance, making it an excellent model for studying systemic stress signaling in monocots [4]. Previous studies identified the PvRBOH gene family and demonstrated the essential role of root-sourced H2O2 in maintaining jasmonic acid and Na+/K+ homeostasis under salt stress [5,6]. However, direct evidence for bidirectional long-distance H2O2 transport in this species—and in monocots generally—remains scarce, as existing approaches cannot discriminate between ROS generated in situ and H2O2 arriving via vascular transport.
To close this gap, we integrate H2DCFDA (2',7'-dichlorodihydrofluorescein diacetate) fluorescent labeling and non-invasive micro-test technology (NMT) as complementary, interdependent tools: H2DCFDA provides tissue-level spatial mapping of ROS accumulation, and NMT delivers real-time, quantitative H2O2 flux measurements at micrometer resolution. Neither method alone can resolve both the anatomical trajectory and the kinetic direction of systemic signaling. H2DCFDA is a cell-permeable fluorescent probe oxidized by ROS to produce green fluorescence (excitation 488 nm, emission 525 nm), enabling tissue-level ROS visualization [7]. H2DCFDA is nonspecific and reacts with multiple ROS species, including H2O2, hydroxyl radicals, and peroxynitrite; therefore, it provides an indicator of overall oxidative stress rather than specific H2O2 quantification. NMT provides real-time, quantitative measurement of H2O2 flux at micrometer resolution without sample damage [8]. Together, these techniques generate convergent, spatial, and quantitative evidence within a single framework, filling a critical methodological gap in monocot ROS wave research and providing a transferable platform for systemic signaling studies in other grasses. This protocol was validated by Peng et al. [9], demonstrating that root-sourced H2O2 induced by 200 mM NaCl travels upward to leaves [blocked by stem-injected diphenyleneiodonium chloride (DPI)], and leaf-sourced H2O2 induced by 43 °C heat shock travels downward to root tips (attenuated by foliar DPI). Diphenyleneiodonium chloride is a flavoprotein inhibitor commonly used to block NADPH oxidase activity and may also inhibit other flavin-containing enzymes; therefore, results should be interpreted in conjunction with genetic evidence when available.
Materials and reagents
Biological materials
1. Paspalum vaginatum SeaIsle 2000 stolons (Seashore Paspalum Germplasm Repository, Yangzhou University)
Reagents
1. Sodium chloride (NaCl) (Sinopharm, catalog number: 10019318); store at room temperature, stable for 6 months
2. Diphenyleneiodonium chloride (DPI) (MedChemExpress, catalog number: HY-10005, CAS: 4673-26-1); store at -20 °C, protect from light
3. 2',7'-Dichlorodihydrofluorescein diacetate (H2DCFDA) (MedChemExpress, catalog number: HY-D0940); store at -20 °C, protect from light
4. Dimethyl sulfoxide (DMSO) (Macklin, catalog number: D806645); store at room temperature
5. Tris(hydroxymethyl)aminomethane (Tris base) (Sigma-Aldrich, catalog number: T1503); store at room temperature
6. Hydrochloric acid (HCl) (Sinopharm, catalog number: 10011018); store at room temperature and handle in a fume hood
7. Hydrogen peroxide (H2O2, 30% stock) (Sigma-Aldrich, catalog number: H1009; store at 4 °C
8. Potassium chloride (KCl) (Sinopharm, catalog number: 10016318); store at room temperature
9. Potassium sulfate (K2SO4) (Sinopharm, catalog number: 10016518); store at room temperature
10. Potassium dihydrogen phosphate (KH2PO4) (Sinopharm, catalog number: 10017618); store at room temperature
11. D-Mannitol (Sigma-Aldrich, catalog number: M4125); store at room temperature
12. HEPES (Macklin, catalog number: H917470); store at room temperature
13. EDTA-Na2 (Sinopharm, catalog number: 10010618); store at room temperature
14. MgCl2·6H2O (Sinopharm, catalog number: 10012718); store at room temperature
15. D-Sorbitol (Macklin, catalog number: D817607); store at room temperature
16. Bovine serum albumin (BSA) (Macklin, catalog number: A850221); store at 4 °C
17. L-ascorbic acid (Aladdin, catalog number: 50-81-7); store at room temperature and protect from light
18. β-mercaptoethanol (Aladdin, catalog number: 60-24-2); store at 4 °C and handle in a fume hood
19. Hoagland nutrient (PHYGENE, catalog number: PH1782, two components: 143 g nutrient salts and 107 g modified calcium salt); store at room temperature
Solutions
1. 1/2 Hoagland nutrient solution (see Recipes)
2. 200 mM NaCl stock solution (see Recipes)
3. 10 μM H2DCFDA working solution (see Recipes)
4. 20 μM DPI working solution (see Recipes)
5. Tris-HCl buffer (see Recipes)
6. NMT test solution (see Recipes)
7. Chloroplast isolation buffer (see Recipes)
8. H2O2 calibration standards for NMT test solution (see Recipes)
Recipes
1. 1/2 Hoagland nutrient solution (1 L, pH 6.0)
| Reagent | Final concentration | Quantity or volume |
|---|---|---|
| Hoagland nutrient powder | 1/2× | 0.63 g |
| Calcium salt supplement | 1/2× | 0.473 g |
| Distilled H2O | n/a | to 1 L |
| Total | n/a | 1 L |
Note: This protocol uses a commercially available Hoagland nutrient solution (PHYGENE, catalog number: PH1782) instead of individual salts. For full-strength Hoagland, dissolve 1.26 g of Hoagland nutrient powder and 0.945 g of calcium salt supplement in 1 L of distilled water. For 1/2 strength, dissolve 0.63 g of Hoagland nutrient powder and 0.473 g of calcium salt supplement in 1 L of distilled water. Autoclave at 115 °C for 20 min or filter-sterilize (0.22 μm). Adjust pH to 6.0 ± 0.1 with 1 M HCl/NaOH if necessary. Prepare fresh; do not store.
2. 200 mM NaCl stock solution (100 mL)
| Reagent | Final concentration | Quantity or volume |
| NaCl | 200 mM | 1.17 g |
| Distilled H2O | n/a | to 100 mL |
| Total | n/a | 100 mL |
Note: Autoclave (121 °C, 20 min). Store at room temperature in 100 mL polypropylene conical tubes (stable for 6 months).
3. 10 μM H2DCFDA working solution (10 mL)
| Reagent | Final concentration | Quantity or volume |
|---|---|---|
| H2DCFDA stock (5 mM in DMSO) | 10 μM | 20 μL |
| Anhydrous DMSO | n/a | 9.98 mL |
| Total | n/a | 10 mL |
Note: Protect from light and use within 2 h.
Stock preparation: Dissolve 5 mg of H2DCFDA in 2.14 mL of anhydrous DMSO (5 mM). Aliquot 50 μL into amber PCR tubes. Store at -20 °C (≤3 months, maximum three freeze/thaw cycles).
4. 20 μM DPI working solution (10 mL)
| Reagent | Final concentration | Quantity or volume |
|---|---|---|
| DPI powder | 20 μM | 0.077 mg |
| DMSO | n/a | 10 mL |
| Total | n/a | 10 mL |
Note: Sonicate (40 kHz, 5 min). If precipitation persists, warm to 37 °C (2 min) and sonicate again. Protect from light. Use within 4 h. Prepare fresh; do not store.
5. Tris-HCl buffer (pH 7.2, 500 mL)
| Reagent | Final concentration | Quantity or volume |
|---|---|---|
| Tris base | 50 mM | 3.03 g |
| Distilled H2O | n/a | to 500 mL |
| Total | n/a | 500 mL |
Note: Adjust pH to 7.2 ± 0.1 with 1 M HCl (~18–20 mL). Autoclave. Store at 4 °C (≤1 month). Verify pH before use. Keep in a brown glass bottle at 4 °C, protected from light.
6. NMT test solution (pH 7.0, 100 mL)
| Reagent | Final concentration | Quantity or volume |
|---|---|---|
| H2O2 (30% stock, verified) | 0.01 μM | 0.11 μL |
| KCl | 10 mM | 74.6 mg |
| K2SO4 | 25 mM | 435.5 mg |
| KH2PO4 | 30 mM | 408.2 mg |
| D-Mannitol | 350 mM | 6.37 g |
| HEPES | 2 mM | 47.7 mg |
| Distilled H2O | n/a | to 100 mL |
| Total | n/a | 100 mL |
Note: Dissolve in 80 mL of distilled water. Adjust pH to 7.0 ± 0.05 with 1 M KOH. Bring volume up to 100 mL. Filter-sterilize (0.22 μm). Use within 24 h. Store at 4 °C if not for immediate use; warm to 25 °C before measurement. Prepare fresh; do not store.
7. Chloroplast isolation buffer (pH 7.8, 100 mL)
| Reagent | Final concentration | Quantity or volume |
|---|---|---|
| D-Sorbitol | 0.33 M | 6.01 g |
| HEPES | 50 mM | 1.19 g |
| EDTA-Na2 | 2 mM | 74.4 mg |
| MgCl2·6H2O | 1 mM | 20.3 mg |
| BSA | 0.1% (w/v) | 0.1 g |
| L-Ascorbic acid | 5 mM | 88.1 mg |
| β-Mercaptoethanol | 5 mM | 35 μL |
| Distilled H2O | n/a | to 100 mL |
| Total | n/a | 100 mL |
Note: Dissolve sorbitol and HEPES first, followed by the remaining components. Adjust pH to 7.8 ± 0.05 with 1 M KOH. Filter (0.45 μm). Do not autoclave. Keep on ice and use within 4 h. Prepare fresh; do not store.
8. H2O2 calibration standards for NMT test solution
| Reagent | Final concentration | Quantity or volume |
|---|---|---|
| NMT test solution (0 μM standard, no H2O2 added) | 0 μM | 100 mL |
| H2O2 stock (1 mM) | 0.01 μM | 1 μL |
| NMT test solution (diluent) | – | To 100 mL |
| H2O2 stock (1 mM) | 0.1 μM | 10 μL |
| NMT test solution (diluent) | – | To 100 mL |
| H2O2 stock (1 mM) | 1 μM | 100 μL |
| NMT test solution (diluent) | – | To 100 mL |
Note: Stock: Dilute 30% H2O2 to 1 mM. Verify: A240 = 0.436 for 10 μM (ε = 43.6 M-1·cm-1). Adjust if deviation >5%. Use within 2 h. Discard after use. Prepare fresh; do not store. All H2O2 calibration standards are prepared by diluting a verified 1 mM H2O2 stock in NMT test solution (pH 7.0). The 0 μM standard is the NMT test solution alone. NMT test solution, not water, was used as the diluent for all standards.
Laboratory supplies
Note: Similar lab supplies from other companies will work as well.
1. 1.5 mL microcentrifuge tube, DNase/RNase-free, sterile (AXYGEN, catalog number: MCT-150-C)
2. 15 mL conical centrifuge tube, DNase/RNase-free, sterile (SFYL, catalog number: SF-0015)
3. 50 mL conical centrifuge tube, DNase/RNase-free, sterile (SFYL, catalog number: SF-0050)
4. Microscope slide (CITOGLAS, catalog number: 10127105P)
5. Glass coverslip, 22 × 22 mm, thickness No. 1 (CITOGLAS, catalog number: 10127050P)
6. 1 mL syringe with 26 G needle (Keweiqi, catalog number: KWQ-1ML-26G)
7. 0.1 μm filter membrane (Xuyue, catalog number: FM-0.1); for NMT chloroplast immobilization
8. 100 μm nylon mesh (Biosharp, catalog number: BS-NM-100); for chloroplast filtration
9. 96-well hydroponic box (custom size: 127 × 87 × 114 mm); custom-made or equivalent
10. Aluminum foil (Biosharp, catalog number: BS-QT-002)
Equipment
1. Intelligent artificial climate chamber (Shanghai Yuejin Medical Equipment Co., model: HQH-400; or any equivalent model with temperature range of 15–40 °C, humidity control at 50%–90%, and PPFD ≥ 1,000 μmol m-2·s-1)
2. Confocal laser scanning microscope (Zeiss, model: LSM 880 NLO; or any equivalent with 488 nm laser line and 500–550 nm emission filter)
3. NMT Physiolyzer system (Xuyue Company, Beijing; http://nmtia.org.cn) with H2O2-selective microelectrode (tip diameter 2–3 μm, Xuyue H2O2-001)
4. Refrigerated centrifuge (1,000× g at 4 °C) (Eppendorf, model: 5804 R; or any equivalent with swinging-bucket rotor)
5. Spectrophotometer (for OD600 measurement; any model with 600 nm wavelength)
6. Microbalance (precision 0.1 mg; any analytical balance)
7. Micropipettes (P20, P200, P1000; Eppendorf Research or equivalent)
8. Rotary shaker (50–200 rpm; any orbital shaker)
9. pH meter (calibrated with standard buffers pH 4.0, 7.0, and 10.0)
10. Sterile surgical scissors and fine forceps (Dumont #5 or equivalent)
11. Ice bucket with crushed ice
12. Cheesecloth (grade 50, 100% cotton; any general laboratory supplier)
Software and datasets
1. Microsoft Office Excel 2011 (Microsoft Corporation, Redmond, USA)
2. ImageJ v1.53t (National Institutes of Health, Bethesda, USA; https://imagej.nih.gov/ij/; free, open source)
3. imFluxes V3.0 (Xuyue Company, Beijing, China; for NMT data analysis; requires license; contact Xuyue for academic pricing)
4. SPSS v20.0 (IBM Corp., Armonk, USA)
5. GraphPad Prism 10 (GraphPad Software Inc., San Diego, USA)
Procedure
A. Plant cultivation (days 1–14)
1. Select healthy SeaIsle 2000 stolons (3–5 mm diameter, 3–4 nodes) and rinse under tap water for 5 min.
2. Trim to 5–7 cm segments with at least one intact node. Place one segment per well in 96-well hydroponic boxes with 1/2 Hoagland nutrient solution (pH 6.0).
3. Culture in a climate chamber at 30/25 °C (day/night), a photosynthetic photon flux density (PPFD) of 1,000 μmol m-2 s-1, a 16/8 h photoperiod, and relative humidity (RH) of 65%–75%.
4. Replace nutrient solution every 5 days. After 14 days, select uniform plants.
Pause point: Plants can be maintained for up to 21 days if experiments are delayed; replace nutrient solution every 5 days.
B. Stress treatments and DPI inhibition
Note: All treatments use 14-day-old plants (≥5 biological replicates per group). Randomize positions in the climate chamber.
1. Salt stress (root-to-leaf H2O2 induction)
a. Gently remove plants and rinse roots with distilled water (25 °C).
b. Transfer to 200 mM NaCl solution; incubate at 30 °C under standard light for 1 h (S treatment).
c. Control (C): Incubate in 1/2 Hoagland under identical conditions for 1 h.
d. Process samples within 5 min after treatment.
2. DPI stem injection (signaling-deficient control)
Caution: DPI is a potent inhibitor of flavoproteins. Avoid skin and eye contact. Prepare and handle under dim light; DMSO is a solvent and should be used in a well-ventilated area.
a. Apply salt stress (200 mM NaCl, 1 h) as in step B1b.
b. Prepare the 20 μM DPI working solution: Dilute the 5 mM DMSO stock 1:500 with Tris-HCl buffer (pH 7.2). Vortex gently for 10 s. Use within 2 h.
c. Identify the stem region 3–5 cm above the root-shoot junction. Clean the surface with a moistened cotton swab.
d. Use a 1 mL syringe with a 26 G needle. Inject at six equidistant points around the stem circumference: Insert at a 30° angle, 2–3 mm deep into the cortex. In monocot stems, vascular bundles are dispersed throughout the ground tissue and cannot be completely avoided. The injection is therefore targeted to the cortex, and a dissecting microscope is used to control the insertion point, angle, and depth and to reduce the risk of direct penetration of vascular bundles. Inject ~50 μL per point over 5 s; withdraw slowly. Total is ~300 μL per plant. See Figure 1 for an injection schematic. Designate this as the S+DPI group.
e. If leakage occurs at >30% of points, reduce per-point volume to 30 μL and increase to 10 points. See Troubleshooting.
f. Incubate for 30 min at 30 °C under standard light for DPI distribution.
g. Apply salt stress (200 mM NaCl, 1 h) as in step B1b. Designate this as the S+DPI group.
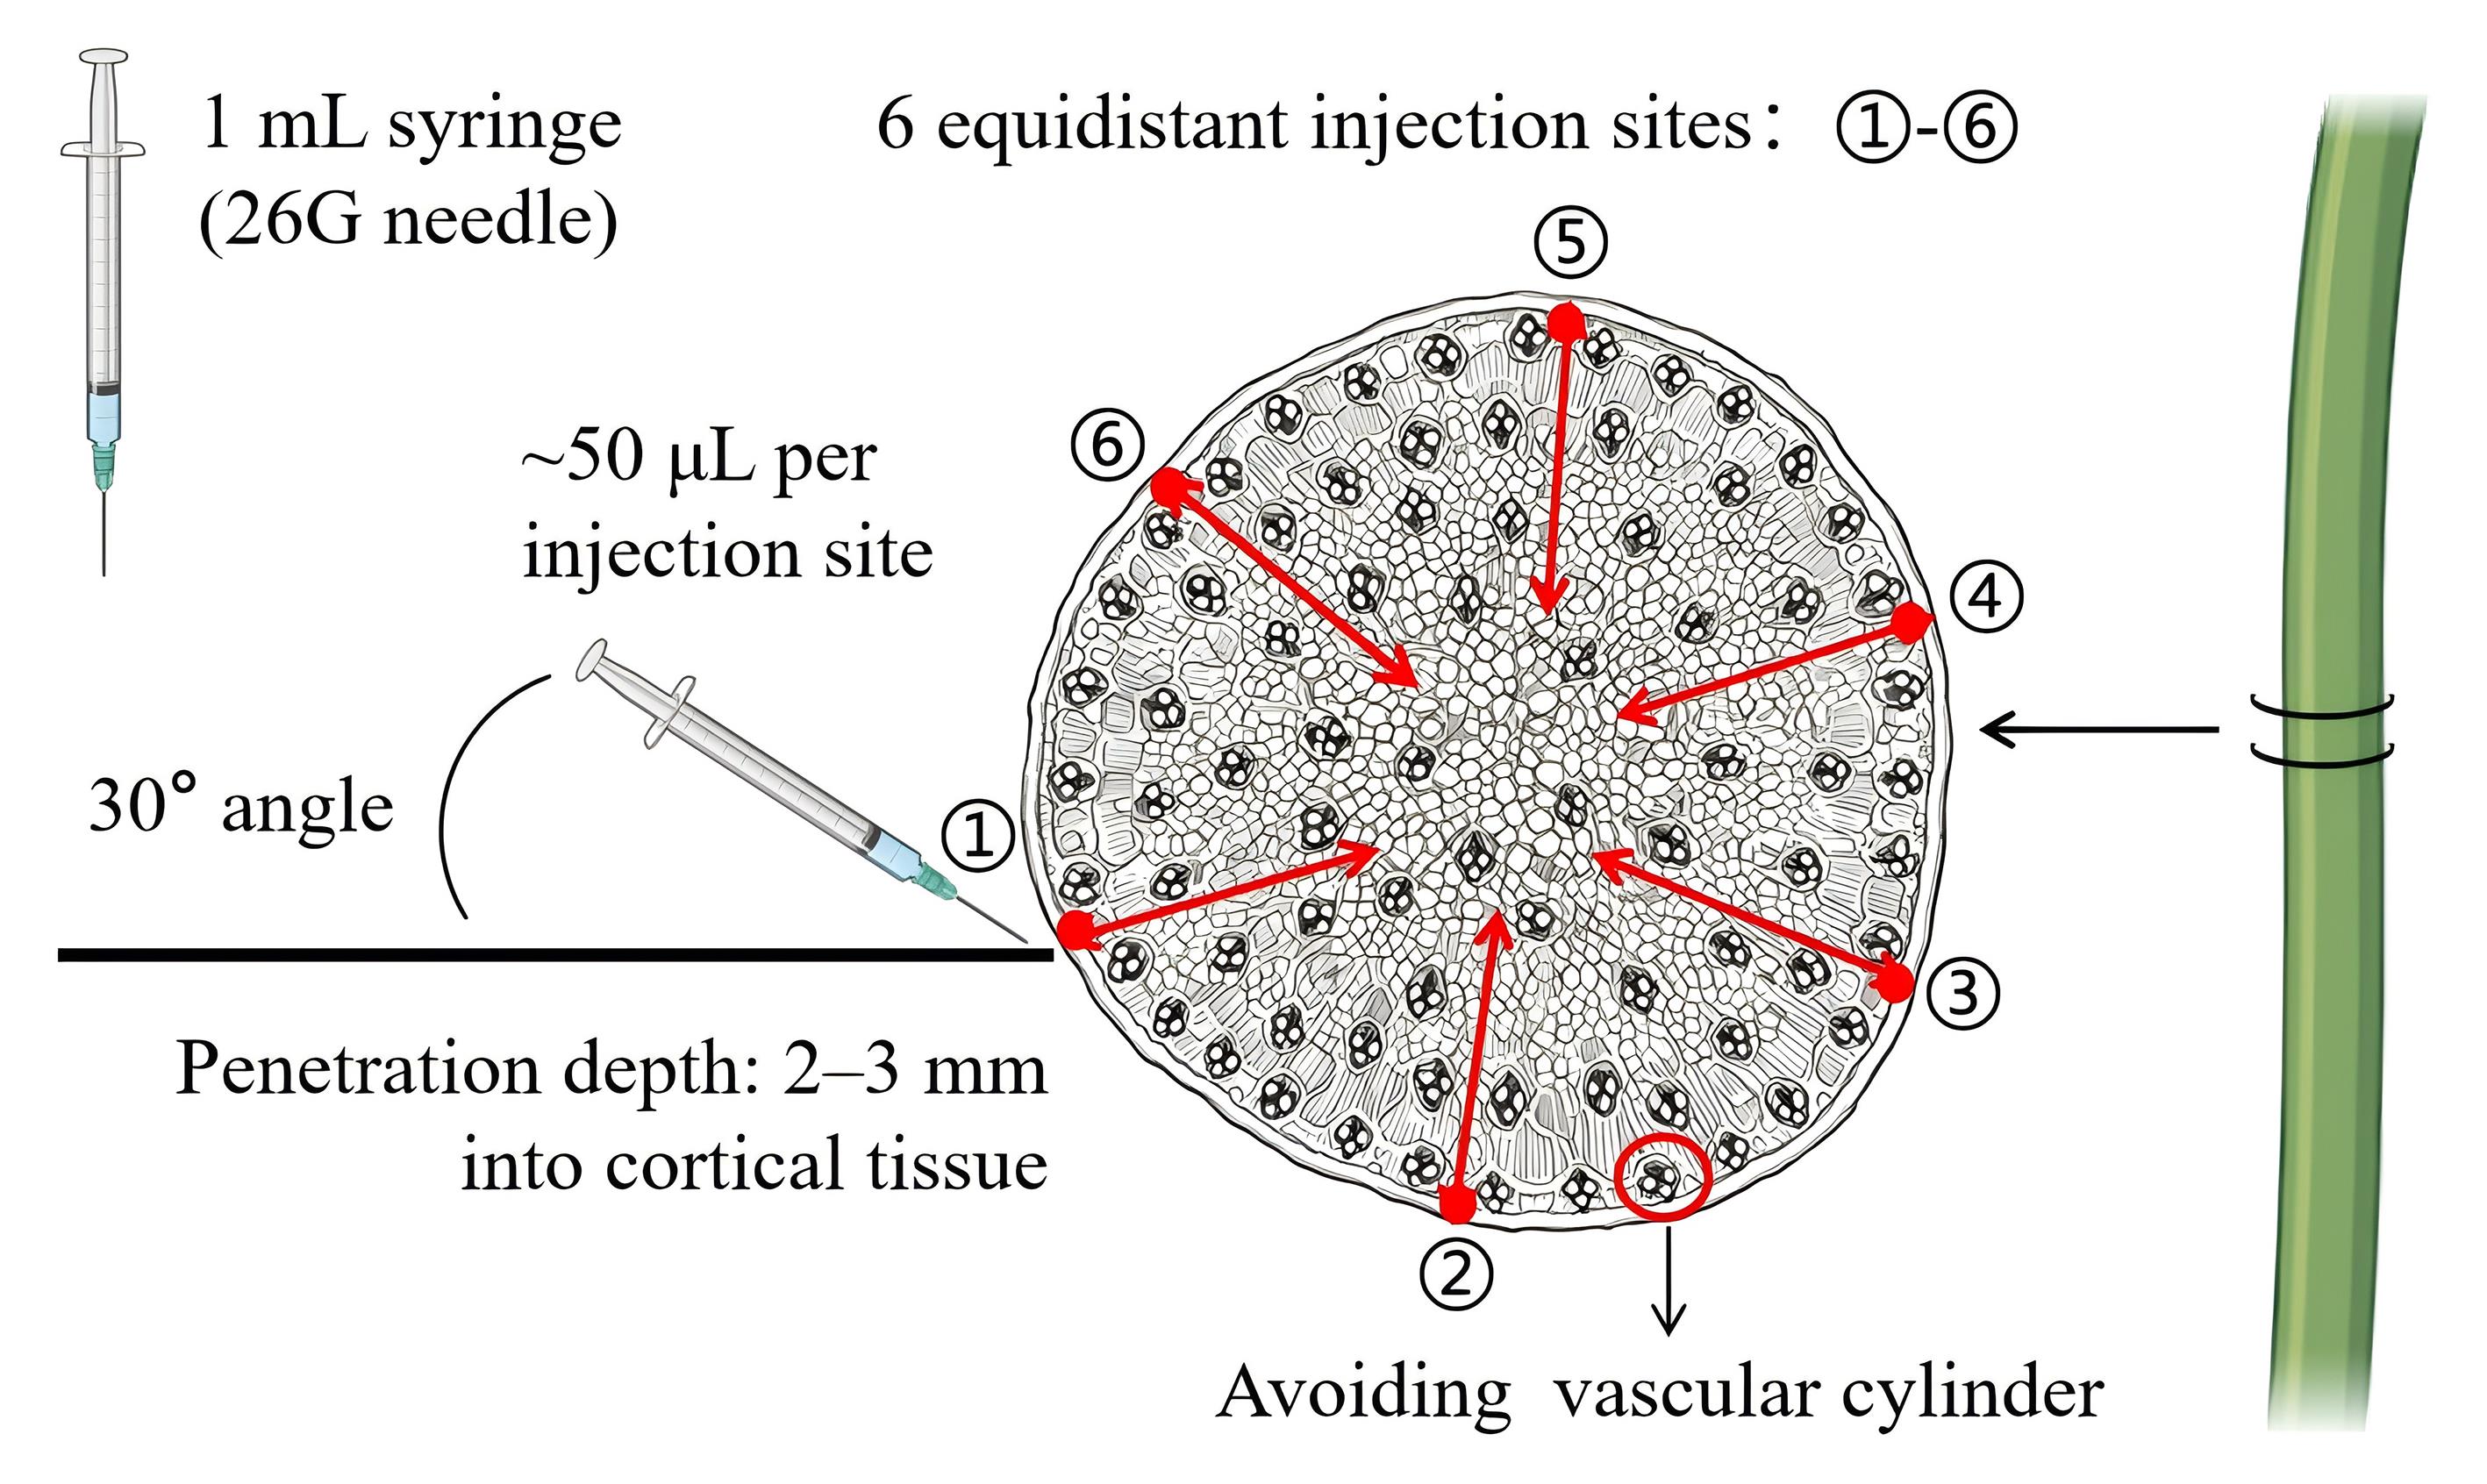
Figure 1. Diphenyleneiodonium chloride (DPI) stem injection for NADPH oxidase inhibition in Paspalum vaginatum. The schematic shows the dispersed vascular bundles in a monocot stem. A 1-mL syringe with a 26 G needle is inserted at a 30° angle into the stem cortex at six equidistant points around the stem circumference, 3–5 cm above the root–shoot junction. Because vascular bundles are dispersed throughout the stem, complete avoidance is not feasible. The injection targets the cortex, and a dissecting microscope is used to control the insertion point, angle, and depth and to reduce the risk of direct penetration of vascular bundles. Approximately 50 μL of 20 μM DPI working solution is injected per point (total ~300 μL per plant).
C. H2DCFDA staining and Zeiss LSM imaging
Critical: All H2DCFDA steps must be performed under dim light or darkness. Use aluminum foil to cover tubes. Work quickly to minimize light exposure. H2DCFDA is light-sensitive and degrades rapidly upon illumination.
Caution: H2DCFDA is dissolved in DMSO, which is readily absorbed through skin. Wear nitrile gloves and work in a well-ventilated area.
1. Prepare the 10 μM H2DCFDA working solution: Dilute the 5 mM stock 1:500 in anhydrous DMSO. Vortex for 10 s. Use within 2 h.
Note: The stock solution (5 mM in DMSO) should be aliquoted and stored at -20 °C; avoid repeated freeze/thaw cycles (maximum three cycles).
2. After stress treatment, excise tissues: root tips (~5 mm) or leaf middle sections (5 × 5 mm). Place in 1.5 mL tubes.
Pause point: Excised tissues can be kept on ice for up to 15 min before staining without significant signal loss.
3. Add 500 μL of 10 μM H2DCFDA per tube. Ensure tissues are submerged. Incubate in the dark at 25 °C for 90 min with gentle agitation (50 rpm).
4. Remove H2DCFDA solution. Wash 3× with Tris-HCl buffer (pH 7.2), 5 min per wash, under dim light. Use 1 mL per wash.
5. Mount samples: Add 10 μL of Tris-HCl to the center of the slide, place the tissue, and cover with a 22 × 22 mm coverslip at a 45° angle to avoid bubbles. Remove excess buffer with filter paper.
6. Image samples immediately (within 10 min) on a Zeiss LSM 880 NLO: excitation 488 nm, emission 500–550 nm, laser power 2%–5%, pinhole 1 Airy unit, scan speed 400 Hz, frame averaging 4, and resolution 1,024 × 1,024. Use identical settings across all samples.
Note: A laser power >5% may induce photobleaching and phototoxicity; keep power minimal while maintaining adequate signal-to-noise ratio.
7. Capture Z-stacks at 1 μm intervals (root: 20–30 slices; leaf: 15–20 slices). Save as .lsm files.
8. For quantification, acquire single-plane images from multiple biological replicates per treatment using a Zeiss microscope. Save images as 16-bit TIFF.
D. NMT measurement of chloroplast H2O2 flux
Critical: Perform all steps at 4 °C unless specified. Pre-cool all buffers and equipment. Complete isolation and measurement within 2 h of harvest of leaves treated with salt and DPI treatments. Chloroplast integrity degrades rapidly at room temperature.
1. Harvest the second fully expanded leaf immediately after treatment. Rinse with ice-cold distilled water and blot dry. Record fresh weight.
2. Chop 2 g of leaf tissue into ~2 mm2 pieces in 10 mL of ice-cold chloroplast isolation buffer using a fresh razor blade on a pre-cooled glass plate. Keep on ice.
3. Homogenize gently with a pre-cooled glass pestle (10–15 strokes). Filter through four layers of a pre-wetted cheesecloth into a pre-cooled 50 mL tube.
4. Centrifuge at 1,000× g for 5 min at 4 °C (swinging-bucket rotor, medium acceleration/braking). Remove supernatant, leaving ~500 μL above the pellet.
5. Resuspend the pellet in 2 mL of ice-cold NMT test solution (pH 7.0) using a wide-bore pipette tip. Avoid vortexing.
Note: Vortexing causes mechanical damage to chloroplast membranes.
6. Measure OD600: Dilute 10 μL in 990 μL of NMT test solution. Adjust to OD600 = 1.0 by dilution or brief centrifugation (1,000× g, 3 min) and resuspension. See Figure 2 for the chloroplast extraction workflow.
7. Equilibrate at 25 °C for 30 min with gentle stirring (100 rpm).
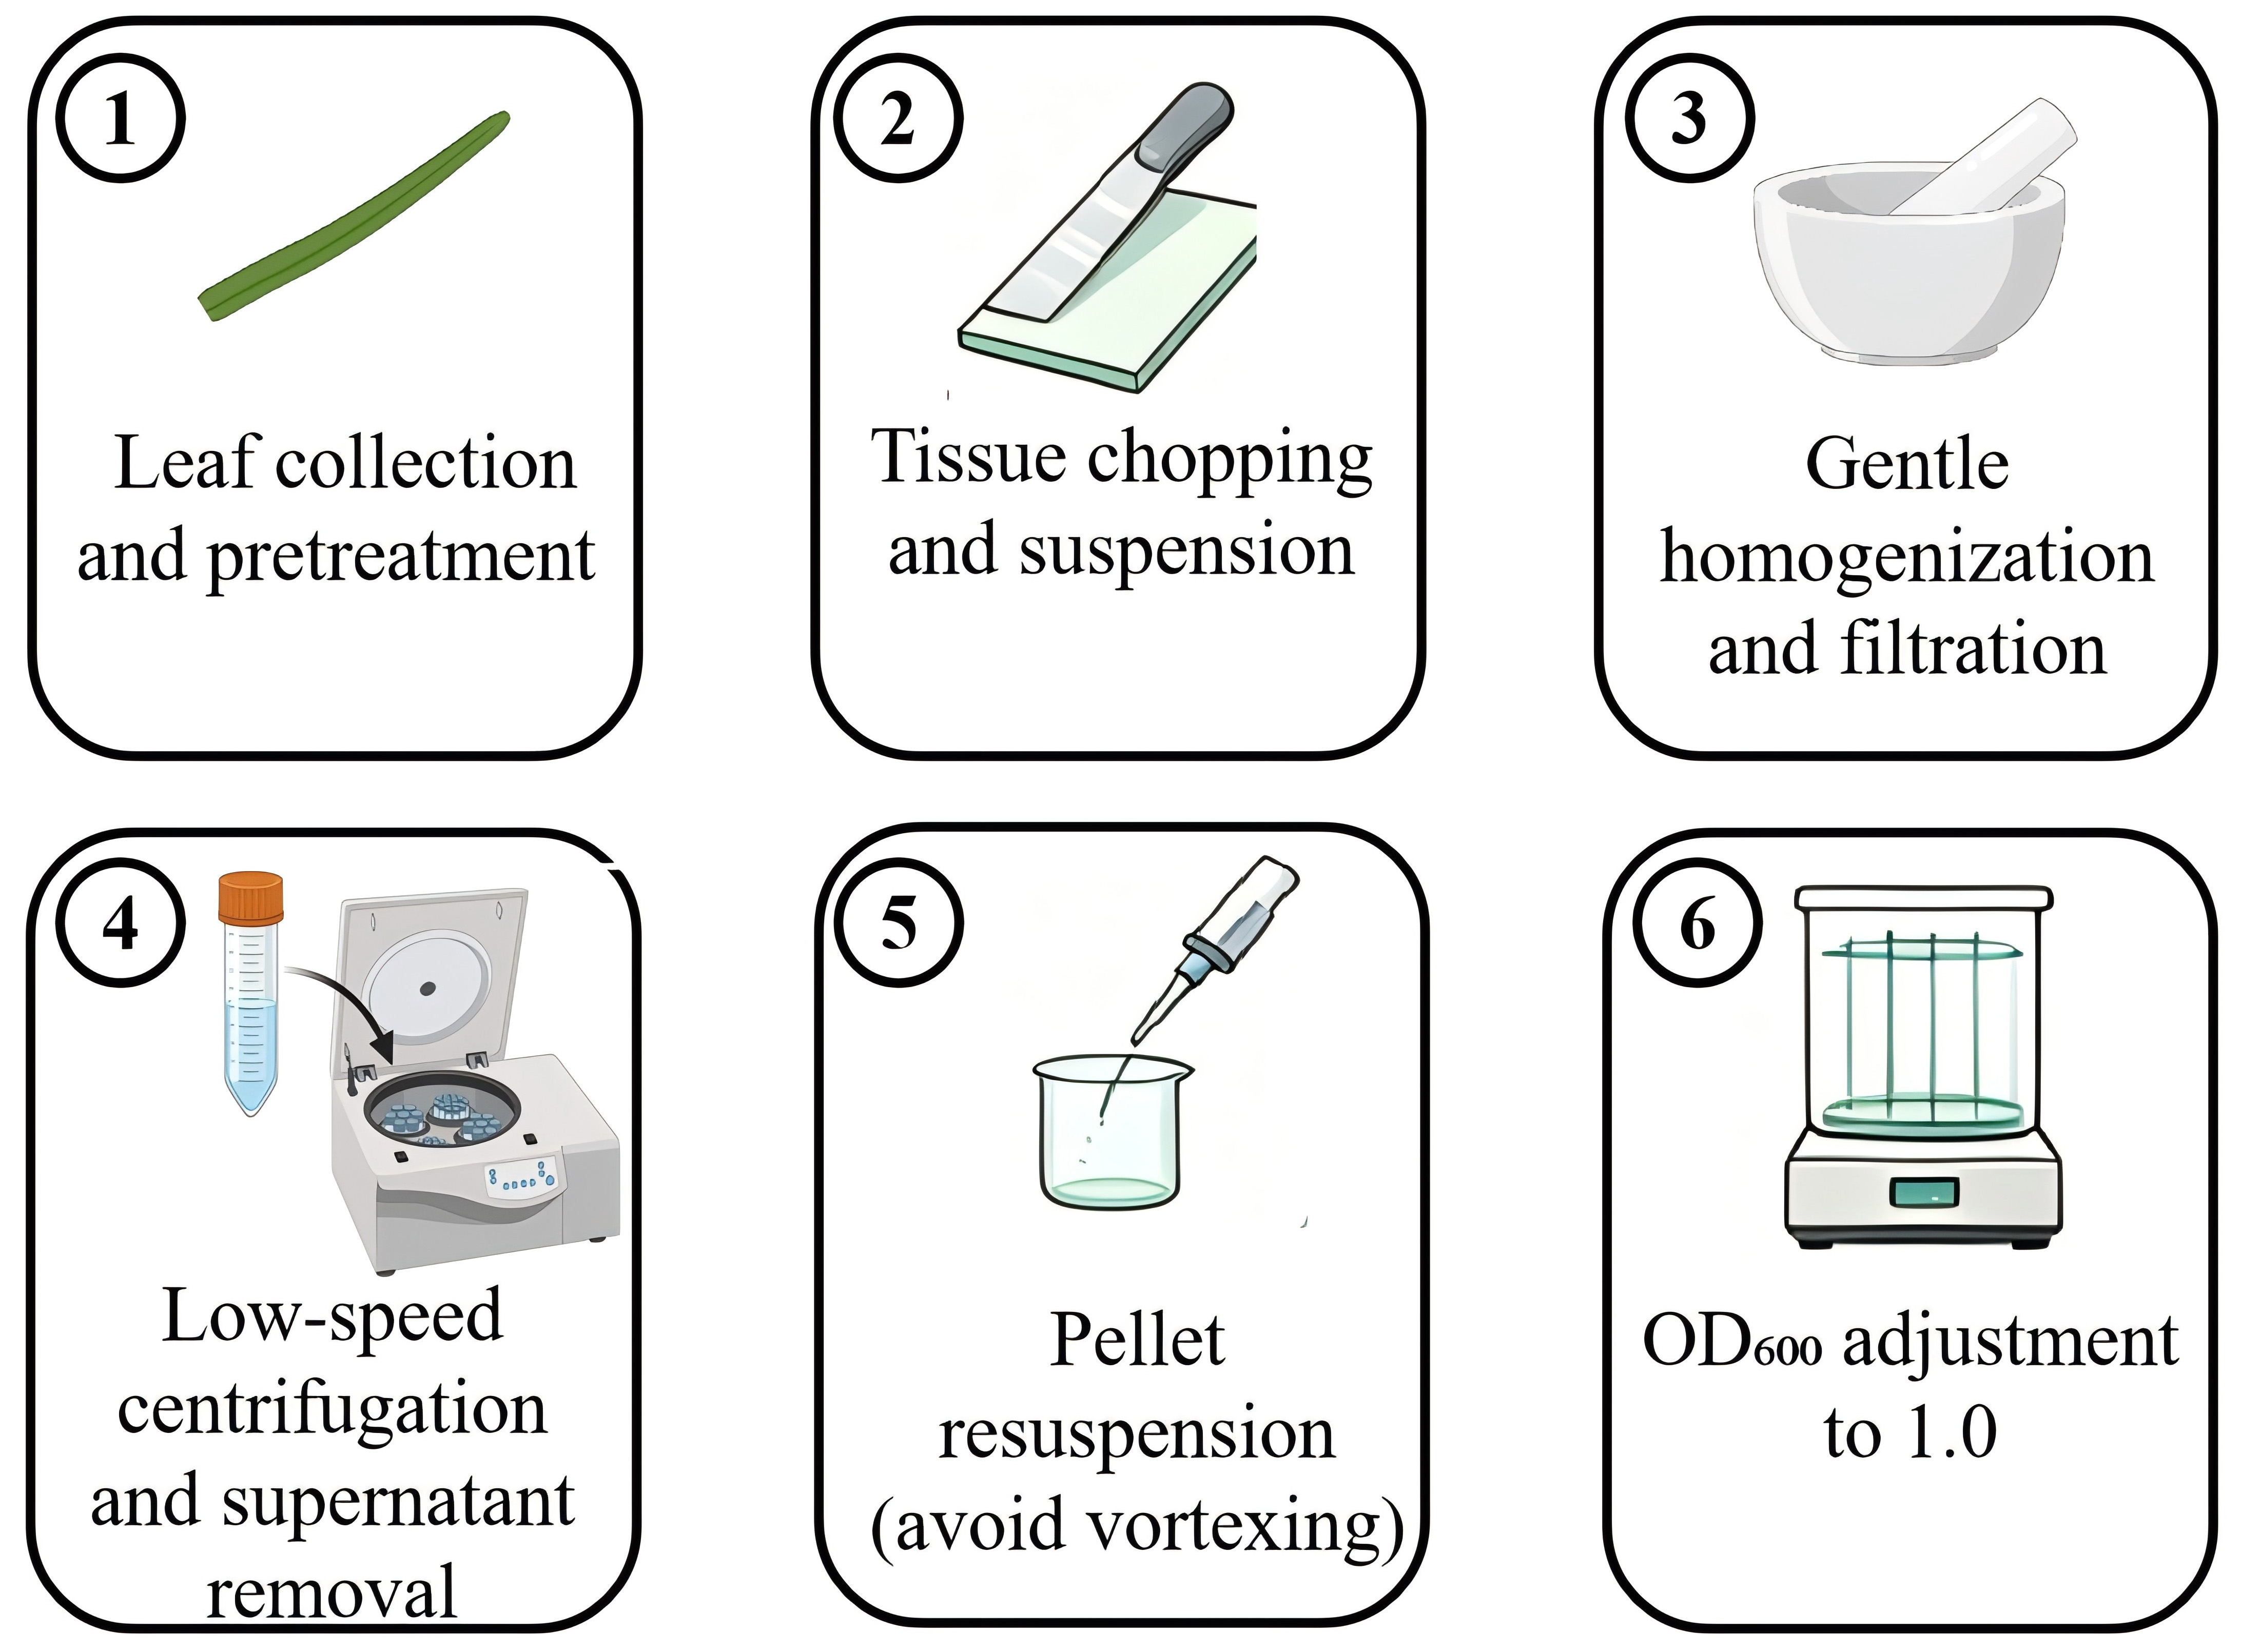
Figure 2. Chloroplast isolation protocol for non-invasive micro-test technology (NMT) measurement. Leaf tissue chopping and homogenization in isolation buffer. Differential centrifugation for chloroplast enrichment. Resuspension in NMT test solution and OD600 adjustment.
8. Prepare the NMT chamber: Mount a 0.1 μm filter membrane and add 200 μL of NMT test solution to the pre-wet filter membrane. Ensure the membrane is flat with no air bubbles.
9. Transfer 100 μL of chloroplast suspension onto the membrane center. Allow 5 min for settling. Confirm uniform distribution under an inverted microscope (10×). See Figure 3 for the filter membrane setup.
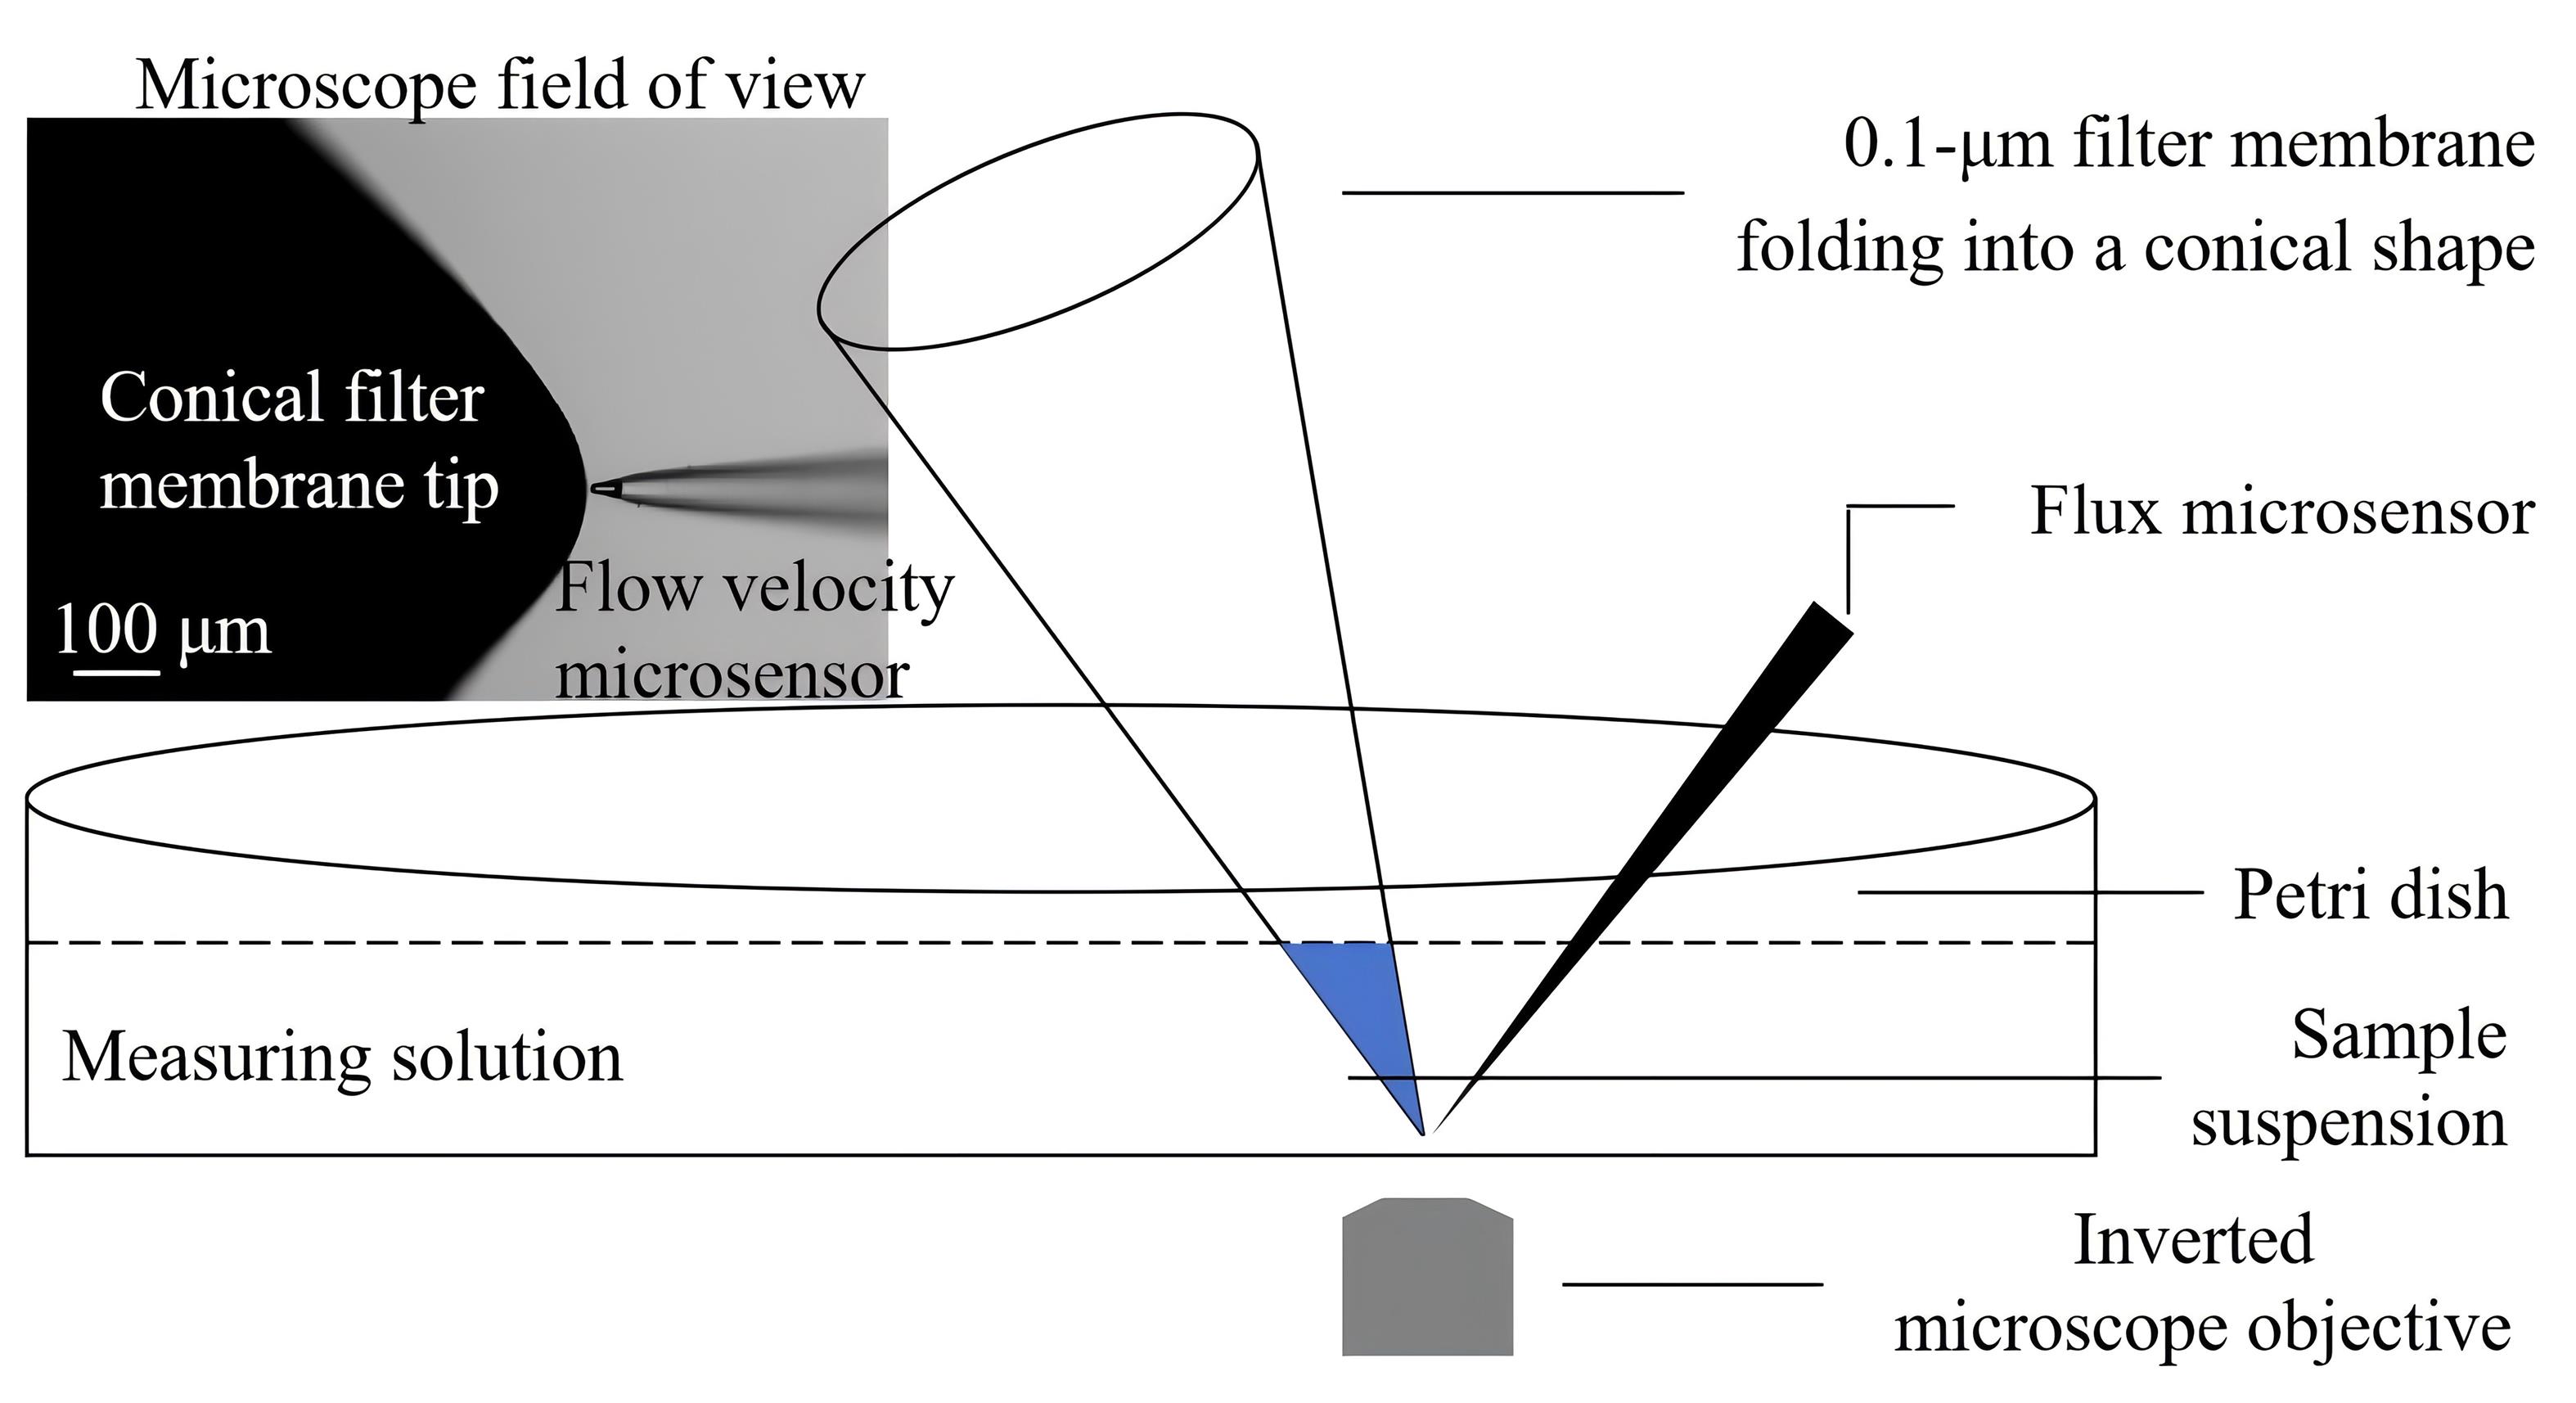
Figure 3. Non-invasive micro-test technology (NMT) chamber setup for chloroplast H2O2 flux measurement. Filter membrane mounted (0.1 μm, folded into a conical shape) in the NMT chamber with pre-wetting solution. Chloroplast suspension uniformly distributed on the membrane surface at the bottom of the conical membrane structure. H2O2-selective microelectrode positioned 2–5 μm above chloroplast layer. Scale bar = 100 μm.
10. Mount the H2O2-selective microelectrode on a micromanipulator. Under the inverted microscope (40×), position the tip 2–5 μm above the chloroplast layer (optimal: 3 μm).
11. Calibrate the electrode with H2O2 standards (0, 0.01, 0.1, and 1 μM in NMT test solution). Linearity is verified by measuring a series of H2O2 standards and plotting a standard curve (R2 > 0.99). Prepare fresh standards from 30% H2O2 stock (verify concentration: A240, epsilon = 43.6 M-1·cm-1).
Critical: Electrode calibration must be performed before each experimental session; discard electrodes with R2 < 0.99.
12. Start imFluxes V3.0: sampling 1 Hz, duration 5 min, temperature 25 °C. Record for 5 min. The first 60 s of recording are discarded to allow the system to stabilize and eliminate initial baseline fluctuations caused by probe insertion and solution exchange; analyze the remaining 240 s. Calculate mean flux (pmol cm-2·s-1). Positive = efflux; negative = influx.
13. For each treatment, use six independent plants as six biological replicates. Prepare one chloroplast suspension from each plant. For each chloroplast suspension, perform three repeated NMT measurements (technical replicates) by repositioning the H2O2-selective microelectrode and recording the H2O2 flux for 5 min each. The whole-plant treatment is not repeated on the same plant; technical replicates are repeated measurements of the same chloroplast suspension and are used only to assess measurement precision. For statistical analysis, average the three technical replicates to obtain one flux value per biological replicate (n = 6 per treatment). Accept measurements with CV < 15%.
Note: CV > 15% indicates electrode instability or uneven chloroplast distribution; repeat measurement after recalibration.
14. Verify chloroplast integrity by Evans blue exclusion (optional): 0.1% Evans blue for 5 min. Intact chloroplasts exclude dye (green); damaged ones stain blue. Exclude preparations with >20% damaged chloroplasts. See Troubleshooting.
15. Save the H2O2 flux data measured by the H2O2-selective flux microsensor as a .csv file. This .csv file is the raw time-course output exported from imFluxes V3.0 and contains time (s), H2O2 flux (pmol cm-2·s-1), and the corresponding electrode calibration parameters. Name the file according to sample ID, treatment, and replicate.
Note: The .csv file refers specifically to the raw H2O2 flux data recorded by the H2O2-selective flux microsensor. Raw time-course data should be saved, not only the averaged flux values.
Data analysis
1. H2DCFDA fluorescence quantification (ImageJ)
a. Open 16-bit TIFF in ImageJ. For Z-stacks: Image → Stacks → Z Project, Max Intensity.
b. Set measurements: Analyze → Set Measurements, check Mean gray value and Area. Set the scale using embedded metadata.
c. Draw the region of interest (ROI) around the target area (root meristem: 0–500 μm from apex; leaf mesophyll, avoiding veins). Measure (press M). See the red area in Figure 4C for approximate details.
d. Measure the background in the tissue-free region. Corrected mean fluorescence intensity (MFI) = MFI_tissue - MFI_background.
e. Calculate relative fluorescence units (RFU) = (Corrected MFI_treatment/Corrected MFI_control) × 100. Analyze three biological replicates per treatment.
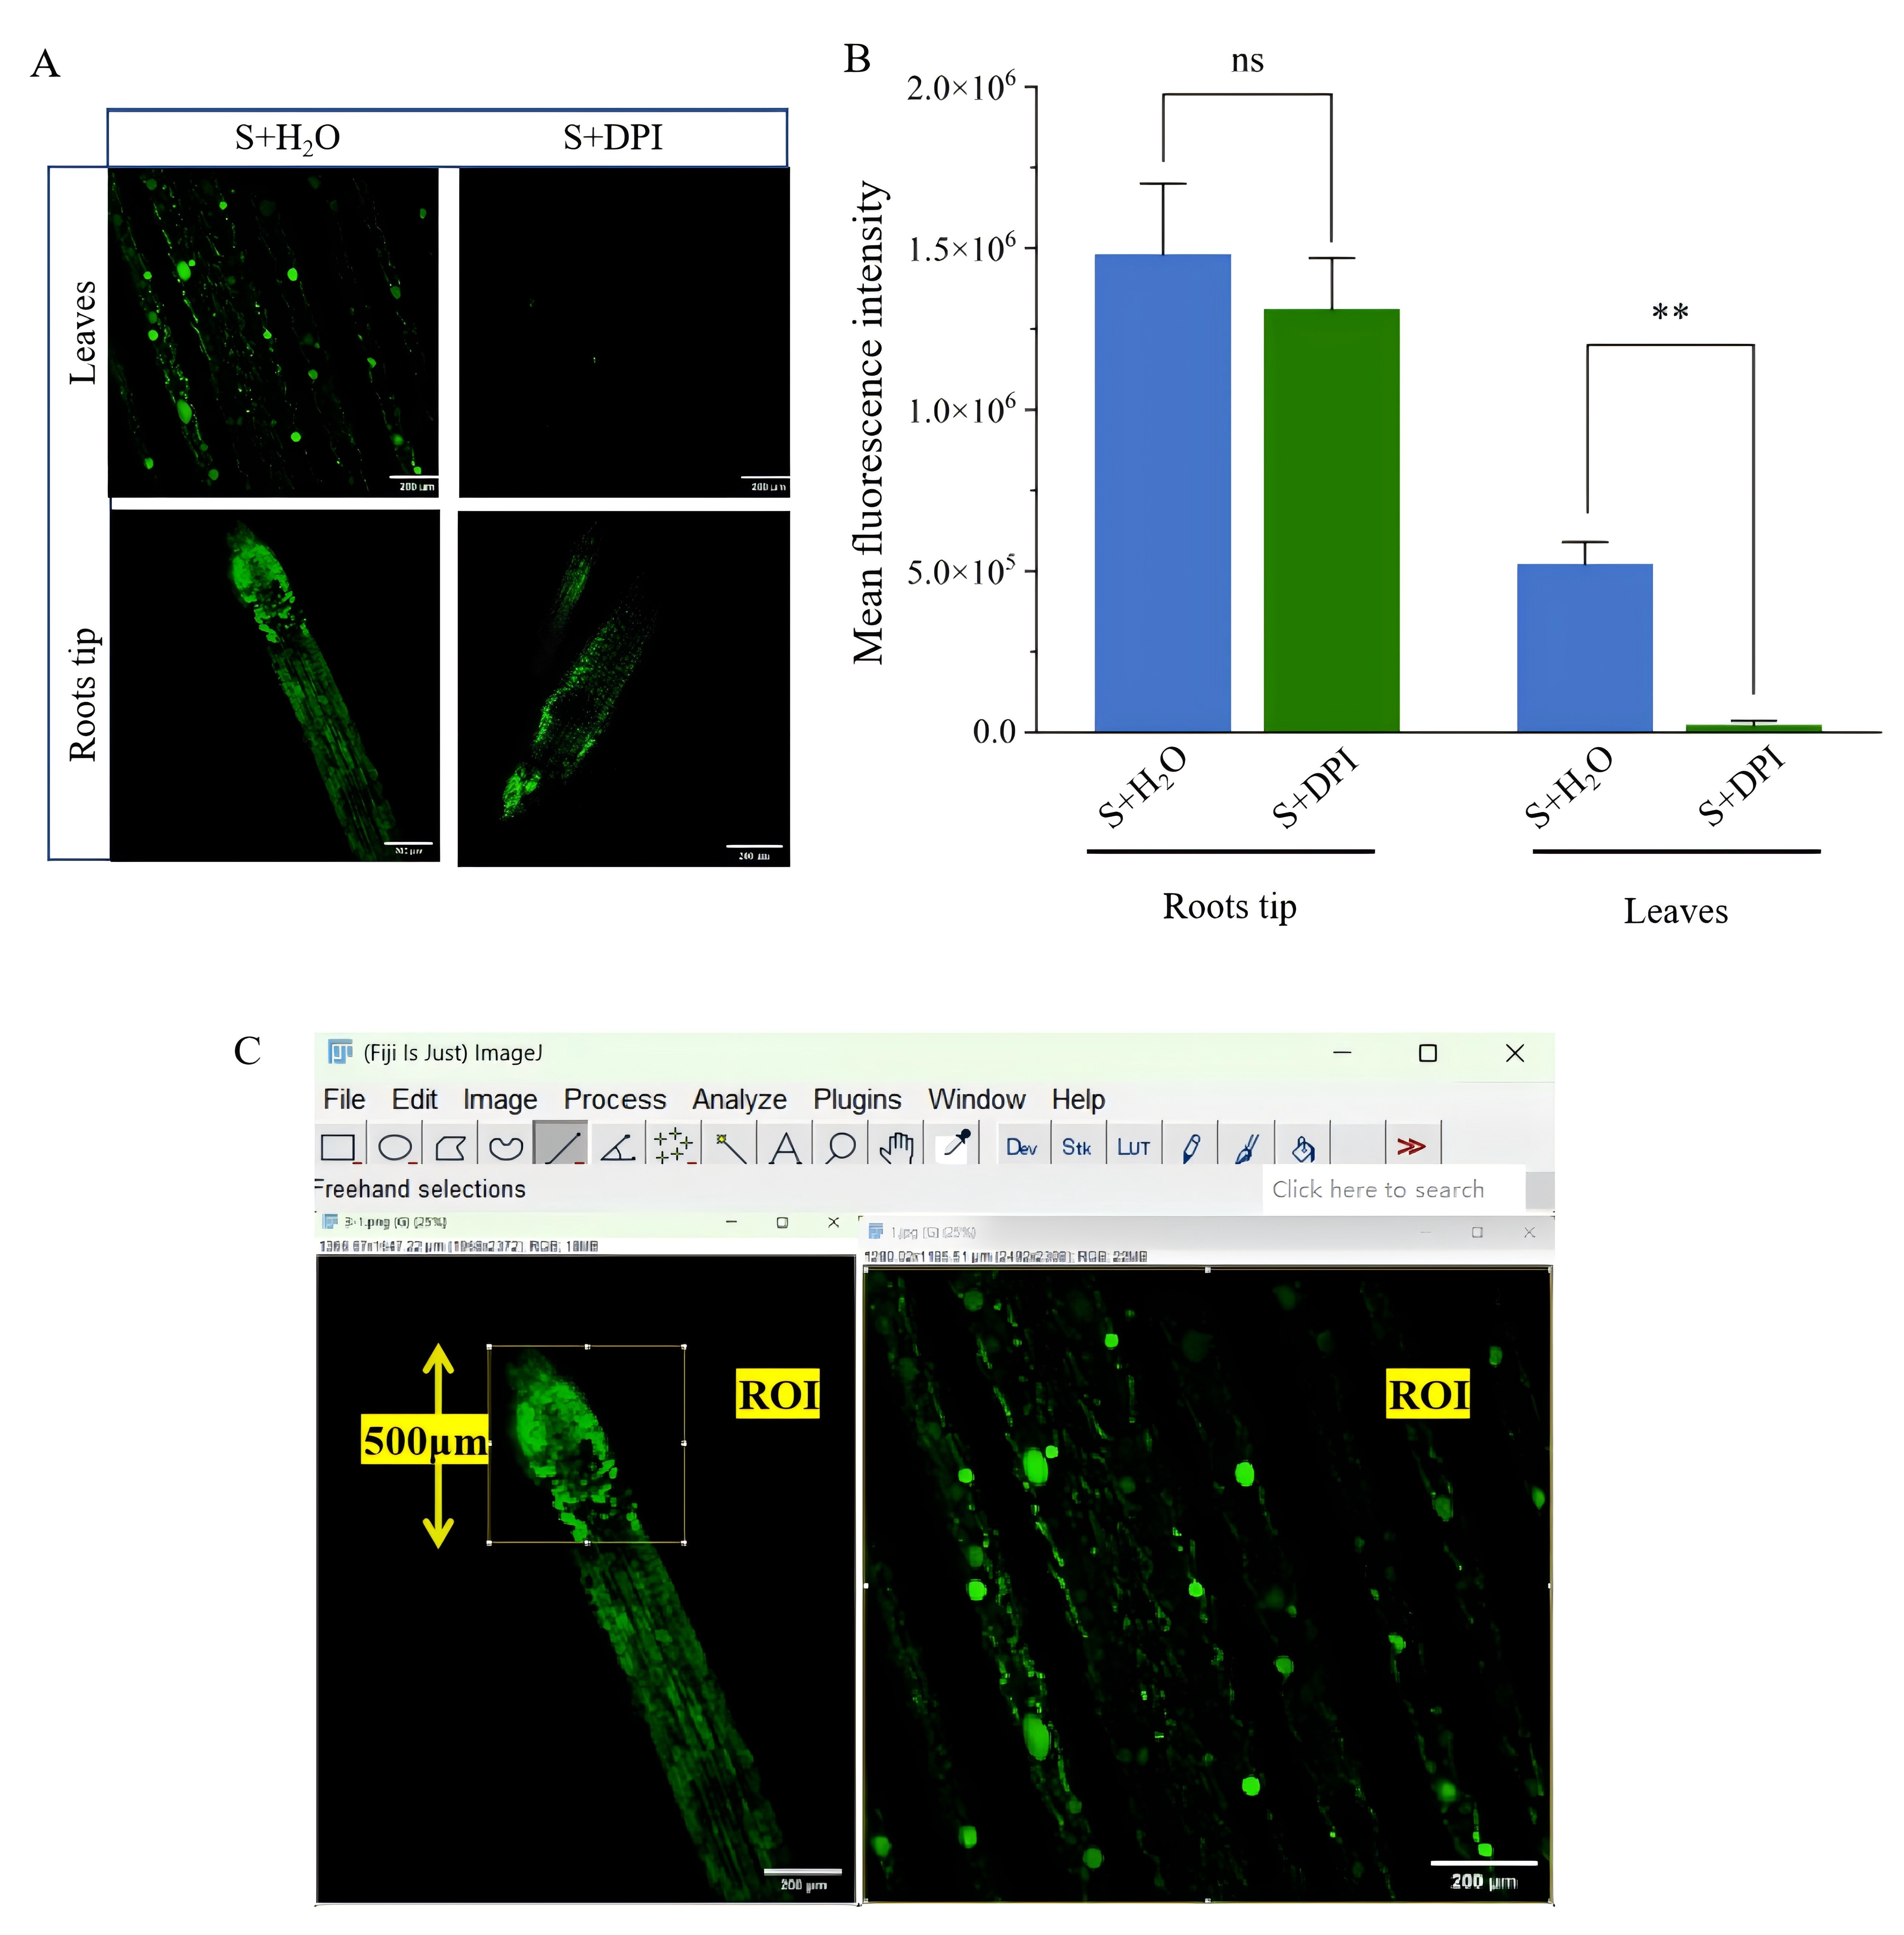
Figure 4. H2O2 tracing in leaves and roots of Paspalum vaginatum via H2DCFDA fluorescent probe. (A) Changes in fluorescence intensity in root tips and leaf mesophyll under control, salt stress (S), and salt stress + DPI (S+DPI) treatments. (B) Effects of DPI inhibition on H2O2 concentration in leaves and roots. Data represent mean ± SE from six biological replicates. For each biological replicate, three technical NMT measurements were performed and averaged before statistical analysis. Significance was determined by one-way ANOVA followed by Duncan's multiple range test; **P < 0.01; ns, non-significant. (C) Drawing a region of interest (ROI) around the target area. Scale bars = 200 μm (leaf, right) and 200 μm (root tip, left).
2. NMT flux analysis (imFluxes V3.0)
a. Import the .csv file containing the H2O2 flux data measured by the H2O2-selective flux microsensor, which was exported from imFluxes V3.0. Verify that the calibration curve has been applied. Set analysis window: exclude the first 60 s and analyze 240 s. Calculate mean flux (pmol cm-2·s-1).
b. Export the processed results as a summary .csv file, including mean flux, standard deviation (SD), and CV for each technical replicate. For each biological replicate, average the three technical replicate values to obtain a single mean flux value. Use these six biological replicate means per treatment for statistical analysis. Accept measurements with CV < 15%.
3. Statistical analysis
a. Import data into SPSS. Check normality (Shapiro-Wilk, P > 0.05).
b. For each treatment, the three technical replicates from each biological replicate are averaged to obtain one mean H2O2 flux value per plant. These biological replicate means (n = 6 per treatment) are analyzed by one-way ANOVA with treatment as the fixed factor, followed by Duncan's multiple range test (P < 0.05).
c. Conduct pairwise comparisons (e.g., S vs. S+DPI) using an independent samples t-test (two-tailed, equal variance assumed).
d. Generate bar graphs (mean ± SE) with individual data points in GraphPad Prism 10: *P < 0.05, **P < 0.01, ***P < 0.001, ****P < 0.0001, ns = not significant (Figure 5). Report F-statistics, degrees of freedom (df), and P-value in figure legends.
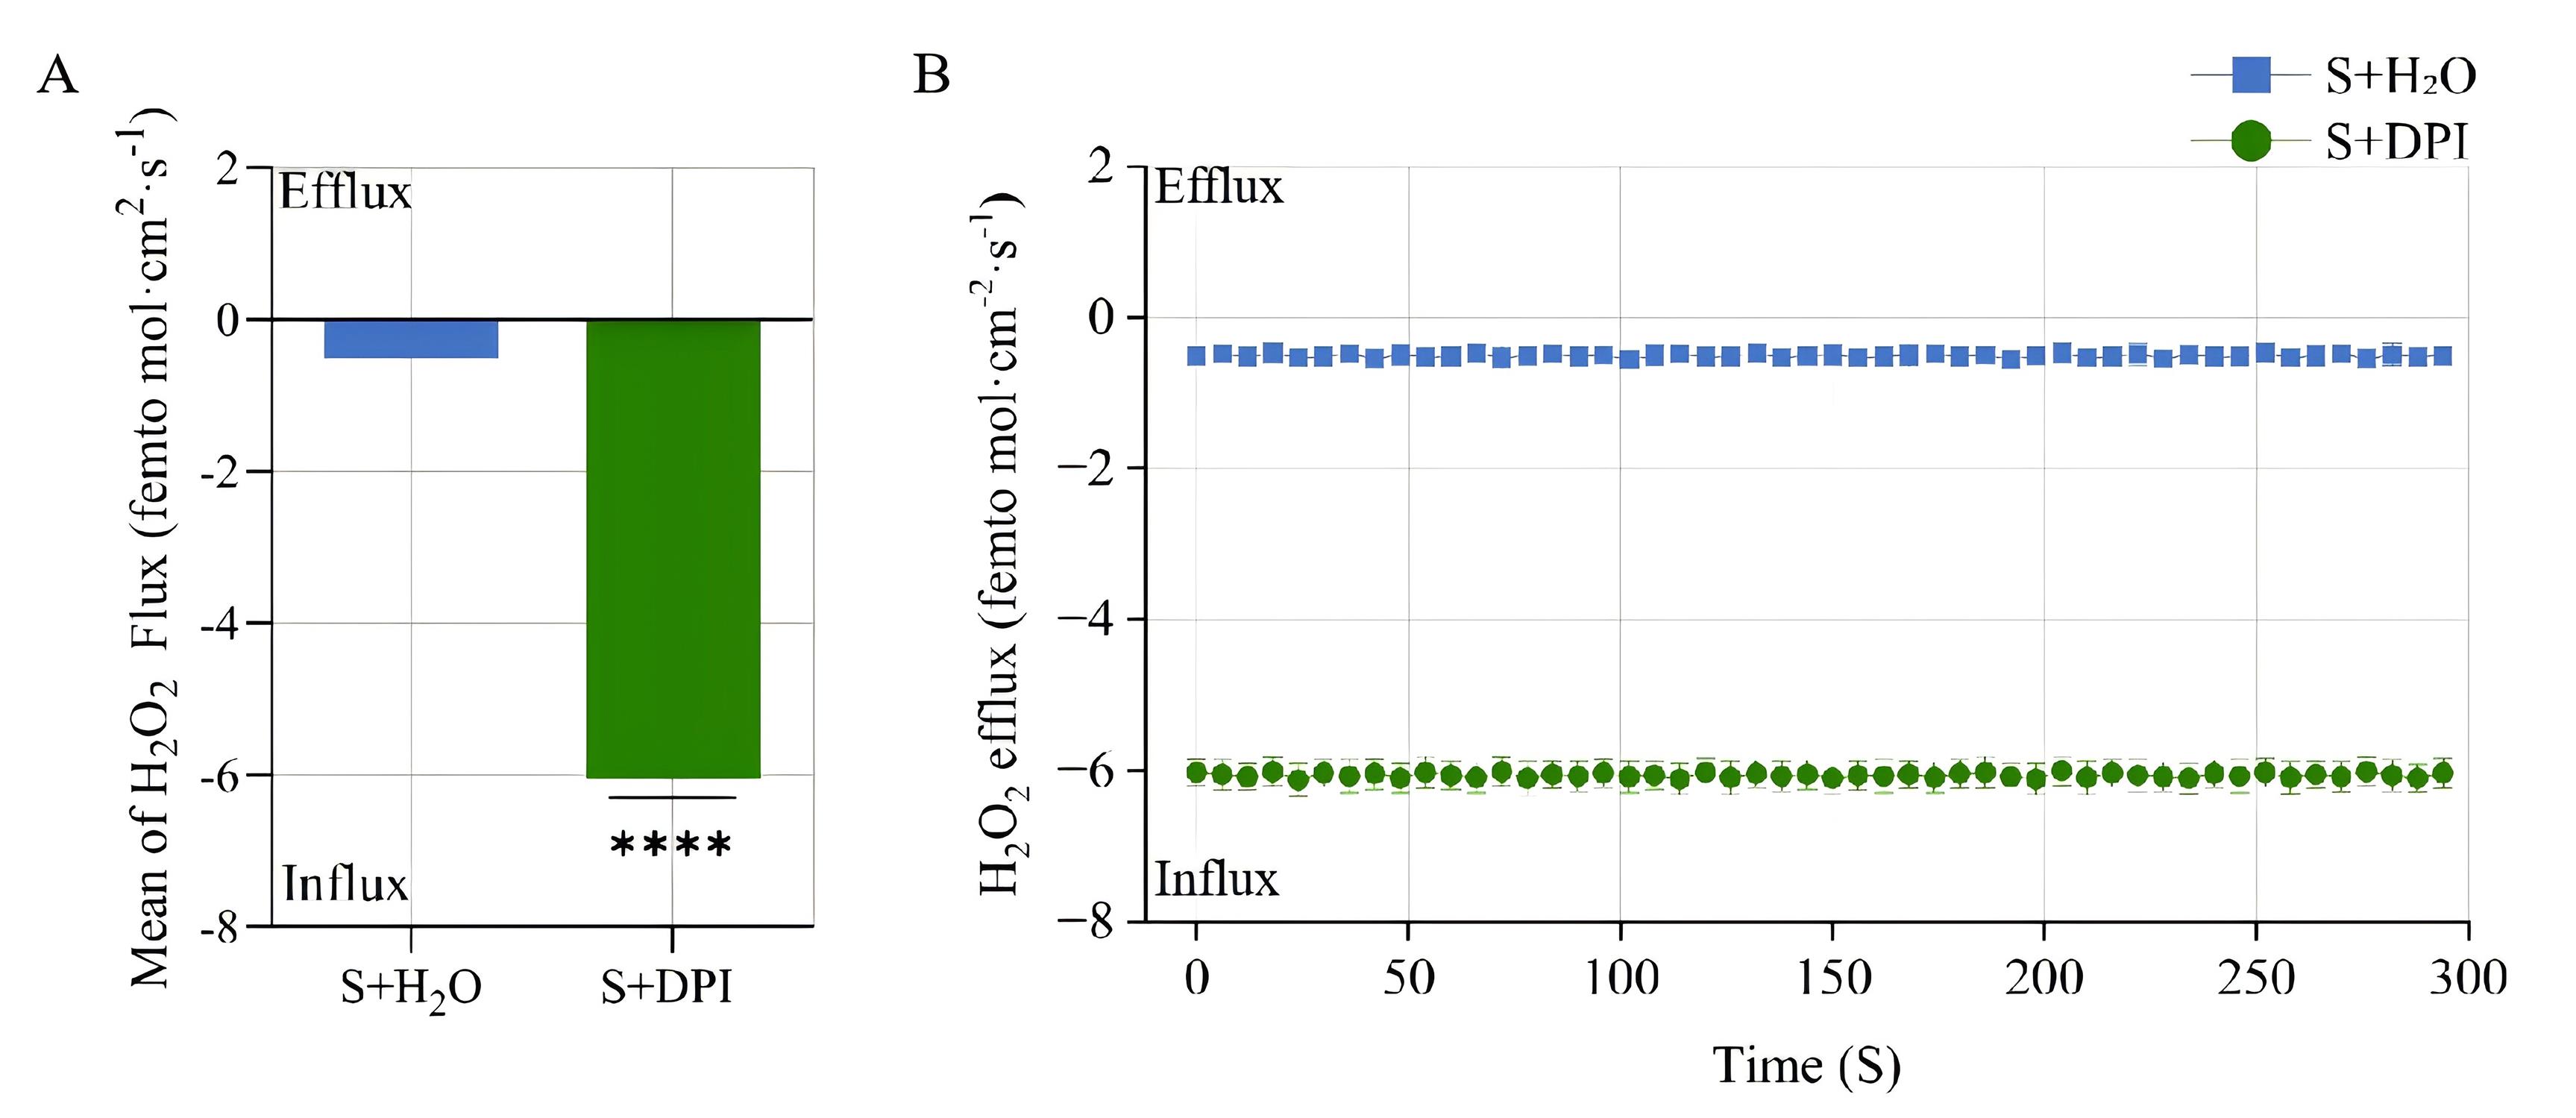
Figure 5. Determination of root-derived H2O2 signal changes in Paspalum vaginatum by non-invasive micro-test technology (NMT). (A) Bar chart of H2O2 flux (pmol cm-2·s-1) under control (C), salt stress (S), and salt stress + DPI (S+DPI) conditions. Data represent mean ± standard error (SE) from six biological replicates. ****P < 0.0001. (B) Line chart showing real-time H2O2 flux recording over a 240-s analysis window. Data represent mean ± SE from six biological replicates. For each biological replicate, three technical NMT measurements were performed and averaged before statistical analysis. Significance was determined by one-way ANOVA followed by Duncan's multiple range test.
Validation of protocol
H2DCFDA fluorescent probe detection of H2O2 signals in leaf stomata and roots after transient heat shock was used to assess whether long-distance H2O2 signaling exists in Paspalum vaginatum (Figure 6).
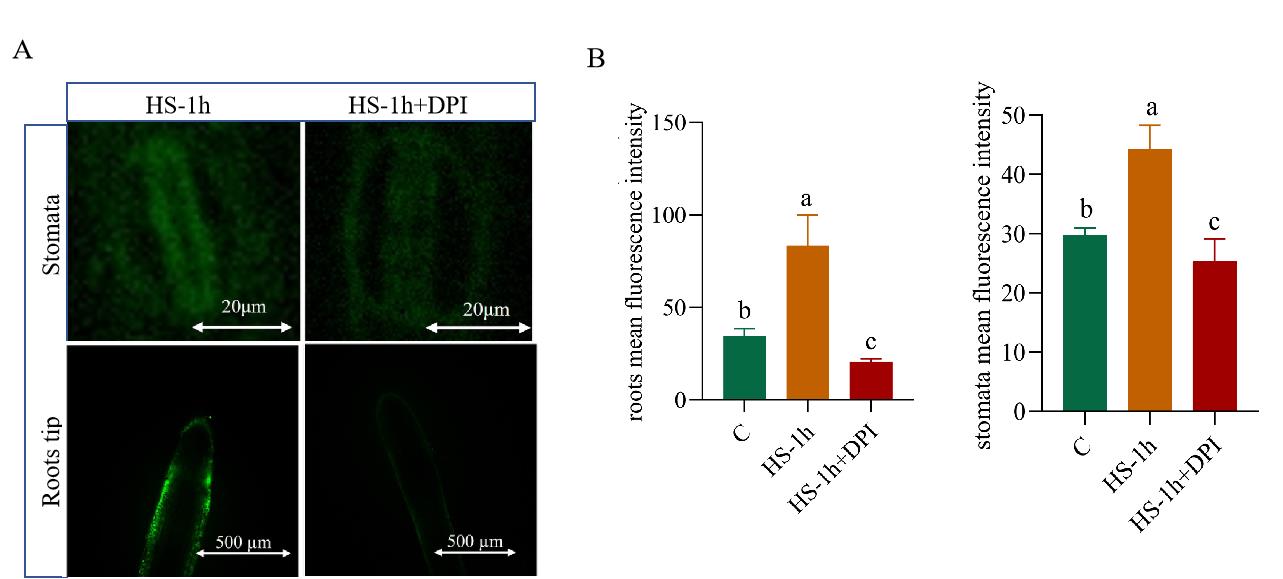
Figure 6. Detection of H2O2 signals in leaf stomata and root tips of Paspalum vaginatum under transient heat shock and DPI treatment. (A) Fluorescence images of H2O2 signals using the H2DCFDA probe in leaf stomata (top row, scale bar = 20 μm) and root tips (bottom row, scale bar = 500 μm) after 1 h of heat shock (HS-1h) and 1 h of heat shock with diphenyleneiodonium chloride (DPI) treatment (HS-1h+DPI). (B) Quantitative analysis of the mean fluorescence intensity of H2O2 in root tips (left) and leaf stomata (right). Data are presented as mean ± SD. Different lowercase letters above the bars indicate significant differences among treatments. Significance: P < 0.05. HS, heat shock; C, control. A total of n = 6 root tips and n = 6 leaf somatic cells (stomatal guard cells) from 10 independent plants were analyzed. Confocal images were acquired, and fluorescence was quantified for individual root tips or individual stomatal guard cells using the scale bars shown in the images.
This protocol or parts of it has been used and validated in the following research article:
• Peng et al. [9]. Investigation of long-distance transmission of root-leaf H2O2 signaling in Paspalum vaginatum based on H2DCFDA labeling and non-invasive micro-test technology (NMT). Journal of Yangzhou University (Agriculture and Life Sciences Edition). CNKI online-first publication, 7 July 2026.
General notes and troubleshooting
Troubleshooting
Problem 1: Weak or no H2DCFDA fluorescence signal.
Possible cause: H2DCFDA stock degraded due to light exposure or repeated freeze/thaw cycles.
Solutions: Prepare fresh stock solution; verify aliquots have not undergone >3 freeze/thaw cycles; perform all steps under dim light.
Problem 2: DPI injection leakage from the stem.
Possible cause: Needle inserted too shallowly or too deeply into the vascular cylinder.
Solutions: Perform the injection under a dissecting microscope. Reduce per-point injection volume to 30 μL and increase to 10 points; ensure needle angle is 30° and depth is 2–3 mm into cortex.
Problem 3: Unstable NMT electrode response.
Possible causes: Electrode tip damaged or calibration drift.
Solutions: Recalibrate electrode; verify R2 > 0.99; replace electrode if response time >10 s or slope deviates >10% from factory specification.
Problem 4: High chloroplast damage rate (>20% Evans blue positive).
Possible causes: Excessive homogenization force or prolonged centrifugation.
Solutions: Reduce pestle strokes to 10; check centrifuge braking setting (use medium deceleration); maintain temperature at 4 °C throughout.
Problem 5: High CV in NMT measurements (>15%).
Possible causes: Uneven chloroplast distribution on membrane or electrode positioning error.
Solutions: Verify uniform chloroplast distribution under the microscope before measurement; reposition the electrode tip to 3 μm above the chloroplast layer.
Acknowledgments
This work was supported by the National Natural Science Foundation of China (Grant No. 32401488). We thank Longfei Zheng [Bapu (Shanghai) Information Sci. & Tech. Co., Ltd.] for technical assistance in the H2O2 flux measurements. This protocol was validated in Peng et al. [9].
Author contributions
Protocol Development, L.P.; Protocol Optimization or Validation, L.P., D.P., and Y.L.; Writing—Original Draft, D.P.; Writing—Review & Editing, D.P. and L.P.; Funding acquisition, L.P.; Supervision, L.P.
Competing interests
The authors declare no competing interests.
Ethical considerations
This protocol does not involve human or animal subjects. All experiments with plants were conducted in accordance with institutional guidelines.
References
- Fichman, Y. and Mittler, R. (2020). Rapid systemic signaling during abiotic and biotic stresses: is the ROS wave master of all trades? Plant J. 102(5): 887–896. https://doi.org/10.1111/tpj.14685
- Mittler, R., Zandalinas, S. I., Fichman, Y. and Van Breusegem, F. (2022). Reactive oxygen species signalling in plant stress responses. Nat Rev Mol Cell Biol. 23(10): 663–679. https://doi.org/10.1038/s41580-022-00499-2
- Liu, Y. and He, C. (2016). Regulation of plant reactive oxygen species (ROS) in stress responses: learning from AtRBOHD. Plant Cell Rep. 35(5): 995–1007. https://doi.org/10.1007/s00299-016-1950-x
- Wang, Y., Wu, X., Sun, Q., Lu, W., Ren, Z., Wang, Z. Y. and Wu, X. (2026). Genome-Wide Identification and Transcriptomic Analysis of MYB Transcription Factors in Seashore Paspalum Under Salt Stress. Int J Mol Sci. 27(2): 1068. https://doi.org/10.3390/ijms27021068
- Pan, L., Cai, L., Lu, Y. and Peng, D. (2025). Genome-wide identification and expression analysis Pvrboh genes reveal their potential roles in salt tolerance and calcium signaling. Plant Cell Physiol. 67(1): 8–19. https://doi.org/10.1093/pcp/pcaf115
- Pan, L., Xu, T., Wang, J., Zhao, J., Sun, Q., Hu, X., Tao, X., Zhang, J., Liao, L., Wang, Z., et al. (2025). Root-sourced H2O2 is essential for maintaining jasmonic acid and Na+/K+ homeostasis to delay leaf senescence during salt stress in Paspalum vaginatum. Hortic Plant J. 11(3): 1364–1376. https://doi.org/10.1016/j.hpj.2024.04.009
- Kristiansen, K. A., Jensen, P. E., Møller, I. M. and Schulz, A. (2009). Monitoring reactive oxygen species formation and localisation in living cells by use of the fluorescent probe CM‐H2DCFDA and confocal laser microscopy. Physiol Plant. 136(4): 369–383. https://doi.org/10.1111/j.1399-3054.2009.01243.x
- Sun, K., Liu, Y., Pan, Y., Di, D., Li, J., Xu, F., Li, L., Mimata, Y., Chen, Y., Xie, L., et al. (2025). Non-invasive micro-test technology and applications. Biophys Rep. 11(2): 96. https://doi.org/10.52601/bpr.2024.240009
- Peng D., Tang Q., Lu Y., et al. (2026). Investigation of long-distance transmission of root-leaf H2O2 signaling in Paspalum vaginatum based on H2DCFDA labeling and non-invasive micro-test technology (NMT). J Yangzhou Univ Agric Life Sci Ed. Epub ahead of print 7 July 2026. https://link.cnki.net/urlid/32.1648.s.20260706.1655.004
Article Information
Publication history
Received: Jul 16, 2026
Accepted: Oct 2, 2026
Available online: Nov 18, 2026
Published: Nov 20, 2026
Copyright
© 2026 The Author(s); This is an open access article under the CC BY license (https://creativecommons.org/licenses/by/4.0/).
How to cite
Peng, D., Tang, Q., Lu, Y., Huang, X., Bao, Y., Liu, Y. and Pan, L. (2026). H2DCFDA Fluorescent Tracing and NMT for Real-Time Detection of Long-Distance H2O2 Signaling in Paspalum vaginatum. Bio-protocol 16(22): e5886. DOI: 10.21769/BioProtoc.5886.

 Download Citation in RIS Format
Category
Plant Science > Plant physiology > Metabolism
Plant Science > Plant physiology > Abiotic stress
Biochemistry > Other compound
Do you have any questions about this protocol?
Post your question to gather feedback from the community. We will also invite the authors of this article to respond.
 Post a Question


