


- Protocols

- Articles and Issues
- For Authors
- About
- Become a Reviewer


Time-Course Analysis of Polyploidy Dynamics in TPA-Induced MEG-01 Cells

Published: Vol 16, Iss 22, Nov 20, 2026 DOI: 10.21769/BioProtoc.5882 Views: 34
Reviewed by: Alexander DupuyGiovanni de NolaNikhil Mittal
 PDF
 Ask a question

Original research article
The authors used this protocol in:

Apr 2026

Protocol Collections
Comprehensive collections of detailed, peer-reviewed protocols focusing on specific topics



Abstract
Megakaryocyte (MK) polyploidization is a dynamic process regulated by cell cycle regulators, endoreplication switches, survival signals, and cytoskeletal rearrangements. Conventional single-time-point assays [e.g., ploidy measurement at day 3 or 5 after 12-O-tetradecanoylphorbol-13-acetate (TPA) induction] capture only one stage of this process and may miss stage-specific or transient changes. To provide a more complete view, we developed a time-course protocol that measures ploidy at sequential time points (days 0, 1, 5, 7, and 9) post-TPA treatment in MEG-01 cells. This approach adds temporal information to standard ploidy analysis and can help indicate when a regulatory factor acts, during initiation, progression, or the final stage of polyploidization. Comparing multiple time points may also help distinguish consistent trends from variability restricted to specific windows and can suggest candidate regulatory nodes. Collectively, our protocol provides a practical framework for studying the temporal regulation of MK differentiation and other endoreplication-related processes.
Key features
• Monitor ploidy trajectories across multiple points to assess stage-specific gene function.
• Compare trends across multiple time points to help distinguish consistent effects from time-window-specific variability.
• Identify transient or stage-specific differentiation changes that may point to candidate regulatory nodes.
Keywords: Flow cytometry Polyploidy
Megakaryocytes
TPA
Cell differentiation
Graphical overview
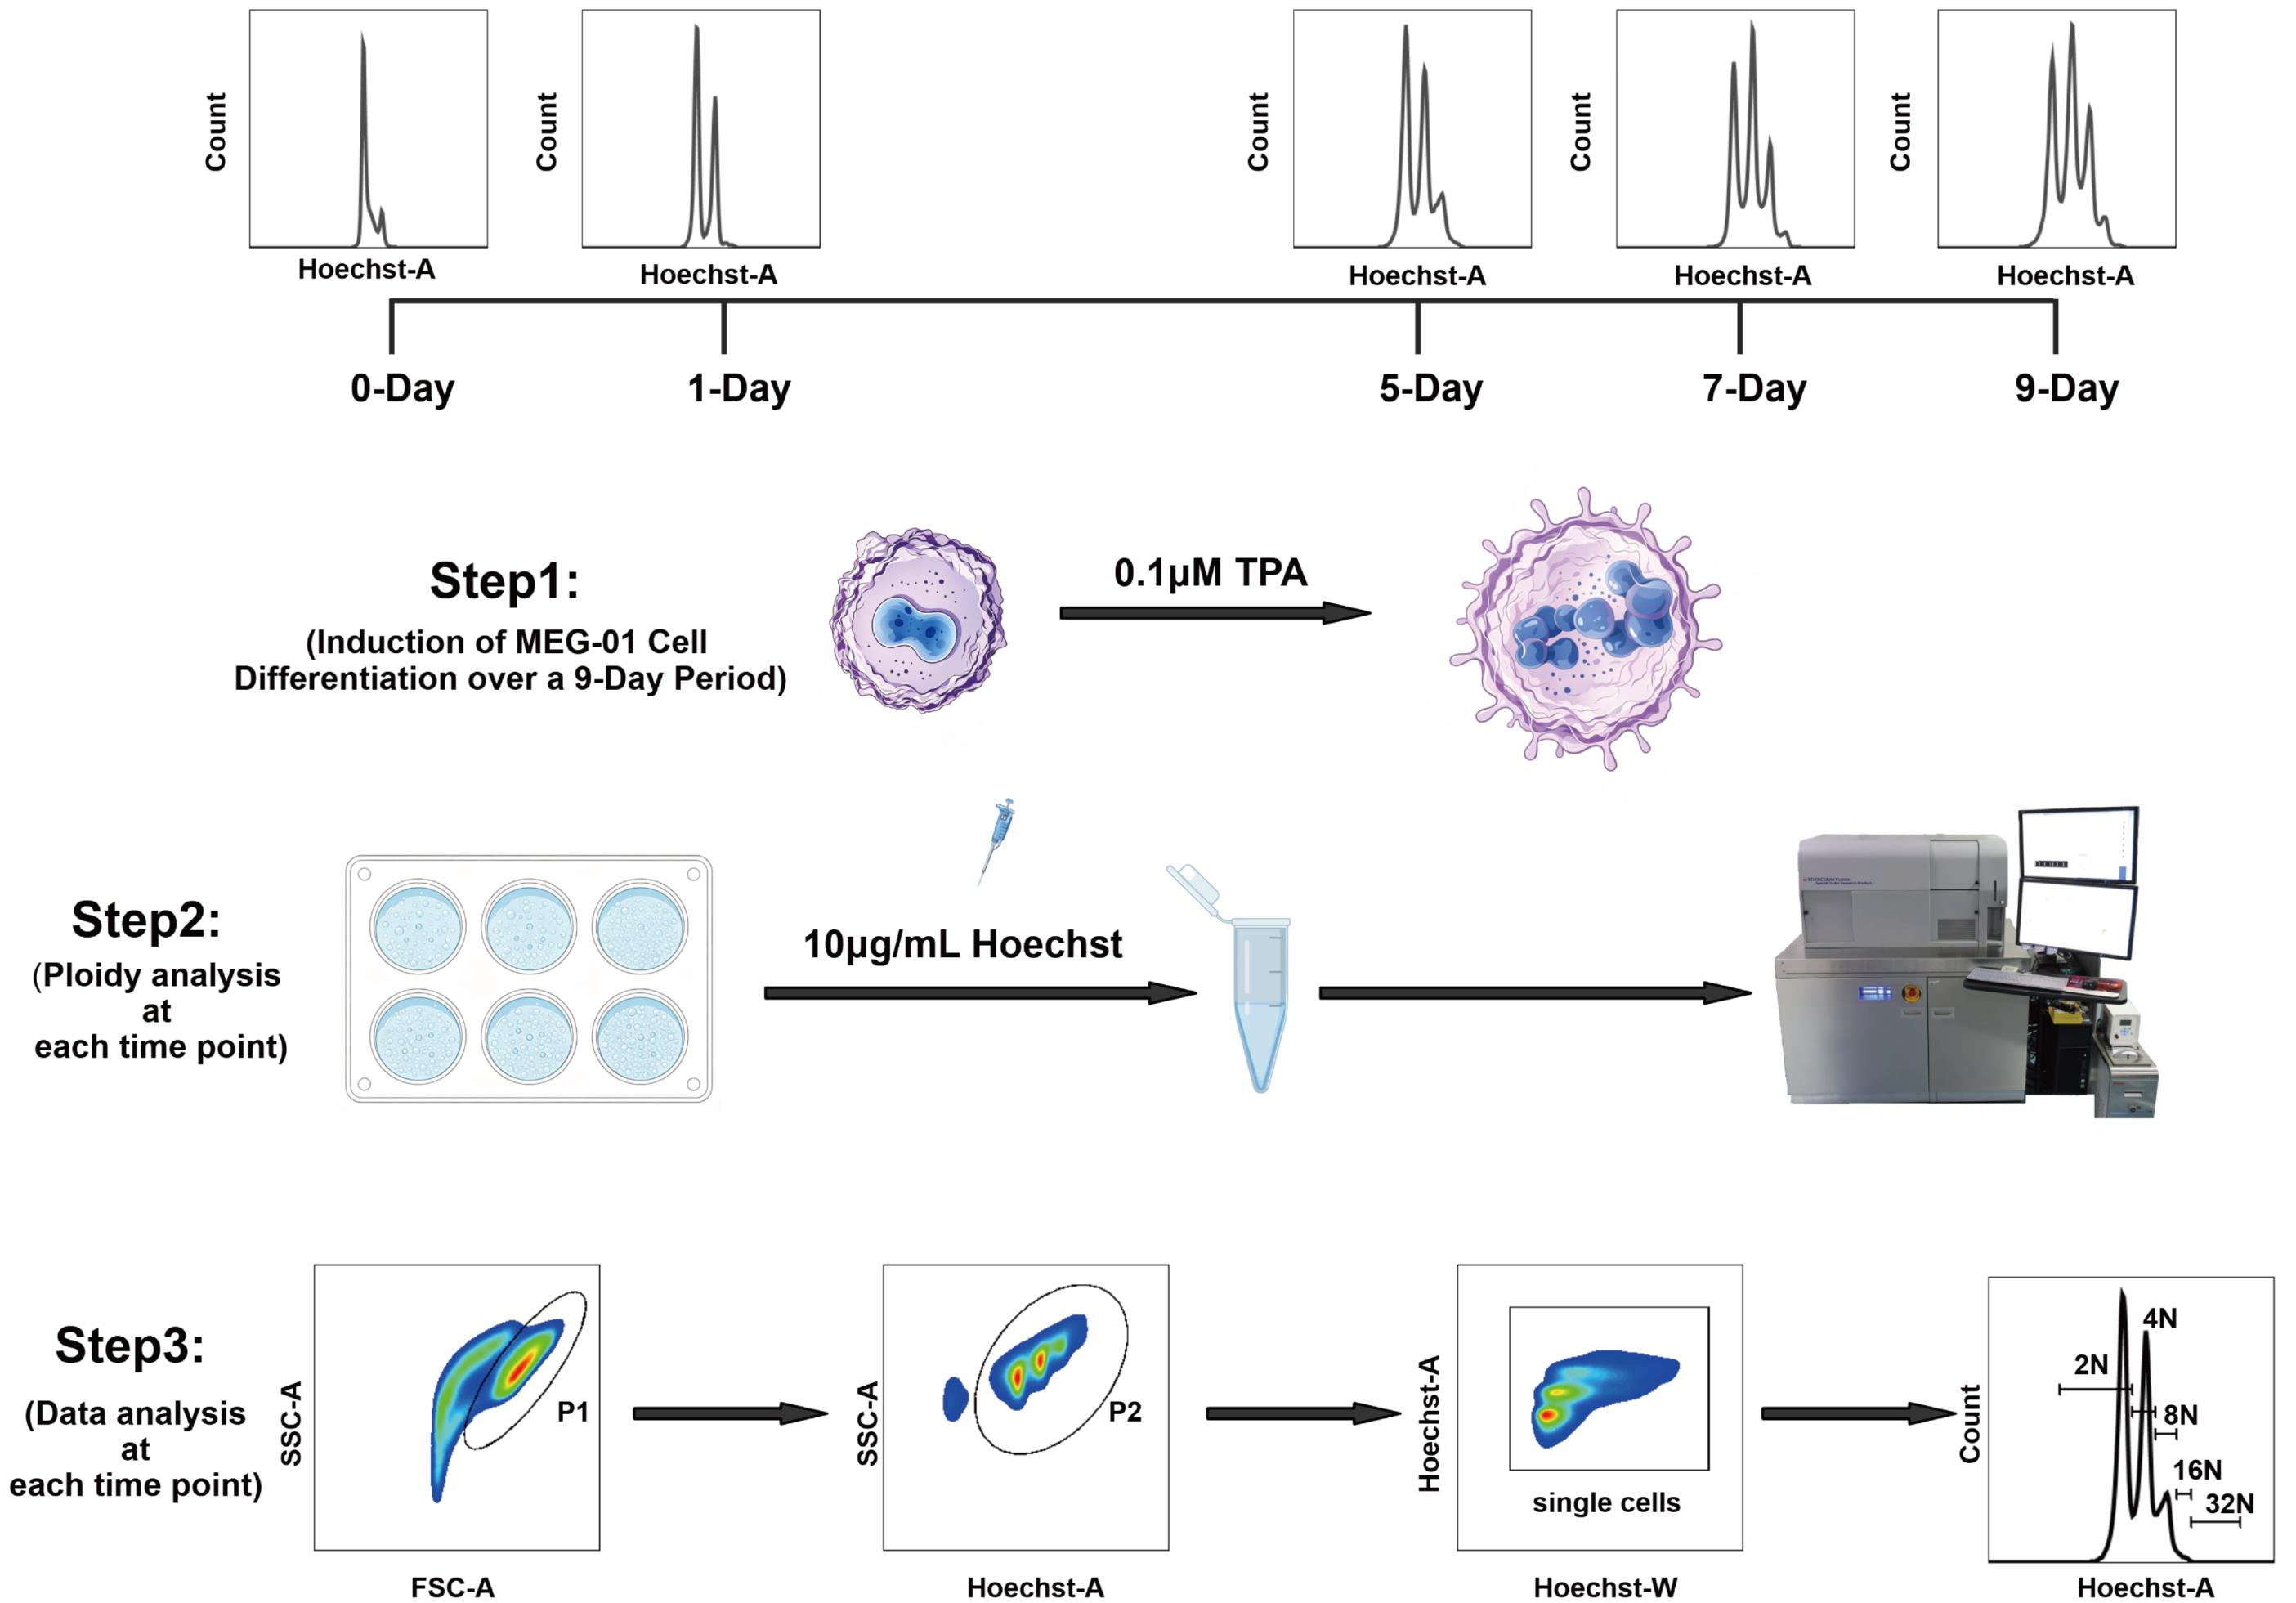
Schematic overview of time-course analysis of polyploidy dynamics in MEG-01 cells. MEG-01 cells were induced with 0.1 μM TPA and harvested at days 0, 1, 5, 7, and 9. Cells were stained with Hoechst 33342 (10 μg/mL) and analyzed by flow cytometry. Ploidy was determined via Hoechst staining. Cells were first gated on forward scatter area (FSC-A) vs. side scatter area (SSC-A) to exclude debris, followed by gating on SSC-A vs. Hoechst-A to exclude debris; singlet gating was then set on the Hoechst-A vs. Hoechst-W plot. Subsequently, the ploidy status was analyzed from the Hoechst-A fluorescence histogram within the singlet gate, resolving peaks corresponding to 2N, 4N, 8N, 16N, and 32N populations.
Background
Megakaryocyte (MK) polyploidization is essential for MK maturation and platelet production. Unlike typical cell division, it is not a one-time event but a dynamic, multistage process controlled by a network of molecular regulators, including cell cycle modulators, endoreplication switch factors, survival signaling pathways, and cytoskeletal rearrangements. Different regulators can act at distinct stages: initiating the mitosis-to-endoreplication switch, promoting endoreplicative cycles, or determining the final ploidy level [1,2].
Conventionally, MK polyploidization is assessed by ploidy measurement at a single endpoint, often day 3 or 5 post-12-O-tetradecanoylphorbol-13-acetate (TPA) treatment. Such endpoint measurements provide limited temporal information and may not capture stage-specific gene functions or regulatory dynamics. To complement this approach, we developed a time-course analysis of ploidy dynamics in MEG-01 cells, a widely used megakaryoblastic cell line [3]. Ploidy is measured at multiple time points—days 0, 1, 5, 7, and 9—following TPA induction. By adding temporal resolution to conventional ploidy analysis, our protocol can provide a more detailed view of MK polyploidization. It can also be adapted to other endoreplicating cell systems, offering a flexible approach for cell biology research.
Materials and reagents
Biological materials
1. MEG-01 (ATCC, catalog number: CRL-2021)
Reagents
1. RPMI-1640 medium (Hyclone, catalog number: SH.30809.01)
2. Fetal bovine serum (FBS) (Gibco, catalog number: 16000044)
3. Penicillin-streptomycin (100×, 10,000 U/mL) (Gibco, catalog number: 15140122)
4. Phosphate buffered saline (PBS) (Cytiva HyClone, catalog number: SH30256.FS)
5. Trypsin-EDTA (0.25%), phenol red (Gibco, catalog number: 25200072)
6. 12-O-tetradecanoylphorbol-13-acetate (TPA) (Cell Signaling Technology, catalog number: 4174)
7. Hoechst 33342 (Thermo Fisher Scientific, catalog number: 62249)
8. Dimethyl sulfoxide (DMSO) (Sigma-Aldrich, catalog number: D2650)
9. Modified Dulbecco’s PBS (DPBS) (Thermo Fisher Scientific, catalog number: 28374)
Solutions
1. RPMI-1640 complete medium (see Recipes)
2. TPA-induced differentiation medium (see Recipes)
3. Hoechst staining medium (see Recipes)
4. TPA + Hoechst co-incubation medium (see Recipes)
Recipes
1. RPMI-1640 complete medium
| Reagent | Proportion (% v/v) | Quantity or volume |
|---|---|---|
| RPMI-1640 medium | 89% | 44.5 mL |
| FBS | 10% | 5 mL |
| Penicillin-Streptomycin (100×) | 1% | 500 μL |
| Total | 100% | 50 mL |
2. TPA-induced differentiation medium
| Reagent | Final concentration | Quantity or volume |
|---|---|---|
| RPMI-1640 complete medium | base | quantum sufficit (q.s.) to 50 mL |
| TPA (200 μM stock in DMSO) | 0.1 μM | 25 μL |
| Total | 50 mL |
TPA is supplied as a 1 mg powder. Store at -20 °C. Before use, dissolve powder in 1 mL of DMSO to yield a 1.6 mM stock solution. For the working concentration of 200 μM, add 125 μL of stock solution to 875 μL of DMSO. Store in solution at -20 °C, desiccated. Protect from light. In lyophilized form, the chemical is stable for 24 months. Once in solution, use within 3 months to prevent loss of potency. Aliquot to avoid multiple freeze/thaw cycles.
Prepare TPA-induced differentiation medium fresh prior to use. Protect TPA from light and avoid repeated freeze/thaw cycles.
3. Hoechst staining medium
| Reagent | Final concentration | Quantity or volume |
|---|---|---|
| RPMI-1640 complete medium | base | q.s. to 1 mL |
| Hoechst 33342 (1 mg/mL stock in DPBS) | 10 μg/mL | 10 μL |
| Total | 1 mL |
Hoechst 33342 is supplied as an aqueous solution at 12.3 mg/mL (20 mM). Hoechst stock solution may be stored at 2–6 °C for up to 6 months or at ≤-20 °C for longer periods, protected from light. Before use, dilute it in DPBS to 1 mg/mL Hoechst 33342 intermediate stock solution; for the preparation method, refer to the manufacturer’s instructions.
Prepare fresh prior to use. Protect from light during incubation.
4. TPA + Hoechst co-incubation medium
| Reagent | Final concentration | Quantity or volume |
|---|---|---|
| RPMI-1640 complete medium | base | q.s. to 1 mL |
| TPA (200 μM stock in DMSO) | 0.1 μM | 5 μL |
| Hoechst 33342 (1 mg/mL stock in DPBS) | 10 μg/mL | 10 μL |
| Total | 1 mL |
Prepare fresh prior to use. Protect from light during incubation.
Laboratory supplies
1. 60 mm TC-treated culture dish (CORNING, catalog number: 430166)
2. Cell culture multi-well plates (6-well plate) (CORNING, catalog number: 3516)
3. 1.5 mL microcentrifuge tubes (CORNING, catalog number: MCT-150-C)
4. 15 mL centrifuge tubes (CORNING, catalog number: 430791)
5. 50 mL centrifuge tubes (CORNING, catalog number: 430829)
6. BD FACSAria fusion cell sorter (85 μm nozzle) (BD Biosciences, catalog number: 647340)
7. Olympus Cell Counter Model R1 counting slide (Olympus, catalog number: R1-SLI)
8. 100 μm nylon cell strainer (FALCON, catalog number: 352360)
Equipment
1. Heracell VIOS 160i CO2 Incubator (Thermo Fisher Scientific, catalog number: 51033565)
2. Thermo Scientific 1300 Series A2 Class II Biological Safety Cabinet (Thermo Fisher Scientific, catalog number: 1356)
3. Benchtop Low-Speed Centrifuge L500-A (Xiangyi, catalog number: 0205209000)
4. Eppendorf Centrifuge 5810 R (Eppendorf, catalog number: 5811000061)
5. Olympus Cell Counter Model R1 (Olympus, catalog number: K23009240-12)
6. Nikon H550S Light Microscope (Nikon, Japan, catalog number: H550S)
7. BD FACSAria Fusion Cell Sorter (BD, catalog number/model: 656700)
8. Thermostatic water bath (Jiaxing Junsi Electronics Co., Ltd., catalog number/model: HH-1)
Software and datasets
1. FlowJo software (BD Biosciences, version 10.8.1)
Procedure
A. MEG-01 cell culture
1. Plate MEG-01 cells on a 60-mm culture dish in 5 mL/dish of RPMI-1640 complete medium (see Recipe 1) and expand according to the standard protocol (see Recipe 1).
Note: Following thawing and recovery, cells are subcultured for at least two passages before the experiments are initiated.
2. Examine cell distribution under a light microscope and incubate at 37 °C with 5% CO2 until reaching 70%–100% confluence or a density of 5 × 10⁵~7 × 10⁵ cells/cm2.
B. Day 0: Baseline ploidy detection (undifferentiated cells)
1. On day 0, seed MEG-01 cells into 6-well plates at a density of 5 × 10⁴ cells/well in 2 mL/well of RPMI-1640 complete medium (see Recipe 1). For the differentiation time-course study, seed cells in TPA-induced differentiation medium (see Recipe 2) into replicate wells for each time point (days 1, 5, 7, and 9) to enable parallel analyses.
Note: Three or four replicates (separate wells from the same culture) are recommended.
2. Examine cell distribution under the light microscope and incubate at 37 °C with 5% CO2.
3. Replace the medium with 2 mL/well of prewarmed (37 °C) Hoechst staining medium (see Recipe 3) and incubate at 37 °C with 5% CO2 for 1 h in the dark.
4. Gently flush along the sides of the well to detach cells, then transfer the cell suspension to a 1.5 mL microcentrifuge tube.
5. Centrifuge at 800× g for 5 min at 4 °C.
6. Aspirate the supernatant.
7. Add 500 μL of ice-cold PBS (1×) and gently pipette up and down to resuspend the pellet.
8. Centrifuge at 800× g for 5 min at 4 °C.
9. Aspirate the supernatant.
10. Add 200 μL of ice-cold PBS (1×) and gently pipette up and down to resuspend the pellet.
11. Filter the cell suspension through a 100-μm strainer to remove clumps that may interfere with detection.
12. Proceed to flow cytometry analysis (common procedure for all time points), as follows: Using a BD FACS Aria Fusion cell sorter equipped with an 85 μm nozzle, with sample agitation of 300 rpm, sample temperature of 4 °C, a 355 nm laser (laser power: 50 mW), and collecting at least 20,000 single cells per sample.
13. Use the following sequential gating strategy: (i) on an FSC-A vs. SSC-A plot, gate on the cell population (exclude debris); (ii) on an SSC-A vs. Hoechst-A plot, gate on the Hoechst+ population (exclude debris); (iii) the Hoechst-A vs. Hoechst-W plot is used for custom singlet gating to exclude doublets and aggregates; (iv) on a Count vs. Hoechst-A plot, analyze the nuclear ploidy distribution.
14. For calculation of ploidy distribution percentages, refer to the Data Analysis section below.
Note: On day 0, MEG-01 cells remain in suspension without adhering to the culture surface. They are collected directly by centrifugation without trypsinization.
C. Day 1 and subsequent time points: Differentiation and ploidy detection
1. At each designated time point (days 1, 5, 7, and 9), replace the culture medium with 2 mL/well of prewarmed (37 °C) Hoechst + TPA co-incubation medium (see Recipe 4) and incubate at 37 °C with 5% CO2 for 1 h in the dark.
2. Aspirate the medium and add 500 μL/well of Trypsin-EDTA (0.25%) with phenol red. Incubate at 37 °C with 5% CO2 for 2 min.
3. Add 500 μL/well of TPA-induced differentiation medium to neutralize the trypsin.
4. Gently flush along the sides of each well to detach remaining cells, then transfer the cell suspension to a 1.5 mL microcentrifuge tube.
5. Centrifuge at 800× g for 5 min at 4 °C.
6. Aspirate the supernatant.
7. Add 500 μL of ice-cold PBS (1×) and gently pipette up and down to resuspend the pellet.
8. Centrifuge at 800× g for 5 min at 4 °C.
9. Aspirate the supernatant.
10. Add 200 μL of ice-cold PBS (1×) and gently pipette up and down to resuspend the pellet.
11. Filter the cell suspension through a 100-μm strainer to remove clumps that may interfere with detection.
12. Then, proceed with flow cytometric analysis as described in steps B11–13.
Note: From day 1 onward, TPA-induced differentiation causes MEG-01 cells to adhere to the culture surface. Therefore, trypsinization is required to harvest cells. The culture medium is replaced with 2 mL/well of fresh TPA-induced differentiation medium (see Recipe 2) every two days throughout the time-course experiment.
Data analysis
A. Nuclear ploidy analysis by flow cytometry
Flow cytometry data were analyzed using FlowJo software (v10.8.1). Events were gated sequentially to obtain a clean and comparable population for ploidy quantification:
(i) Cell population gating: Cells were identified on an FSC-A vs. SSC-A plot to exclude debris and non-cellular events.
(ii) Hoechst+ cell population gating: Hoechst+ cells were selected on an SSC-A vs. Hoechst-A plot to remove debris.
(iii) Custom singlet gating: A custom gating strategy was used to exclude doublets and cell aggregates; events were selected on a Hoechst-A vs. Hoechst-W plot. This custom Hoechst-A vs. Hoechst-W gating strategy was specifically adopted for the present study and should not be regarded as the conventional singlet-gating method.
(iv) Ploidy distribution analysis: Hoechst fluorescence intensity (Hoechst-A) was used to resolve nuclear ploidy distribution.
The percentage of cells within each ploidy peak (2N, 4N, 8N, 16N, and ≥32N) was determined from the Hoechst-A histogram. All samples were acquired using identical photomultiplier tube (PMT) voltages and instrument settings to ensure comparability across different time points (Figure 1).
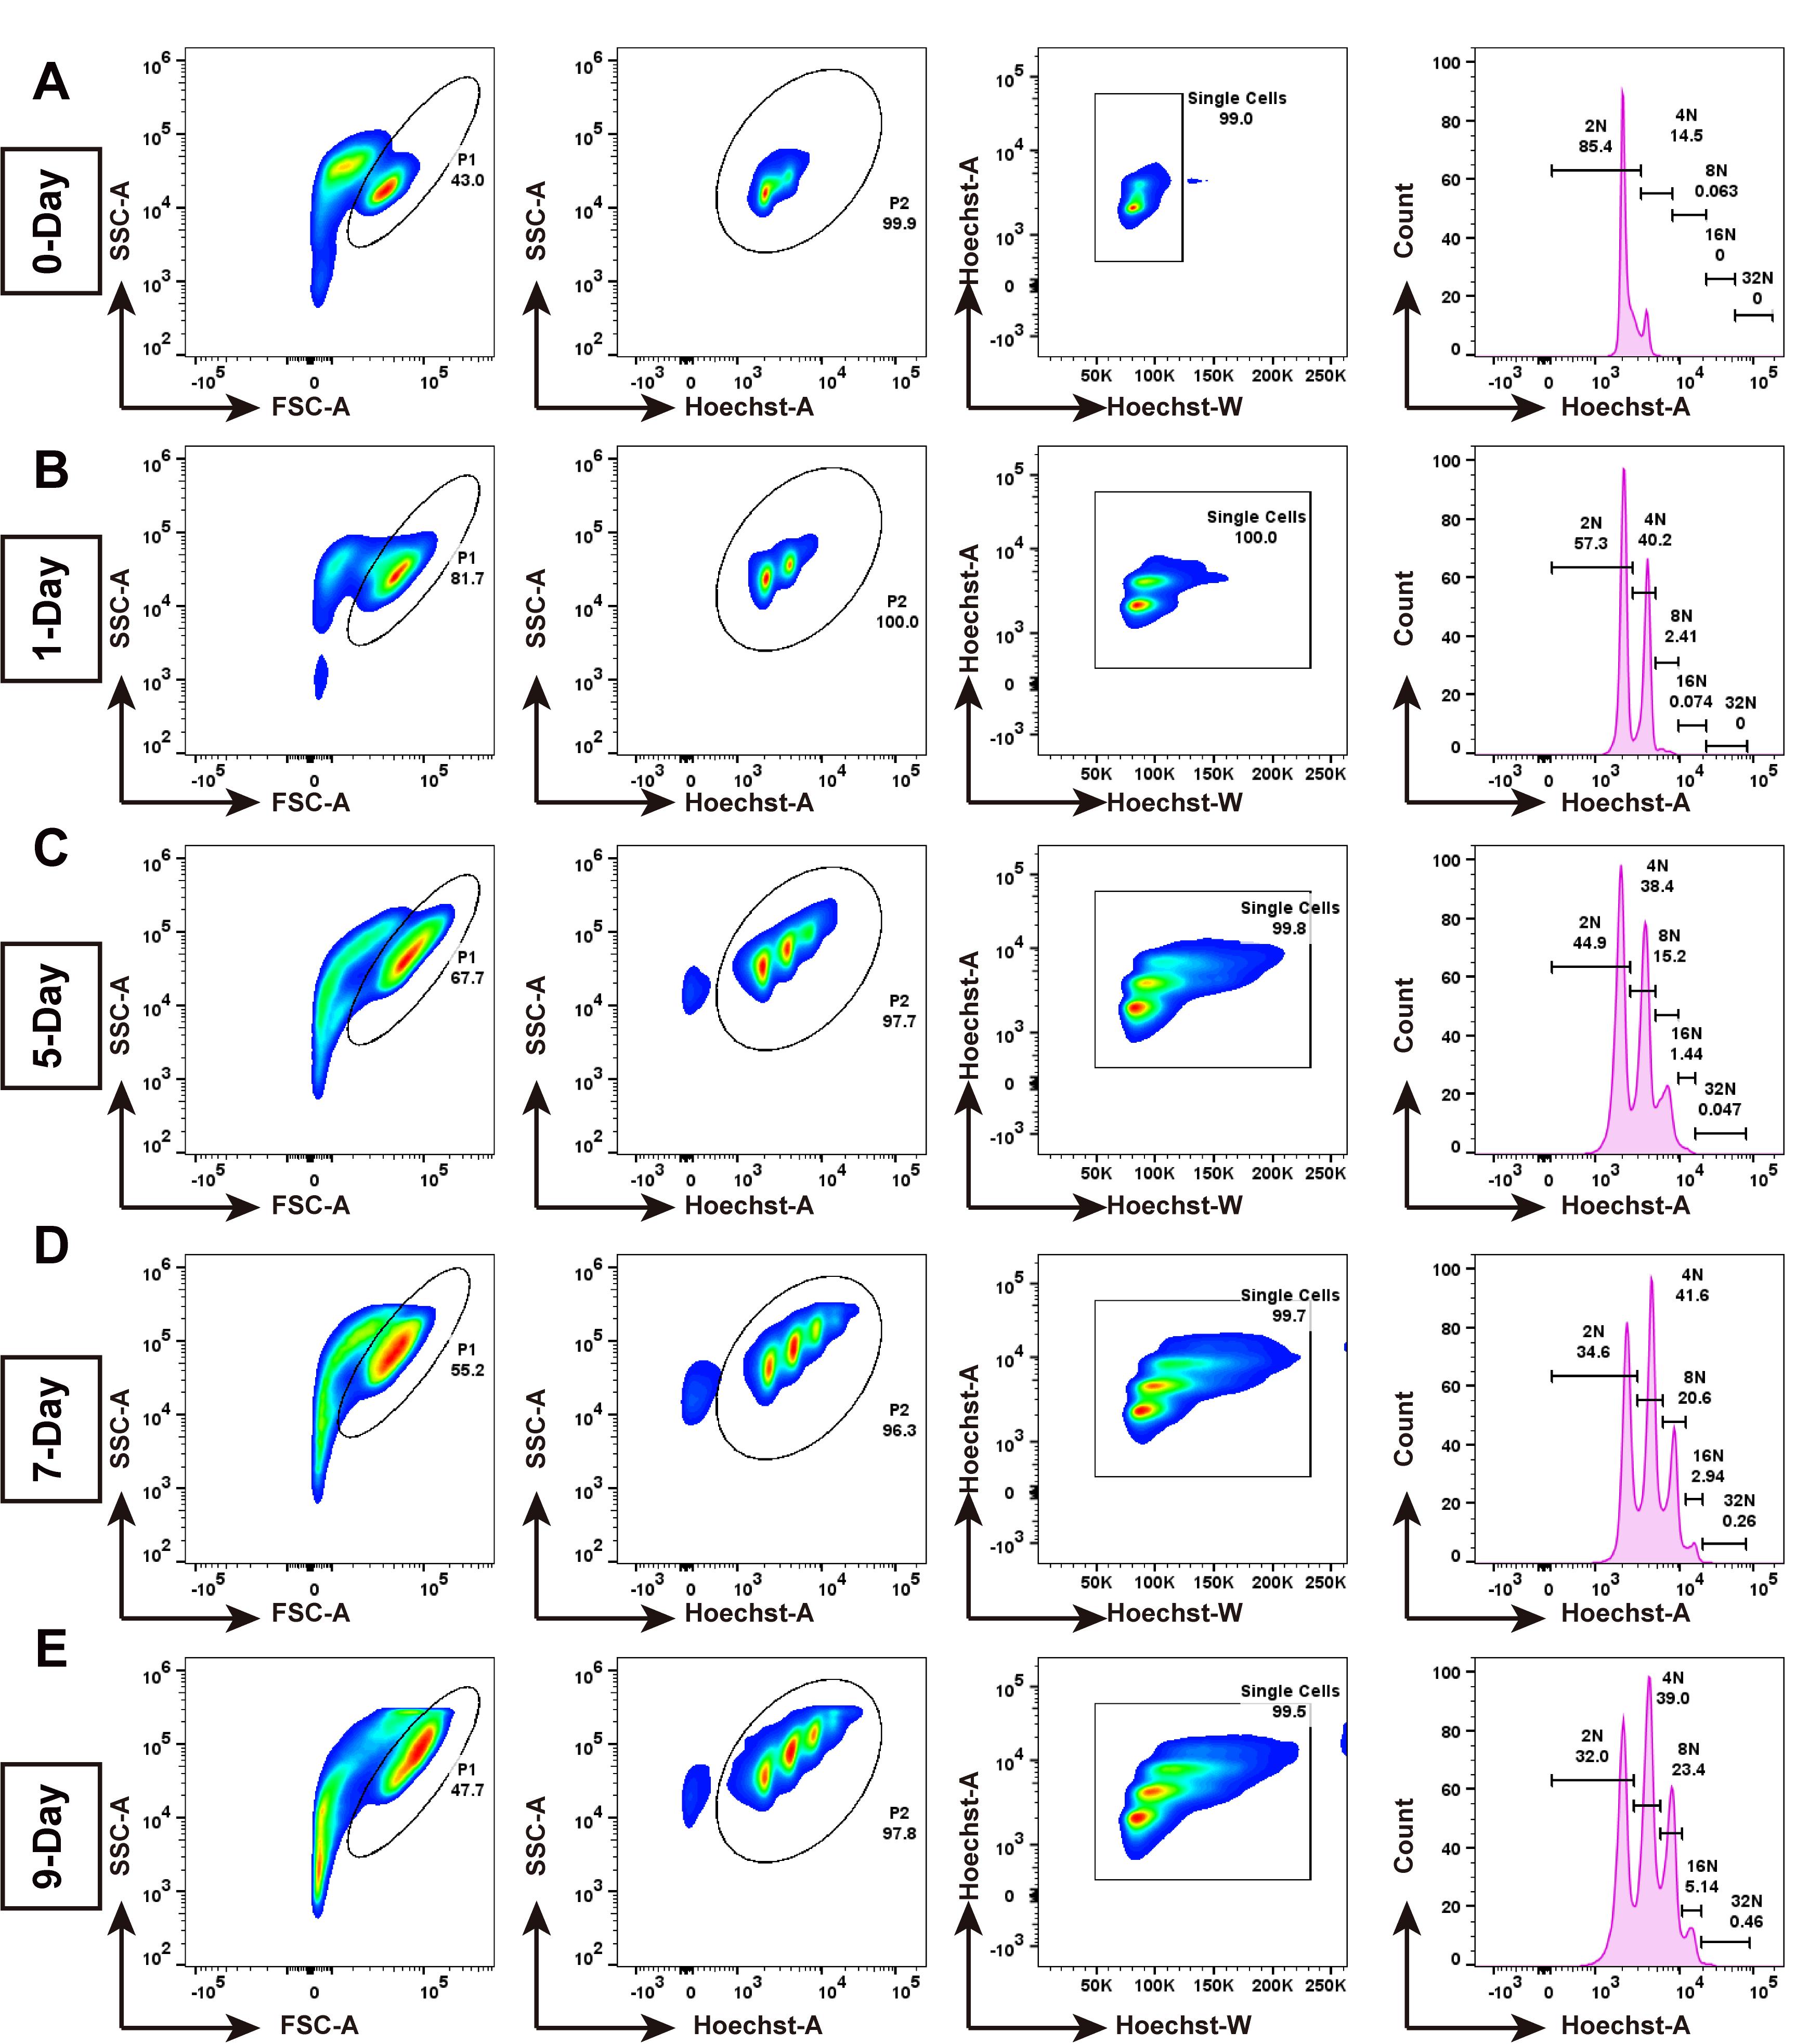
Figure 1. Representative gating strategy and Hoechst-based DNA ploidy histograms of MEG-01 cells at 0, 1, 5, 7, and 9 days post-TPA induction. (A) Day 0 (undifferentiated): cells were first gated on FSC-A vs. SSC-A to exclude debris (43.0% of total events); debris gating on the SSC-A vs. Hoechst-A plot, which accounted for 99.9% of the events within the “Hoechst+ cells” gate; representative Hoechst-A vs. Hoechst-W plot showing the custom gating strategy used for singlet gate selection in this study, which accounted for 99.0% of the events. Hoechst fluorescence histogram resolved populations corresponding to 2N (85.4%), 4N (14.5%), 8N (0.063%), 16N (0.0%), and 32N (0.0%). (B) Day 1: 81.7% of total events; debris exclusion: 100.0% of events within “Hoechst+ cells” gate; singlet gating: 100% of events within “cells” gate; ploidy distribution: 2N (57.3%), 4N (40.2%), 8N (2.41%), 16N (0.074%), and 32N (0.0%). (C) Day 5: Debris exclusion: 67.7% of total events; debris exclusion: 97.7% of events within “Hoechst+ cells” gate; singlet gating: 99.8% of events within “cells” gate; ploidy distribution: 2N (44.9%), 4N (38.4%), 8N (15.2%), 16N (1.44%), and 32N (0.047%). (D) Day 7: Debris exclusion: 55.2% of total events; debris exclusion: 96.3% of events within “Hoechst+ cells” gate; singlet gating: 99.7% of events within “cells” gate; ploidy distribution: 2N (34.6%), 4N (41.6%), 8N (20.6%), 16N (2.94%), and 32N (0.26%). (E) Day 9: Debris exclusion: 47.7% of total events; debris exclusion: 97.8% of events within “Hoechst+ cells” gate; singlet gating: 99.5% of events within “cells” gate; ploidy distribution: 2N (32.0%), 4N (39.0%), 8N (23.4%), 16N (5.14%), and 32N (0.46%). In the last panel of all lines, the y-axis counts all represent counts normalized to the total count for each sample.
B. Statistical analysis of polyploidization data
The mean ploidy of MEG-01 cells at each time point was calculated using the following formula: (2N × the number of cells at the 2N ploidy level + 4N × the number of cells at the 4N ploidy level +... + 64N × the number of cells at the 64N ploidy level) / the total number of cells (sum of all ploidy gates) (Figure 2).
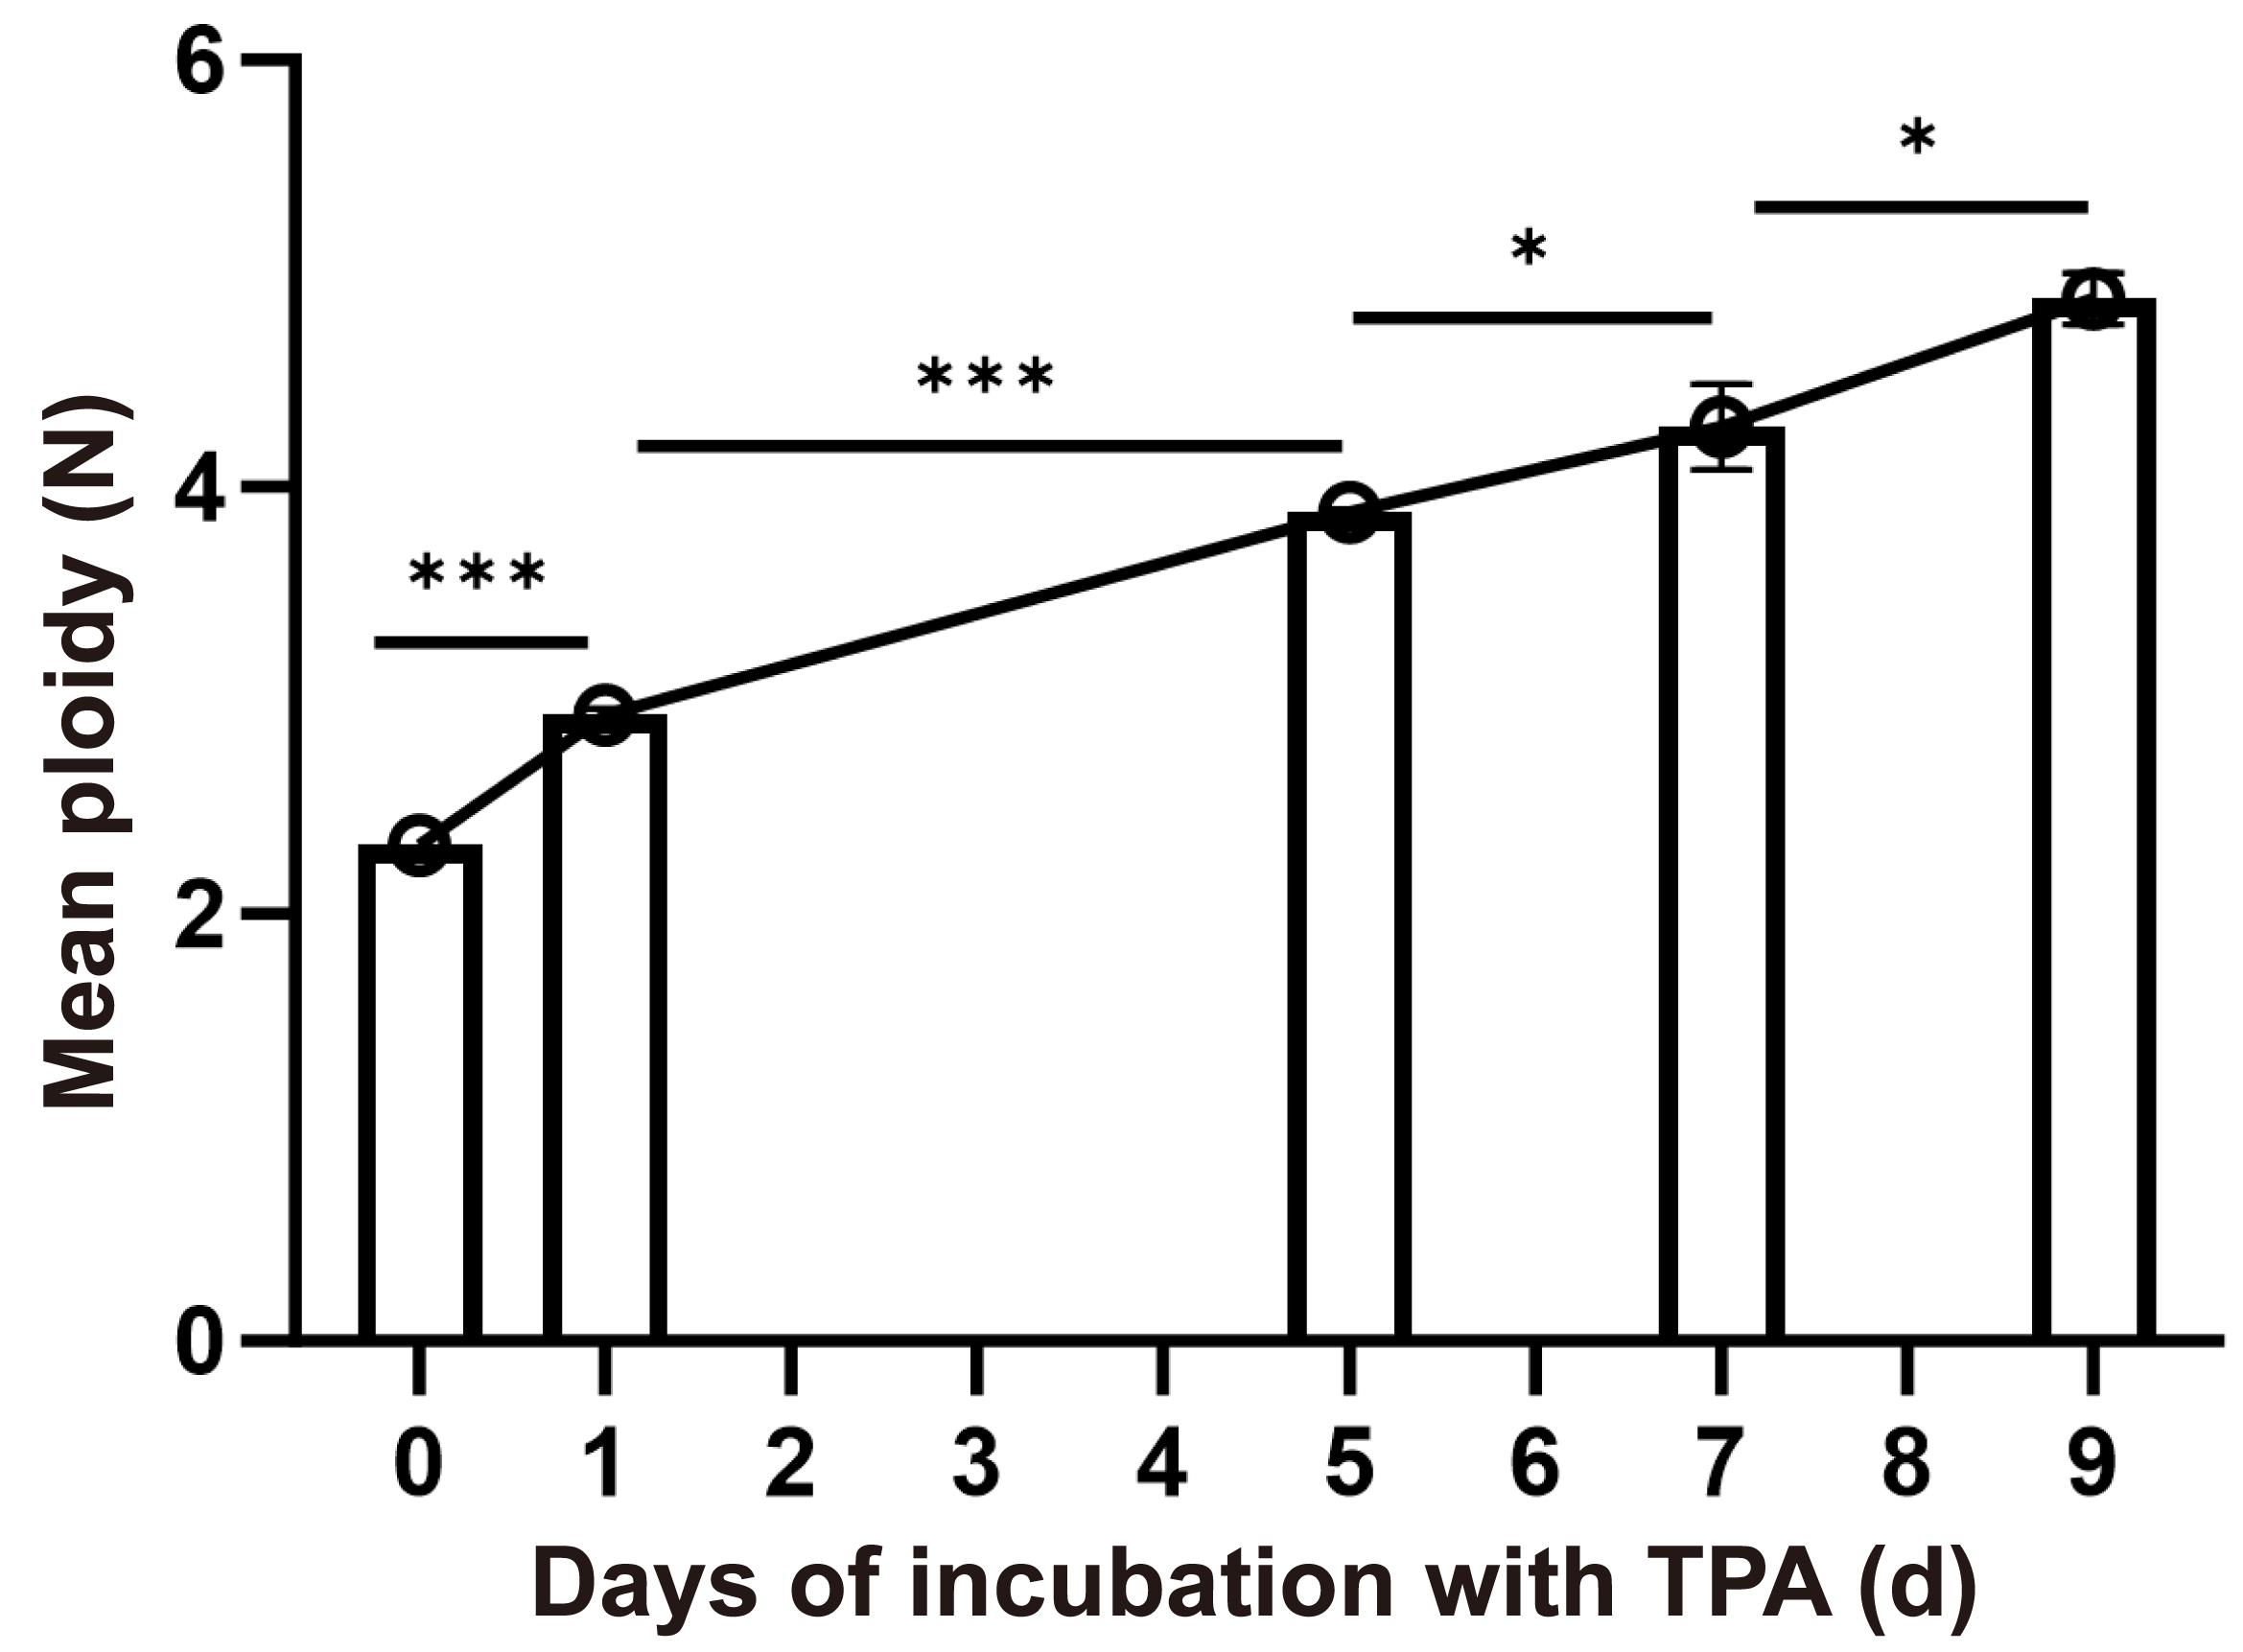
Figure 2. Time-course analysis of average ploidy across 9 days of differentiation. Mean ploidy values were quantified at days 0, 1, 5, 7, and 9, with the y-axis representing the average ploidy level per time point (n = 3). Data are mean ± SD, *P < 0.05; ***P < 0.001.
Validation of protocol
This protocol has been used and validated in the following research article:
Yuan et al. [4]. The KXD1-TSPAN14 axis controls megakaryopoiesis and platelet production via Notch signaling. Sci China Life Sci.
General notes and troubleshooting
General notes
1. Trypsinization time should be kept minimal, as over-digestion can induce cell death.
2. Hoechst staining must be performed in the dark. The working concentration should not be excessive to avoid cytotoxicity. Prior to use, prewarm the working solution to 37 °C, always prepare a fresh working dilution, and never add the stock solution directly to the reaction.
3. The data presented in this protocol are specifically validated for the BD FACSAria Fusion cell sorter equipped with a 355 nm laser at 50 mW. Nevertheless, the method can be adapted to other flow cytometers, and the overall trends are expected to remain consistent.
4. For different experimental purposes, researchers typically generate distinct MEG-01 stable cell lines with knockout or overexpression of specific genes. Because these lines are established by monoclonal expansion and selection, a conventional passage range is difficult to define. In our studies, we follow a general rule: For each stable wild-type (WT), knockout, or overexpression line, all target experiments are completed within 1 month after thawing. If the experimental period exceeds 1 month, a fresh vial is retrieved from liquid nitrogen, and a new culture is started.
5. We recommend 3–4 replicate wells per sample within a single experiment. These are technical replicates obtained from the same culture and are used to assess measurement reproducibility, not as independent biological replicates. For independent replication, we recommend at least two or three independent batch experiments, each initiated from a separate culture or a separate thaw, as biological replicates.
6. As differentiation proceeded, 8N MEG-01 WT cells began to appear from day 5 and formed a distinct peak. From day 7, 16N MEG-01 WT cells began to appear and also formed a distinct peak. In addition, a small population of 32N cells began to appear from day 9; however, 32N cells did not form a distinct peak overall under the methodological conditions used in this protocol.
Troubleshooting
Problem 1: Extensive cell death during days 1–3.
Possible causes: Insufficient initial cell density at day 0, or poor cell quality prior to differentiation.
Solution: Cultures were routinely examined under light microscopy prior to differentiation; only those displaying a bright, round morphology and a non-clustered growth pattern were used for experiments.
Problem 2: Following TPA induction, MEG-01 cells may exhibit a lack of polyploidization or differentiation, as well as growth arrest without differentiation.
Possible causes: Drug failure or poor cell condition (e.g., contamination with mycoplasma, bacteria, or fungi).
Solution: Label drug stocks with the preparation date and verify that they have not expired or lost activity. Aliquot stocks into small volumes and minimize freeze/thaw cycles to prevent drug inactivation. Routinely screen cells for pathogens; if contamination is detected, re-initiate the culture from a fresh vial and clean the culture environment.
Problem 3: Flow cytometric analysis may fail to gate singlets and exclude doublets reliably.
Possible cause: MEG-01 cells, when grown to confluence, will form clusters of cells with a “grape-like” morphology.
Solutions: When two cells pass through the laser together as an aggregate, the measured height remains unchanged relative to a single cell, whereas the width and area are approximately doubled; that is, Height remains constant while Area and Width increase. (i) Because the pulse width of a doublet is approximately twice that of a single particle, FSC/SSC/Hoechst-A vs. FSC/SSC/Hoechst-W gating is used to exclude aggregates. (ii) For normal diploid and tetraploid cells, H and A increase proportionally, giving a ~45° distribution; for aggregates, H remains unchanged while A increases. Thus, doublets can be excluded by FSC/SSC/Hoechst-A vs. FSC/SSC/Hoechst-H gating. These strategies effectively remove aggregates and prevent false-positive results. Nevertheless, excessive aggregates—even if excluded during analysis—can still compromise the experimental results and the instrument fluidics. Therefore, preventing aggregation during sample preparation is the preferred approach. (iii) To minimize aggregate formation during sample preparation, the following points should be noted: (a) Digest and pipette thoroughly to disperse cells. (b) Prepare samples as fresh as possible. (c) Before flow cytometry, filter the cell suspension through a 100-μm strainer to remove clumps that may interfere with detection. (d) Pipette to resuspend cells immediately before acquisition; do not let samples stand for extended periods.
Acknowledgments
The graphical abstract was created with BioGDP-Generic Diagramming Platform for Biomedical Graphics (https://biogdp.com/zh). This work was supported by grants from the National Natural Science Foundation of China (32270748; 32293204). This protocol was derived from the original work of Yuan et al. [4].
Author contributions
J.A.: Writing—original draft, investigation, methodology, and validation. T.L.: Methodology. W.L. and Y.Y.: Writing—original draft, conceptualization, writing—review and editing, funding acquisition, data curation, supervision, formal analysis, project administration, and visualization.
Competing interests
The authors declare no competing interests.
References
- Du, C., Chen, J. and Wang, J. (2025). New insights into the generation and function of megakaryocytes in health and disease. Haematologica. 110(7): 1500–1512. https://doi.org/10.3324/haematol.2024.287236
- Geddis, A. E. (2010). Megakaryopoiesis. Semin Hematol 47(3): 212–219. https://doi.org/10.1053/j.seminhematol.2010.03.001
- Ogura, M., Morishima, Y., Ohno, R., Kato, Y., Hirabayashi, N., Nagura, H. and Saito, H. (1985). Establishment of a novel human megakaryoblastic leukemia cell line, MEG- 01, with positive Philadelphia chromosome. Blood. 66(6): 1384–1392. https://doi.org/10.1182/blood.v66.6.1384.bloodjournal6661384
- Yuan, Y., Ai, J., Chen, H., Zhang, P., Leng, F., Guo, K., Qi, Z., Liu, K., Zhang, Y., Li, T., et al. (2026). The KXD1-TSPAN14 axis controls megakaryopoiesis and platelet production via Notch signaling. Sci China Life Sci. 69(8): 2754–2771. https://doi.org/10.1007/s11427-025-3256-7
Article Information
Publication history
Received: Aug 17, 2026
Accepted: Oct 26, 2026
Available online: Nov 12, 2026
Published: Nov 20, 2026
Copyright
© 2026 The Author(s); This is an open access article under the CC BY license (https://creativecommons.org/licenses/by/4.0/).
How to cite
Ai, J., Li, T., Li, W. and Yuan, Y. (2026). Time-Course Analysis of Polyploidy Dynamics in TPA-Induced MEG-01 Cells. Bio-protocol 16(22): e5882. DOI: 10.21769/BioProtoc.5882.

 Download Citation in RIS Format
Do you have any questions about this protocol?
Post your question to gather feedback from the community. We will also invite the authors of this article to respond.
 Post a Question


