


- Protocols

- Articles and Issues
- For Authors
- About
- Become a Reviewer


Identification of Proteins Interacting With Target lncRNAs Using In Vitro Biotinylated RNA Pull-Down Assay and Mass Spectrometry

Published: Vol 16, Iss 22, Nov 20, 2026 DOI: 10.21769/BioProtoc.5879 Views: 46
Reviewed by: Marion HoggWei DaiJoel Praneeth
 PDF
 Ask a question

Original research article
The authors used this protocol in:
Jan 2026

Protocol Collections
Comprehensive collections of detailed, peer-reviewed protocols focusing on specific topics



Abstract
Once considered “junk” transcription, long noncoding RNAs (lncRNAs) are now known to play key regulatory roles within biological processes such as transcription and translation. As lncRNAs have low translational potential, they often interact with proteins to exert their molecular functions. Therefore, identifying the protein interacting network of a lncRNA is critical to investigating its potential function. While in vivo methods exist to identify RNA–protein partners, these often require high cell inputs and RNA expression, which can be challenging for lowly expressed lncRNAs. Alternatively, in vitro methods require lower inputs, but many of these methods do not use a standardized protocol across publications or describe how the identified proteins are prioritized for further validation. Here, we describe an RNA pull-down assay using the lncRNA VILMIR as an example, which can be adapted for other lncRNA targets. First, the lncRNA was in vitro transcribed and internally biotinylated and then incubated with cellular lysate to identify interacting proteins by mass spectrometry. In addition, we describe the resulting mass spectrometry analysis and how the identified proteins were prioritized for further validation and follow-up experiments. This protocol has been successfully reproduced for multiple proteins and can be scaled up or down as needed.
Key features
• LncRNA–protein partners can be successfully identified and validated in vitro.
• Step-by-step in vitro transcription and biotinylation of a lncRNA.
• Robust RNA pull-down assay that can be scaled up or down.
• Description of mass spectrometry analysis and prioritization of proteins.
Keywords: Pull-down assay lncRNA
In vitro transcription
RNA–protein interactions
Mass spectrometry
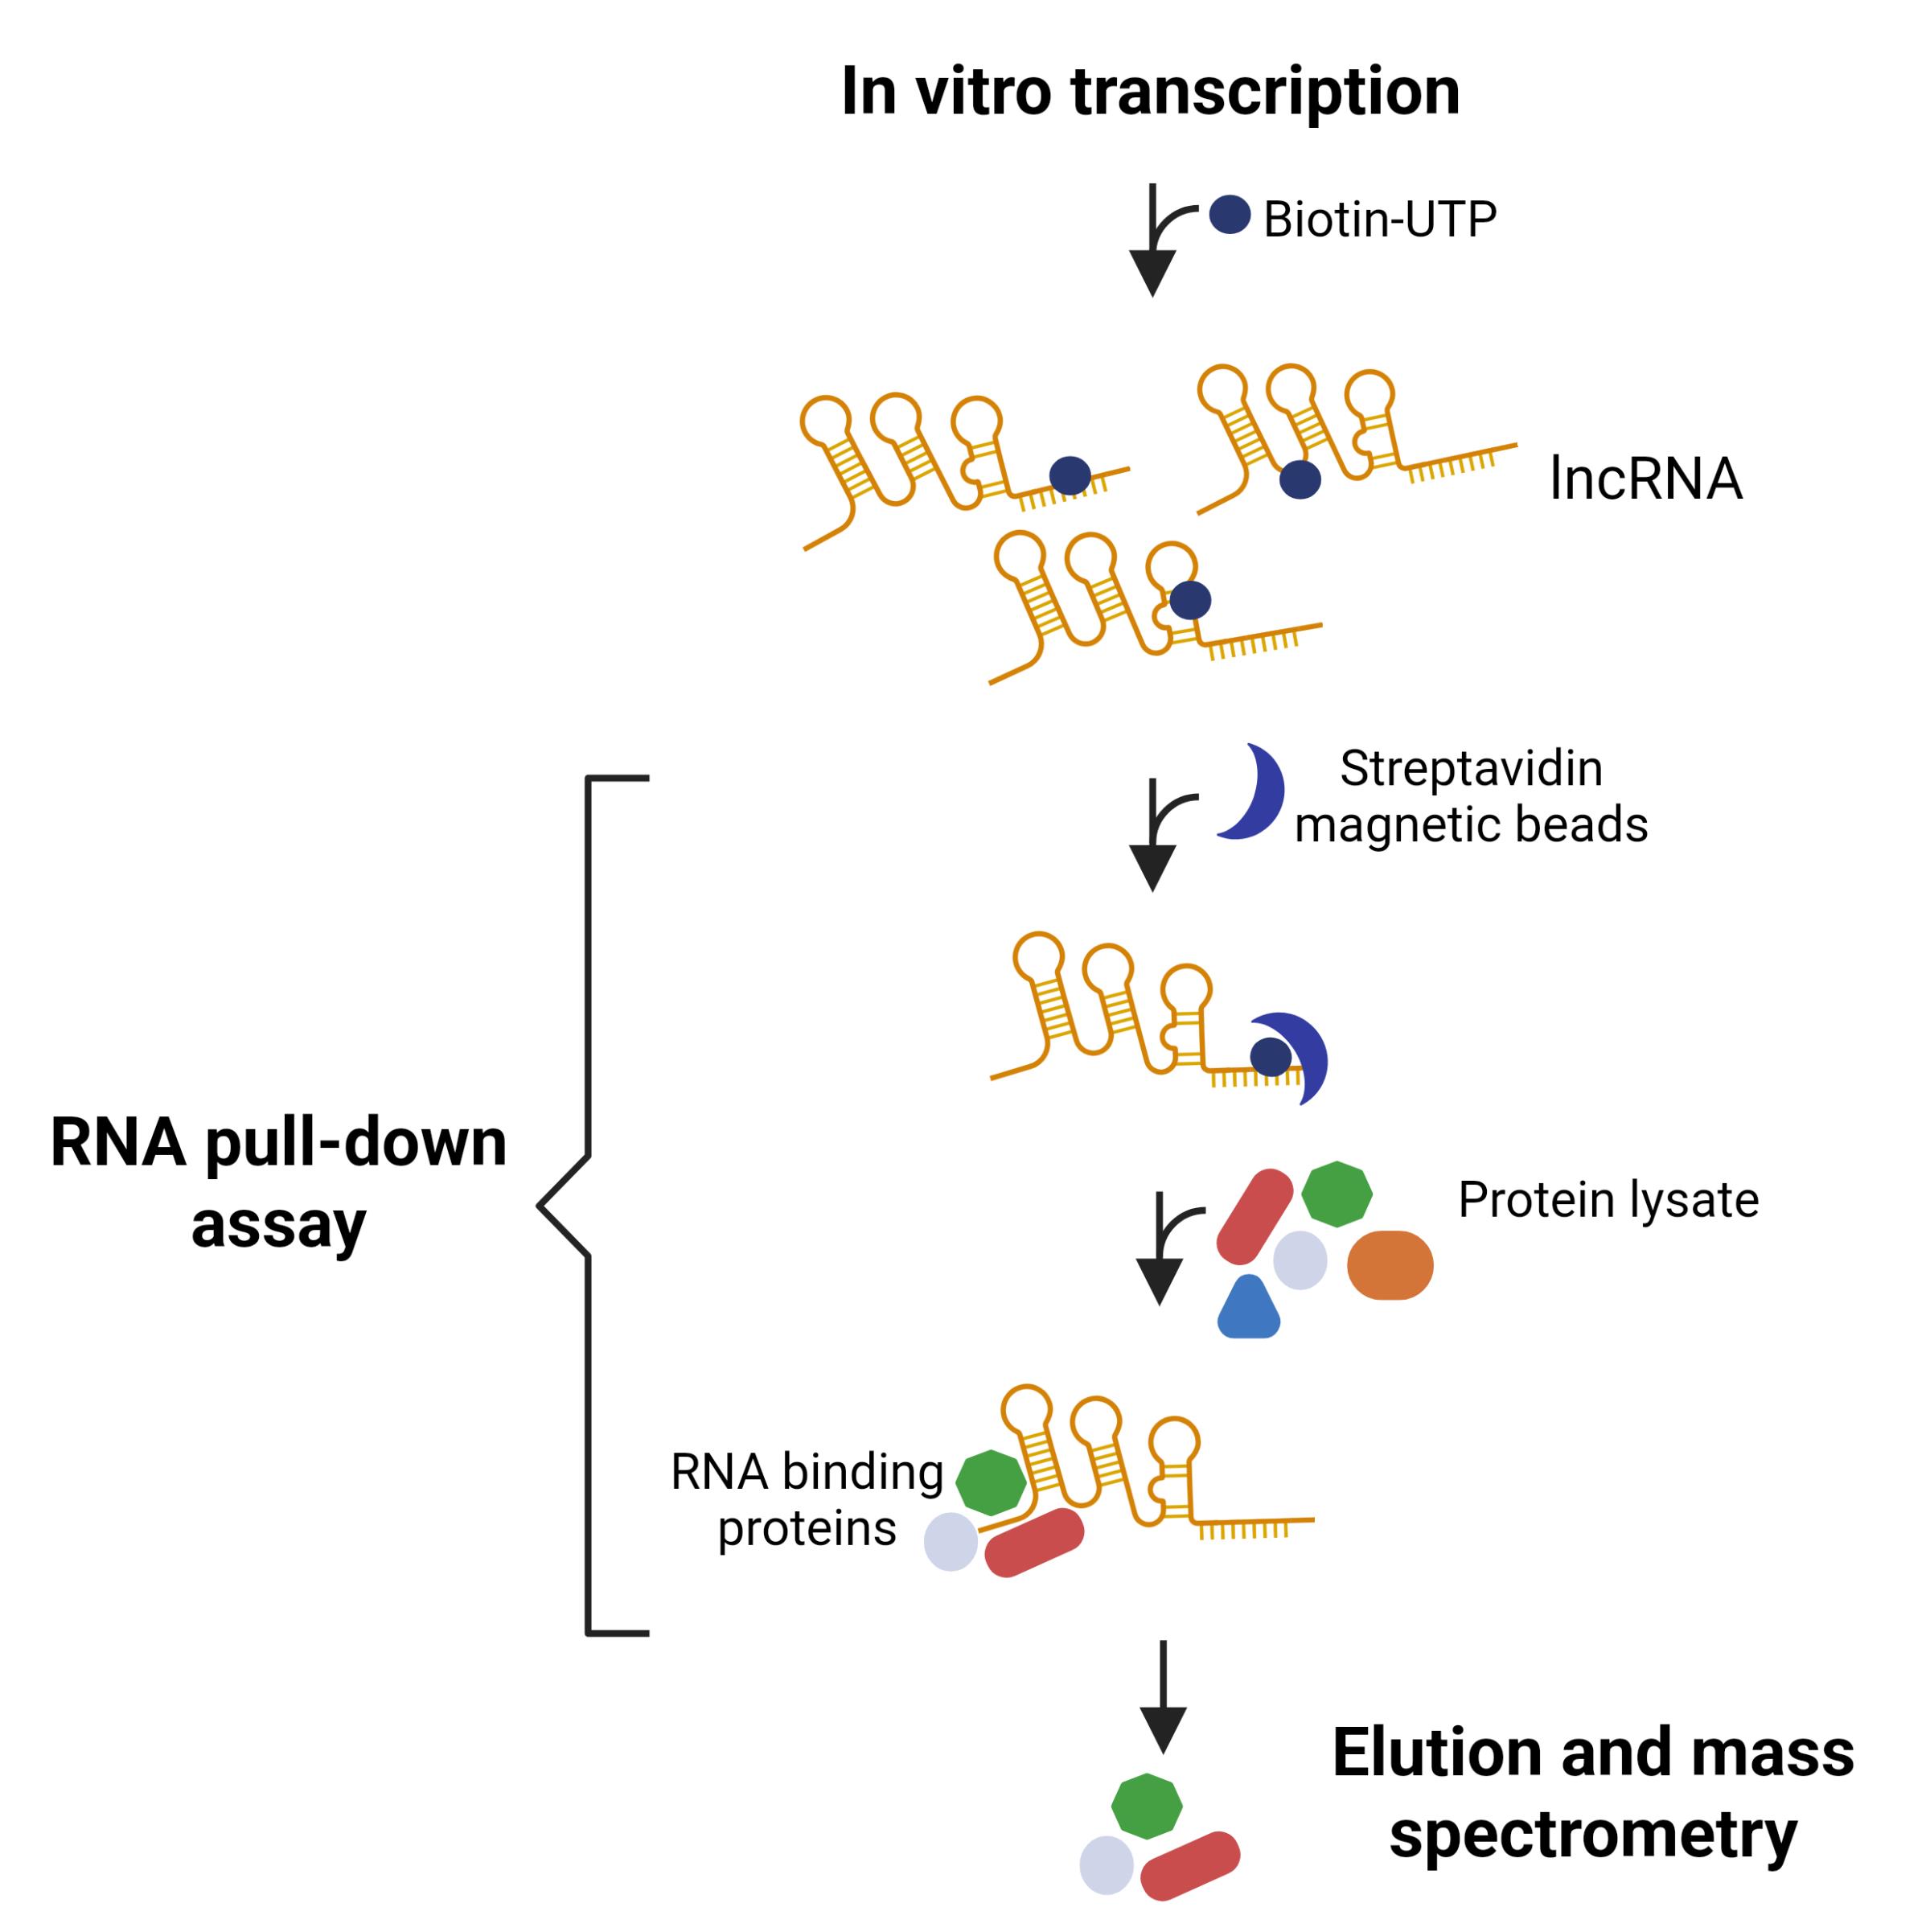
Graphical overview
Background
Despite there being 35,885 long noncoding RNA (lncRNA) genes annotated in the human genome [1], their functions within human biology still remain largely unknown. LncRNAs are defined as transcripts greater than 500 nucleotides with low protein-coding potential, meaning that they lack open reading frames (ORFs) by both computational prediction and experimental validation, such as ribosome profiling [2,3]. They have been historically challenging to study due to their low expression levels, context-specific transcription, and low evolutionary conservation [4]. The advancement of next-generation sequencing technology has led to the rapid discovery of novel lncRNAs with key regulatory functions in biological processes [5–7]. The majority of these regulatory functions involve lncRNAs interacting with RNA-binding proteins (RBPs), such as transcription factors [8] or translation factors [9]. Therefore, understanding the protein interactome of a lncRNA is critical to characterizing its function.
Several methods have been developed to identify protein partners of a lncRNA in vivo, such as RNA affinity purification (RAP) [10] and chromatin isolation by RNA purification (ChIRP) [11]. However, as in vivo methods rely on endogenous expression of the lncRNA and high cell numbers, capturing the lncRNA and its protein partners can be challenging for lowly expressed lncRNAs. When selecting an in vivo method to validate lncRNA–protein interactions, several factors should be considered. RNA-centric methods such as RAP and ChIRP rely on oligonucleotide probes and high input cell numbers to ensure successful isolation of the lncRNA–protein complex, which can be difficult for low-abundance lncRNAs [12]. On the other hand, protein-centric methods such as RNA immunoprecipitation (RIP) rely on antibodies to target the protein and its interacting RNA, which can be detected via RT-qPCR [13]. However, protein-centric methods may lead to more noise, as the protein’s entire interactome will be isolated with that protein. Therefore, the benefits and challenges of each in vivo method, as well as the abundance of the lncRNA, should be carefully considered for each lncRNA target. Alternatively, in vitro methods, such as RNA pull-down assays, can be used as a starting point for studying lncRNA–protein interactions, which can later be validated in vivo [14].
RNA pull-down assays have been used in several lncRNA publications [15–17], but the conditions of this method often vary, making it difficult to find a standardized protocol to use. For example, the optimization and efficiency of RNA biotin labeling are often not described in detail. Some protocols perform internal biotin labeling [17], while others perform end-labeling [16]. If performing internal biotin labeling, in vitro transcription kits often suggest a high molar ratio of labeled nucleotides to non-labeled nucleotides, which is not optimal for longer RNA molecules where less biotin is preferred to conserve secondary structure. In addition, the concentration of protein lysate used in pull-down protocols is not always given, leading researchers to perform additional optimization steps. Finally, how the identified proteins are prioritized for validation after an RNA pull-down assay is often not described. Therefore, a description of how a candidate protein list was prioritized in a validated study provides a helpful example for researchers prioritizing their own protein list.
We previously identified the lncRNA VILMIR (virus-inducible lncRNA modulator of interferon response), which was found to be an interferon-stimulated gene (ISG) involved in viral infection and interferon responses [18,19]. To better predict its molecular function within the interferon response, we established a robust RNA pull-down assay by compiling several known pull-down methods [14,20–23], as well as optimizing within our own system. First, we in vitro transcribed and internally biotinylated the 900-nucleotide lncRNA VILMIR and bound it to streptavidin-conjugated magnetic beads. After incubating the lncRNA-bound beads with cellular lysate from A549 human epithelial cells, we eluted the interacting proteins and analyzed these by mass spectrometry. By using the antisense sequence of VILMIR as a negative control RNA, we also described how we prioritized the VILMIR-specific interacting proteins for validation [19]. This protocol has been used successfully for several proteins and can be adjusted for other cell types and lncRNA targets as needed.
Materials and reagents
Biological materials
1. GC10 competent cells, 20 × 50 μL/unit (Genesee Scientific, catalog number: 42-658)
2. Cell line of interest for protein extraction
Reagents
1. pGEM-3Z vector (Promega, catalog number: P2151)
2. Custom gene-specific primers (Integrated DNA Technologies)
3. BamHI enzyme (New England Biolabs, catalog number: R0136T)
4. EcoRI enzyme (New England Biolabs, catalog number: R0101T)
5. TRIzol reagent (Invitrogen, catalog number: 15596026)
6. Isopropanol, Molecular Biology Grade (Fisher BioReagents, catalog number: BP2618500)
7. Ethanol, molecular biology grade (Fisher BioReagents, catalog number: BP2818500)
8. Chloroform, 100 mL (Thermo Scientific Chemicals, catalog number: 364321000)
9. QuantiTect Reverse Transcription kit (Qiagen, catalog number: 205311)
10. Q5® high-fidelity DNA polymerase (New England Biolabs, catalog number: M0491L)
11. dNTP mix (10 mM each) (Thermo Scientific, catalog number: R0192)
12. Tris-acetate-EDTA (TAE), 50× solution (Fisher BioReagents, catalog number: FLBP1332500)
13. Agarose, molecular biology grade (Fisher BioReagents, catalog number: BP160100)
14. QIAquick Gel Extraction kit (Qiagen, catalog number: 28704)
15. General Purpose Industrial Razor Blade (Surgical Design, catalog number: 270B)
16. Water, ultrapure, 4 × 1 L/unit (Genesee Scientific, catalog number: 18-196)
17. T4 DNA ligase (Takara Bio, catalog number: 2011A)
18. SOC medium (Quality Biological, catalog number: 340-031-671)
19. LB agar, 500 g (Genesee Scientific, catalog number: 11-119)
20. Carbenicillin (Fisher BioReagents, catalog number: BP26481)
21. RattlerTM Plating Beads, 230 g (Zymo Research Corporation, catalog number: S1001)
22. LB broth (Gibco, catalog number: 10855021)
23. QIAprep Spin Miniprep kit (Qiagen, catalog number: 27104)
24. SPRIselect DNA size selection reagent, 60 mL (Beckman Coulter, catalog number: B23318)
25. TranscriptAid T7 High Yield Transcription kit (Thermo Scientific, catalog number: K0441)
26. Biotin-16-UTP, 25 μL (10 mM) (ApexBio Technology, catalog number: B8154)
27. RNeasy Plus Mini kit (Qiagen, catalog number: 74134)
28. BiodyneTM B nylon membrane, 0.45 μm, 8 cm × 12 cm (Thermo Scientific, catalog number: 77016)
29. Chemiluminescent Nucleic Acid Detection Module kit (Thermo Scientific, catalog number: 89880)
30. NE-PERTM Nuclear and Cytoplasmic Extraction Reagents (Thermo Scientific, catalog number: 78835)
31. Bovine serum albumin (BSA) 20 mg/mL (Thermo Scientific, catalog number: B14)
32. Tris (1 M), pH 8.0, RNase-free, 500 mL (Thermo Scientific, catalog number: AM9856)
33. 1 M Tris-HCI buffer, pH 7.5, 1 L (Thermo Scientific, catalog number: 15567027)
34. EDTA (0.5 M), pH 8.0, RNase-free, 100 mL (Thermo Scientific, catalog number: AM9260G)
35. Sucrose, molecular biology grade, 500 g (Thermo Scientific, catalog number: J65148.36)
36. KCl (2 M), RNase-free, 100 mL (Thermo Scientific, catalog number: AM9640G)
37. HEPES, 1 M solution, pH 7.3, molecular biology grade, 100 mL (Thermo Scientific, catalog number: J16924.AE)
38. NaCl (5 M), RNase-free, 100 mL (Thermo Scientific, catalog number: AM9760G)
39. cOmpleteTM protease inhibitor cocktail, 20 tablets (Roche, catalog number: 11697498001)
40. SUPERase·InTM RNase Inhibitor, 20 U/μL (Invitrogen, catalog number: AM2696)
41. Calcium chloride dihydrate (Fisher BioReagents, catalog number: BP510-250)
42. Glycerol, molecular/proteomic grade, 500 mL (Genesee Scientific, catalog number: 18-205)
43. Sodium hydroxide, 1.00 Normal, 120 mL (Genesee Scientific, catalog number: 72-719)
44. DynabeadsTM Streptavidin magnetic beads, 10 mL (Thermo Scientific, catalog number: 11206D)
45. tRNA for LightShiftTM Chemiluminescent RNA EMSA kit (Thermo Scientific, catalog number: 20159) or equivalent tRNA
46. 4× Laemmli sample buffer (Bio-Rad, catalog number: 1610747)
47. 2-Mercaptoethanol ≥99% for biotechnology (VWR, catalog number: 97064-588)
48. 40% Acrylamide/Bis solution, 29:1 (Bio-Rad, catalog number: 1610146)
49. 10× Tris/Glycine/SDS electrophoresis buffer (Bio-Rad, catalog number: 1610732)
50. 10% SDS solution (Bio-Rad, catalog number: 1610416)
51. Resolving gel buffer for PAGE, 1.5 M Tris-HCl, pH 8.8 (Bio-Rad, catalog number: 1610798)
52. TEMED (Bio-Rad, catalog number: 1610800)
53. Ammonium persulfate (APS) (Bio-Rad, catalog number: 1610700)
54. Precision Plus ProteinTM WesternCTM blotting standards (Bio-Rad, catalog number: 1610376)
55. Coomassie Brilliant Blue, G-250 protein stain (Genesee Scientific, catalog number: 18-446)
56. Glacial acetic acid (Fisher BioReagents, catalog number: BP1185-500)
57. Methanol, 1 L (VWR, catalog number: BDH1135-1LP)
58. RNase AWAYTM surface decontaminant (Thermo Scientific, catalog number: 7002)
Solutions
1. 0.5 M TE buffer, pH 8.0 (see Recipes)
2. THES buffer (see Recipes)
3. 5× BS buffer (see Recipes)
4. BS/THES buffer (see Recipes)
5. 2× B/W buffer (see Recipes)
6. Solution A for Dynabeads® (see Recipes)
7. Solution B Dynabeads® (see Recipes)
8. 6% SDS-PAGE Gel (see Recipes)
9. 1× Tris-glycine running buffer with 0.1% SDS (See Recipes)
10. De-stain buffer (See Recipes)
Recipes
Note: It is critical that all buffers and reagents for RNA pull-down are prepared in DNase/RNase/protease-free conditions. Ensure that all reagents are molecular grade. Before preparing the buffers, spray down the lab bench and pipettes with RNase Away and wear a lab coat. It is recommended to prepare all buffers the day before proceeding with the RNA pull-down protocol, in consideration of time.
1. 0.5 M TE buffer, pH 8.0
| Reagent | Final concentration | Quantity or volume |
|---|---|---|
| 1 M Tris-HCl, pH 8.0 | 0.5 M | 25 mL |
| 0.5 M EDTA | 1 mM | 0.1 mL |
| Ultrapure H2O | n/a | 24.9 mL |
| Total | n/a | 50 mL |
TE is stable at room temperature. Check pH of the buffer prior to use.
2. THES buffer
| Reagent | Final concentration | Quantity or volume |
|---|---|---|
| 1 M Tris-HCl, pH 7.5 | 50 mM | 2.5 mL |
| 0.5 M EDTA | 10 mM | 1.0 mL |
| Sucrose | 20% | 10 g |
| 5 M NaCl | 140 mM | 1.4 mL |
| cOmplete protease inhibitor tablet | 1× | One tablet |
| Ultrapure H2O | n/a | To 50 mL |
| Total | n/a | 50 mL |
It is recommended to store the protease inhibitor (PI) tablets at -80 °C for long-term storage, with one tablet per microcentrifuge tube. Dissolve one PI tablet in THES buffer by rigorous vortexing. Once the THES buffer is made, store at 4 °C for two weeks. After two weeks, make fresh buffer with a new PI tablet.
3. 5× BS buffer
| Reagent | Final concentration | Quantity or volume |
|---|---|---|
| 1 M HEPES buffer, pH 7.5 | 50 mM | 2.5 mL |
| CaCl2 | 25 mM | 0.184 g |
| 2 M KCl | 250 mM | 6.25 mL |
| 100% glycerol | 60% | 30 mL |
| Ultrapure H2O | n/a | To 50 mL |
| Total | n/a | 50 mL |
BS buffer is stable at room temperature.
4. BS/THES buffer
| Reagent | Final concentration | Quantity or volume |
|---|---|---|
| THES buffer | 44.3% | 22.15 mL |
| 5× BS buffer | 20% | 10 mL |
| Ultrapure H2O | 35.7% | 17.85 mL |
| Total | 100% | 50 mL |
Make BS/THES buffer by combining the THES and 5× BS buffer at the indicated concentrations. Once made, BS/THES buffer should be stored at 4 °C for two weeks. After two weeks, make fresh BS/THES buffer.
5. 2× B/W buffer
| Reagent | Final concentration | Quantity or volume |
|---|---|---|
| 1 M Tris-HCl, pH 7.5 | 10 mM | 0.5 mL |
| 0.5 M EDTA | 1 mM | 0.1 mL |
| 5 M NaCl | 2 M | 20 mL |
| Ultrapure H2O | n/a | 29.4 mL |
| Total | n/a | 50 mL |
B/W buffer is stable at room temperature.
6. Solution A for Dynabeads®
| Reagent | Final concentration | Quantity or volume |
|---|---|---|
| 1 M NaOH | 0.1 M | 1 mL |
| 5 M NaCl | 0.05 M | 0.1 mL |
| Ultrapure H2O | n/a | 8.9 mL |
| Total | n/a | 10 mL |
Solutions A and B are recommended to prepare Dynabeads® (Thermo Scientific) for RNA manipulation, as Dynabeads® are not supplied in RNase-free solutions. NaOH should be stored in a corrosive cabinet and handled in a fume hood. Once diluted to 0.1 M in Solution A, it is stable on the bench at room temperature.
7. Solution B for Dynabeads®
| Reagent | Final concentration | Quantity or volume |
|---|---|---|
| 5 M NaCl | 0.1 M | 0.2 mL |
| Ultrapure H2O | n/a | 9.8 mL |
| Total | n/a | 10 mL |
Solution B is stable at room temperature.
8. 6% SDS-PAGE gel
| Reagent | Final concentration | Quantity or volume |
|---|---|---|
| Ultrapure H2O | n/a | 4.6 mL |
| 40% (29:1) Bis/Acrylamide solution | 6% | 1.2 mL |
| 1.5 M Tris-HCl, pH 8.8 | 2.0 mL | |
| 10% SDS solution | 80 μL | |
| TEMED | 10 μL | |
| 10% APS solution | 100 μL | |
| Total | n/a | 8 mL |
Make the gel immediately before use. Add all reagents into a 15 mL centrifuge tube in the order listed. Add the TEMED in a chemical fume hood. After adding the APS, vortex briefly and immediately pour into a gel casting tray, as the gel will start to solidify. 10% APS solution is stable at 4 °C for two weeks, enabling gels to solidify within 15 min.
9. 1× Tris-glycine running buffer with 0.1% SDS
| Reagent | Final concentration | Quantity or volume |
|---|---|---|
| 10× Tris/glycine/SDS buffer | 1× | 100 mL |
| dH2O | n/a | 900 mL |
| Total | n/a | 1 L |
Stable at room temperature.
10. De-stain buffer
| Reagent | Final concentration | Quantity or volume |
|---|---|---|
| dH2O | 50% | 25 mL |
| Glacial acetic acid | 10% | 5 mL |
| Methanol | 40% | 20 mL |
| Total | 100% | 50 mL |
Add the glacial acetic acid in a chemical fume hood. When done, discard the de-stain buffer per the institution’s EHS waste disposal protocol.
Laboratory supplies
1. Olympus Premium 1.7 mL snap cap microcentrifuge tubes (Genesee Scientific, catalog number: 24-282S)
2. Olympus Premium 2.0 mL snap cap microcentrifuge tubes (Genesee Scientific, catalog number: 24-283A)
3. Olympus 8-Strip PCR tubes with caps, 0.2 mL (Genesee Scientific, catalog number: 27-125)
4. 10 μL XL filtered pipette tips (Genesee Scientific, catalog number: 23-401C)
5. 20 μL filtered pipette tips (Genesee Scientific, catalog number: 23-404C)
6. 200 μL filtered pipette tips (Genesee Scientific, catalog number: 23-412C)
7. 1,000 μL filtered pipette tips (Genesee Scientific, catalog number: 23-430C)
8. 15 mL conical centrifuge tubes (Genesee Scientific, catalog number: 28-101)
9. 50 mL conical centrifuge tubes (Genesee Scientific, catalog number: 28-106)
Equipment
Note: Listed are the equipment utilized in this study, but similar accessible equipment can also be used.
1. 4150 TapeStation System
2. T100 Thermal Cycler (Bio-Rad, catalog number: 1861096)
3. Bio-Rad ChemiDoc MP UV Imaging System
4. Thermo Scientific NanoDrop One Spectrophotometer
5. Water bath
6. 37 °C bacterial shaker
7. 37 °C bacterial incubator
8. BenchWaver Orbital shaker (Benchmark, catalog number: B3D5000)
8. Mini-PROTEAN Tetra Vertical Electrophoresis for Handcast Gels (1.0 mm) (Bio-Rad, catalog number: 1658001)
9. Freezer (-80 °C)
10. Freezer (-20 °C)
11. Refrigerator (2–8 °C)
12. Magnetic rack for 1.5 mL centrifuge tubes
13. Magnetic rack for 0.2 mL PCR tubes
14. Tube racks
Procedure
A. Isolation of lncRNA gene of interest
1. Design primers for the full-length lncRNA gene of interest along with an EcoRI site (5′-GAATTC-3′) on the forward primer and a BamHI site (5′-GGATCC-3′) on the reverse primer. In addition, add 4–6 extra nucleotides on the 5′ end of the primer to allow the restriction enzyme (RE) to cut. To make the antisense or reverse complement lncRNA sequence, a second set of primers should be ordered with the RE sites switched on the forward and reverse primers (Table 1).
Critical: Ensure that the lncRNA sequence of interest does not contain internal EcoRI or BamHI restriction sites, as this will lead to internal digestion of the lncRNA later in this protocol. If there are internal EcoRI or BamHI restriction sites in the lncRNA, alternative restriction enzyme sites compatible with the pGEM-3Z cloning plasmid should be selected and added to the primers instead.
Note: When designing the primers, make sure the forward primer is on the very 5′ end of the lncRNA sequence, and the reverse primer is on the very 3′ end of the sequence. This ensures that the entire lncRNA sequence will be cloned.
Table 1. Primer sequence examples for lncRNA VILMIR
| Primer name | Sequence |
|---|---|
| VILMIR FWD T7 sense | 5′-TAAGCAGAATTCGGGGCTCCGGGAGT-3′ |
| VILMIR REV T7 sense | 5′-TCCGAGGGATCCTTTGGATTATGTTTAATTAAGAAAAGC-3′ |
| VILMIR FWD T7 antisense | 5′-TCCGAGGAATTCTTTGGATTATGTTTAATTAAGAAAAGC-3′ |
| VILMIR REV T7 antisense | 5′-TAAGCAGGATCCGGGGCTCCGGGAGT-3′ |
2. Isolate RNA from the cell line of interest in the appropriate biological context.
Note: The authors used TRIzol reagent (Invitrogen) to isolate RNA from A549 cells, but alternative RNA isolation methods can be used instead.
3. To obtain complementary DNA (cDNA) from the RNA, perform reverse transcription of the RNA sample.
Note: The authors used QuantiTect Reverse Transcription kit (Qiagen) containing both oligo-dT and random primers, but alternative reverse transcription kits can also be used.
4. Perform a polymerase chain reaction (PCR) using the cDNA to amplify the lncRNA gene and add the RE sites to the product. Use the designed primers for both a sense and an antisense reaction.
Critical: A high-fidelity polymerase is needed to ensure the sequence is accurate going into in vitro transcription (IVT).
Notes:
1. The authors recommend using the Q5® High-Fidelity DNA polymerase from New England Biolabs.
2. The PCR will likely need to be optimized for each lncRNA gene of interest.
3. At least 500 ng of PCR product will be needed for the RE digestion. The authors set up duplicate PCRs that were pooled during the gel extraction to increase the concentration of PCR product.
5. Run the entire PCR product on a 1× TAE/1% agarose gel at 120 V for 30 min and image the gel to visualize the expected bands.
Critical: Use TAE rather than TBE buffer, as the borate in TBE has been found to inhibit downstream enzymes such as T4 DNA ligase.
6. Cut out the expected bands with a razor blade and purify the DNA according to the QIAquick Gel Extraction kit. Elute the DNA in water and quantify it using a NanoDrop spectrophotometer.
Pause point: The purified DNA can be stored at -20 °C until performing RE digestion.
B. Preparation for cloning into pGEM-3Z plasmid
1. Set up a double RE digestion of both the pGEM-3Z plasmid and the purified PCR products using EcoRI and BamHI to prepare the DNA ends for cloning.
Note: The authors previously digested 2 μg of pGEM-3Z with 2 μL each of EcoRI and BamHI in 50 μL total. For the PCR product, 500 ng was digested with 0.5 μL of each enzyme.
2. Incubate the RE digestions at 37 °C for 1 h in a thermal cycler.
3. Run the entire pGEM-3Z digestion product as well as 5 μL of each digested PCR product on a 1× TAE/1% agarose gel at 120 V for 30 min and image the gel to visualize the expected bands. An undigested pGEM-3Z plasmid can be run as a control to confirm successful digestion.
Critical: Use TAE rather than TBE buffer, as the borate in TBE has been found to inhibit downstream enzymes such as T4 DNA ligase.
Note: The digested PCR product does not need to be isolated via gel extraction since it was isolated previously. The remainder of the digestion reaction can be purified with the QIAquick Gel Extraction kit by adding 3 volumes of QG buffer directly to the RE reaction tube.
4. Cut out the expected 2.7-kb pGEM-3Z band with a razor blade and purify the DNA according to the QIAquick Gel Extraction kit. Elute the DNA in water and quantify it using a NanoDrop spectrophotometer.
Pause point: The purified DNA can be stored at -20 °C until performing the ligation.
C. Ligation and cloning of lncRNA gene into pGEM-3Z plasmid
1. Using the digested pGEM-3Z plasmid and the digested PCR products, set up a ligation reaction using Takara’s T4 DNA ligase with a 1:3 vector:insert molar ratio of linear pGEM-3Z to digested sense or antisense PCR product. A negative control with no insert should also be performed.
Note: The authors previously used 25 ng of linear pGEM-3Z for their ligation with 1 μL of T4 DNA ligase in 20 μL.
2. Incubate the ligation for 5 h at 16 °C in a thermal cycler.
Note: This can be set up overnight with a 4 °C hold afterward if the transformation is being performed the next day.
3. Combine 2 μL of each ligation reaction with 25 μL of GC10 competent cells. Gently flick the tube 4–5 times. For a positive transformation control, mix 25 ng of circular pGEM-3Z plasmid with 25 μL of GC10 cells.
Critical: Thaw the GC10 cells on ice immediately before use.
4. Place the transformation reaction on ice for 30 min.
5. Heat-shock the tubes at 42 °C for 45 s in a water bath and then immediately place them back on ice for 5 min.
6. Add 100 μL of SOC medium to each tube and recover by incubating for 1 h at 37 °C at 200 rpm.
7. Plate the entire reaction on LB/carbenicillin (carb) (100 μg/mL) plates using sterile glass beads or a spreader.
Note: Ampicillin can be used instead of carbenicillin at the same concentration. The authors used carbenicillin as it is known to be more stable than ampicillin.
8. Incubate the plates overnight at 37 °C and check for colonies the next day.
Note: The positive control transformation with circular plasmid should be a field of colonies, while the negative control with no insert should have zero colonies.
See Troubleshooting if no colonies are observed on the experimental plate.
9. Pick at least three colonies from each transformation plate and T-streak on a new LB/carb plate to ensure pure colonies. Incubate again overnight at 37 °C.
10. Pick at least three pure colonies from the sense and antisense plates and inoculate in 2 mL of LB/carb broth. Grow the cultures overnight at 37 °C with shaking at 200 rpm to prepare for colony PCR the next day.
11. The next day, set up a colony PCR with 1 μL of culture as a template to ensure the presence of the gene sequence in the plasmid. It is also recommended to include a positive and negative control for PCR to ensure the reaction worked and there was no contamination.
Note: The primers for the colony PCR should be specific to the gene of interest.
12. Run the PCR products on a 1× TAE/1% agarose gel at 120 V for 30 min and image the gel to visualize the expected band size for the gene of interest.
Note: TBE buffer can be substituted here for TAE buffer as the gel is not being extracted for downstream applications.
13. Using the results of the colony PCR, extract successful clones using the QIAprep Miniprep kit with 1.5 mL of culture for each miniprep. Elute the DNA in water and quantify it using a NanoDrop spectrophotometer.
Pause point: The purified DNA can be stored at -20 °C until performing Sanger sequencing.
14. Analyze the recombinant plasmids by Sanger sequencing to confirm that the correct sense and antisense lncRNA sequence was cloned into the pGEM-3Z downstream of the T7 promoter sequence and that there are no mutations.
Critical: It is essential that the correct sequence is confirmed, as this will be the template used for IVT.
Note: If mutations are found, continue to screen more colonies from the transformation plate.
D. Preparation of in vitro transcription (IVT) template
1. To linearize the recombinant pGEM-3Z plasmid for IVT, digest the plasmid with BamHI to linearize the plasmid directly downstream of the lncRNA insert.
Notes:
1. Each IVT reaction requires 1 μg of template with a minimum concentration of 180 ng/μL, as a volume of 5.55 μL for the template cannot be exceeded. Therefore, it is recommended to digest 7 μg of plasmid per reaction to ensure that multiple reactions of IVT can be performed using the same batch of digested plasmid.
2. For example, the authors previously digested 7 μg of both sense and antisense plasmid using 4 μL (400 units) of BamHI in 50 μL total.
2. Incubate the digestion reactions at 37 °C for 1 h in a thermal cycler and hold at 4 °C until purification.
3. Run 2 μL of each digestion reaction on a 1× TAE/1% agarose gel at 120 V for 30 min, as well as an undigested plasmid as a control, and image the gel to confirm successful digestion.
Note: TBE buffer can be substituted here for TAE buffer as the gel is not being extracted for downstream applications.
4. Using the remainder of the reaction, purify the digested plasmid using SPRIselect magnetic beads following the manufacturer’s instructions with a 1.8× ratio of beads to volume to increase the yield of DNA.
Notes:
1. Briefly, add a 1.8× ratio of SPRI beads to volume (example: 90 μL of beads to 50 μL of volume) and mix the total volume by pipetting 10 times. As the length of the template is greater than 2.7 kb, incubate the DNA–bead mixture at room temperature for 10 min rather than 1 min to increase DNA–bead binding.
2. Place the reaction on a magnetic stand and incubate until the SPRI beads settle to the magnet. Remove the supernatant, add 180 μL of 85% ethanol to the tube still on the magnet, and incubate for 30 s at room temperature. Remove the ethanol.
3. To ensure a high concentration of template, remove the tube from the magnet and elute the DNA in 12 μL of ultrapure water by resuspending the beads in the water and incubating at 37 °C in a thermal cycler for 10 min. Then, place the tube back on the magnetic stand, allow the SPRI beads to settle, and transfer the eluate to a new tube.
4. The authors used SPRIselect bead purification as it ensured a high level of purity going into IVT. Other purification methods could be tested if SPRIselect beads are not available, but this has not been validated by the authors.
5. Quantify and analyze the purified template on a NanoDrop spectrophotometer.
Critical: The purity of the template can affect transcription yield and RNA integrity, so ensure the A260/A280 ratio is approximately 1.8 (acceptable within 1.7–2.0) and the A260/A230 ratio is within 2.0–2.2.
Note: The authors previously captured approximately 75% of the initial 7 μg of DNA after purification, so the final yield of DNA was approximately 5 μg.
Pause point: The purified DNA template can be stored at -20 °C until performing IVT.
E. In vitro transcription of RNA
1. To transcribe the lncRNA of interest as well as the antisense negative control lncRNA and incorporate biotinylated UTP in preparation for RNA pull-down, set up IVT using the TranscriptAid T7 High Yield Transcription kit and Biotin-16-UTP (Table 2).
Notes:
1. The TranscriptAid kit suggests a recommended molar ratio of modified UTP (Biotin) to standard UTP of 1:3. The authors found this ratio to be far too high for lncRNA VILMIR and found that a 1:39 molar ratio was sufficient for biotinylation. The molar ratio may need to be adjusted for the lncRNA of interest. If incorporating biotin-UTP, the researcher should determine the total number of uridines in the given lncRNA sequence and predict how many labeled UTPs will be incorporated with a given ratio. For example, with a 1:39 molar ratio of biotinylated-UTP to standard UTP, one labeled UTP should be incorporated for every 40 UTPs. As the full-length sense VILMIR RNA sequence contains 305 uridines, it was predicted that 7.6 labeled UTPs would be incorporated into the RNA, which was sufficient for labeling. In theory, with a lncRNA of a different composition, a similar labeling could be achieved by taking the total number of uridines divided by the desired number of labeled UTPs (such as seven as with VILMIR) to get the molar ratio of labeled UTP to standard UTP. For instance, if the lncRNA only has 100 uridines rather than 305, a similar labeling efficiency of approximately seven UTPs may be achieved by a 1:14 molar ratio instead. In that case, a ratio above and below the 1:14 could be tested as well to determine the optimal ratio. In general, using less biotin-UTP is preferable to avoid interfering with RNA secondary structure, as excessive biotin incorporation could alter RNA folding and influence RNA–protein interactions. The labeling ratio for each target lncRNA should be carefully optimized.
2. This reaction can be set up in duplicate or triplicate to generate more RNA for the pull-down assay.
Table 2. In vitro transcription reaction components
| Component | Volume | Final concentration |
|---|---|---|
| 5× TranscriptAid reaction buffer | 4 μL | 1× |
| ATP, 100 mM | 2 μL | 10 mM |
| CTP, 100 mM | 2 μL | 10 mM |
| GTP, 100 mM | 2 μL | 10 mM |
| UTP, 100 mM | 1.95 μL | 9.75 mM |
| Biotin-UTP, 10 mM | 0.5 μL | 0.25 mM |
| Template DNA | 1 μg | |
| DEPC-treated water | to 20 μL | |
| TranscriptAid enzyme mix | 2 μL | |
| Total volume | 20 μL |
2. Mix well, spin briefly, incubate at 37 °C for 2 h in a thermal cycler, and cool to 4 °C. Immediately proceed with the purification.
3. Using the RNeasy Plus Mini kit (Qiagen), add 350 μL of buffer RLT Plus to each reaction and then follow the manufacturer’s instructions.
Notes:
1. Briefly, transfer the reaction with buffer RLT Plus to a gDNA eliminator spin column in a collection tube and centrifuge at ≥8,000× g for 30 s. Discard the column and save the flowthrough.
2. Add 350 μL of 70% ethanol to the flowthrough and mix by pipetting. Transfer the entire volume to an RNeasy spin column placed in a collection tube and centrifuge at ≥8,000× g for 15 s. Discard the flowthrough.
3. Add 700 μL of buffer RW1 to the spin column, centrifuge at ≥8,000× g for 15 s, and discard the flowthrough.
4. Add 500 μL of buffer RPE to the spin column, centrifuge at ≥8,000× g for 15 s, and discard the flowthrough.
5. Add 500 μL of buffer RPE to the spin column and centrifuge at ≥8,000× g for 2 min to dry the membrane.
6. Transfer the spin column to a new collection tube and centrifuge at full speed for 1 min to eliminate any residual flowthrough.
4. Elute the RNA into a new 1.5 mL tube using 30 μL of RNase-free water. Save the column and elute with 30 μL three more times, each time eluting the RNA into the same tube to increase the yield (four elutions total).
Notes:
1. As the amount of RNA transcribed is high, several elutions from the same column are needed.
2. The RNeasy Plus Mini kit includes a gDNA eliminator column, so a DNase treatment was not necessary. Please note that if another purification method is used, a DNase step may be needed to remove the template DNA.
5. Quantify the transcribed RNA on a NanoDrop spectrophotometer.
Notes:
1. With the reaction shown in Table 2, the authors normally achieved an RNA concentration around 1,000 ng/μL, with a total yield of approximately 120 μg of RNA per IVT reaction.
2. If duplicates of an IVT reaction were performed, pool the RNA together and re-quantify to get a final stock of RNA for that reaction.
6. Aliquot the final RNA into tubes to avoid freeze-thaws. It is also recommended to save two small aliquots (10–20 μL) of each RNA diluted 1:10 in water to analyze the RNA quality, size, and biotinylation.
Note: Some RNA pull-down protocols perform an additional step after in vitro transcription to allow for folding of the RNA if a strong secondary structure is predicted; however, this step was not included in this protocol. See General note 1 if an RNA folding step is desired.
Pause point: Store all RNA at -80 °C.
F. Evaluation of IVT RNA
1. To ensure the RNA transcripts are the expected size, run one of the diluted RNA aliquots on an Agilent Bioanalyzer or TapeStation 4150 according to the manufacturer’s instructions.
Note: If a Bioanalyzer or TapeStation is not available, Thermo Scientific recommends running the RNA on an agarose gel, but this was not validated by the authors.
2. Ensure both sense and antisense RNA transcripts have a distinct, sharp peak around the expected size (Figure 1A, B).
Note: The authors observed that the transcribed VILMIR ran slightly higher than the expected 900 bases, but this is believed to be due to the biotinylation and potential secondary structure. The authors confirmed that this transcript was the correct sequence by reverse transcribing and Sanger sequencing the transcribed RNA.
3. To confirm that the transcribed RNA was successfully biotinylated, set up a dot blot with the additional diluted RNA aliquot. The following was adapted from the “Determining Labeling Efficiency” procedure of the PierceTM RNA 3' End Biotinylation kit manual (Thermo Scientific, catalog number: 20160); however, the 3′ End Biotinylation kit itself was not used.
4. Hydrate/equilibrate a positively charged nylon membrane in TE buffer for at least 10 min.
5. Using a 0.2 mL tube strip, dilute the RNA in ultrapure water to 1 nM according to its size in bases in 50 μL.
6. From the 1 nM dilution, prepare four additional 2-fold dilutions (25 μL of RNA and 25 μL of ultrapure water) up to 0.0625 nM.
7. Place the equilibrated membrane onto a clean, dry paper towel and allow excess buffer to absorb into the membrane.
8. Spot 2 μL of each RNA dilution on the membrane (Figure 1C) and allow it to absorb.
9. Immediately UV crosslink the membrane by placing it face down on a transilluminator with 312 nm bulbs and crosslink for 10–15 min.
10. Detect the biotin signal according to the Chemiluminescent Nucleic Acid Detection Module kit (ordered separately).
Notes:
1. Block the membrane by incubating in 16 mL of blocking buffer for 15 min with gentle shaking.
2. Remove the blocking buffer and add 16 mL of conjugate/blocking solution (50 μL of streptavidin-horseradish peroxidase conjugate in 16 mL of blocking buffer). Incubate for 15 min with gentle shaking.
3. Transfer the membrane to a new container and rinse with 20 mL of 1× wash buffer. Wash the membrane four times for 5 min each in 20 mL of 1× wash buffer with gentle shaking.
4. Transfer the membrane to a new container and incubate in 30 mL of substrate equilibration buffer for 5 min with gentle shaking.
5. Remove the membrane from the substrate equilibration buffer and gently remove excess buffer by blotting the edge of the membrane on a paper towel. Place the membrane in a clean container.
6. Pour the substrate working solution (6 mL of luminol/enhancer solution and 6 mL of stable peroxide solution) onto the membrane. Incubate the membrane for 5 min without shaking.
7. Remove the membrane from the working solution and blot the edge on a paper towel. Do not allow it to dry.
11. Image the membrane using a Bio-Rad ChemiDoc on ChemiHiSensitivity with an exposure time of at least 30 s.
Note: Successful biotinylation is determined by a strong signal from the dot blot, as well as a relatively even signal between the sense and antisense RNA throughout the dilutions (Figure 1C).
See Troubleshooting if a strong biotinylation signal is not detected from the dot blot.
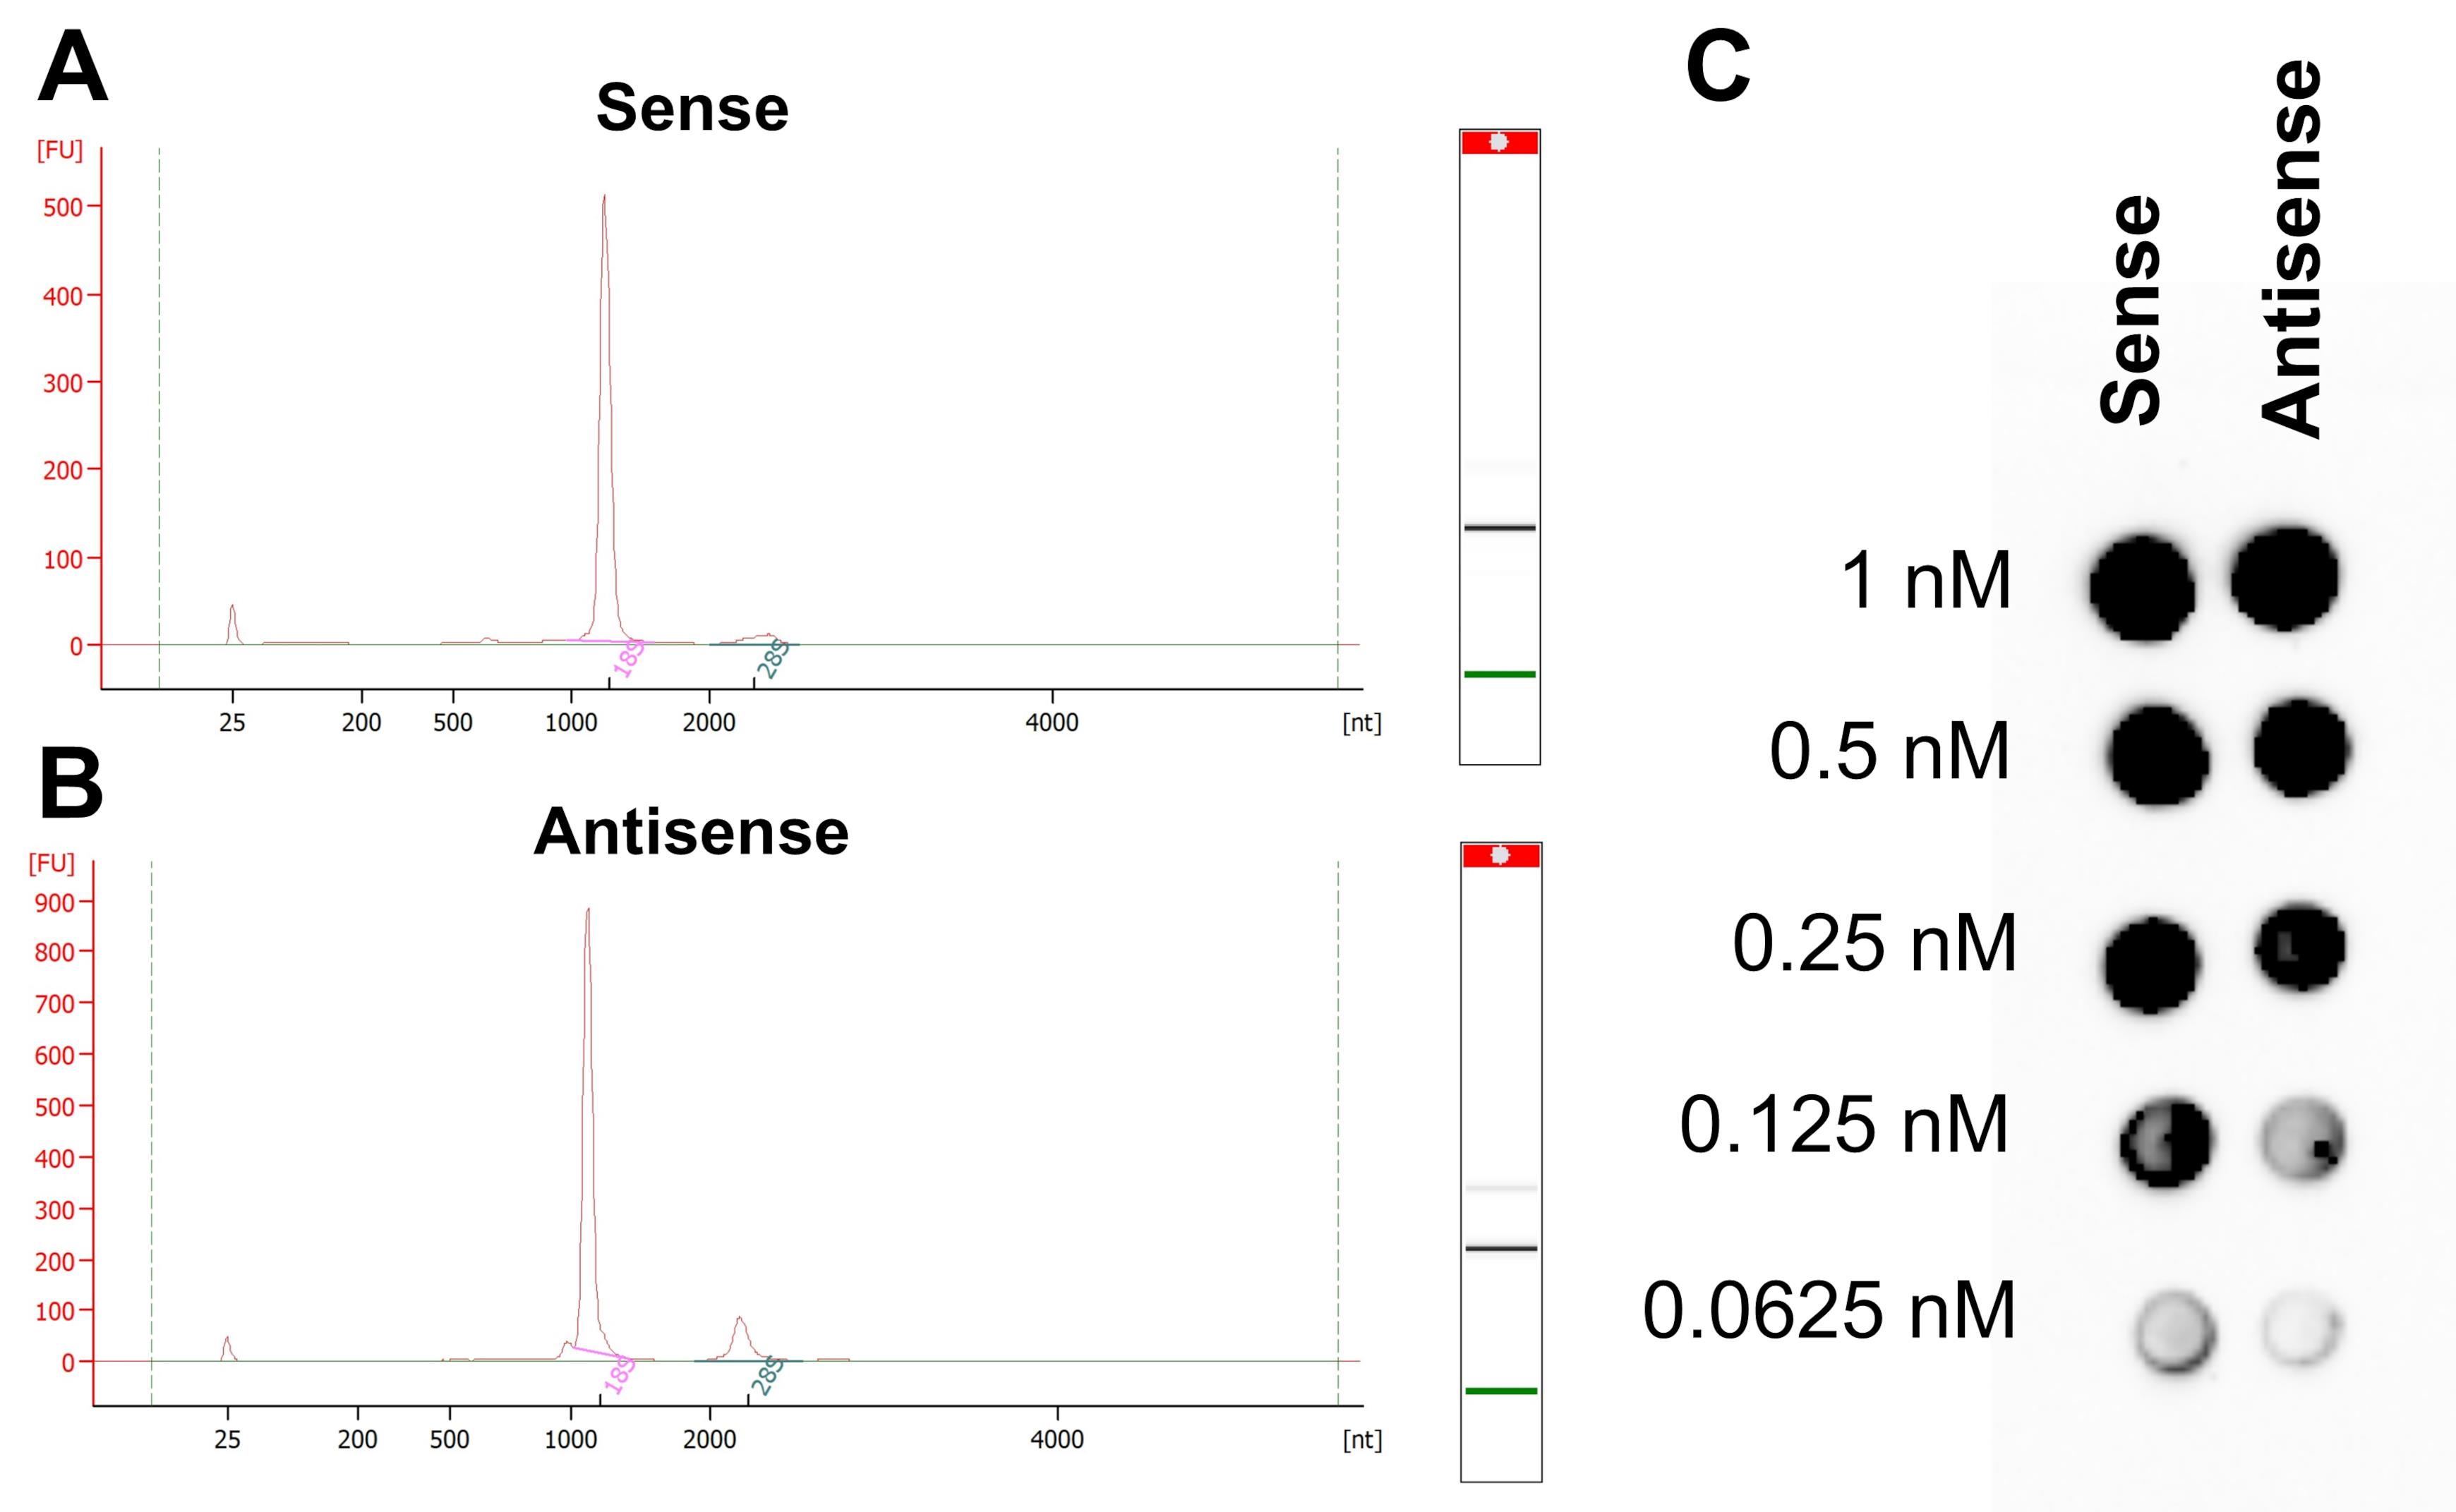
Figure 1. Evaluation of successful in vitro transcribed and biotinylated RNA. (A) In vitro transcribed VILMIR sense RNA was run on an Agilent Bioanalyzer to ensure a distinct, sharp peak around the expected size of 900 nucleotides. (B) In vitro transcribed VILMIR antisense was analyzed the same way. Both transcripts ran slightly above 1,000 nucleotides, which is believed to be due to biotinylation and secondary structure, as the correct sequence of each was confirmed. The additional small RNA peaks were disregarded as they did not impact results. (C) A dot blot was performed of sense and antisense VILMIR RNA by crosslinking diluted RNA to a nylon membrane and detecting biotinylation with chemiluminescence.
G. Protein lysate extraction
1. Collect protein lysate for subsequent RNA pull-down assay in the desired cell line and biological context.
Notes:
1. The authors previously collected protein lysate from A549 cells using NE-PER nuclear and cytoplasmic extraction reagents (Thermo Scientific, catalog number: 78835) to analyze nuclear and cytoplasmic proteins separately. Total lysate may be used instead, but the amount of protein used for pull-down may need to be adjusted.
2. For example, one confluent T182 flask of A549 cells (10–12 million cells) gave a packed cell volume of approximately 100 μL per flask. When isolated using the NE-PER Extraction kit according to the manufacturer’s protocol, the cytoplasmic lysate volume obtained was around 1,000 μL. To achieve a more concentrated nuclear lysate, the volume of NER used in the extraction kit was decreased by one-fourth, which gave a final volume of around 125 μL. Therefore, if using this kit, it is important to note that the nuclear lysate is substantially less than the cytoplasmic lysate. As this pull-down protocol requires 300 μL of protein lysate per reaction, this means three nuclear extractions (or three T182 flasks) are required per reaction. If performing multiple reactions and replicates, an adequate protein stock should be obtained before beginning the pull-down.
2. Determine the relative protein concentration using absorbance at 280 nm by comparison with a bovine serum albumin (BSA) standard curve.
Note: Using this method, the authors generally obtained nuclear protein at a concentration of 10–12 mg/mL and cytoplasmic protein at 30–35 mg/mL from one T182 of A549 cells. The cytoplasmic protein was diluted 1:1 in BS/THES buffer on the day of RNA pull-down, as it was observed that undiluted cytoplasmic protein resulted in an inability to resuspend the Dynabeads after lysate incubation due to clumping. The best concentration for pull-down in other systems may need to be optimized.
3. Store protein lysate at -80 °C until the RNA pull-down assay.
H. Dynabeads preparation
Notes:
1. Sections H–L should be completed in a single day. All steps should be performed at room temperature unless otherwise noted. Spray down the lab bench and pipettes with RNase Away and wear a lab coat.
2. The following protocol is for a single reaction of RNA pull-down and mass spectrometry. If more reactions/replicates are performed, it is recommended to prepare the Dynabeads and RNA probe in a master mix and then separate into individual tubes when incubating with protein lysate. If making a master mix, prepare 5%–10% extra to account for pipetting.
3. In addition to performing a 1× sense and antisense RNA pull-down, a preclearing step of protein lysate is also performed using a 0.5× reaction of antisense RNA for each pull-down reaction (Figure 2). Therefore, additional antisense RNA is prepared for this preclearing step.
4. This reaction can be scaled up or down depending on the downstream applications. The authors recommend performing the full 1× reaction in this protocol for mass spectrometry, as a larger elution sample will allow for broader protein identification in mass spectrometry. However, if the eluted protein is being used for western blot, the reaction can be scaled down, as less volume is required for successful detection of target proteins on a western blot. See General note 2 for a detailed description of how to scale the reaction.
5. Sections H–L were adapted from [23] for RNA.
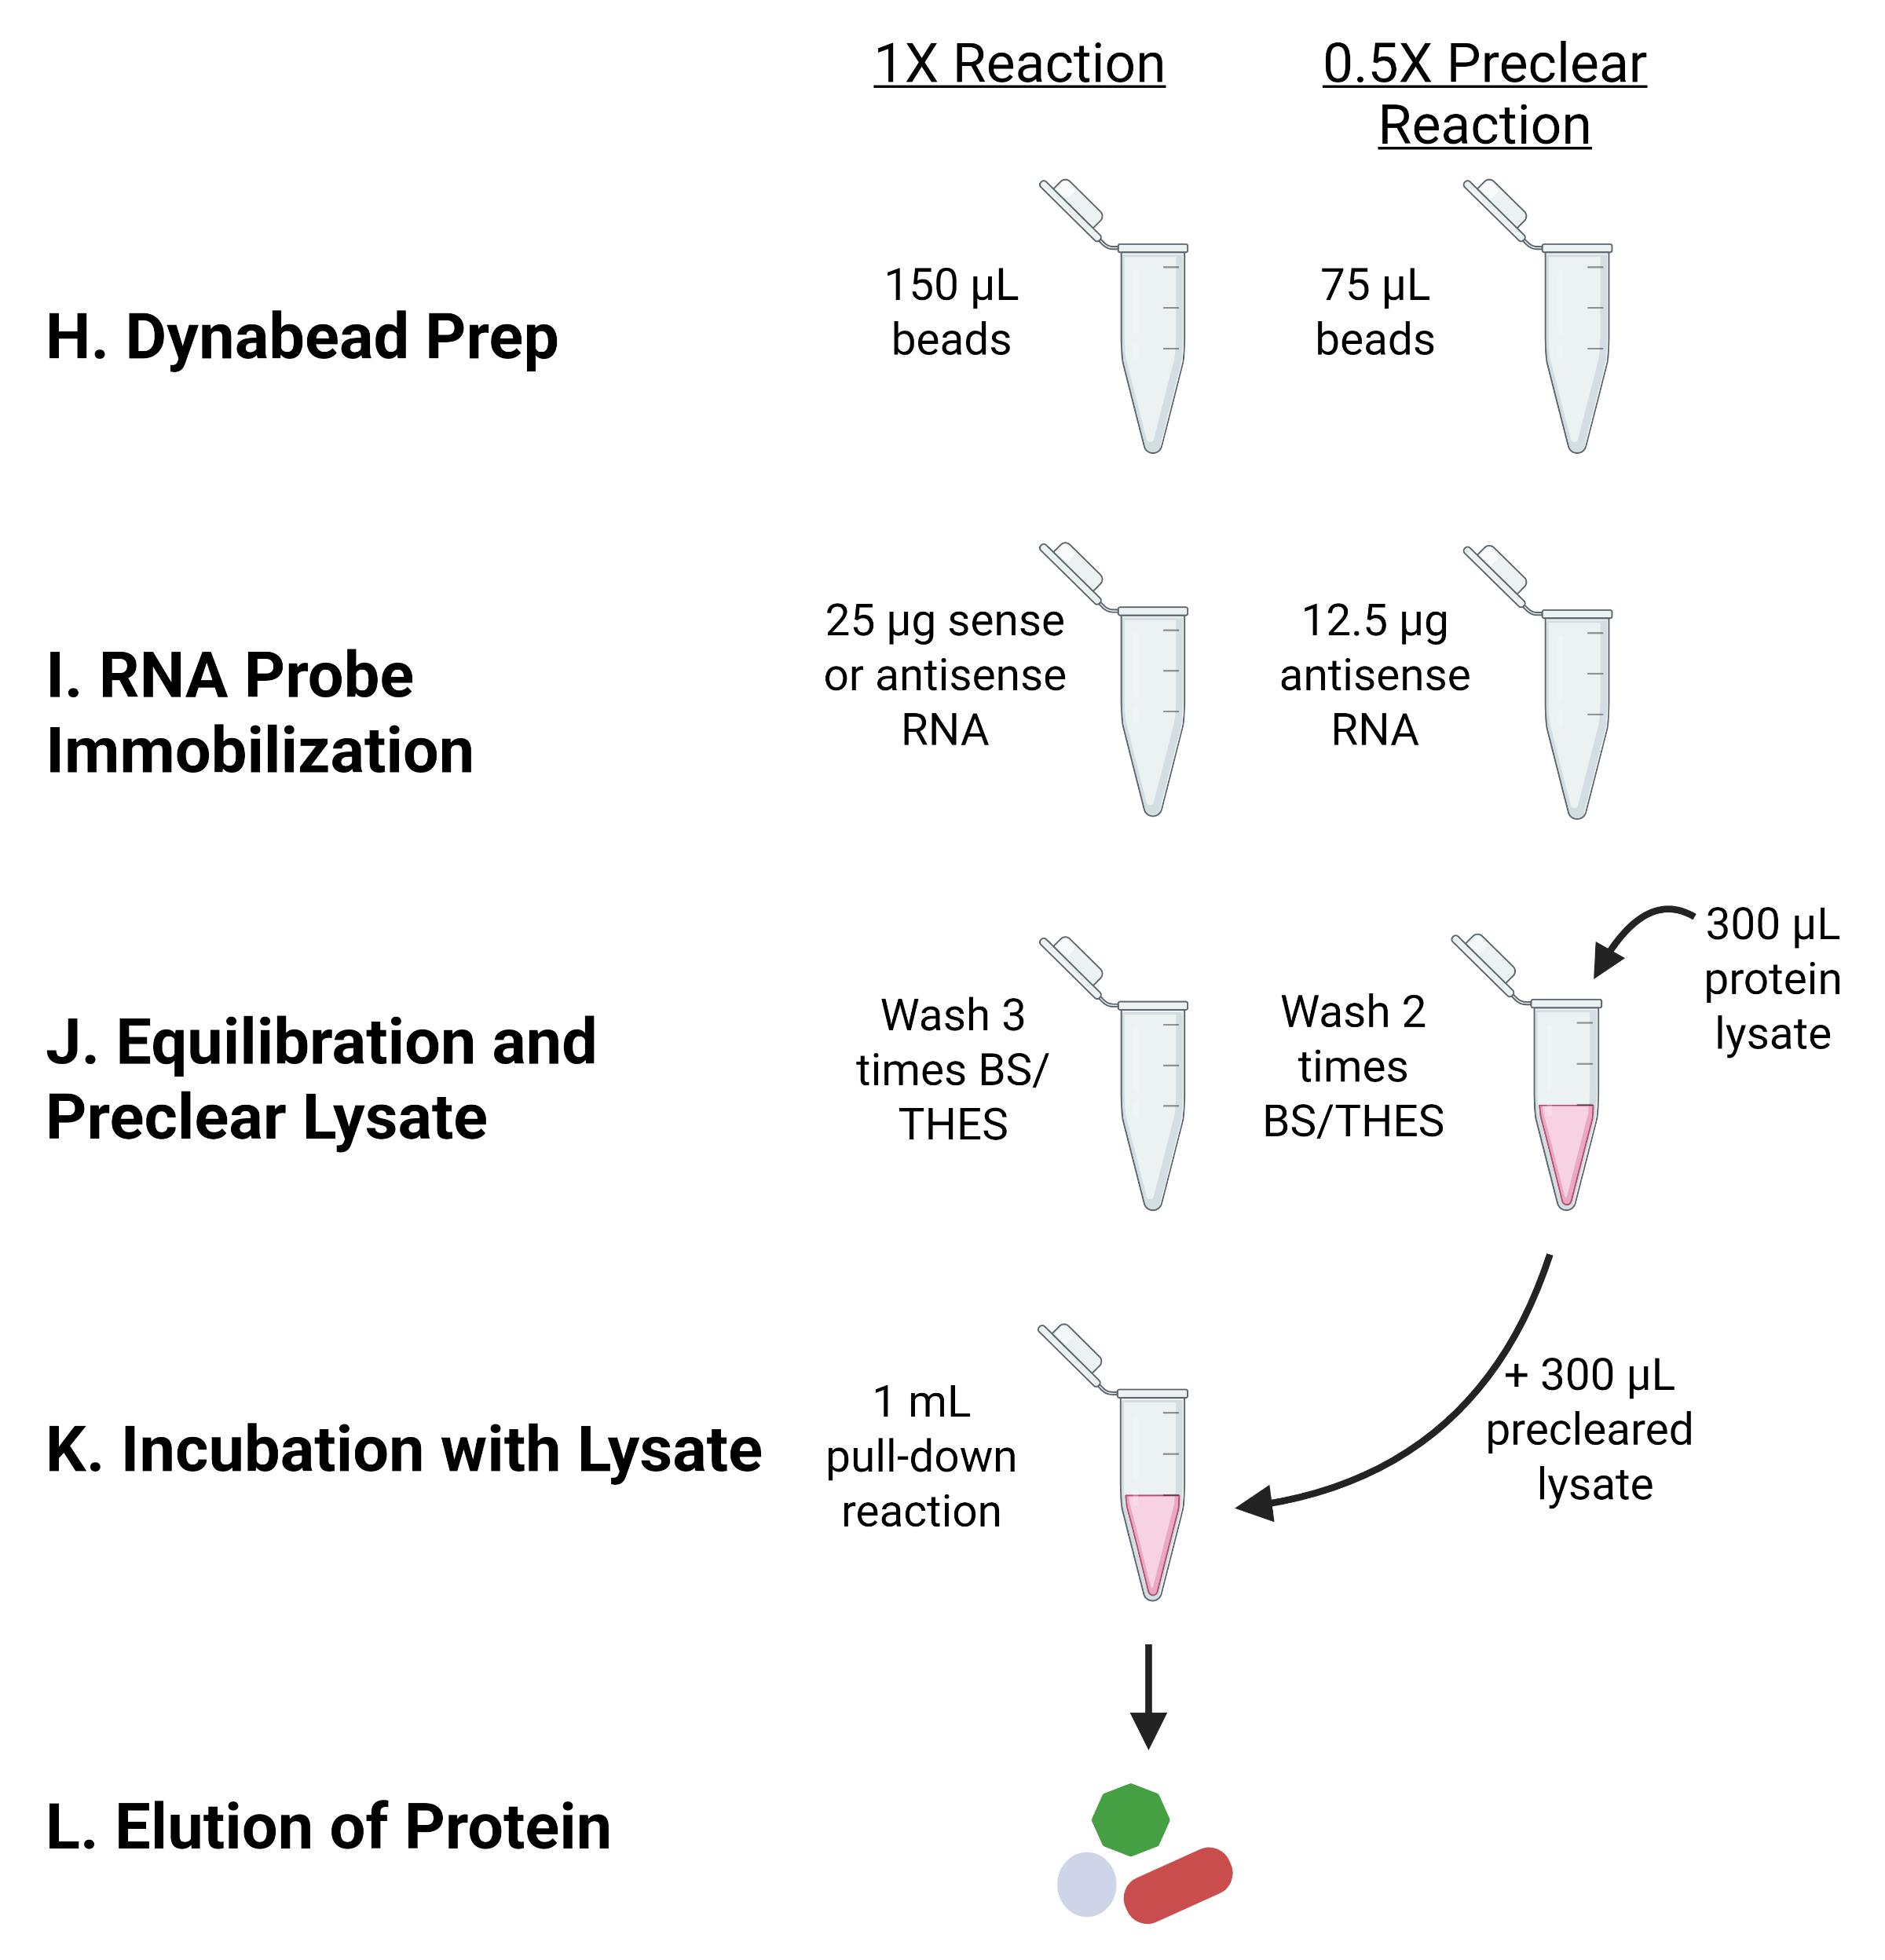
Figure 2. Overview of RNA pull-down assay and protein lysate preclearing. In addition to the 1× sense or antisense RNA pull-down, a 0.5× bead-antisense RNA tube is prepared in parallel to use for preclearing the protein lysate of nonspecific proteins. After the preclearing step, the protein lysate is then incubated with the 1× bead–RNA probe complexes to capture proteins that interact more specifically with the RNA of interest. Each step is labeled with the letter assigned to that section in the protocol.
1. Add 150 μL of Dynabeads (1.5 mg) to one 1.5 mL microcentrifuge tube for each pulldown reaction (1× reaction). To another 1.5 mL microcentrifuge tube, add 75 μL of Dynabeads (0.5× reaction) for the preclearing step of cell lysate.
Notes:
1. Dynabeads M-280 streptavidin are 10 mg/mL (10 μg/μL).
2. The typical binding capacity of Dynabeads according to the manufacturer for single-stranded oligonucleotides is about 200 pmol per 1 mg of Dynabeads, which equals 300 pmol of RNA for 1.5 mg of beads as seen in this protocol. For lncRNA VILMIR with a length of 900 nucleotides, 300 pmol equals about 91 μg. However, the manufacturer also indicates that capacity is inversely related to the number of bases, so there is a reduced binding capacity for large molecules due to steric hindrance. In the following protocol, the authors added 25 μg of lncRNA VILMIR and only observed binding of 8 μg to the beads. Therefore, it is assumed that the longer RNA molecule greatly reduced the binding capacity of the beads. The binding capacity may need to be tested for each RNA molecule.
3. Both microcentrifuge tubes will follow all steps below in parallel, with the 0.5× preclearing microcentrifuge tube adding half of the volumes, as indicated.
2. Immobilize beads with a magnetic stand and remove storage solution.
3. Add 750 μL of 2× B/W (binding/wash) buffer to the 1× tube and 375 μL to the 0.5× tube. Incubate for 30 s.
4. Immobilize beads with a magnetic stand and remove the buffer.
5. Repeat steps H3–4 twice, for a total of three washes.
Note: As Dynabeads are not supplied in RNase-free solutions, perform the following steps after washing for RNA applications.
6. Wash the beads twice in 150 μL of solution A in the 1× tube (75 μL in 0.5× tube). Incubate for 2 min for each wash.
7. Wash the beads twice in 150 μL of solution B in the 1× tube (75 μL in 0.5× tube).
8. Immobilize beads and remove solution B before proceeding with probe immobilization.
I. RNA probe immobilization
1. Following the final wash, add 300 μL of the 2× B/W buffer to the 1× tube containing the washed Dynabeads (150 μL of 2× B/W to the 0.5× preclearing tube).
Note: Final Dynabead concentration should be 5 μg/μL.
2. Add 300 μL of concentrated (sense or antisense) RNA probe (25 μg or 83.33 ng/μL) to the 1× tube to bring the total volume to 600 μL. Mix eight times with a p1000 pipette. For the 0.5× preclearing reaction, add 150 μL of antisense RNA probe (12.5 μg) to 150 μL of washed Dynabeads.
Note: Dilute the RNA in ultrapure water to get 25 μg in 300 μL per reaction. If performing multiple reactions, make a master mix with 10% extra volume. Save the leftover RNA probe to quantify the “pre-probe immobilization” concentration.
3. Incubate the bead and RNA probe mixture at room temperature for 30 min on an orbital shaker at 30 rpm. Gently flick the tubes halfway to prevent the beads from settling to the bottom of the tube.
4. Immobilize the beads using the magnetic stand and remove the supernatant into a different microcentrifuge tube. Save the supernatant tube on ice to quantify unbound (“post-probe immobilization”) RNA.
Notes:
1. As an optional check, the pre-probe immobilization sample can be observed against the post-probe immobilization eluate to determine the relative amount of biotinylated RNA that has been bound to the Dynabeads. Quantify the pre- and post-probe immobilization RNA on a NanoDrop spectrophotometer to check for consistency between RNA binding in sense and antisense reactions. Subtract the post-probe immobilization concentration from the pre-probe immobilization concentration and then multiply by the reaction volume (600 μL) to estimate the amount of RNA that bound to the beads.
2. Generally, the authors observed around 8 μg of RNA binding to the beads in a single reaction.
3. As the input RNA was 25 μg, it is possible to decrease the input RNA from 25 μg and still achieve 8 μg of RNA binding to the beads, but this was not validated by the authors and should be confirmed.
See Troubleshooting if the amount of RNA bound to the beads is significantly lower than 8 μg.
5. Add 750 μL of 2× B/W buffer to the 1× tube and 375 μL to the 0.5× tube. Incubate for 30 s.
6. Wash the bead–RNA complex with 750 μL of 0.5 M TE pH 8.0 in the 1× tube and 375 μL in the 0.5× tube.
7. Immobilize the beads using the magnetic stand and remove the supernatant.
8. Repeat steps I6–7 for a total of three washes.
J. Bead equilibration and preclear lysate
Note: The preclearing step incubates the protein lysate with 0.5× bead–antisense RNA complexes to reduce nonspecific protein binding to the antisense RNA. The precleared lysate is then incubated with the 1× bead–RNA probe complexes.
1. Wash the RNA-bound beads with 750 μL of BS/THES buffer in the 1× tube and 375 μL in the 0.5× tube. Incubate at room temperature for 1 min.
2. Immobilize the beads using the magnetic stand and remove the supernatant.
3. Repeat steps J1–2 for a total of two washes.
4. Resuspend the 0.5× bead–antisense RNA complexes intended for preclearing in 300 μL of protein lysate per reaction.
Note: This volume of protein lysate amounted to approximately 3.6 mg of nuclear or 5.3 mg of cytoplasmic protein lysate from A549 cells but may need to be optimized in other systems.
5. Perform the preclearing step at 4 °C for 30 min on an orbital shaker at 30 rpm. Gently flick the tubes halfway to prevent the beads from settling to the bottom of the tube.
Note: For the 4 °C steps, an orbital shaker can be moved into a refrigerator with an outlet.
6. During the preclearing incubation, wash the 1× sense- or antisense-RNA-bound beads a third time in BS/THES; then, divide evenly between individual reaction tubes (600 μL per reaction) if a master mix was prepared.
K. Dynabead incubation with lysate
1. Immobilize the RNA-bound Dynabeads using the magnetic stand and remove the BS/THES buffer.
2. Resuspend the beads in 980 μL of BS/THES buffer and add 15 μL of SUPERase inhibitor (300 U) and 5 μL of tRNA (50 μg) to make 1 mL total.
Note: An RNase inhibitor is added in this step to account for any RNases that may be in the protein lysate. tRNA is added to bind to nonspecific proteins.
3. Add 300 μL of the precleared lysate to each reaction. Mix six times with a p1000 pipette.
4. Incubate at 4 °C for 1 h on an orbital shaker at 30 rpm. Gently flick the tubes halfway to prevent the beads from settling to the bottom of the tube.
Notes:
1. This 1-h incubation is a good time to quantify the pre- and post-probe immobilization RNA concentration.
2. The RNA–protein incubation was performed at 4 °C as in several other RNA pull-down protocols [14,21,22] to prevent degradation of the RNA and preserve potential secondary/tertiary structure, as higher temperatures can denature the RNA. As RNA secondary/tertiary structures can play a major role in the proteins that bind to the RNA, it is critical to ensure that the RNA is not denatured or degraded, so that the proteins that are identified are more biologically relevant.
5. Immobilize the beads using the magnetic stand and remove the supernatant.
6. Wash the beads on the magnet with 750 μL of BS/THES buffer by pipetting up and down 3–4 times.
Note: At this point, the proteins should be bound to the RNA, so try not to be too harsh when washing to avoid losing protein. The beads can just be washed while remaining on the magnet.
7. Immobilize the beads using the magnetic stand and remove the supernatant.
8. Repeat steps K6–7 for a total of three washes, except on the third wash, resuspend the beads in 150 μL of BS/THES and transfer to a 0.2 mL PCR tube. It is recommended to use a wide-bore p200 pipette tip when resuspending to avoid disrupting RNA–protein interactions.
Note: Transferring the volume to a 0.2 mL tube makes it easier to elute the proteins using a thermal cycler, but a heat block can also be used as necessary.
See Troubleshooting if the beads clump and do not resuspend after pipetting.
L. Elution of protein and probe
1. To completely elute all proteins and the RNA probe itself, resuspend the beads in 30 μL of ultrapure water and incubate at 70 °C for 5 min in a thermal cycler.
Notes:
1. Resuspending the beads can be more vigorous at this step, as the supernatant will be saved for analysis.
2. Eluting the protein in only 30 μL ensures that it can be loaded in a single well in an SDS-PAGE for mass spectrometry. However, elution volumes can be scaled up or down if the proteins will be used for western blot (see General notes).
2. Immobilize the beads using the magnetic stand. Remove the supernatant and transfer to a new 0.2 mL PCR tube.
3. To the 30 μL of supernatant, add 10 μL of 4× Laemmli buffer and mix.
4. Boil the tubes at 95 °C for 10 min in a thermal cycler to denature the proteins.
Pause point: Store the eluted protein at -20 °C for short-term or -80 °C for long-term.
Note: If preparing the eluted protein for mass spectrometry, continue through section M. If the eluted protein will be used for western blot, the denatured protein can be immediately loaded into an SDS-PAGE gel.
M. SDS-PAGE gel fixation and mass spectrometry sample preparation
Note: The following describes how to fix the eluted protein in an SDS-PAGE gel to ship the samples for mass spectrometry. If the protein does not need to be shipped, the protein can also be delivered in liquid form, but it is recommended to follow the requirements of the mass spectrometry core that will be used.
1. Thaw the eluted pull-down protein on ice.
2. Make a 6% SDS-PAGE gel to run in 1× Tris-glycine running buffer.
3. Once the gel has solidified, load the entire pull-down sample as well as 10 μL of the WesternC protein ladder.
Notes:
1. The protein ladder serves as a visual cue to ensure the protein moves into the gel.
2. It is recommended to separate different RNA pull-downs and the ladder by a lane to prevent potential cross-contamination between protein elutions. For example, load the ladder, an empty lane, the sense replicates, an empty lane, and the antisense replicates.
4. Run the gel for approximately 10 min at 60 V or until the entire protein ladder has moved into the gel. As the WesternC protein ladder contains 10 prestained protein bands from 10 to 250 kD, as long as these bands have moved into the gel, it can be assumed that the protein elution samples have also moved into the gel.
5. Open the gel plates to cut the well walls from the top of the gel. Cut a 2-cm horizontal strip from the top of the gel around the protein for further steps.
Note: It is recommended to separate the sense and antisense into their own strips.
6. Put the gel strips into a small container each and add 20 mL of Coomassie blue to stain the gel for 60 min.
7. Remove the Coomassie blue, add de-stain buffer, and incubate on the orbital shaker at 30 rpm for 30 min.
8. Discard the de-stain buffer appropriately and repeat step M7 until the front-loading dye band is gone.
Note: At this point, faint blue bands should be observed in the gel where the protein is located.
See Troubleshooting if protein bands are not observed.
9. Using the colorimetric ladder marks as a reference for size, cut the gel (about 5 × 5 mm) for each sample well and place the gel pieces into labeled 1.7 mL tubes. Cut an empty gel piece of the same size to serve as a background control.
10. Add 1 mL of de-stain buffer to each tube and incubate overnight at room temperature on an orbital shaker at 30 rpm.
11. The next day, remove the de-stain buffer and rinse the gel piece twice with ultrapure water. Remove all water.
Pause point: Store the gel samples at -80 °C until shipment for mass spectrometry.
12. Analyze the protein samples using mass spectrometry. Ensure there is an antisense RNA pull-down sample to serve as a control for nonspecific protein binding.
Note: The authors sent the protein samples to the BIDMC-Harvard Mass Spectrometry Facility and Asara Laboratory for external mass spectrometry identification. Protein samples were subjected to overnight enzymatic digestion with trypsin/LysC, followed by analysis using microcapillary liquid chromatography-tandem mass spectrometry (LC-MS/MS) on a high-resolution Thermo Scientific QExactive HFx Orbitrap mass spectrometer operated in data-dependent acquisition (DDA) mode. MS/MS spectra were searched using Mascot (Matrix Science) for protein identification, and the resulting identifications were further processed using Scaffold (Proteome Software). Please note that there is no specific requirement for mass spectrometry, but it can be achieved following the recommendations of the service core that will be used.
Data analysis
It is recommended to perform three technical replicates for mass spectrometry in both sense and antisense RNA pull-downs to ensure robust protein identification. This means that the same stock of protein lysate is used in three separate pull-downs. If the pull-down is then being validated with western blot, it is recommended to perform three biological replicates; meaning three separate stocks of protein lysate are used in the pull-down. This ensures the results are reproducible between protein stocks.
To prioritize RNA-specific binding proteins, the authors recommend the following analysis after mass spectrometry, as used in [19] to identify VILMIR sense-specific proteins. First, take the average of the peptide spectrum counts in the sense and antisense replicates and calculate an approximate fold-change (FC) value by taking the difference between the sense and antisense peptide counts (sense/antisense). The proteins can then be sorted based on FC value (Table 3). Remove proteins that have an FC of 1, meaning there was no difference between the sense and antisense samples. In addition, remove proteins that were enriched in the antisense samples (FC < 1). Proteins with inconsistent counts between replicates can also be eliminated. For example, a protein that had 9, 5, and 0 peptide counts in the three sense replicates was not kept. Of the remaining proteins, separate the proteins into two main categories: proteins that have peptide spectrum counts in all three replicates of the sense RNA but zero in the antisense replicates (unique binding), and proteins that were enriched (FC > 1) in the sense replicates (enriched binding). To prioritize the more robust proteins, proteins with an FC < 2 can also be removed. Once a narrowed-down list is achieved, perform a literature search of the remaining proteins to predict biological significance and decide which to validate with Western blot. For example, as the authors were studying VILMIR in the context of viral and interferon responses, they focused on proteins with known associations with antiviral and interferon responses. The full list of identified proteins can be found in [19].
Table 3. Example of VILMIR mass spectrometry analysis and protein prioritization
| Protein ID | Mass (kDa) | Sense peptide count | Antisense peptide count | Fold change | Category | ||||
| IFIT3 | 56 kDa | 4 | 7 | 4 | 0 | 0 | 0 | N/A* | Unique to sense |
| IFIT1 | 55 kDa | 10 | 12 | 11 | 1 | 1 | 1 | 11.00 | Enriched in sense |
| ILF2 | 43 kDa | 33 | 33 | 37 | 33 | 28 | 33 | 1.10 | Nonspecific |
| HNRNPU | 91 kDa | 46 | 47 | 41 | 78 | 73 | 83 | 0.57 | Enriched in antisense |
Validation of protocol
This protocol has been used and validated in the following research article:
• John et al. [19]. VILMIR is a trans-acting long noncoding RNA that enhances the host interferon response in human epithelial cells. Journal of Virology (Tables 1 and 2 and Figure 1).
General notes and troubleshooting
General notes
1. Some RNA pull-down protocols attempt to fold the in vitro transcribed RNA into its proper secondary structure by an additional incubation step. For example, one protocol adds a structure buffer (Tris-HCl, KCl, and MgCl2) to the RNA, heats it to 90 °C for 2 min, quenches it on ice for 2 min, and then incubates it at room temperature for 20–30 min [21]. Another protocol denatures the RNA by heating to 65 °C for 10 min and then cooling down slowly to 4 °C [22]. However, when the authors attempted a denaturation step of in vitro transcribed VILMIR and analyzed the RNA on a Bioanalyzer, they observed a total degradation of the RNA. Therefore, this step was not used in the protocol. If a strong secondary structure is predicted for another lncRNA, a folding step may be beneficial, as the structure of the RNA may impact its interactome. However, it is critical to ensure the integrity of the RNA is still intact after this folding step.
2. The RNA pull-down can be scaled up or down depending on the downstream applications. For mass spectrometry, the authors recommend using the larger 1× reaction to allow for broader protein identification. However, if the eluted protein will be used for western blot, a smaller reaction can be used and still have successful detection of target proteins on the western blot. For example, for western blot validation of several target proteins, the authors performed a 0.6× reaction (Table 4), which gave a final elution volume of 60 μL (45 μL of protein with the addition of 15 μL of Laemmli buffer). The authors then only loaded 10 μL of the elution into one lane of the SDS-PAGE gel, meaning six target proteins can be tested per elution. If six target proteins do not need to be tested, the reaction could be scaled down further. For example, a 0.4× reaction would give a final elution volume of 40 μL, which in theory would allow for four target proteins (10 μL each) to be validated by a western blot. Table 4 provides the volumes for scaling a single reaction down. If several replicates are being performed at the same time, it is recommended to make a master mix of the beads and RNA probe with 5%–10% extra volume and then separate into individual pull-down tubes during the lysate incubation.
Table 4. Summary of RNA pull-down reagent volumes
| Reagent and steps | 0.4× reaction | 0.6× reaction | 1× reaction (mass spec) |
|---|---|---|---|
| Dynabeads for full reaction (10 μg/μL) | 600 μg (60 μL) | 900 μg (90 μL) | 1.5 mg (150 μL) |
| Dynabeads for preclearing step (0.5× reaction) | 300 μg (30 μL) | 450 μg (45 μL) | 750 μg (75 μL) |
| Dynabead and probe preparation | |||
| 2× B/W Wash 1–3a | 300 μL | 450 μL | 750 μL |
| Solution A wash 1–2 | 50 μL | 90 μL | 150 μL |
| Solution B wash 1–2 | 50 μL | 90 μL | 150 μL |
| Resuspend in 2× B/W buffer | 120 μL | 180 μL | 300 μL |
| RNA probe for full reaction | 10 μg (120 μL) | 15 μg (180 μL) | 25 μg (300 μL) |
| Antisense probe for preclearing (0.5× reaction) | 5 μg (60 μL) | 7.5 μg (90 μL) | 12.5 μg (150 μL) |
| Probe immobilization for 30 min | |||
| 2× B/W wash | 300 μL | 450 μL | 750 μL |
| 0.5 M TE wash 1–3b | 300 μL | 450 μL | 750 μL |
| Equilibrate the beads 1–3 (BS/THES)c | 300 μL | 450 μL | 750 μL |
| Preclear lysate 30 min | |||
| Protein extractsd | 120 μL | 180 μL | 300 μL |
| Resuspend beads (BS/THES + SUPERase-Inhibitor + tRNA) | |||
| BS/THES | 392 μL | 588 μL | 980 μL |
| SUPERase inhibitor | 6 μL (120 U) | 9 μL (180 U) | 15 μL (300 U) |
| tRNA | 2 μL (20 μg) | 3 μL (30 μg) | 5 μL (50 μg) |
| TOTAL | 400 μL | 600 μL | 1.0 mL |
| Incubation with lysate 1 h | |||
| BS/THES wash 1–2 | 300 μL | 450 μL | 750 μL |
| BS/THES wash 3 (transfer to PCR tube) | 150 μL | 150 μL | 150 μL |
| Elution (ultrapure H2O) | 30 μL | 45 μL | 75 μL (30 μL for mass spec) |
| 4× Laemmli buffer | 10 μL | 15 μL | 25 μL (10 μL for mass spec) |
a This volume is used for a single reaction. However, if a master mix of beads is being prepared, the manual for Dynabeads recommends washing the beads in an equal volume of wash buffer or at least 1 mL.
b If preparing a master mix, it is recommended to use an equal volume of buffer or at least 1 mL.
c The antisense RNA for the preclearing step should be resuspended in the protein lysate on the third wash. For the pull-down reaction tubes, on the third wash, the beads should be resuspended and divided evenly between the individual reaction tubes if a master mix was prepared.
d Protein amounts may need to be optimized for each system. In the authors' system, concentrations of 12 mg/mL for nuclear protein and 17 mg/mL for cytoplasmic protein were used.
Troubleshooting
Problem 1: No bacterial colonies are observed on the plate after ligation and cloning of the lncRNA gene into pGEM-3Z.
Possible cause: If the lncRNA of interest is a different size than VILMIR in this study (900 bases), then the vector:insert ratio may not be optimal.
Solution: Try adjusting the vector:insert ratio. For example, if a much larger lncRNA is being ligated and cloned into pGEM-3Z, a vector:insert ratio of 1:1 may be more appropriate.
Problem 2: After IVT of the lncRNA, a strong biotinylation signal is not detected on the dot blot.
Possible cause: The molar ratio of biotinylated-UTP to standard UTP during IVT needs to be adjusted.
Solution: While a 1:39 molar ratio of biotinylated-UTP to standard UTP was used for IVT of VILMIR, the optimal molar ratio may need to be optimized for a lncRNA with a different sequence composition. Several ratios can be tested and a dot blot performed to determine which ratio provides a better biotinylation signal.
Problem 3: The amount of RNA probe bound to the Dynabeads is significantly lower than the optimized 8 μg.
Possible cause: The amount of biotinylation on the RNA may need to be increased.
Solution: Similar to Problem 2, the optimal molar ratio of biotinylated UTP to standard UTP may need to be optimized for a lncRNA with a different sequence composition. Several ratios can be tested to check which ratio gives the highest amount of RNA binding to the Dynabeads.
Problem 4: Dynabead clumping and inability to resuspend after incubation of the RNA-bound beads with cellular lysate.
Possible cause: The protein concentration in the cellular lysate is too high, causing protein–protein interactions that are harder to resuspend.
Solution: Try diluting the input concentration of cellular lysate.
Problem 5: Faint protein bands are not observed after running the eluted pull-down sample on a gel and staining with Coomassie blue.
Possible cause: The concentration of protein lysate in the pull-down assay is not sufficient.
Solution: Try increasing the amount of protein lysate used in the pull-down assay or concentrating the protein lysate to increase detection.
Acknowledgments
This work was supported by the National Institutes of Health (Grant R21AI147187) and North Carolina State University College of Veterinary Medicine, Raleigh, NC. We thank members of the Carpenter lab from the University of California, Santa Cruz, for their helpful advice in performing the RNA pull-down assay. In addition, members of the Peng lab from North Carolina State University College of Veterinary Medicine provided helpful feedback and suggestions. The Graphical abstract and Figure 2 were created with BioRender. This protocol was validated in John et al. [19]. Previous work from which the protocol was developed and/or modified includes Barnes and Kanhere [14], Xing et al. [20], Seo and Chua [21], Marin-Bejar and Huarte [22], and Chaparian and van Kessel [23].
Author contributions
Conceptualization, K.J., K.D., X.P.; Investigation, K.J., K.D., N.M.; Writing—Original Draft, K.J.; Writing—Review & Editing, K.D., N.M., A.I., X.P.; Funding acquisition, X.P.; Supervision, X.P.
Competing interests
X.P. is the Founder and CEO of and has an equity interest in Depict Bio, LLC. The terms of this arrangement have been reviewed and approved by North Carolina State University in accordance with its policy on objectivity in research.
References
- Mudge, J. M., Carbonell-Sala, S., Diekhans, M., Martinez, J. G., Hunt, T., Jungreis, I., Loveland, J. E., Arnan, C., Barnes, I., Bennett, R., et al. (2025). GENCODE 2025: reference gene annotation for human and mouse. Nucleic Acids Res. 53: D966–D975. https://doi.org/10.1093/nar/gkae1078
- Li, J., Zhang, X. and Liu, C. (2020). The computational approaches of lncRNA identification based on coding potential: Status quo and challenges. Comput Struct Biotechnol J. 18: 3666–3677. https://doi.org/10.1016/j.csbj.2020.11.030
- Mudge, J. M., Ruiz-Orera, J., Prensner, J. R., Brunet, M. A., Calvet, F., Jungreis, I., Gonzalez, J. M., Magrane, M., Martinez, T. F., Schulz, J. F., et al. (2022). Standardized annotation of translated open reading frames. Nat Biotechnol. 40(7): 994–999. https://doi.org/10.1038/s41587-022-01369-0
- Mattick, J. S., Amaral, P. P., Carninci, P., Carpenter, S., Chang, H. Y., Chen, L. L., Chen, R., Dean, C., Dinger, M. E., Fitzgerald, K. A., et al. (2023). Long non-coding RNAs: definitions, functions, challenges and recommendations. Nat Rev Mol Cell Biol. 24(6): 430–447. https://doi.org/10.1038/s41580-022-00566-8
- Chen, X. and Sun, Z. (2021). Novel lincRNA Discovery and Tissue-Specific Gene Expression across 30 Normal Human Tissues. Genes (Basel). 12(5): 614. https://doi.org/10.3390/genes12050614
- Prakrithi, P., Vo, T., Xiong, Z., Vu, H., Nguyen, L. T., Newman, A., Wilhelmey, J., Whitehall, V., Cruz, J. L. G., Wood, S., et al. (2026). Unraveling lncRNA diversity at a single cell resolution and in a spatial context across different cancer types. Nat Methods. 23(6): 1236–1249. https://doi.org/10.1038/s41592-026-03071-4
- Statello, L., Guo, C. J., Chen, L. L. and Huarte, M. (2021). Gene regulation by long non-coding RNAs and its biological functions. Nat Rev Mol Cell Biol. 22(2): 96–118. https://doi.org/10.1038/s41580-020-00315-9
- Yu, X., Zhang, Y., Li, T., Ma, Z., Jia, H., Chen, Q., Zhao, Y., Zhai, L., Zhong, R., Li, C., et al. (2017). Long non-coding RNA Linc-RAM enhances myogenic differentiation by interacting with MyoD. Nat Commun. 8(1): e1038/ncomms14016. https://doi.org/10.1038/ncomms14016
- Hu, G., Lou, Z. and Gupta, M. (2014). The Long Non-Coding RNA GAS5 Cooperates with the Eukaryotic Translation Initiation Factor 4E to Regulate c-Myc Translation. PLoS One. 9(9): e107016. https://doi.org/10.1371/journal.pone.0107016
- McHugh, C. A. and Guttman, M. (2018). RAP-MS: A Method to Identify Proteins that Interact Directly with a Specific RNA Molecule in Cells. Methods Mol Biol. 1649: 473–488. https://doi.org/10.1007/978-1-4939-7213-5_31
- Chu, C., Zhang, Q. C., da Rocha, S. T., Flynn, R. A., Bharadwaj, M., Calabrese, J. M., Magnuson, T., Heard, E. and Chang, H. Y. (2015). Systematic Discovery of Xist RNA Binding Proteins. Cell. 161(2): 404–416. https://doi.org/10.1016/j.cell.2015.03.025
- Ramanathan, M., Porter, D. F. and Khavari, P. A. (2019). Methods to study RNA–protein interactions. Nat Methods. 16(3): 225–234. https://doi.org/10.1038/s41592-019-0330-1
- Yang, Y., Wen, L. and Zhu, H. (2015). Unveiling the hidden function of long non-coding RNA by identifying its major partner-protein. Cell Biosci. 5(1): e1186/s13578–015–0050–x. https://doi.org/10.1186/s13578-015-0050-x
- Barnes, C. and Kanhere, A. (2016). Identification of RNA–Protein Interactions Through In Vitro RNA Pull-Down Assays. Methods Mol Biol. 1480: 99–113. https://doi.org/10.1007/978-1-4939-6380-5_9
- Carpenter, S., Aiello, D., Atianand, M. K., Ricci, E. P., Gandhi, P., Hall, L. L., Byron, M., Monks, B., Henry-Bezy, M., Lawrence, J. B., et al. (2013). A Long Noncoding RNA Mediates Both Activation and Repression of Immune Response Genes. Science. 341(6147): 789–792. https://doi.org/10.1126/science.1240925
- Zhao, L., Xia, M., Wang, K., Lai, C., Fan, H., Gu, H., Yang, P. and Wang, X. (2020). A Long Non-coding RNA IVRPIE Promotes Host Antiviral Immune Responses Through Regulating Interferon β1 and ISG Expression. Front Microbiol. 11: e00260. https://doi.org/10.3389/fmicb.2020.00260
- Jiang, M., Zhang, S., Yang, Z., Lin, H., Zhu, J., Liu, L., Wang, W., Liu, S., Liu, W., Ma, Y., et al. (2018). Self-Recognition of an Inducible Host lncRNA by RIG-I Feedback Restricts Innate Immune Response. Cell. 173(4): 906–919.e13. https://doi.org/10.1016/j.cell.2018.03.064
- John, K., Huntress, I., Smith, E., Chou, H., Tollison, T. S., Covarrubias, S., Crisci, E., Carpenter, S. and Peng, X. (2025). Human long noncoding RNA VILMIR is induced by major respiratory viral infections and modulates the host interferon response. J Virol. 99(4): e00141–25. https://doi.org/10.1128/jvi.00141-25
- John, K., Smith, E., Istishin, A., Mahmood, N., Diveley, K., Tollison, T. S., Carpenter, S. and Peng, X. (2026). VILMIR is a trans -acting long noncoding RNA that enhances the host interferon response in human epithelial cells. J Virol. 100(1): e01380–25. https://doi.org/10.1128/jvi.01380-25
- Xing, Z., Lin, C. and Yang, L. (2016). LncRNA Pulldown Combined with Mass Spectrometry to Identify the Novel LncRNA-Associated Proteins. Methods Mol Biol. 1402: 1–9. https://doi.org/10.1007/978-1-4939-3378-5_1
- Seo, J. S. and Chua, N. H. (2019). Identification of Long Noncoding RNA-Protein Interactions Through In Vitro RNA Pull-Down Assay with Plant Nuclear Extracts. Methods Mol Biol. 1933: 279–288. https://doi.org/10.1007/978-1-4939-9045-0_17
- Marín-Béjar, O. and Huarte, M. (2015). RNA Pulldown Protocol for In Vitro Detection and Identification of RNA-Associated Proteins. Methods Mol Biol. 1206: 87–95. https://doi.org/10.1007/978-1-4939-1369-5_8
- Chaparian, R. R. and van Kessel, J. C. (2021). Promoter Pull-Down Assay: A Biochemical Screen for DNA-Binding Proteins. Methods Mol Biol. 2346: 165–172. https://doi.org/10.1007/7651_2020_307
Article Information
Publication history
Received: Aug 18, 2026
Accepted: Oct 14, 2026
Available online: Nov 11, 2026
Published: Nov 20, 2026
Copyright
© 2026 The Author(s); This is an open access article under the CC BY-NC license (https://creativecommons.org/licenses/by-nc/4.0/).
How to cite
John, K., Diveley, K., Mahmood, N., Istishin, A. and Peng, X. (2026). Identification of Proteins Interacting With Target lncRNAs Using In Vitro Biotinylated RNA Pull-Down Assay and Mass Spectrometry. Bio-protocol 16(22): e5879. DOI: 10.21769/BioProtoc.5879.

 Download Citation in RIS Format
Do you have any questions about this protocol?
Post your question to gather feedback from the community. We will also invite the authors of this article to respond.
 Post a Question


