


- Protocols

- Articles and Issues
- For Authors
- About
- Become a Reviewer


A Multiplexed Assay for High-Throughput Evaluation of In Vitro A-to-I Editing

Published: Vol 16, Iss 23, Dec 5, 2026 DOI: 10.21769/BioProtoc.5876 Views: 38
Reviewed by: Neha NandwaniMuskan Gupta
 PDF
 Ask a question


Protocol Collections
Comprehensive collections of detailed, peer-reviewed protocols focusing on specific topics



Abstract
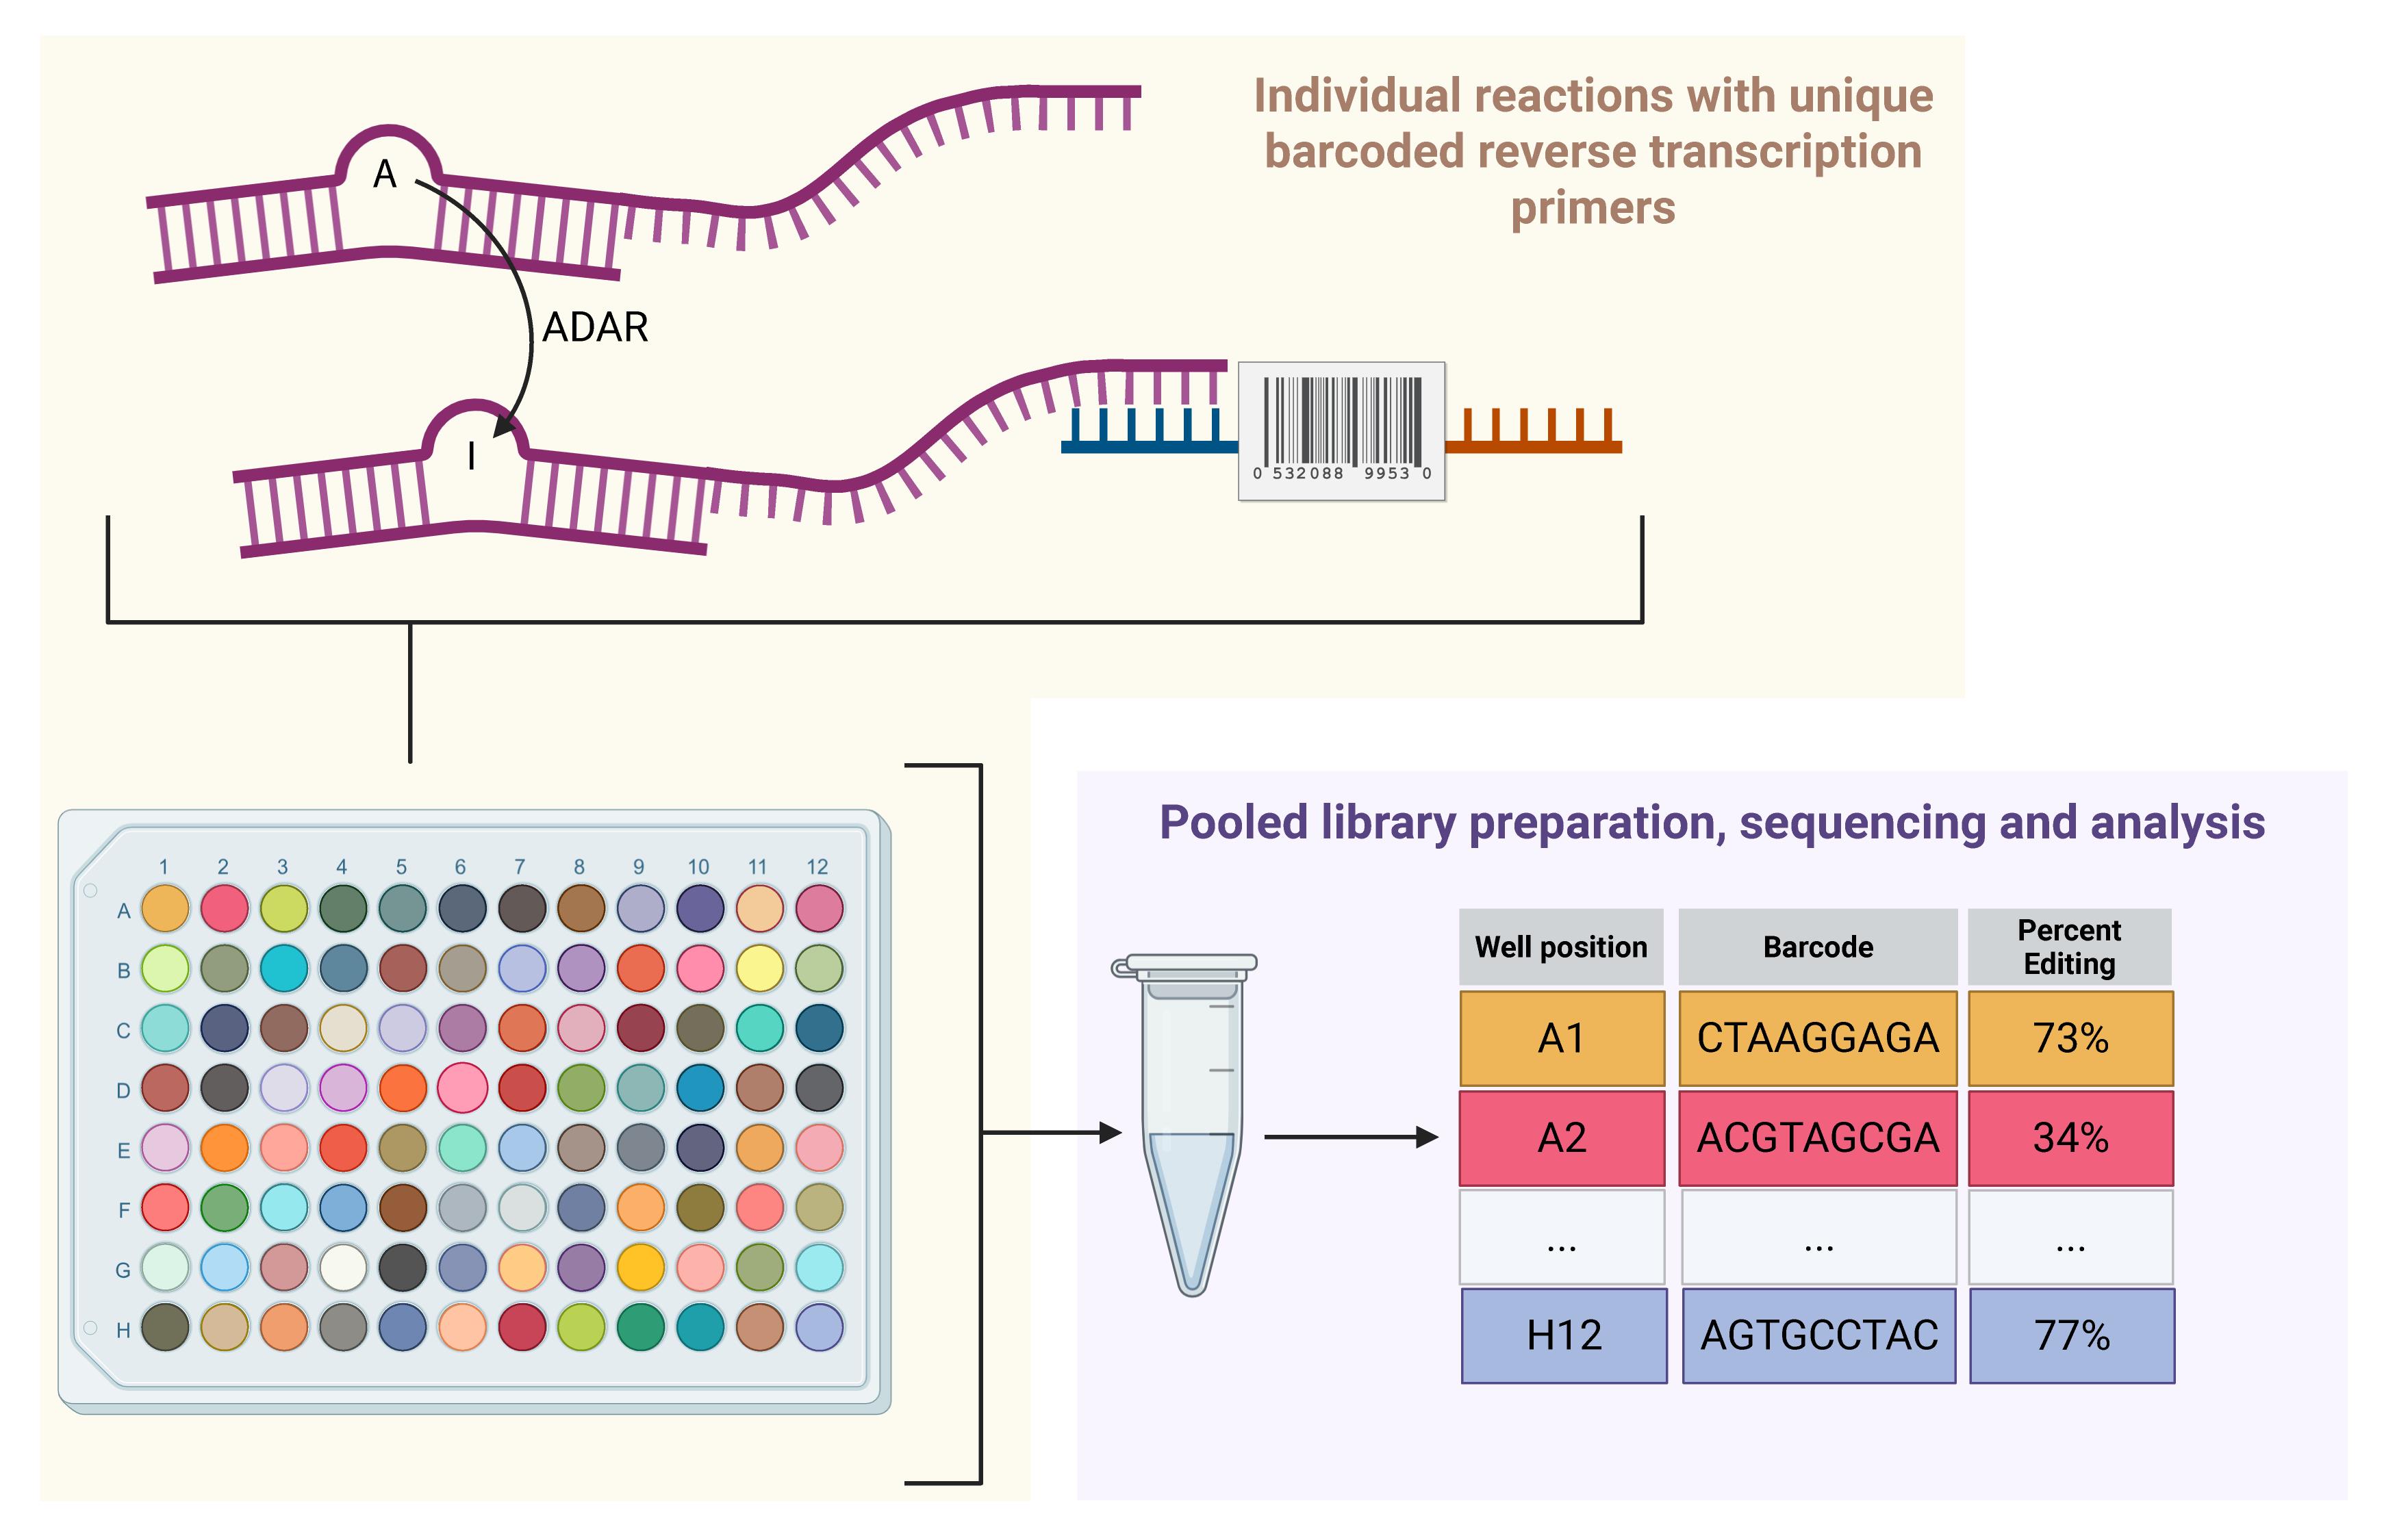
Adenosine-to-inosine (A-to-I) RNA editing, catalyzed by ADAR1, occurs on double-stranded RNA (dsRNA) and plays a key role in innate immunity. Editing of endogenous dsRNAs prevents aberrant activation of dsRNA sensors and resulting inflammation. This function of ADAR1 is essential in many cancers, making ADAR1 a promising therapeutic target. Current approaches for measuring A-to-I editing in biochemical assays, which often rely on Sanger sequencing, are limited in throughput. Thus, there is a need to develop high-throughput A-to-I editing assays to enable efficient screening of potential ADAR1 inhibitors. We developed a new high-throughput A-to-I editing assay that uses barcoded reverse-transcription primers to enable pooling and sequencing of multiple assays performed in parallel. Starting from an existing Sanger-based method, we optimized aspects of the A-to-I editing reaction, cDNA synthesis, and downstream processing to facilitate high-throughput assays and substantially lower per-reaction costs. In brief, immediately following the A-to-I editing reaction, cDNA is synthesized using well-specific barcoded reverse-transcription primers. Subsequently, cDNA from all reactions is pooled and processed as one sample for next-generation sequencing, with the potential for further multiplexing by indexed sequencing adapters. Our approach enables parallel measurement of RNA editing under multiple conditions in a plate-based format while significantly reducing the time, labor, and costs required compared to traditional methods. This high-throughput assay provides a scalable platform for screening ADAR1 inhibitors and may accelerate the development of targeted therapies for cancer.
Key features
• Percent A-to-I editing determined by count-based next-generation sequencing.
• Utilizes a widely used A-to-I editing substrate.
Keywords: RNA modification A-to-I editing
RNA-binding proteins
In vitro transcription
High-throughput screening
Graphical overview
Background
The adenosine deaminase acting on RNA (ADAR) family of proteins, including human ADAR1 and ADAR2, use their deaminase activity to edit adenosine to inosine in double-stranded RNAs (dsRNA), in a process known as A-to-I editing. In humans, ADAR1 edits millions of sites, primarily targeting inverted Alu repeats [1,2]. Editing by ADARs affects RNA structure, processing, localization, translation, and stability, and can even recode mRNAs [3]. These functions make both ADAR1 and ADAR2 essential: ADAR2 for its role in recoding the mRNA encoding GRIA2 [4,5], and ADAR1 for its role in suppressing dsRNA sensing [6–8]. Editing by ADAR1 is thought to destabilize the secondary structure of RNAs, making them less double-stranded and thus preventing detection by the dsRNA sensor MDA5 [6–8].
Inhibition of ADAR1 has therapeutic potential both in cancer and viral infection. Due to ADAR1’s role as a suppressor of dsRNA sensing and the elevated expression of dsRNA sensors in some cancer cells, ADAR1 has become a promising therapeutic target for multiple cancers [9–11]. Similarly, ADAR1 has pro-viral functions in infection by measles and several other viruses [12,13]. As such, there is considerable interest in identifying potent inhibitors of ADAR1. While multiple ADAR1 inhibitors have been reported in the literature, most have not proven to be selective inhibitors of ADAR1 in follow-up studies [14–18].
Conversion of adenosine to inosine by ADAR can be easily detected by multiple methods [19–26]. Common approaches rely on either sequencing of a cDNA copy of an edited RNA or enzymatic cleavage of edited RNA using the inosine-specific endonuclease V (EndoV). Sequencing benefits from reverse transcriptase incorporating a “C” opposite of “I” in the edited RNA. Thus, A-to-I editing events are easily detected as A-to-G substitutions in sequencing data. Next-generation (Illumina or other modalities) and Sanger sequencing are commonly used to measure A-to-I editing, with Sanger typically being used to evaluate editing at a small number of sites in RNA isolated from cells or tissues, or to evaluate editing in in vitro biochemical assays. Enzymatic cleavage of edited RNA by EndoV can be used in combination with next-generation sequencing to evaluate editing across the transcriptome or to evaluate editing in biochemical assays when combined with electrophoresis to quantify cleavage. Neither Sanger sequencing nor EndoV-based approaches are well-suited for high-throughput screening for ADAR1 inhibitors. Sanger sequencing is relatively labor-intensive and cost-prohibitive at larger scales. Similarly, the combination of EndoV and electrophoresis to quantify cleavage would be highly labor-intensive. A luciferase-based cellular assay was previously developed to enable high-throughput screening to identify ADAR inhibitors [27]. This system uses an mRNA encoding two luciferases separated by a stop codon that, when edited by ADAR1, allows translation of the downstream luciferase. Inhibition of A-to-I editing would thus result in reduced signal from the downstream luciferase. While this approach has been used successfully to identify putative ADAR1 inhibitors, it has two main drawbacks: 1) it is a cellular assay and thus will miss compounds that have poor membrane permeability, and 2) it has a high false-positive rate, as determined by rescreening of initial hits using the same assay or an orthogonal approach [18,27].
Here, we describe a high-throughput biochemical assay for A-to-I editing by ADAR1 (Figure 1). This assay builds upon prior approaches that measure editing by Sanger sequencing of PCR-amplified cDNA generated from reverse transcription of an ADAR1 substrate RNA [28,29]. To enable readout by next-generation sequencing, our assay uses barcoded reverse-transcription primers. Reverse transcription takes place immediately following and in the same well as A-to-I editing. Subsequently, cDNA from all reactions is pooled and used to generate an Illumina sequencing library. Analysis of A-to-I editing is performed using a custom analysis pipeline. Overall, this assay is considerably less expensive than the Sanger-based alternative. The cost savings arise from less labor, reagents, and sequencing costs. This assay is well-suited for the evaluation of putative ADAR1 inhibitors or to study ADAR1 mutants.
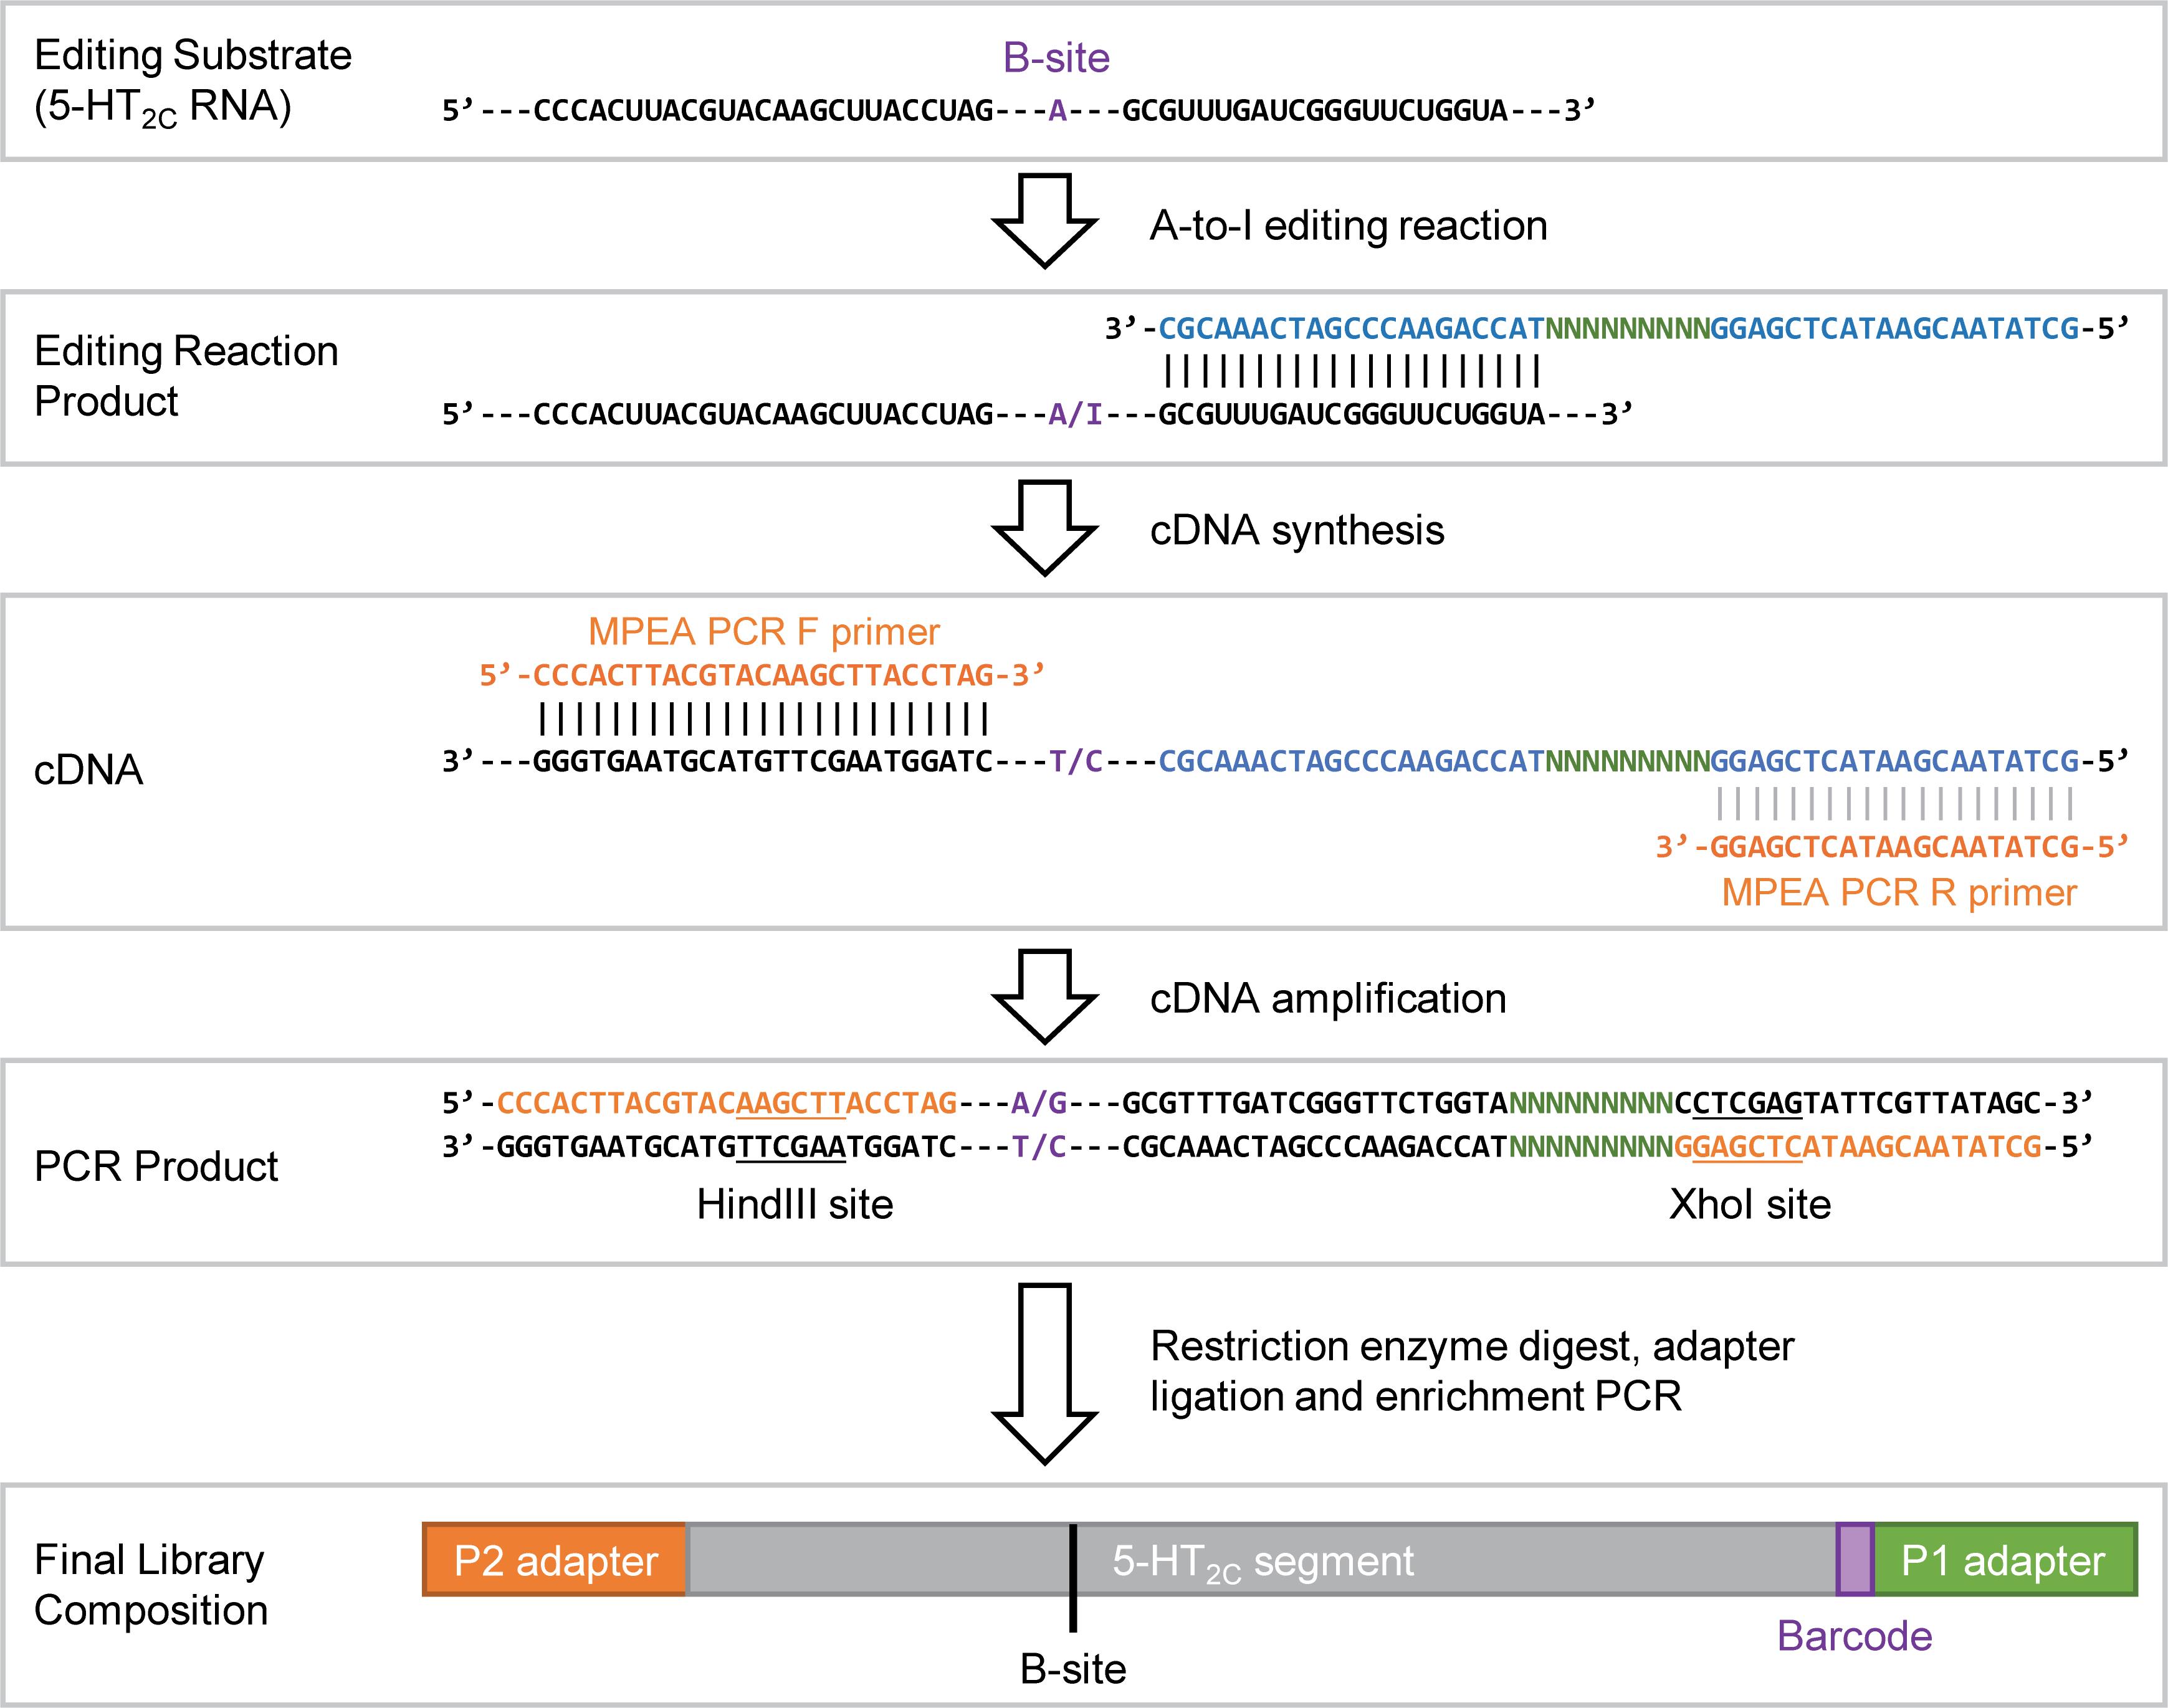
Figure 1. Diagram describing the assay. The diagram depicts how the barcoded reverse transcription primers are used to track RNA editing occurring in each well of the assay. Some portions of the editing substrate, its cDNA copy, and the sequencing adapters are not shown due to the length of those molecules; the sequence that is missing is represented by “---”. For the B-site, “A/I” in the RNA, or “T/C” or “A/G” in the cDNA or PCR product represents the possible identities of the nucleotide at that position; for the RNA, “I” for inosine if the B-site is edited, or “A” if no editing occurs.
Materials and reagents
Reagents
1. RNase inhibitor murine (New England BioLabs, catalog number: M0314L)
2. Yeast tRNA (Thermo Fisher Scientific, catalog number: AM7119)
3. HiScribe T7 Quick High Yield RNA Synthesis Kit (New England Biolabs, catalog number: E2050S); includes 100 mM DTT, T7 RNA polymerase mix, NTP buffer mix, and DNase I (RNase-free)
4. Deoxynucleotide triphosphate (dNTP) solution mix (New England BioLabs, catalog number: N0447L)
5. PrimeSTAR Max Premix (2×) (TaKaRa, catalog number: R045)
6. pTwist-5HT (TwistBioscience, special order, clonal gene inserted into the vector “pTwist Amp High Copy,” see File S1 for annotated plasmid sequence)
7. pTwist-5HT_edit (TwistBioscience, special order, clonal gene inserted into the vector “pTwist Amp High Copy,” see File S2 for annotated plasmid sequence)
8. ADAR1 (p150), FLAG-tag recombinant (BPS Bioscience, catalog number: 100472-1)
9. KpnI-HF (New England Biolabs, catalog number: R3142S)
10. XhoI (New England Biolabs, catalog number: R0146S)
11. HindIII-HF (New England Biolabs, catalog number: R3104S)
12. T4 DNA ligase (New England Biolabs, catalog number: M0202L)
13. Protoscript II reverse transcriptase (New England Biolabs, catalog number: M0368S), includes 5× ProtoScript II reaction buffer, 100 mM DTT, and ProtoScript II reverse transcriptase, 200,000 units/mL
14. rCutSmart (New England Biolabs, catalog number: B6004S)
15. 10× T4 DNA ligase buffer (New England Biolabs, catalog number: B0202S)
16. T4 polynucleotide kinase (New England Biolabs, catalog number: M0201S)
17. Qubit 1× dsDNA Broad Range Assay kit (Invitrogen, catalog number: Q33265)
18. Qubit RNA Broad Range Assay kit (Invitrogen, catalog number: Q32852)
19. Nuclease-free water, HyPure molecular biology–grade water (Cytiva, catalog number: SH30538.03)
20. Agarose (Fisher, catalog number: BP160500)
21. 100 bp DNA ladder (New England Biolabs, catalog number: N3231L)
22. 1 kb DNA marker (New England Biolabs, catalog number: N3232S)
23. Gel loading dye, purple (6×) (New England BioLabs, catalog number: B7024S)
24. Buffer kit, RNase-free (Invitrogen, catalog number: AM9010); includes 1 M Tris-HCl pH 7, 1 M Tris-HCl pH 8, 2 M potassium chloride (KCl), 0.5 M ethylenediaminetetraacetic acid (EDTA), and 5 M NaCl
25. NP-40 (Nonidet P-40 substitute) (Research Products International, catalog number: N59000-500.0)
26. Glycerol (Sigma-Aldrich, catalog number: G5516-100ML)
27. Potassium glutamate, L-Glutamic acid potassium salt monohydrate (Sigma-Aldrich, catalog number: G1149-100G)
28. Tris base (Fisher, catalog number: BP154-1)
29. Boric acid (Fisher, catalog number: A73-3)
30. 0.5 M EDTA pH 8.0 (Thermo Scientific, catalog number: AAJ15694AP)
31. SeeGreen Nucleic Acid Stain 20,000× (miniPCR bio, catalog number: RG-1550-10)
32. Monarch Spin RNA Cleanup kit (New England Biolabs, catalog number: T2040S)
33. Monarch PCR & DNA Clean Up kit (New England Biolabs, catalog number: T1030L)
34. Monarch Spin DNA Gel Extraction kit (New England Biolabs, catalog number: T1120L)
35. Ultrapure water from a Milli-Q or similar water purification system
36. Oligonucleotides (Table 1)
Table 1. Oligonucleotides (* phosphorothioate bond, italicized nucleotides are barcode sequences)
| Name | Sequence (5′ – 3′) |
|---|---|
| MPEA Test RT primer | GCTATAACGAATACTCGAGGGCTCTGATGTACCAGAACCCGATCAAACGC |
| MPEA Library RT primers | See Table S1 |
| MPEA PCR F primer | CCCACTTACGTACAAGCTTACCTA*G |
| MPEA PCR R primer | GCTATAACGAATACTCGAG*G |
| P1 XhoI F (Illumina adapter) | AATGATACGGCGACCACCGAGATCTACACTCTTTCCCTACACGACGCTCTTCCGATCTGCTCGAT |
| P1 XhoI R (Illumina adapter) | T*CGAATCGAGCAGATCGGAAGAGCGTCGTGTAGGGAAAGAGTGTAGATCTCGGTGGTCGCCGTATCATT |
| P2 HindIII F (Illumina adapter) | A*GCTAGATCGGAAGAGCACACGTCTGAACTCCAGTCACAGGTCACGCATCTCGTATGCCGTCTTCTGCTTG |
| P2 HindIII R (Illumina adapter) | CAAGCAGAAGACGGCATACGAGATGCGTGACCTGTGACTGGAGTTCAGACGTGTGCTCTTCCGATCT |
| Il enrich F primer | AATGATACGGCGACCACCGAG |
| Il enrich R primer | CAAGCAGAAGACGGCATACGA |
Solutions
1. 2× template annealing buffer (see Recipes)
2. 2× reaction buffer solution (see Recipes)
3. 1.5% agarose in TBE solution (see Recipes)
4. 50% glycerol solution (see Recipes)
5. 1 M potassium glutamate (see Recipes)
6. 10% NP-40 (see Recipes)
7. 5× and 1× TBE (see Recipes)
8. 10 μg/mL yeast tRNA working solution (see Recipes)
9. TE buffer (see Recipes)
10. DNA marker working solution (see Recipes)
Recipes
1. 2× template annealing buffer (10 mL)
| Reagent | Final concentration | Quantity or volume |
| 1 M Tris-HCl (pH 7.0) | 20 mM, pH 7.5 | 140 μL |
| 1 M Tris-HCl (pH 8.0) | 60 μL | |
| 0.5 M EDTA pH 8.0 | 2 mM | 40 μL |
| 5 M NaCl | 200 mM | 400 μL |
| Nuclease-free water | N/A | 9.4 mL |
Add water, followed by the remaining ingredients (in any order) to a 50 mL Falcon tube and vortex to mix. Store at room temperature. This solution does not need to be freshly prepared.
2. 2× reaction buffer solution (20 mL)
| Reagent | Final concentration | Quantity or volume |
| 1 M Tris-HCl (pH 7.0) | 15 mM, pH 7.5 | 420 μL |
| 1 M Tris-HCl (pH 8.0) | 180 μL | |
| 2 M KCl | 52 mM | 520 μL |
| 1 M potassium glutamate | 80 mM | 1.6 mL |
| 0.5 M EDTA pH 8.0 | 3 mM | 120 μL |
| 10% NP-40 | 0.006% (v/v) | 12 μL |
| 50% glycerol | 8% (v/v) | 3.2 mL |
| Nuclease-free water | N/A | 13.95 mL |
Add water, followed by the remaining ingredients (in any order) to a 50 mL Falcon tube and vortex to mix. Store at room temperature. This solution does not need to be freshly prepared.
3. 1.5% agarose in TBE solution
| Reagent | Final concentration | Quantity or volume |
|---|---|---|
| Agarose | 1.5% (w/v) | 7.5 g |
| 1× TBE | 1× | 500 mL |
| Total | N/A | 500 mL |
Add agarose and TBE into a glass media bottle. With the cap on loosely, microwave and swirl until the agarose has fully dissolved into solution. Store at room temperature or use to pour a gel while melted; allow the solution to cool enough to hold the bottle before pouring a gel. If stored at room temperature, microwave again to melt before pouring a gel. Add a nucleic acid stain (SeeGreen, final concentration of 1×) to the gel during casting, immediately after pouring the gel. The gel solution without nucleic acid stain does not need to be freshly prepared.
4. 50% glycerol solution
| Reagent | Final concentration | Quantity or volume |
|---|---|---|
| Glycerol | 50% (v/v) | 20 mL |
| Nuclease-free water | N/A | 20 mL |
| Total | N/A | 40 mL |
Prepare in a 50 mL Falcon tube. Add water first, followed by glycerol. Glycerol is thick and challenging to pipette. Use a 25 mL serological pipette and slowly draw up the desired volume. Add directly to the water and pipette up and down to mix and remove glycerol from the pipette. Vortex thoroughly and store at room temperature. This solution does not need to be freshly prepared.
5. 1 M potassium glutamate solution
| Reagent | Final concentration | Quantity or volume |
|---|---|---|
| L-Glutamic acid potassium salt monohydrate | 1 M | 30.48 g |
| Nuclease-free water | N/A | Up to 150 mL |
| Total | N/A | 150 mL |
Prepare in a glass beaker with a magnetic stir bar. Add water followed by glutamic acid. Mix on a stir plate until fully dissolved. Filter and store at room temperature. This solution does not need to be freshly prepared.
6. 10% NP-40
| Reagent | Final concentration | Quantity or volume |
|---|---|---|
| NP-40 | 10% | 1 mL |
| Nuclease-free water | N/A | 9 mL |
| Total | N/A | 10 mL |
Prepare in a 15- or 50-mL conical tube. Add water first, then NP-40. NP-40 is a thick solution. Use a serological pipette and pipette slowly. Add the NP-40 directly to the water and pipette up and down several times to remove the NP-40 from the pipette. Vortex to mix. Store at room temperature. This solution does not need to be freshly prepared.
7. 5× and 1× TBE
| Reagent | Final concentration | Quantity or volume |
|---|---|---|
| Tris base | 446 mM | 108 g |
| Boric acid | 446 mM | 55 g |
| 0.5 M EDTA, pH 8.0 | 10 mM | 40 mL |
| Ultrapure water | N/A | Up to 2 L |
| Total | N/A | 2 L |
Prepare in a beaker sufficient to hold 2 L. Add 1 L of water and a stir bar to the beaker on a stir plate. Slowly add the Tris base and boric acid. Once dissolved, add the EDTA. Transfer the solution to a 2-L graduated cylinder and bring to a total of 2 L with water. A final pH adjustment is not needed. Mix well and filter. Can be stored at room temperature. To make 1× TBE, dilute 5× TBE with ultrapure water to 1×. This solution does not need to be freshly prepared.
8. 10 μg/mL yeast tRNA working solution
| Reagent | Final concentration | Quantity or volume |
|---|---|---|
| Yeast tRNA (10 mg/mL) | 10 μg/mL | 1 μL |
| Nuclease-free water | N/A | 999 μL |
| Total | N/A | 1 mL |
Prepare in a 1.7 mL microfuge tube. Add water first. Vortex to ensure the solution is fully mixed. Store at -20 °C. This solution does not need to be freshly prepared.
9. TE buffer
| Reagent | Final concentration | Quantity or volume |
|---|---|---|
| 1 M Tris pH 8.0 | 10 mM | 0.5 mL |
| 0.5 M EDTA | 0.1 mM | 10 μL |
| Water | N/A | 49.49 mL |
| Total | N/A | 50 mL |
Prepare in a 50 mL conical tube. Add water first. Vortex to ensure the solution is fully mixed. Store at room temperature. This solution does not need to be freshly prepared.
10. DNA marker working solution
| Reagent | Final concentration | Quantity or volume |
|---|---|---|
| 100 bp or 1 kb DNA marker (500 μg/mL) | 10 μg/mL | 50 μL |
| 6× Purple Loading Dye | 1× | 170 |
| TE buffer | N/A | 780 μL |
| Total | N/A | 1 mL |
Prepare in a 1.7 mL microfuge tube. Vortex to ensure the solution is fully mixed. Store at -20 °C. Use 20 μL per lane. This solution does not need to be freshly prepared.
Laboratory supplies
1. 1.7 mL microfuge tubes (Genesee, catalog number: 24-282)
2. 96-well PCR plate (MidSci, catalog number: PR-PCR2196F)
3. Repeating pipette tips (Eppendorf, catalog numbers: 0030089634, 0030089618)
4. Reagent reservoir (Fisher, catalog number: 01-670-454)
5. 50 mL conical tubes (Genesee, catalog number: 21-108)
6. 15 mL conical tubes (Genesee, catalog number: 21-103)
7. 150 mL filter bottle unit (Fisher, catalog number: FB12566500)
8. 1 L filter bottle unit (Fisher, catalog number: FB12566506)
9. Pipette tips, filtered, nuclease-free (p10, p20, p200, p1000)
10. PCR plate seals (Genesee, catalog number: 12-170)
11. Foil plate seals (Corning, catalog number: 6570)
12. PCR strip tubes (Genesee, catalog number: 27-125)
13. Spatula
14. Weighing boats
15. Magnetic stir bar
16. Glass media bottles (250 mL, 500 mL, 1 L)
17. Glass beakers (200 mL, 500 mL, 2 L)
18. Graduated cylinders (500 mL, 1 L, 2 L)
Equipment
1. Freezer (-20 °C)
2. Ultra-low freezer (-80 °C)
3. Refrigerator (4 °C)
4. Tube racks (microcentrifuge, 15 and 50 mL conicals)
5. Microcentrifuge (Eppendorf, model: 5420)
6. Mini microcentrifuge (Corning, catalog number: 6770)
7. Thermocycler (Bio-Rad, model: T100)
8. Vortex mixer, vortexer (Corning, catalog number: 6775)
9. ChemiDoc, gel imaging system (Bio-Rad, catalog number: 12003153)
10. Power supply (Bio-Rad, catalog number: 1645050)
11. Salad spinner (Oxo, catalog number: 1071497)
12. Repeating pipette (Eppendorf, model: E3)
13. Horizontal gel electrophoresis rig (Fisher, catalog number: FB-SB-710)
14. Nanodrop (Thermo Fisher Scientific, model: Onec)
15. Qubit fluorometer (Invitrogen, model: Qubit 4)
16. Microwave
17. Stir plate
18. Balance
19. Pipettes (0.1–2.5, 0.5–10, 2–20, 20–200, 100–1000 μL)
Software and datasets
1. Microsoft Excel or Google Sheets
2. Custom analysis scripts (analyze_fastq.sh and analyze_fastq_w-adjustment.sh) freely available here: https://github.com/cottrellka/Barcoded_AtoI_assay
Procedure
A. Preparing the editing substrate
The ADAR1 editing substrate used in this assay is a 338-nt segment of the mRNA coding for the 5-hydroxytryptamine receptor 2C (5-HT2C, encoded by HTR2C). ADAR1 edits multiple sites within this RNA, including the “B-site” that is evaluated in this assay [30]. The editing substrate is made by in vitro transcription with T7 RNA polymerase using a linearized plasmid template. The plasmid template, pTwist-5HT, was synthesized by Twist Biosciences; the whole plasmid sequence is available in File S1. If the user wishes to make a pseudo-edited control RNA to be used as a 100% editing standard (see General notes 2), they should replace the pTwist-5HT plasmid below with pTwist-5HT-edit (see File S2 for plasmid sequence). The pTwist-5HT plasmid contains the in vitro transcription template for making the 5-HT2C RNA with an A-to-G substitution at the B-site. Preparation of the editing substrate will take at least three days, with pauses possible at multiple steps.
A1. Linearize pTwist-5HT by restriction enzyme digest
1. In a 0.2 mL PCR tube, prepare the reaction mix in Table 2.
Table 2. Linearization of pTwist-5HT
| Reagent | Quantity or volume |
|---|---|
| pTwist-5HT | 2 μg |
| rCutSmart buffer (10×) | 5 μL |
| KpnI-HF | 1 μL |
| Nuclease-free water | Up to 50 μL |
| Total | 50 μL |
2. Mix by flicking the tube and centrifuge briefly to pool the reaction toward the bottom of the tube.
3. Incubate for 16 h at 37 °C followed by heat inactivation for 20 min at 80 °C.
Pause point: The digestion products can be stored at -20 °C before proceeding.
4. Prepare a 1.5% agarose gel in TBE supplemented with 1× SeeGreen and fill the electrophoresis chamber with 1× TBE.
5. Add 10 μL of 6× gel loading dye to the digested pTwist-5HT, mix by flicking, and centrifuge briefly.
6. Load the above sample (60 μL) and 20 μL of 1 kb DNA marker on the gel above and run at 110 V for 60 min.
7. Using a blue light box to visualize the DNA, excise the band at ~2.5 kb corresponding to the linearized pTwist-5HT.
8. Transfer the gel slice to a 1.7 mL microcentrifuge tube and purify the DNA using the Monarch Gel Extraction kit per the manufacturer’s instructions.
9. Measure DNA concentration by NanoDrop.
Pause point: The in vitro transcription template can be stored at -20 °C.
A2. In vitro transcription and preparation of editing substrate
1. In a 0.2 mL PCR tube, prepare the reaction mix in Table 3.
Note: Use nuclease-free pipette tips and tubes from this step forward.
Table 3. In vitro transcription reaction
| Reagent | Quantity or volume |
|---|---|
| Linearized pTwist-5HT | 7 μg |
| NTP buffer mix | 10 μL |
| DTT (0.1 M) | 1 μL |
| T7 RNA polymerase mix | 2 μL |
| Nuclease-free water | Up to 20 μL |
| Total | 20 μL |
2. Mix by flicking the tube and centrifuge briefly to pool the reaction toward the bottom of the tube.
3. Incubate at 37 °C for 2 h in a thermocycler.
4. Remove template DNA by adding 30 μL of nuclease-free water and 2 μL of DNase I. Mix as above and incubate for 15 min at 37 °C.
5. Purify the RNA using the Monarch Spin RNA Cleanup Kit per the manufacturer’s standard protocol; elute with 50 μL of provided nuclease-free water.
6. Quantify RNA by Qubit using the RNA BR Assay per the manufacturer’s instructions.
7. In a 1.7 mL tube, dilute the purified 5-HT2C RNA to 200 nM in 1× annealing buffer (for 100 μL, combine 2.173 μg of 5-HT2C RNA with nuclease-free water to 50 μL and add 50 μL of 2× annealing buffer). Mix by vortexing and centrifuge briefly.
8. Anneal the RNA by placing the tube above in an aluminum heat block at 95 °C. Remove the heat block from the heater and place it on a bench. Place a second heat block also at 95 °C on top of the first to prevent condensation formation on the underside of the tube lid. Allow the heat blocks to cool to room temperature slowly; this may take more than 1 h.
Note: The annealed 5-HT2C RNA should be stored at -80 °C.
B. Preparation of barcoded reverse transcription primers
This assay uses barcoded reverse-transcription primers to enable tracking of editing in each well of a 96-well plate. The primers were designed using the Bioconductor Package DNABarcodes (version 1.34.1) [31]. The barcodes are all 9 nt in length with a Hamming distance of 3 nt, such that each barcode differs from all other barcodes at three or more positions. Barcodes containing restriction enzyme sites for XhoI and HindIII used during sequencing library preparation were eliminated. The sequences for the reverse transcription primers are available in Table S1. Preparing the barcoded reverse transcription primers will take less than 1 h.
1. Order the synthesized reverse-transcription primers in a 96-well plate format and dilute to 100 μM each in nuclease-free water.
2. Make an initial dilution of the reverse transcription primers to 1 μM by using a repeat pipettor to add 198 μL of nuclease-free water to every well of a 96-well PCR plate and a p20 12-channel pipette to transfer 2 μL of each primer from the 100 μM stock into the new plate.
3. Mix by pipetting up and down using a p200 multichannel pipette set to 100 μL; transfer 100 μL of the diluted primers to a second 96-well plate.
4. Seal one plate with aluminum foil and store at -20 °C.
5. Make the RT primer working mix for the editing assay by first adding 65.5 μL of nuclease-free water to every well of a 96-well PCR plate using a repeating pipette. Subsequently, using a repeating pipette, add 67.5 μL of 2× reaction buffer to each well. Finally, using a p20 multichannel pipette, transfer 2.03 μL of the 1 μM stock for each primer to the new plate.
Notes:
1. This makes enough primer working mix for 27 full plate reactions. The final concentration of the reverse transcriptase primer to use in this assay (2.5 nM) was determined empirically through a dilution series (Figure 2). Reducing the reverse transcriptase primer concentration limits the potential for residual reverse transcriptase primers to be used in subsequent PCR steps.
2. Seal the 1 μM stock plate with aluminum foil and store at -20 °C.
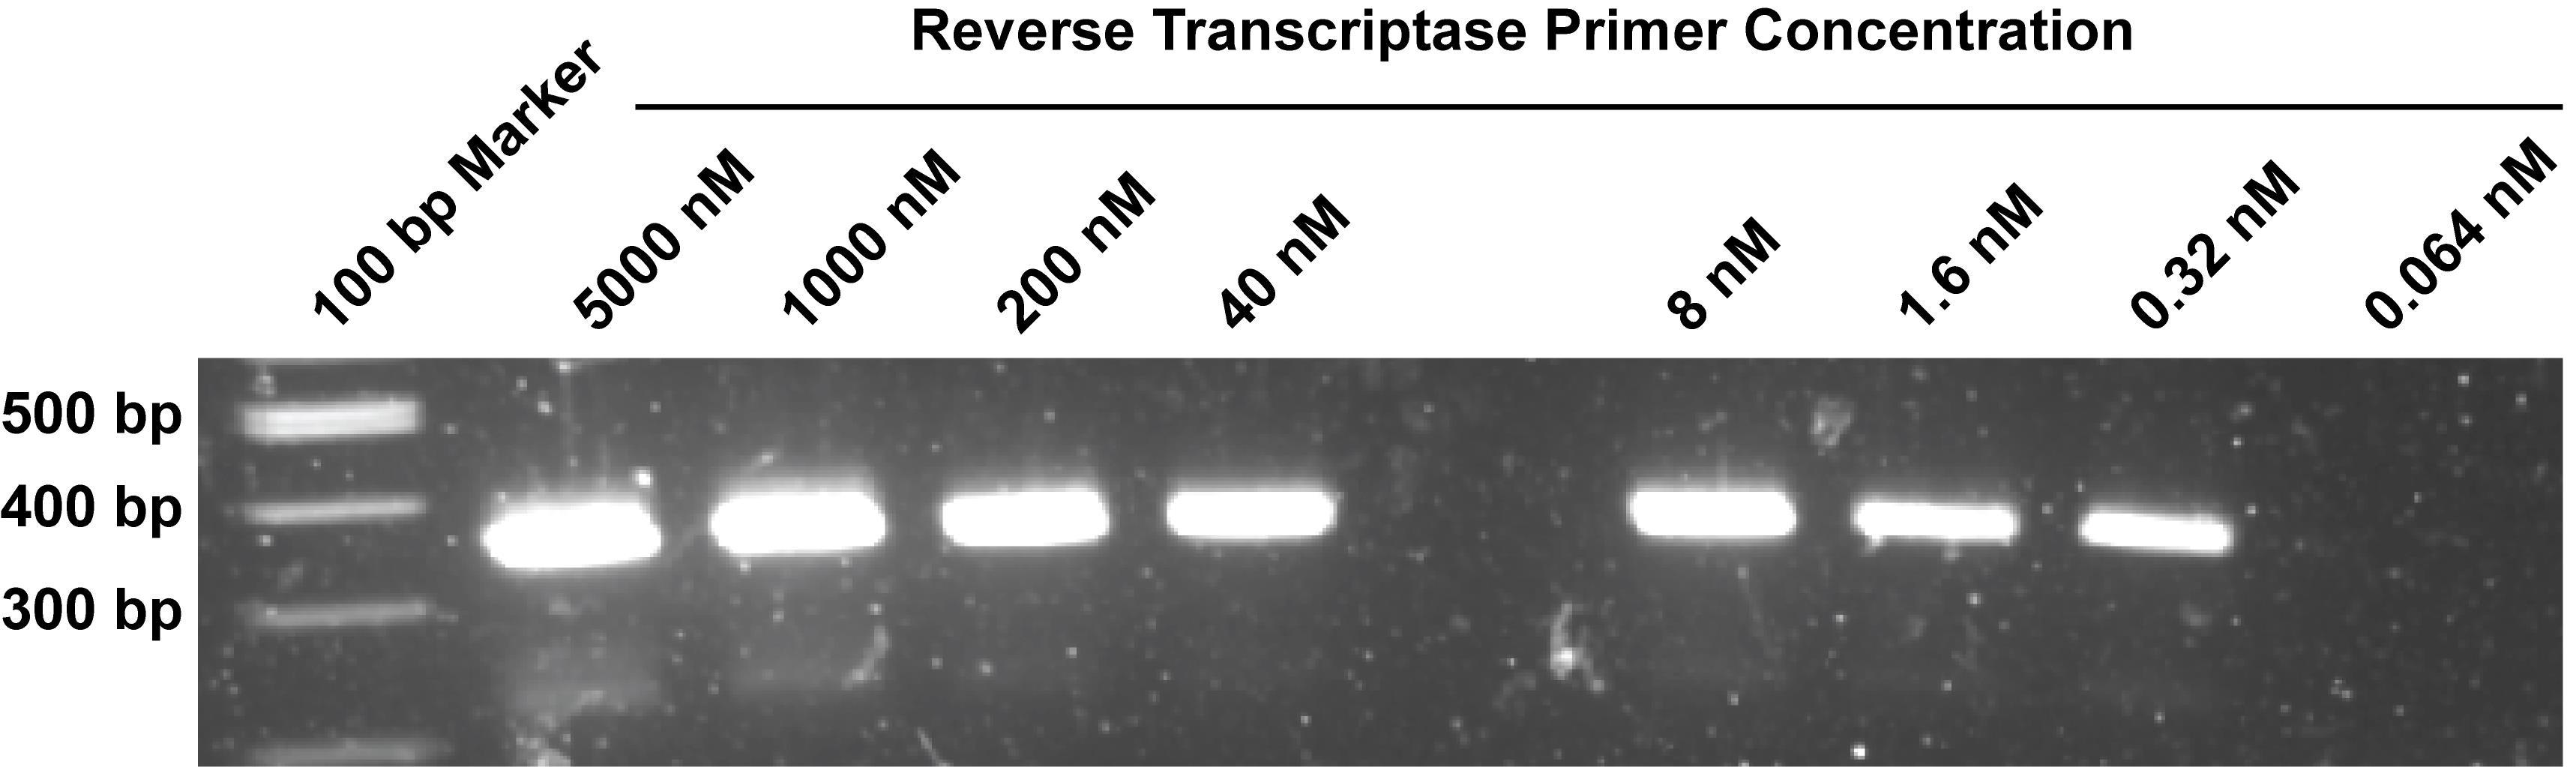
Figure 2. Optimization of reverse transcriptase primer concentration. Mock editing assays were set up as described in section D, with a single reverse-transcriptase primer used at the concentrations shown. Following reverse transcription, cDNA from each reaction was purified individually as described in section E and PCR amplified as described in section F1. PCR products were resolved on a 1.5% agarose gel and imaged.
6. Seal the plate with aluminum foil and vortex the entire plate to mix well. Spin in a salad spinner to pool the liquid to the bottom of the wells.
7. Store at -20 °C.
C. Preparing Illumina adapters
Note: Preparation of the Illumina adapters can be completed in less than a day.
1. Order the Illumina adapters in Table 1 as polyacrylamide gel electrophoresis-purified oligonucleotides.
2. Resuspend adapters in nuclease-free water to 50 μM.
3. Set up up a phosphorylation reaction for each adapter pair as described in Table 4.
Table 4. Adapter phosphorylation and annealing reaction
| Reagent | Volume (μL) |
|---|---|
| Adapter oligo 1 | 1.5 |
| Adapter oligo 2 | 1.5 |
| 10× T4 DNA ligase buffer | 5 |
| Nuclease-free water | 41 |
| T4 polynucleotide kinase (T4-PNK) | 1 |
| Total | 50 |
4. Incubate at 37 °C for 30 min followed by 65 °C for 20 min.
5. To anneal the adapters, heat to 95 °C in a heat block and allow to cool slowly to room temperature as described in step A2.8.
6. Dilute the annealed oligos to 150 μL by adding 100 μL of nuclease-free water.
Note: The final concentration of the annealed and phosphorylated adapters is 0.5 μM.
7. The annealed and phosphorylated adapters should be stored at -20 °C in multiple aliquots to reduce freeze/thaw cycles.
D. A-to-I editing assay and cDNA synthesis
The A-to-I editing assay is performed in tandem with cDNA synthesis. Therefore, the editing reaction includes the 5-HT2C RNA, ADAR1 and other components needed for A-to-I editing, as well as the reverse transcription primers and dNTPs needed for cDNA synthesis. Table 5 describes the final composition of the editing reaction. For ease of pipetting and adaptability, and to prevent the reaction from commencing prematurely, the reaction components are split into three working mixes: 1) the RNA working mix, which contains the 5-HT2C RNA, 2) the primer working mix, which contains the barcoded reverse transcription primers, and 3) the ADAR1 working mix, which contains ADAR1. As described above, the primer working mix can be prepared ahead and stored until use. The RNA and ADAR1 working mixes should be prepared immediately prior to the experiment. Following completion of the editing reaction, an RT working mix containing reverse transcriptase (RT) is prepared during incubation of the editing reaction and added directly to each well to enable cDNA synthesis. Table 6 describes the final composition of the reaction after addition of the RT working mix. The A-to-I editing assay and cDNA synthesis can be completed in one day. Besides the incubation times for the editing reaction and cDNA synthesis, there are no pause points in this process.
Table 5. A-to-I editing reaction composition
| Component | Final concentration |
|---|---|
| Reaction buffer | 1× |
| DTT | 0.5 mM |
| Yeast tRNA | 1 μg/mL |
| RNase inhibitor | 0.11 U/μL |
| 5-HT2C RNA | 5 nM |
| RT primer | 5 nM |
| dNTPs | 1 mM |
| ADAR1 | 100 nM |
| Water | N/A |
| Total | 15 μL |
Table 6. Reverse transcription reaction composition
| Component | Final concentration |
|---|---|
| Reaction buffer | 0.5× |
| DTT | 10.25 mM |
| Yeast tRNA | 0.5 μg/mL |
| RNase inhibitor | 0.455 U/μL |
| 5-HT2C RNA | 2.5 nM |
| RT primer | 2.5 nM |
| dNTPs | 0.5 mM |
| ADAR1 | 50 nM |
| Protoscript II buffer | 1× |
| Protoscript II | 0.5 U/μL |
| Water | N/A |
| Total | 30 μL |
1. Set up a thermocycler program with the steps described in Table 7.
Table 7. A-to-I editing and reverse transcription program
| Temperature | Time | Purpose |
|---|---|---|
| 30 °C | 60 min | A-to-I editing reaction |
| 95 °C | 5 min | ADAR1 inactivation and RNA denaturation |
| 4 °C | Until advanced (infinite) | Holding step |
| 25 °C | 5 min | Primer annealing |
| 42 °C | 60 min | Reverse transcription |
| 65 °C | 5 min | Reverse transcriptase inactivation |
| 4 °C | Until stopped (infinite) | Holding step |
2. Freshly prepare RNA working mix by adding all the reagents in Table 8 into a 1.7 mL microfuge tube; volumes are given both for a single reaction and for 110 reactions, sufficient for a full 96-well plate. Vortex to mix. Once the RNA working mix is made up, place it on ice.
Notes:
1. Some of the volumes given for a single reaction are too small to pipette. The single reaction volumes are only provided for reference; ultimately, the user should make a working mix sufficient for multiple reactions (at least 10).
2. If the user intends to include 0% and 100% editing standards in their assay, they should additionally make a “Pseudo-edited RNA working mix” in which 5-HT2C RNA is replaced with the pseudo-edited 5-HT2C RNA.
Table 8. RNA working mix
| Reagent | Final concentration | Volume for single reaction (μL) | Volume for 110 reactions (μL) |
|---|---|---|---|
| 2× reaction buffer | 0.83× | 2.5 | 275 |
| DTT (0.1 M) | 0.625 mM | 0.0375 | 4.125 |
| Yeast tRNA (10 μg/mL) | 2.5 μg/mL | 1.5 | 165 |
| RNase inhibitor (40 U/μL) | 0.27 U/μL | 0.04 | 4.4 |
| 5-HT2C RNA (200 nM) | 12.5 nM | 0.375 | 41.25 |
| dNTPs (10 mM) | 2.5 mM | 1.5 | 165 |
| MilliQ water | N/A | 0.0475 | 5.225 |
| Total | N/A | 6 | 660 |
3. Freshly prepare the ADAR1 working mix by adding all the reagents in Table 9 into a 1.7 mL microfuge tube; volumes are given both for a single reaction and 110 reactions, sufficient for a full 96-well plate. It is very important that ADAR1 and the ADAR1 working mix remain on ice throughout. Vortex briefly to ensure all the reagents are mixed together, and place them on ice until ready to be used. If the ADAR1 working mix will be added to the 96-well plate via a multichannel pipette, aliquot the mix into PCR strip tubes to facilitate pipetting. For a full 96-well plate, we recommend ~55 μL in eight PCR tubes for use with an 8-channel micropipette.
Notes:
1. Some of the volumes given for a single reaction are too small to pipette. The single reaction volumes are only provided for reference; ultimately the user should make a working mix sufficient for multiple reactions (at least 10).
2. If the user is using this assay to evaluate small molecule inhibitors of ADAR1, those compounds could be added to the ADAR1 working mix, in place of some or all of the water. This would work well for evaluating one to several compounds over multiple concentrations. Each compound could be added to the aliquoted ADAR1 reaction mix in PCR tubes, with enough volume for multiple technical replicates. Alternatively, compounds could be added manually by a multichannel pipette or through an automated liquid handler between steps D5 and D6 below. If pre-incubation of the compounds with ADAR1 is desired, the order for adding each working mix could be switched; for example, starting with the ADAR1 working mix, followed by the compounds to be tested, the primer working mix, and finally the RNA working mix. In our experience, the assay is robust to DMSO concentrations up to at least 5% in the initial editing reaction.
3. If the user intends to include 0% and 100% editing standards in their assay, they should additionally make an “ADAR1 working mix” in which ADAR1 is replaced with water.
Table 9. ADAR1 working mix
| Reagent | Final concentration | Volume for single reaction (μL) | Volume for 110 reactions (μL) |
|---|---|---|---|
| 2× Reaction buffer | 1.25× | 2.5 | 275 |
| DTT (0.1 M) | 0.938 mM | 0.0375 | 4.125 |
| ADAR (2000 nM) | 100 nM | 0.75 | 82.5 |
| Nuclease-free water | N/A | 0.7125 | 78.375 |
| Total | N/A | 4 μL | 440 |
4. Using a repeating pipette, add 6 μL of the RNA working mix to each well in a 96-well plate.
5. Using a p20 multichannel micropipette, transfer 5 μL of the primer working mix from above into the appropriate wells, pipetting up and down so that it is mixed with the RNA working mix.
6. Using a p20 multichannel micropipette, add 4 μL of the ADAR1 working mix to each well, pipetting up and down so that it is mixed with the other components.
7. Seal the plate with a PCR plate seal and spin briefly in a salad spinner to pool the liquid to the bottom of the wells.
8. Place the 96-well plate into the thermal cycler and run the program created in step D1.
9. While the 96-well plate is in the thermal cycler running the editing reaction, begin to prepare the RT working mix in a 1.7 mL microfuge tube following Table 10, and place it on ice.
Notes:
1. Some of the volumes given for a single reaction are too small to pipette. The single reaction volumes are only provided for reference; ultimately, the user should make a working mix sufficient for multiple reactions (at least 5).
2. The manufacturer’s standard protocol recommends a final concentration of 10 U of Protoscript II Reverse Transcriptase in the cDNA synthesis reaction. To minimize reagent costs, reverse transcriptase concentration was optimized by testing enzyme concentrations ranging from 10 to 0 U/μL. Ultimately, we chose 0.5 U/μL, which gave sufficient cDNA synthesis and was a reasonable volume for pipetting (Figure 3).
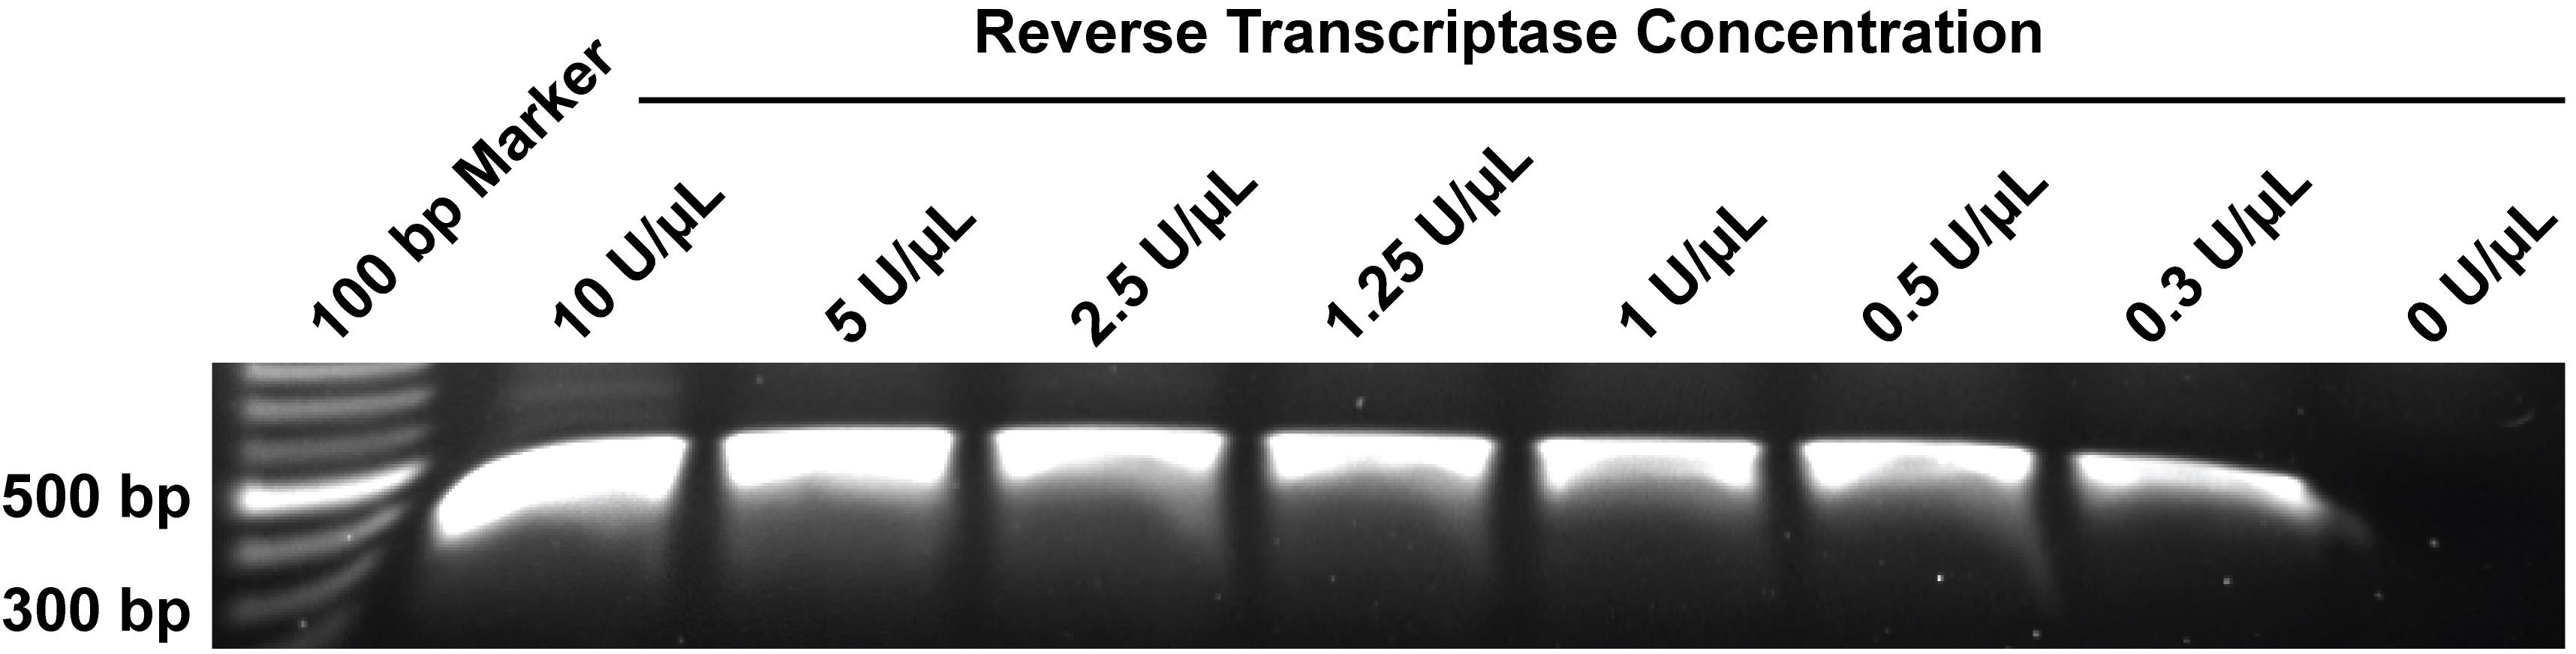
Figure 3. Optimization of reverse transcriptase concentration. Mock editing assays were set up as described in section D, with a single reverse-transcriptase primer and reverse transcriptase at the indicated concentrations. Following reverse transcription, cDNA from each reaction was purified individually as described in section E and PCR amplified as described in section F1. PCR products were resolved on a 1.5% agarose gel and imaged.
Table 10. RT working mix
| Reagent | Final concentration | Volume for single reaction (μL) | Volume for 110 reactions (μL) |
|---|---|---|---|
| ProtoScript II reaction buffer (5×) | 2× | 6 | 660 |
| DTT (0.1 M) | 20 mM | 3 | 330 |
| ProtoScript II reverse transcriptase (200 U/μL) | 1 U/μL | 0.075 | 8.3 |
| RNase inhibitor (40 U/μL) | 0.8 U/μL | 0.3 | 33 |
| Nuclease-free water | N/A | 5.625 | 619 |
| Total | N/A | 15 | 1650 |
10. After the 1-h editing reaction has completed, transfer the PCR plate to a rack on ice and very gently remove the plate seal so that the wells are accessible.
11. Using a repeating pipette, add 15 μL of the RT working mix to the side of each well, being careful not to make contact with the liquid in the well, as this could lead to cross-contamination. Alternatively, the RT working mix can be aliquoted into PCR strip tubes and added via a multichannel micropipette.
12. Once each well has the RT master mix added, place a seal on the 96-well plate, being careful to thoroughly adhere the seal to all wells, and vortex the plate to mix. Spin using a salad spinner to pool the reactions to the bottom of the wells.
13. Return the plate to the thermocycler and proceed to the next step in the program.
14. Proceed to the next step or store the cDNA at -20 °C.
Note: If storing the cDNA, the plate seal should be replaced with a foil seal.
E. Pooling and purification of cDNA
Note: Pooling and purification of the cDNA will take less than 2 h.
1. Following cDNA synthesis, use a 12-channel pipette to transfer the contents of each well of the 96-well plate into a sterile reagent reservoir.
2. Once all the samples have been pooled (approximately 2.8 mL of total volume), transfer the pooled cDNA to a 15 mL conical tube by serological pipette or by pouring.
3. Purify 0.5 mL of the pooled cDNA using the Monarch PCR & DNA Clean Up kit according to the manufacturer’s instructions, using the ssDNA sample protocol with a sample to binding buffer ratio of 7:1. Elute in 25 μL.
4. Proceed to the next step or store the remaining pooled cDNA at -20 °C.
Note: Purification of the pooled cDNA concentrates the cDNA and removes residual reverse-transcription primers, which are below the size limit of the Monarch PCR & DNA Cleanup kit. Residual reverse transcription primers may serve as primers for DNA polymerase during the subsequent PCR amplification step, resulting in barcodes being added randomly. We have tested for residual RT primers by performing PCR to amplify cDNA from a mock assay with only a forward PCR primer (here, the PCR would be dependent on residual RT primers) and observed no amplification (Figure 4).
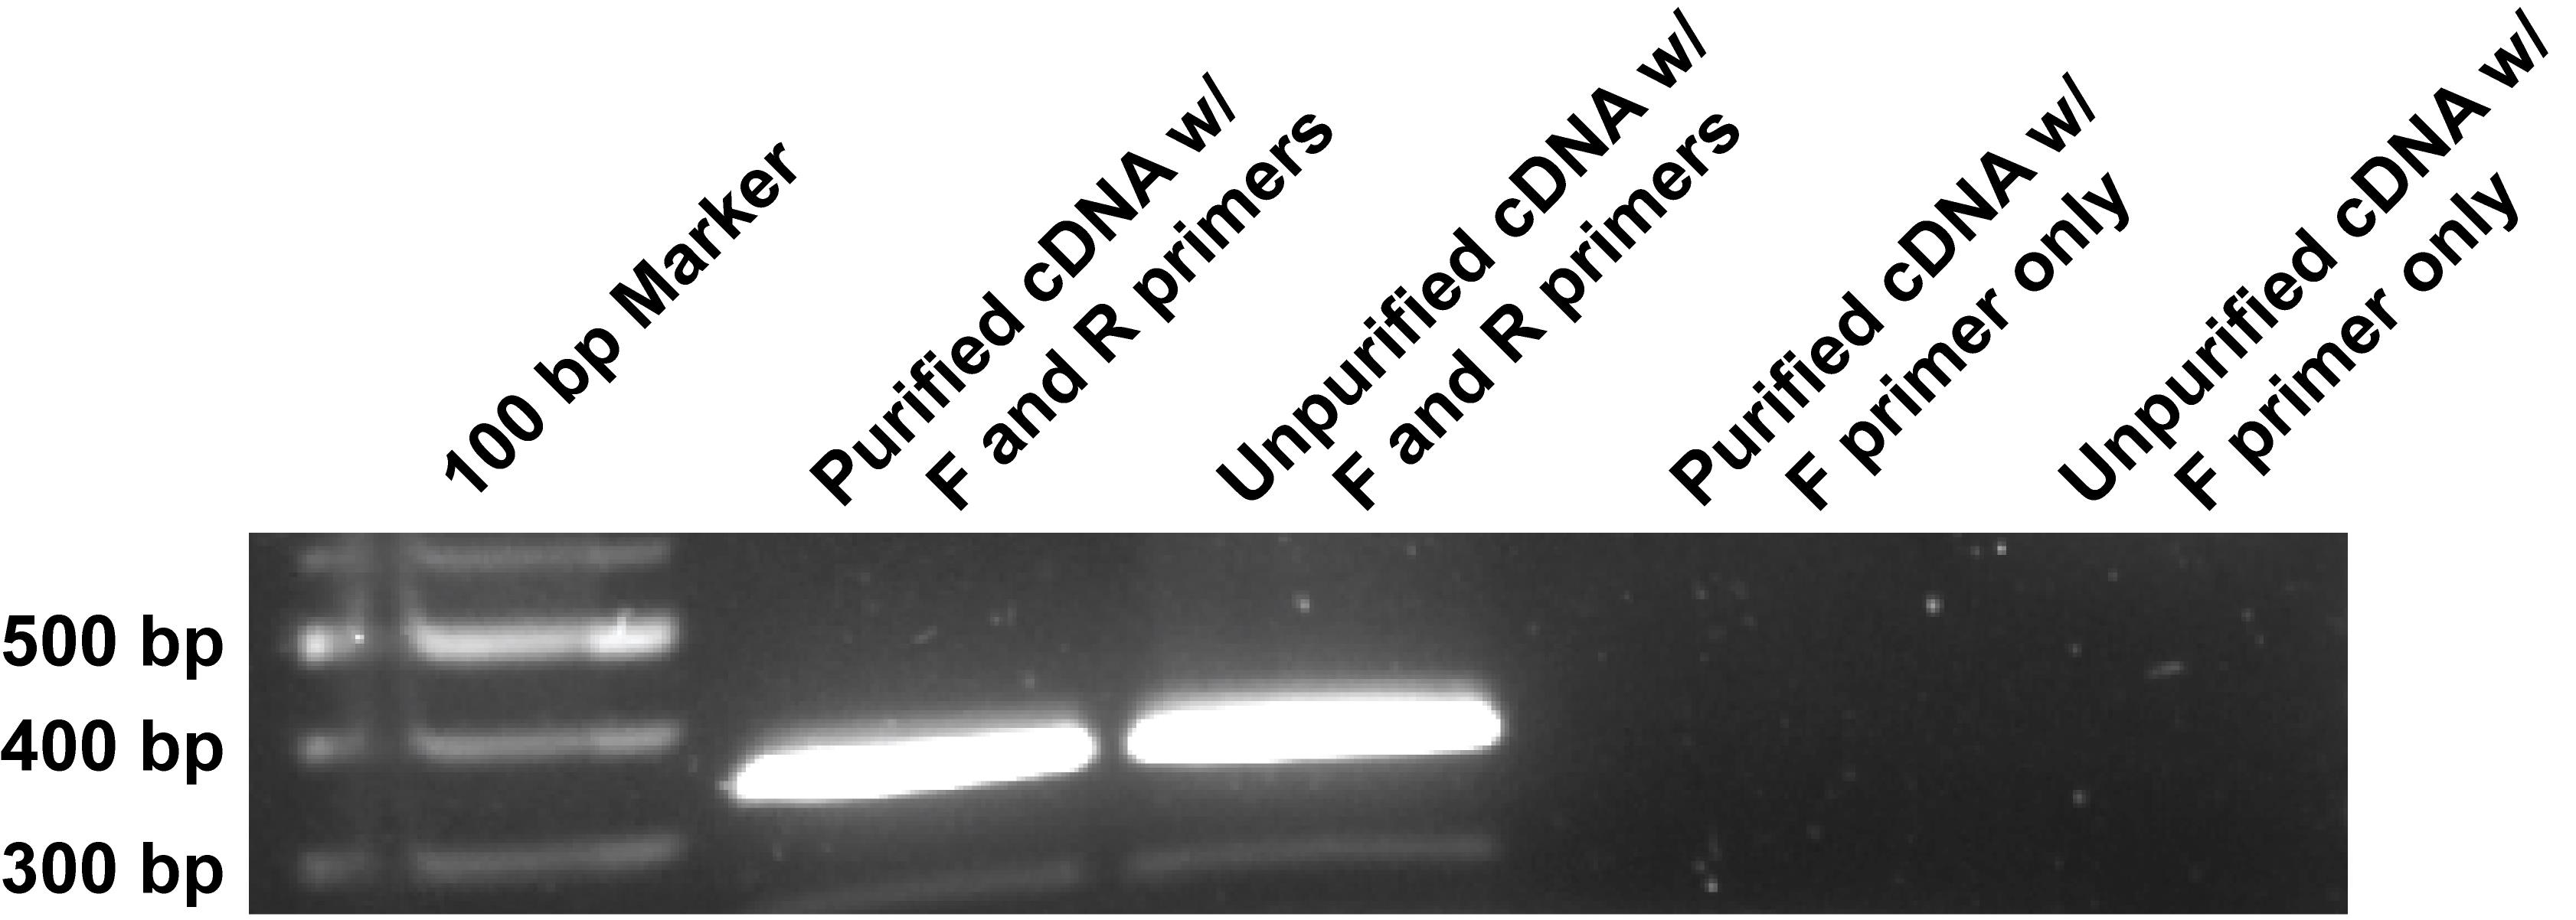
Figure 4. Verification that insufficient residual reverse-transcriptase primer remains to be used as a PCR primer. A mock editing assay was set up as described in section D, with a single reverse transcriptase primer used. Following reverse transcription, cDNA from each reaction was purified individually (or not) as described in section E and PCR amplified with either both the MPEA PCR forward and reverse primers or only the forward primer as described in section F1. PCR products were resolved on a 1.5% agarose gel and imaged.
F. Sequencing library preparation
Note: Sequencing library preparation can be completed in two days; it is possible to pause at multiple steps in the process.
F1. Initial PCR and purification
1. Make an initial PCR reaction mix sufficient for 2.5 reactions (see Table 11) in a 1.7 mL microfuge tube.
Note: We typically set up two reactions to have additional PCR product if needed.
Table 11. Initial PCR reaction mix
| Reagent | Volume (μL) |
|---|---|
| PrimeSTAR Max (2×) | 31.25 |
| MPEA PCR F primer (10 μM) | 1.875 |
| MPEA PCR R primer (10 μM) | 1.875 |
| cDNA | 2.5 |
| Nuclease-free water | 25 |
| Total | 60 |
2. Aliquot into two PCR tubes, 25 μL each, and spin briefly to pool the reaction to the bottom of the tube.
3. Place the PCR tube in a thermal cycler and run using the parameters in Table 12.
Note: We have found 20 cycles to be sufficient for this PCR; fewer could be used to reduce the potential for PCR artifacts. More reactions may be needed if cycle numbers are reduced. We have observed unwanted products at higher cycle numbers (Figure 5).
Pause point: PCR products can be stored at -20 °C before proceeding to the next step.
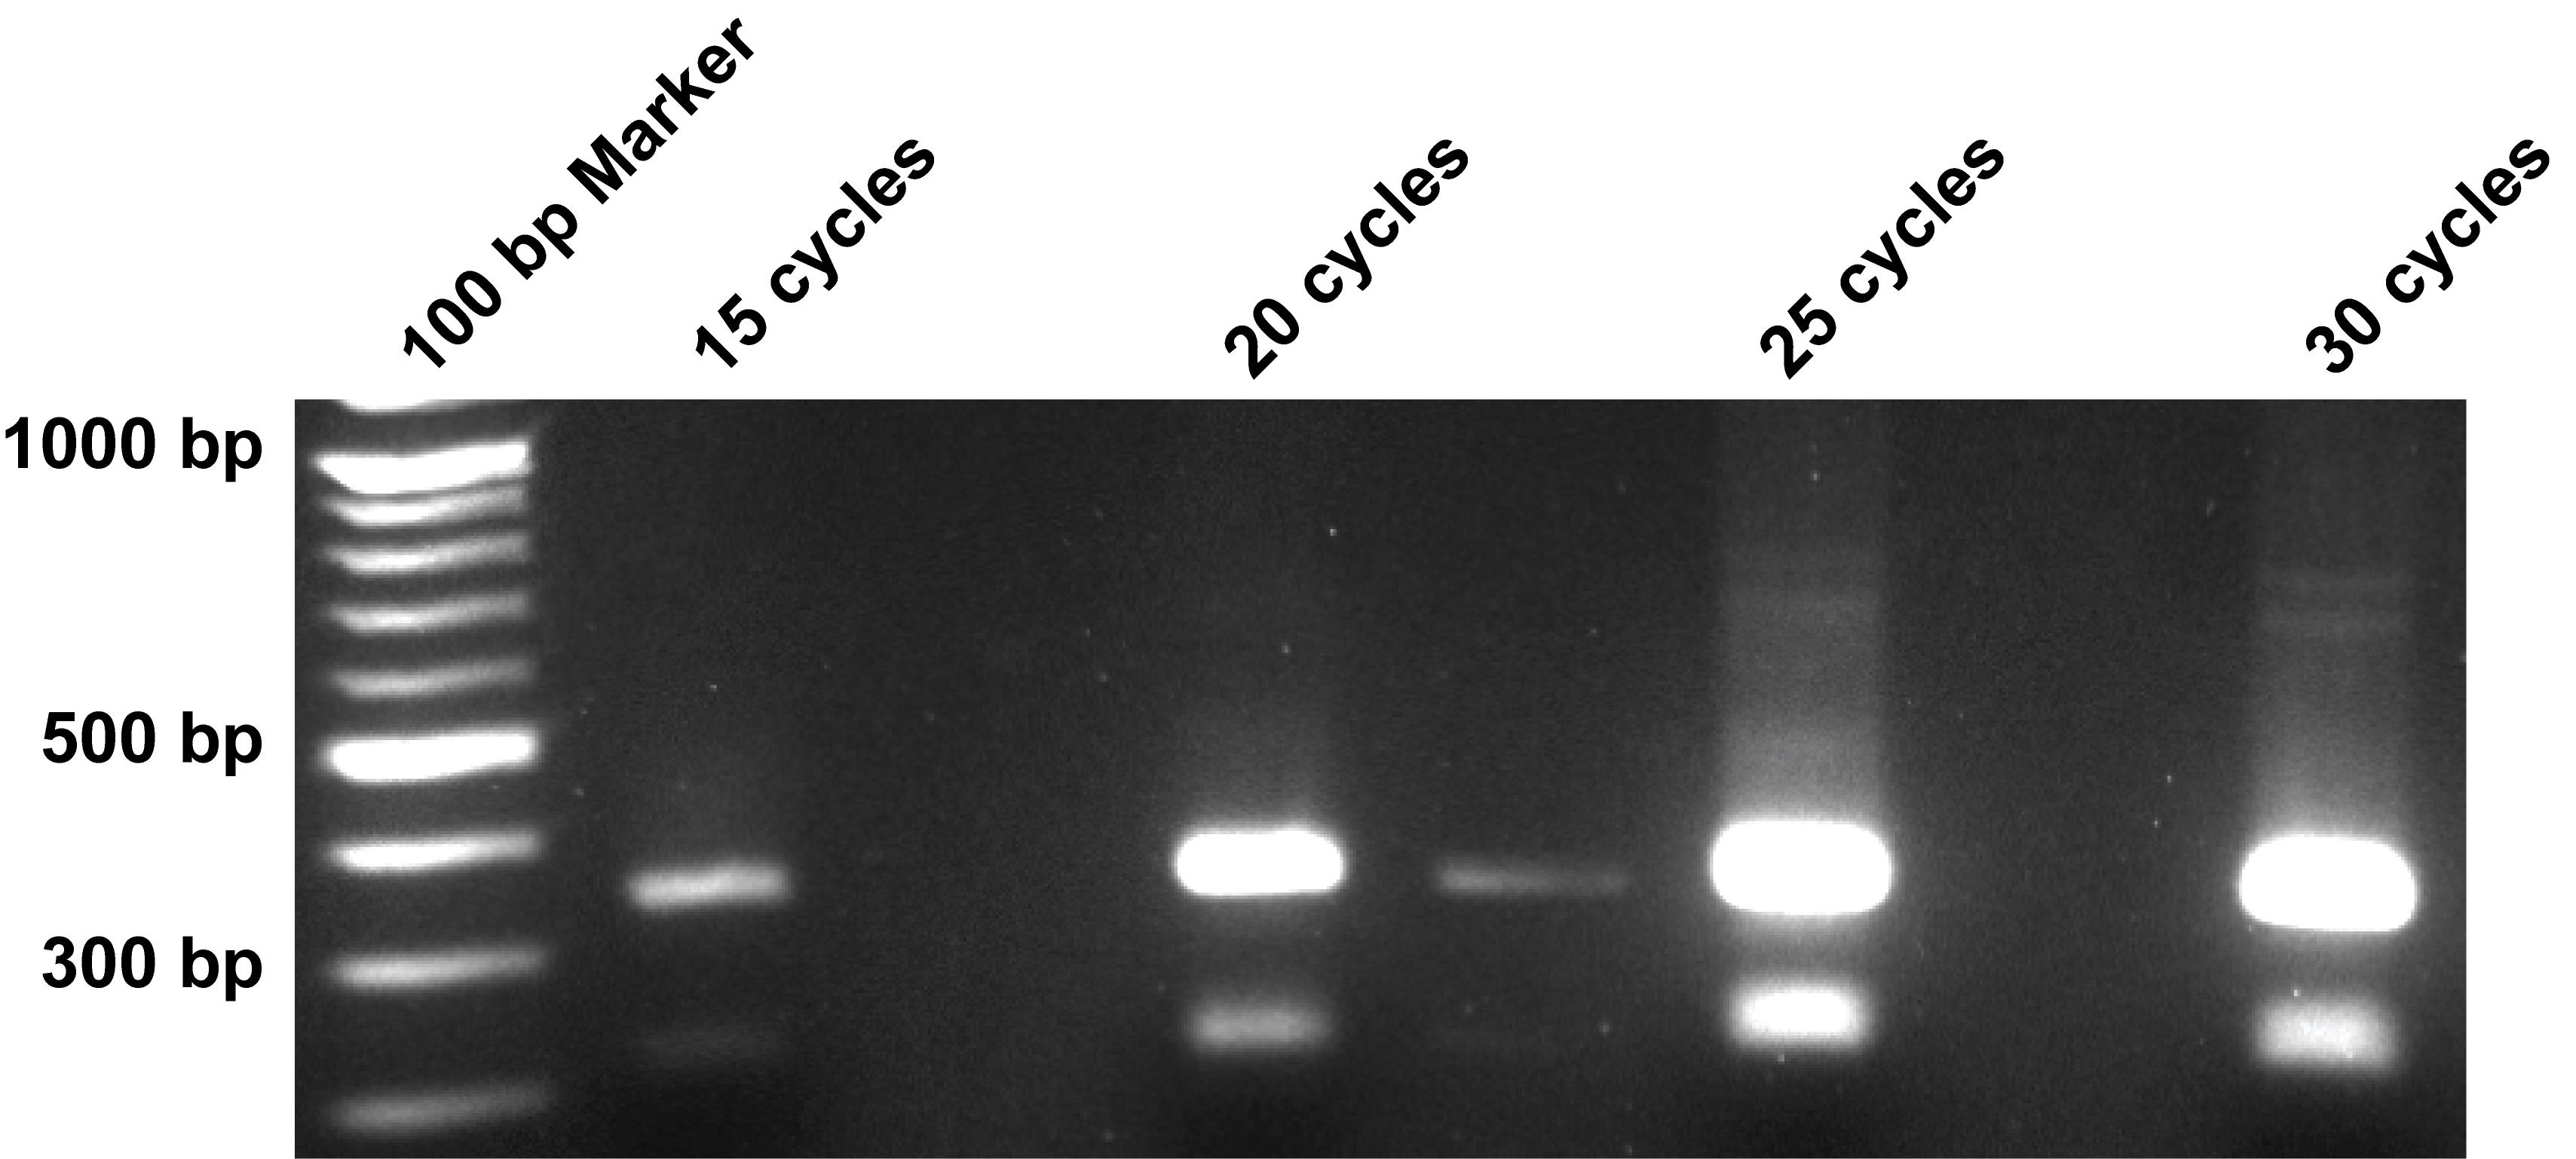
Figure 5. Optimization of the initial PCR cycle number. A mock editing assay was set up as described in section D, with a single reverse-transcriptase primer used. Following reverse transcription, cDNA from each reaction was purified individually as described in section E and PCR amplified as described in section F1 with the number of cycles indicated. PCR products were resolved on a 1.5% agarose gel and imaged.
Table 12. cDNA amplification parameters
| Step | Temperature (°C) | Time | Cycles |
| Denaturation | 98 | 10 s | 20 |
| Annealing | 55 | 15 s | |
| Extension | 72 | 5 s | |
| Final extension | 72 | 5 min | 1 |
| Hold | 4 | ∞ | - |
4. Purify the PCR products using the Monarch PCR & DNA Clean Up kit according to the manufacturer’s instructions, using the ssDNA sample type (sample to binding buffer ratio of 7:1). Elute with 20 μL of the provided elution buffer.
Note: We have found gel purification to not be necessary at this stage. If the user wants to gel purify the PCR product at this step, the correct product is 353 bp. See the prominent band at ~350 bp in Figure 4.
Pause point: The purified PCR products can be stored at -20 °C before proceeding to the next step.
F2. Restriction enzyme digest and cleanup
5. Prepare digest with HindIII-HF and XhoI (see Table 13) in a 1.7 mL microfuge tube.
Table 13. Restriction enzyme reaction
| Reagent | Volume (μL) |
|---|---|
| Purified PCR product | 20 |
| rCutSmart buffer (10×) | 5 |
| HindIII-HF | 0.5 |
| XhoI | 0.5 |
| Nuclease-free water | 24 |
| Total | 50 |
6. Incubate for 1 h at 37 °C followed by heat inactivation for 20 min at 80 °C.
7. Purify the restriction enzyme–digested PCR product using the Monarch DNA & PCR Clean Up kit. Elute in 25 μL of water.
Pause point: The digested PCR products can be stored at -20 °C before proceeding to the next step.
F3. Ligation of sequencing adapters
8. Quantify the digested PCR product by Qubit 1× dsDNA BR assay. Follow the manufacturer's instructions. Begin by measuring 1 μL of sample and increase if needed.
9. Prepare the ligation reaction (see Table 14) in a 1.7 mL microfuge tube. Use 0.5 μL of each annealed and phosphorylated adapter (see above) for every 100 ng of digested PCR product.
Note: We typically use 100–200 ng of digested PCR product.
Table 14. Ligation reaction mix
| Reagent | Volume (μL) |
|---|---|
| T4 DNA ligase buffer (10×) | 2 μL |
| P1 (0.5 μM) | X μL |
| P2 (0.5 μM) | X μL |
| Digested PCR product | Up to 15 μL |
| T4 DNA ligase | 1 μL |
| Nuclease-free water | Up to 20 μL |
| Total | 20 μL |
10. Incubate at 16 °C for 16 h; then, heat-inactivate enzymes at 65 °C for 10 min.
Pause point: The ligation products can be stored at -20 °C before proceeding to the next step.
F4. Enrichment PCR and gel purification
11. Make enough enrichment PCR reaction mix for 2.5 reactions (see Table 15) in a 1.7 mL microfuge tube. Vortex briefly to mix.
Note: We typically set up two reactions to have additional PCR product if needed. The template for this PCR is the ligation product from F3. The template volume will depend on the amount of digested PCR product included in the ligation reaction, with the goal being to include ~10 ng of digested PCR product in each 25 μL reaction. For example, if 100 ng of digested PCR product was used in the 20 μL ligation reaction, then 2 μL of the ligation reaction should be used in each 25 μL reaction.
Table 15. Enrichment PCR reaction mix
| Reagent | Quantity or volume |
|---|---|
| PrimeSTAR (2×) | 31.25 μL |
| Il_enrich F primer (10 μM) | 1.875 μL |
| Il_enrich R primer (10 μM) | 1.875 μL |
| Ligation mix (template) | equivalent to ~25 ng of digested PCR product |
| Nuclease-free water | To 62.5 μL |
| Total | 62.5 μL |
12. Aliquot into two PCR tubes, 25 μL each, and spin briefly to pool the reaction to the bottom of the tube.
13. Place the PCR tube in a thermal cycler and run using the parameters in Table 16.
Note: We have found that between 12 and 15 cycles provide sufficient product for sequencing. An example gel image is shown in Figure 6.
Pause point: The PCR products can be stored at -20 °C before proceeding to the next step.
Table 16. Enrichment PCR parameters
| Step | Temperature (°C) | Time | Cycles |
| Denaturation | 98 | 10 s | 12–15 |
| Annealing | 55 | 15 s | |
| Extension | 72 | 5 s | |
| Final extension | 72 | 5 min | 1 |
| Hold | 4 | ∞ | - |
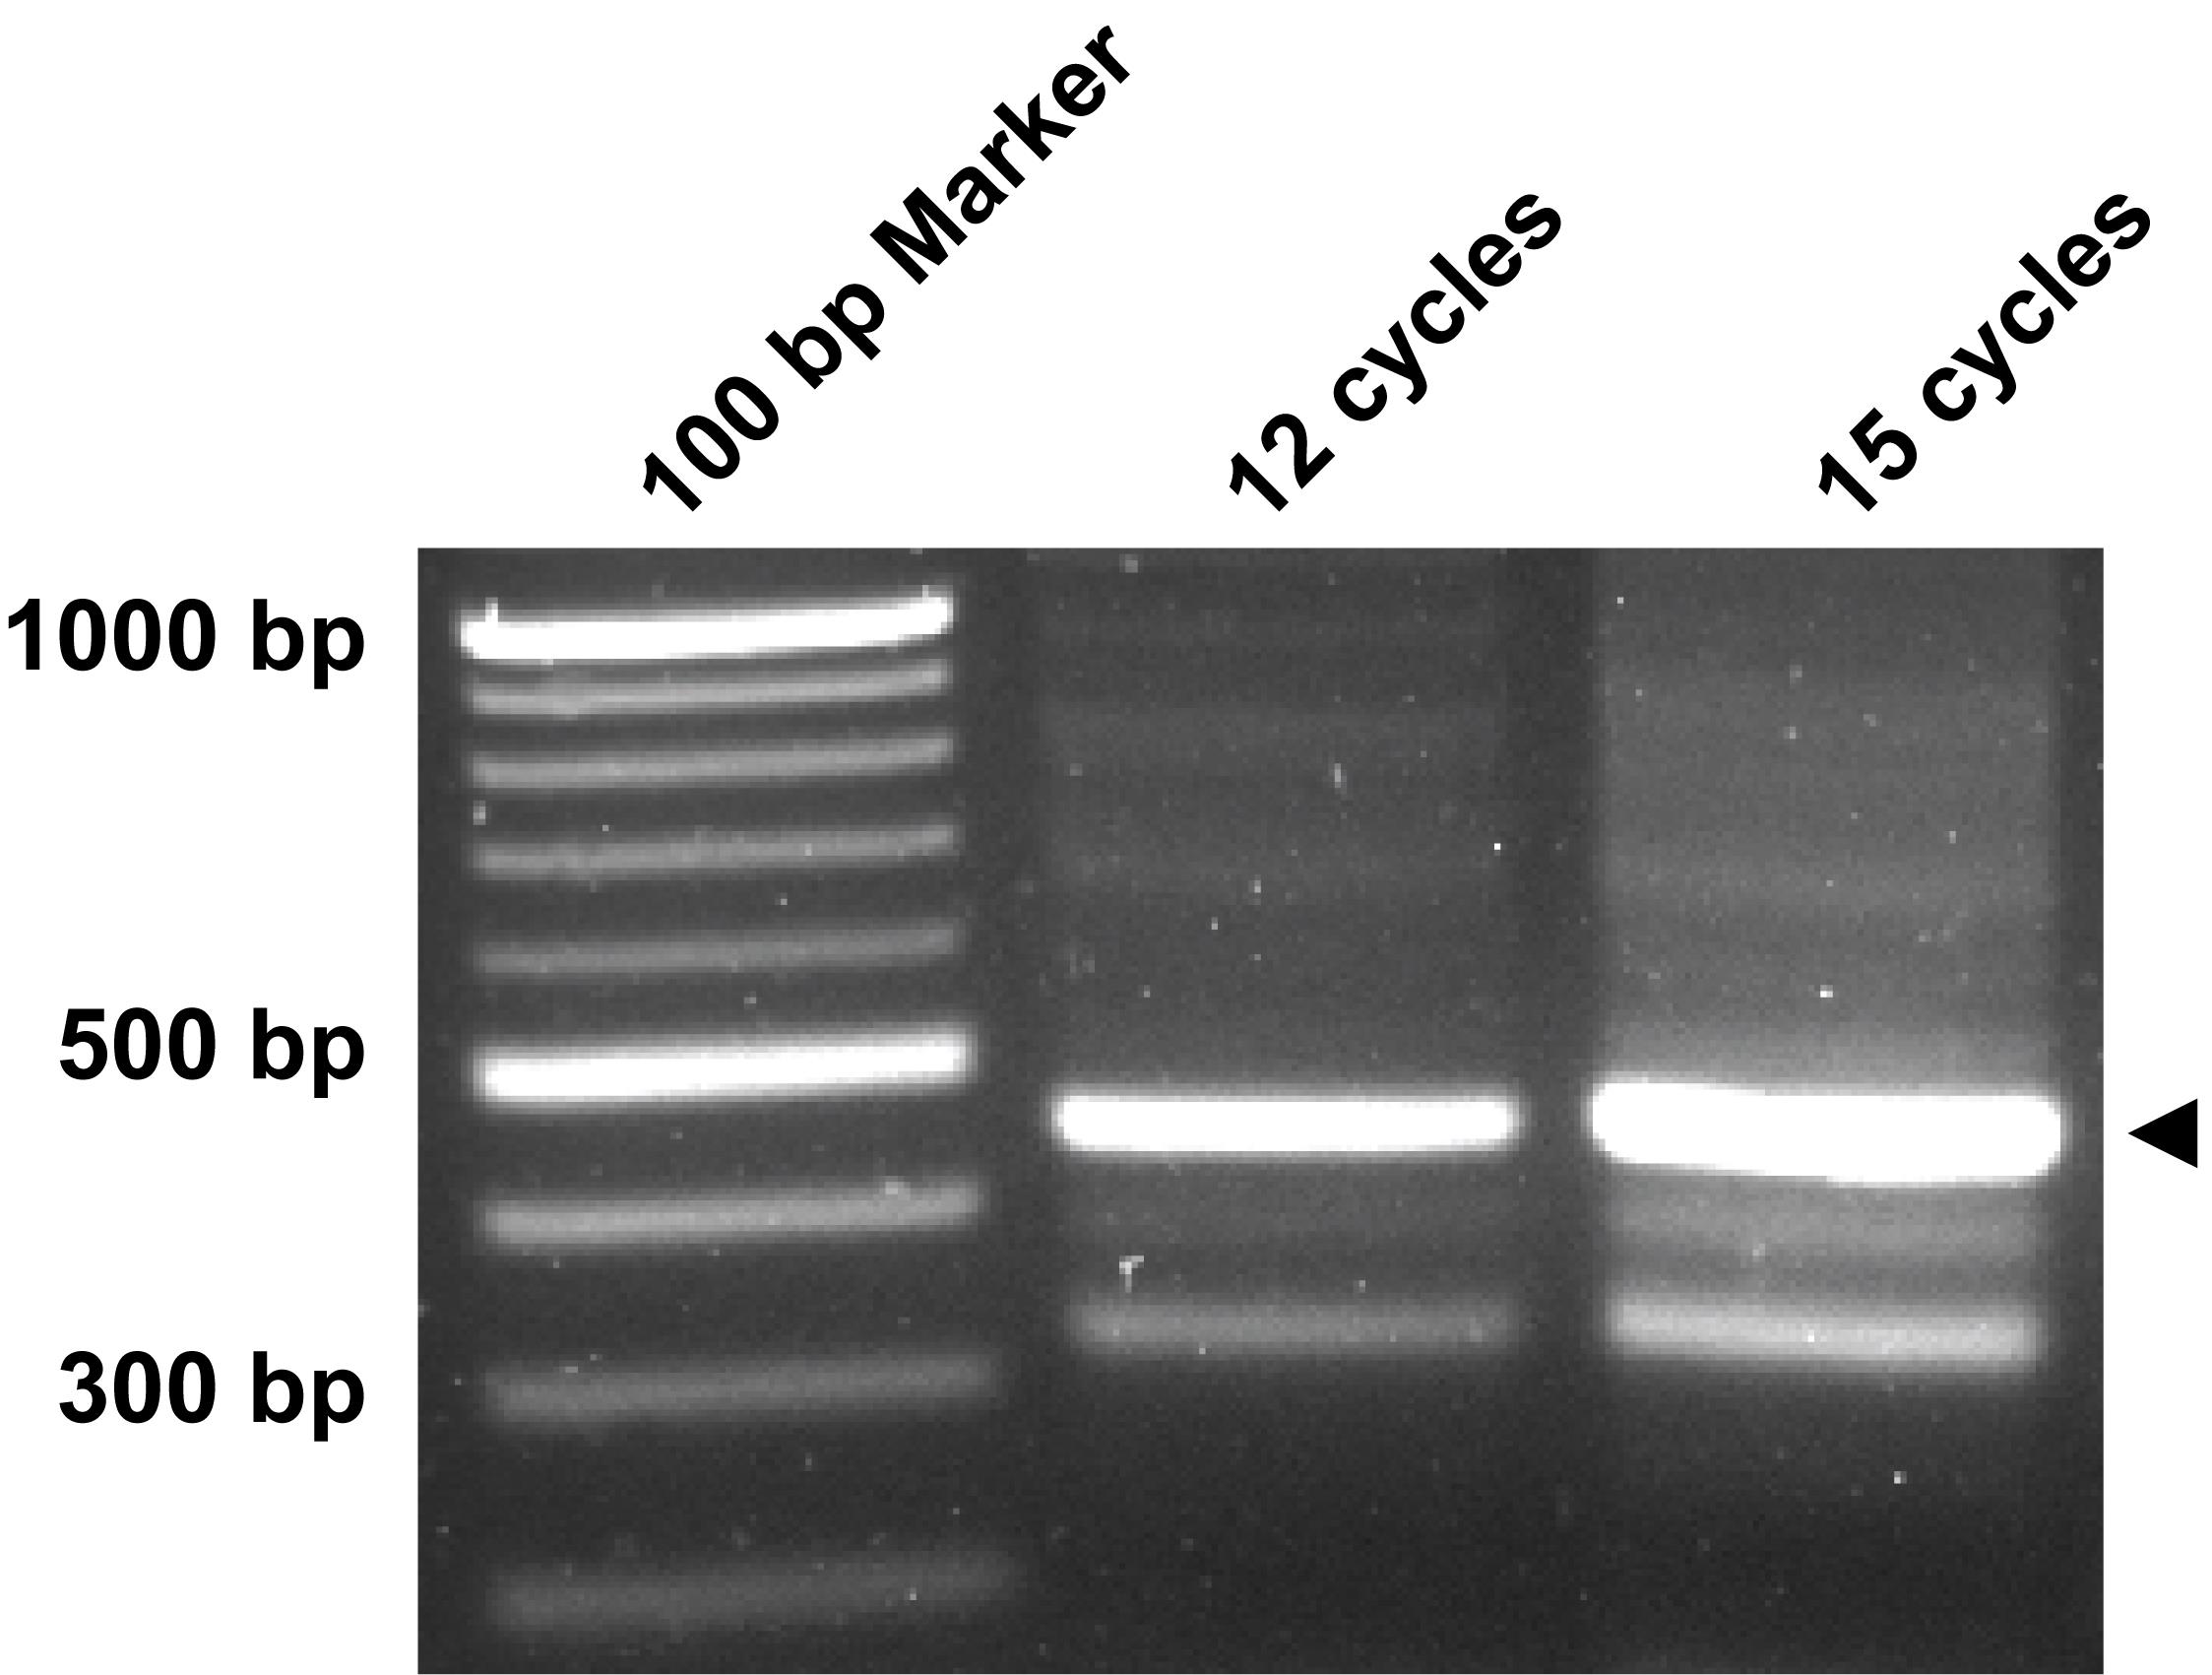
Figure 6. Example gel image of enrichment PCR products. The number of PCR cycles for the enrichment PCR is indicated. The arrow indicates the desired PCR product.
14. Prepare the PCR products to be run on a 1.5% agarose gel by adding 5 μL of gel loading dye and pipetting up and down to mix.
15. Resolve the PCR products on a 1.5% agarose gel and excise the appropriate size band (457 bp).
16. Purify the PCR amplicon using the Monarch DNA Gel Extraction kit. Elute in 25 μL.
17. Quantify the sample by Qubit 1× dsDNA BR assay. Follow the manufacturer's instructions; begin by measuring 1 μL of the PCR product and increase if needed.
18. Store the final library at -20 °C until submission for sequencing.
G. Sequencing
Next-generation sequencing can be performed on any machine compatible with the Illumina adapters used for library production. Paired-end sequencing with a minimum read length of 150 bp (2 × 150) is required. For a library generated from a full 96-well plate, we recommend a minimum of 250,000 reads, though more reads may be needed for poor quality libraries. Sequencing is best carried out as a spike-in, where the library is included as a small portion of another sequencing run. This has two benefits: 1) it is cost-effective, as only a small number of reads are needed, and 2) the spike-in improves nucleotide diversity during sequencing.
Data analysis
Initial analysis of the sequencing data uses a custom pipeline via a single shell script (analyze_fastq.sh). The analysis pipeline requires a Unix-like operating system (Linux, macOS, Windows Subsystem for Linux) with standard command-line utilities, including Bash and AWK, and an installation of R (version 4.0 or later). For typical sequencing datasets, the workflow can be executed on a standard desktop or workstation computer with at least 8 GB RAM and a modern multi-core processor. Memory usage is determined primarily by the number of unique barcodes detected. The input files for the analysis script are the .fastq files for each paired read (R1 and R2) and an annotation file, which is needed to map the barcodes to wells and reaction conditions. The pipeline generates five files described below:
• run_summary.txt: A summary that describes the total number of successful reads processed and the number of reads that failed due to mismatching fastq headers (ID mismatch), missing the anchor sequence for the barcode (Fail anchor1), lacking 9 nt before the anchor (fail barcode), missing the anchor sequence for the 5-HT2C B-site (Fail anchor2), or lacking a nucleotide after the B-site anchor due to a short read (fail position).
• barcode_counts.csv: A table that summarizes the sequencing data into five variables: 1) barcode sequence and 2–5) the number of reads with an A, T, C, G, or N at the 5-HT2C B-site for each barcode.
• annotated_results.csv: A table that contains the information from the above file along with four additional variables: 1) the well position, 2) the reverse transcription primer name, 3) the reaction conditions for each well, 4) the total counts for the 5-HT2C B-site for each barcode, and 5) percent editing of the 5-HT2C B-site.
• total_counts.pdf: A density plot showing the total counts for the 5-HT2C B-site for each barcode. Total counts should be approximately normally distributed. A leftward skew or secondary peak would indicate poor cDNA synthesis for some reactions, either due to inhibition of reverse transcriptase or degradation of the editing substrate.
• percent_editing.pdf: A density plot showing percent editing of the 5-HT2C B-site. The distribution of this density plot will be highly dependent on the experimental design. For a screen, it would be expected to have a very narrow distribution with potentially a leftward skew or secondary peaks corresponding to inhibition within individual reactions.
Subsequent analysis will be highly dependent on the user’s needs. For example, when screening compounds without replicates, standard approaches used to identify hits in high-throughput screening data, such as z-score or strictly standardized mean difference approaches, could be employed. Alternatively, if the goal is to determine the potency of a putative ADAR1 inhibitor, multiple approaches could be used to generate dose-response curves and calculate IC50 values.
A. Analysis of sequencing data
1. Download Table S2 and the analysis script (analyze_fastq.sh) and place them in a directory with your .fastq files for each read (R1 and R2).
2. Open Table S2 in Microsoft Excel and fill in the missing information in the column titled “Reaction_condition” and save as “annotation.csv.”
3. In the terminal, navigate to the directory above and make analyze_fastq.sh executable by using the following command:
chmod +x analyze_fastq_unmerged.sh4. Run the analysis script by using the following command, replacing “your_file_name_” with the appropriate text:
./analyze_fastq_unmerged.sh your_file_name_R1.fastq your_file_name_R2.fastqNote: The script will generate progress updates as it runs. The first updates relate to processing of the .fastq files and will include the number of reads processed and the estimated time remaining. The script will provide additional updates when the processing of the .fastq files is completed and the next step begins. Runtime and memory usage will be dependent on sequencing depth and the number of barcodes detected, respectively. As an example, analysis of a 4 million read paired-end dataset took 17 min and 54 MB of RAM on a standard desktop computer.
Validation of protocol
For validation of this assay, we assessed eight different reaction conditions, with twelve technical replicates of each. The reactions were set up as described above, with three possible changes: the presence or absence of ADAR1, the presence or absence of the editing substrate, and the use of a pseudo-edited substrate either alone or in combination with the standard editing substrate. The pseudo-edited 5-HT2C has a G at the B-site and was generated as described above for 5-HT2C. By performing the assay with the standard substrate, the pseudo-edited substrate, or mixtures of each, we aimed to assess how well the assay performed at multiple levels of editing. Each condition and the expected level of editing for each is described in Table 17.
Table 17. Conditions evaluated in the validation experiment
| 5-HT2C | Pseudo-edited 5-HT2C | ADAR1 | Expected percent editing |
|---|---|---|---|
| - | - | - | N/A |
| 100% | - | + | 76%* |
| 100% | - | - | 0% |
| 75% | 25% | - | 25% |
| 50% | 50% | - | 50% |
| 25% | 75% | - | 75% |
| - | 100% | + | 100% |
| - | 100% | - | 100% |
*Based on Sanger sequencing.
Since cDNA synthesis occurs in the same well as the editing reaction, it is possible that inhibitors being evaluated could inhibit reverse transcriptase. To simulate this possibility, for three of the twelve technical replicates for each of the reaction conditions above, we omitted reverse transcriptase from the RT working mix.
To generate Sanger sequencing data for each of the conditions above for comparison, we pooled one-sixth of each of the nine technical replicates that received reverse transcriptase and separately processed each by purifying the cDNA and amplifying the cDNA as described in the protocol above. For the three technical replicates that did not receive reverse transcriptase, one-sixth of the reaction was discarded. Sanger sequencing was performed with the MPEA PCR F primer. The remaining cDNA for all reactions was pooled and processed as described in the protocol above.
For this validation experiment, sequencing was performed as a spike-in on a 2 × 150 run, generating ~4 million reads (raw sequencing data is available under accession PRJNA1496410). The summary plots generated by the analysis pipeline are shown in Figure 7a and c. The density plot for total counts (Figure 7a) shows a bimodal distribution, which is consistent with the expectation that reactions either lacking RNA or reverse transcriptase would not generate cDNA. This can be more clearly seen in Figure 7b, which shows total counts for each reaction condition. Similarly, the density plot for percent editing (Figure 7c) is consistent with the reaction conditions described in Table 17, with multiple peaks and a broad distribution ranging from 0 to 100% editing. Percent editing for each reaction condition, except those lacking the substrate RNA or reverse transcriptase, is shown in Figure 7d. Overall, the percent editing measured by our approach strongly correlates with both the expected percent editing for each condition and percent editing measured by Sanger sequencing (Figure 7e–g).
Using data from this validation experiment, we assessed technical replicate variability by determining the coefficient of variance for the nine technical replicates containing the 5-HT2C substrate and ADAR1. The coefficient of variance was 1.9%, indicating little variance between technical replicates. To determine the Z’ factor for the assay, we used data from the reactions containing the 5-HT2C substrate and ADAR1 as the positive control and those containing the 5-HT2C substrate without ADAR1 as the negative control (nine technical replicates for each condition). With these data, we determined the Z’ factor to be 0.92, indicating excellent assay performance that is sufficient for high-throughput screening.
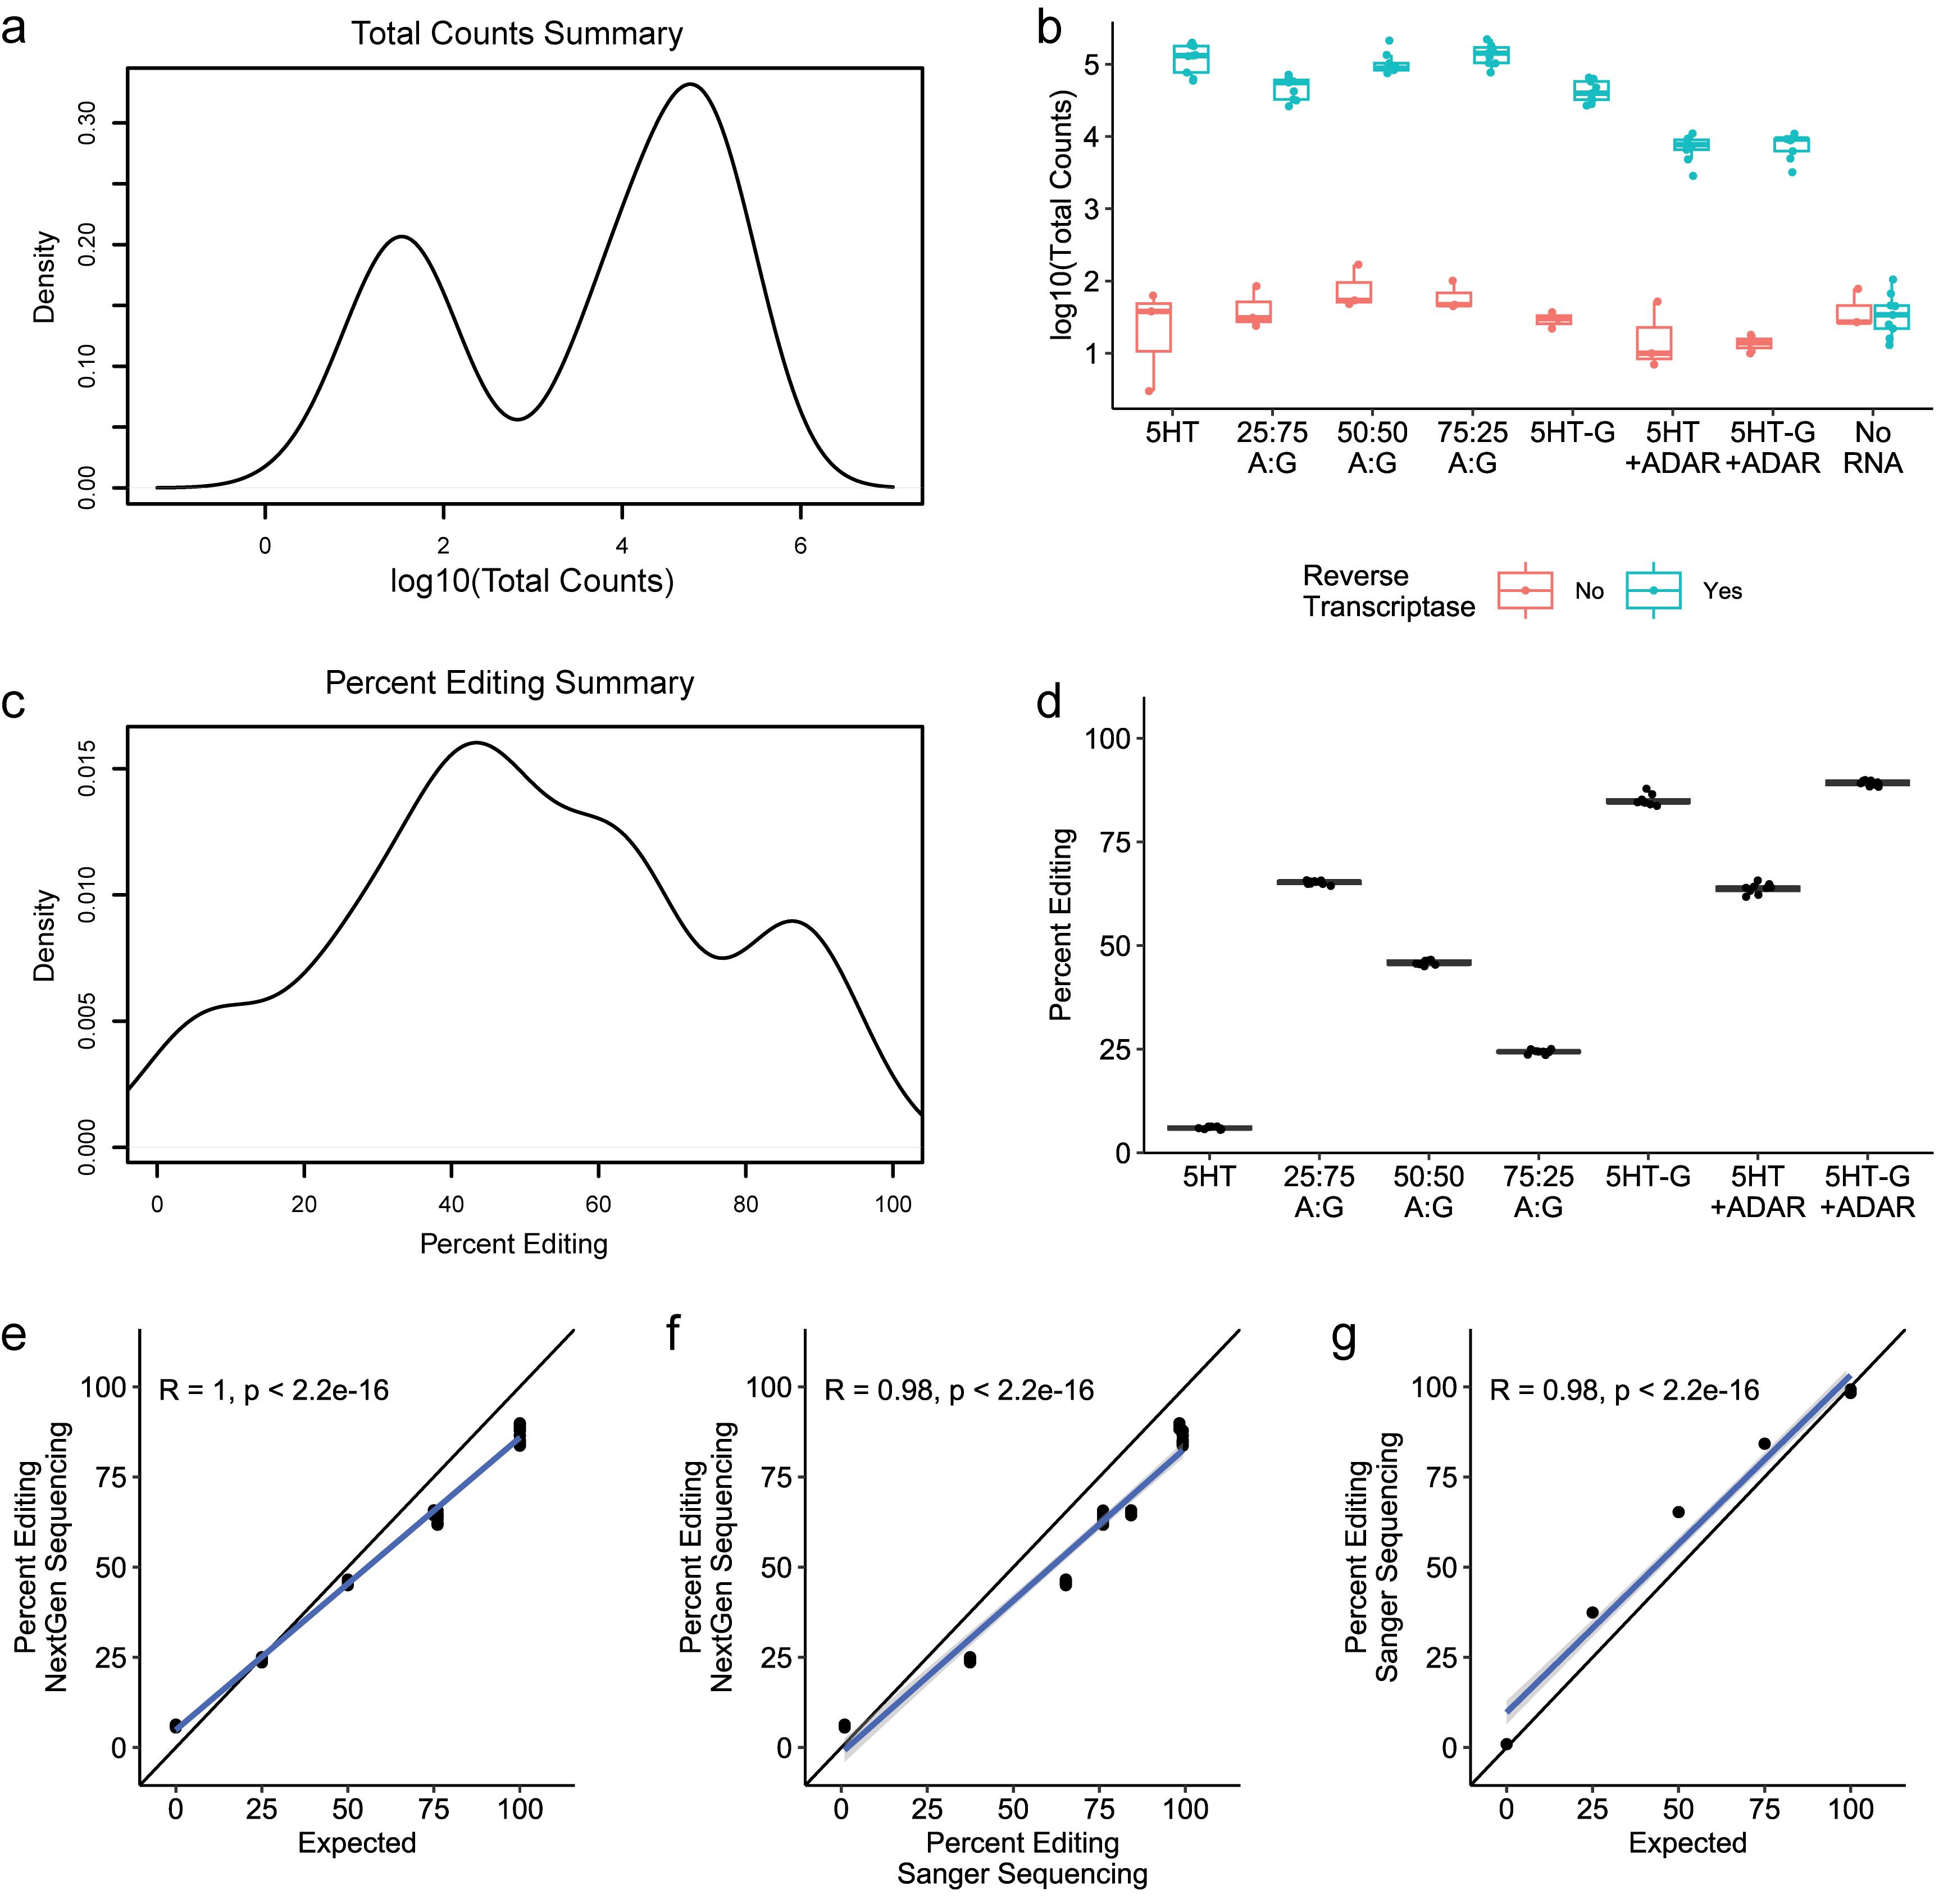
Figure 7. Experimental validation and comparison to Sanger sequencing. (a) Density plot of total counts, or sequencing reads for each barcode, as generated by the analysis pipeline. (b) Total counts associated with each barcode for all reaction conditions. “5HT” indicates the reaction containing the 5-HT2C editing substrate RNA; “5HT-G” indicates the reaction containing a pseudo-edited 5-HT2C RNA, or some mix of both; “+ADAR” indicates the reaction containing ADAR1-p150. (c) Density plot of percent editing as generated by the analysis pipeline. (d) Percent editing for each reaction condition; data for reactions that did not receive RNA or reverse transcriptase have been removed. (e–g) Comparisons between percent editing as measured by next-generation sequencing, Sanger sequencing, and/or the expected percent editing as described in Table 17. Quantification of A-to-I editing by Sanger sequencing was performed as described previously [14].
General notes and troubleshooting
General notes
1. It is imperative that the user maintains RNase-free working conditions during sections A–D. Use nuclease-free tubes and filtered pipette tips.
2. While A-to-I editing, as measured by this assay, correlates strongly with expected results and Sanger sequencing of the same conditions, when compared to the expected results, the slope is less than 1 (Figure 7a). We suspect this is due to template switching during the amplification steps of library preparation, leading to barcodes being swapped at a very low rate. If this is the case, it may be possible to further optimize the PCR setup to reduce these artifacts; however, a simpler solution is to calibrate the data using known standards for 0 (5-HT2C without ADAR1) and 100% editing (pseudo-edited 5-HT2C, as in our validation experiment). We used this approach to calibrate the experimental data from our validation experiment, using data from four 0% editing and four 100% editing standard reactions. In brief, the measured and expected editing for the standards are fit to a linear model, and the slope and intercept of that model are then used to calculate the “adjusted percent editing” for all other reactions. Figure 8 shows that this calibration approach greatly improves accuracy. If the user wants to include calibration in their experimental design, they should include 0% and 100% editing standards (we recommend four of each on each 96-well plate) and use the modified analysis script analyze_fastq_w-adjustment.sh. The modified script requires the use of an annotation file that includes an additional column for the expected editing (0 or 100) for the standards (Table S3). The expected editing for all other reactions should be “NA.”
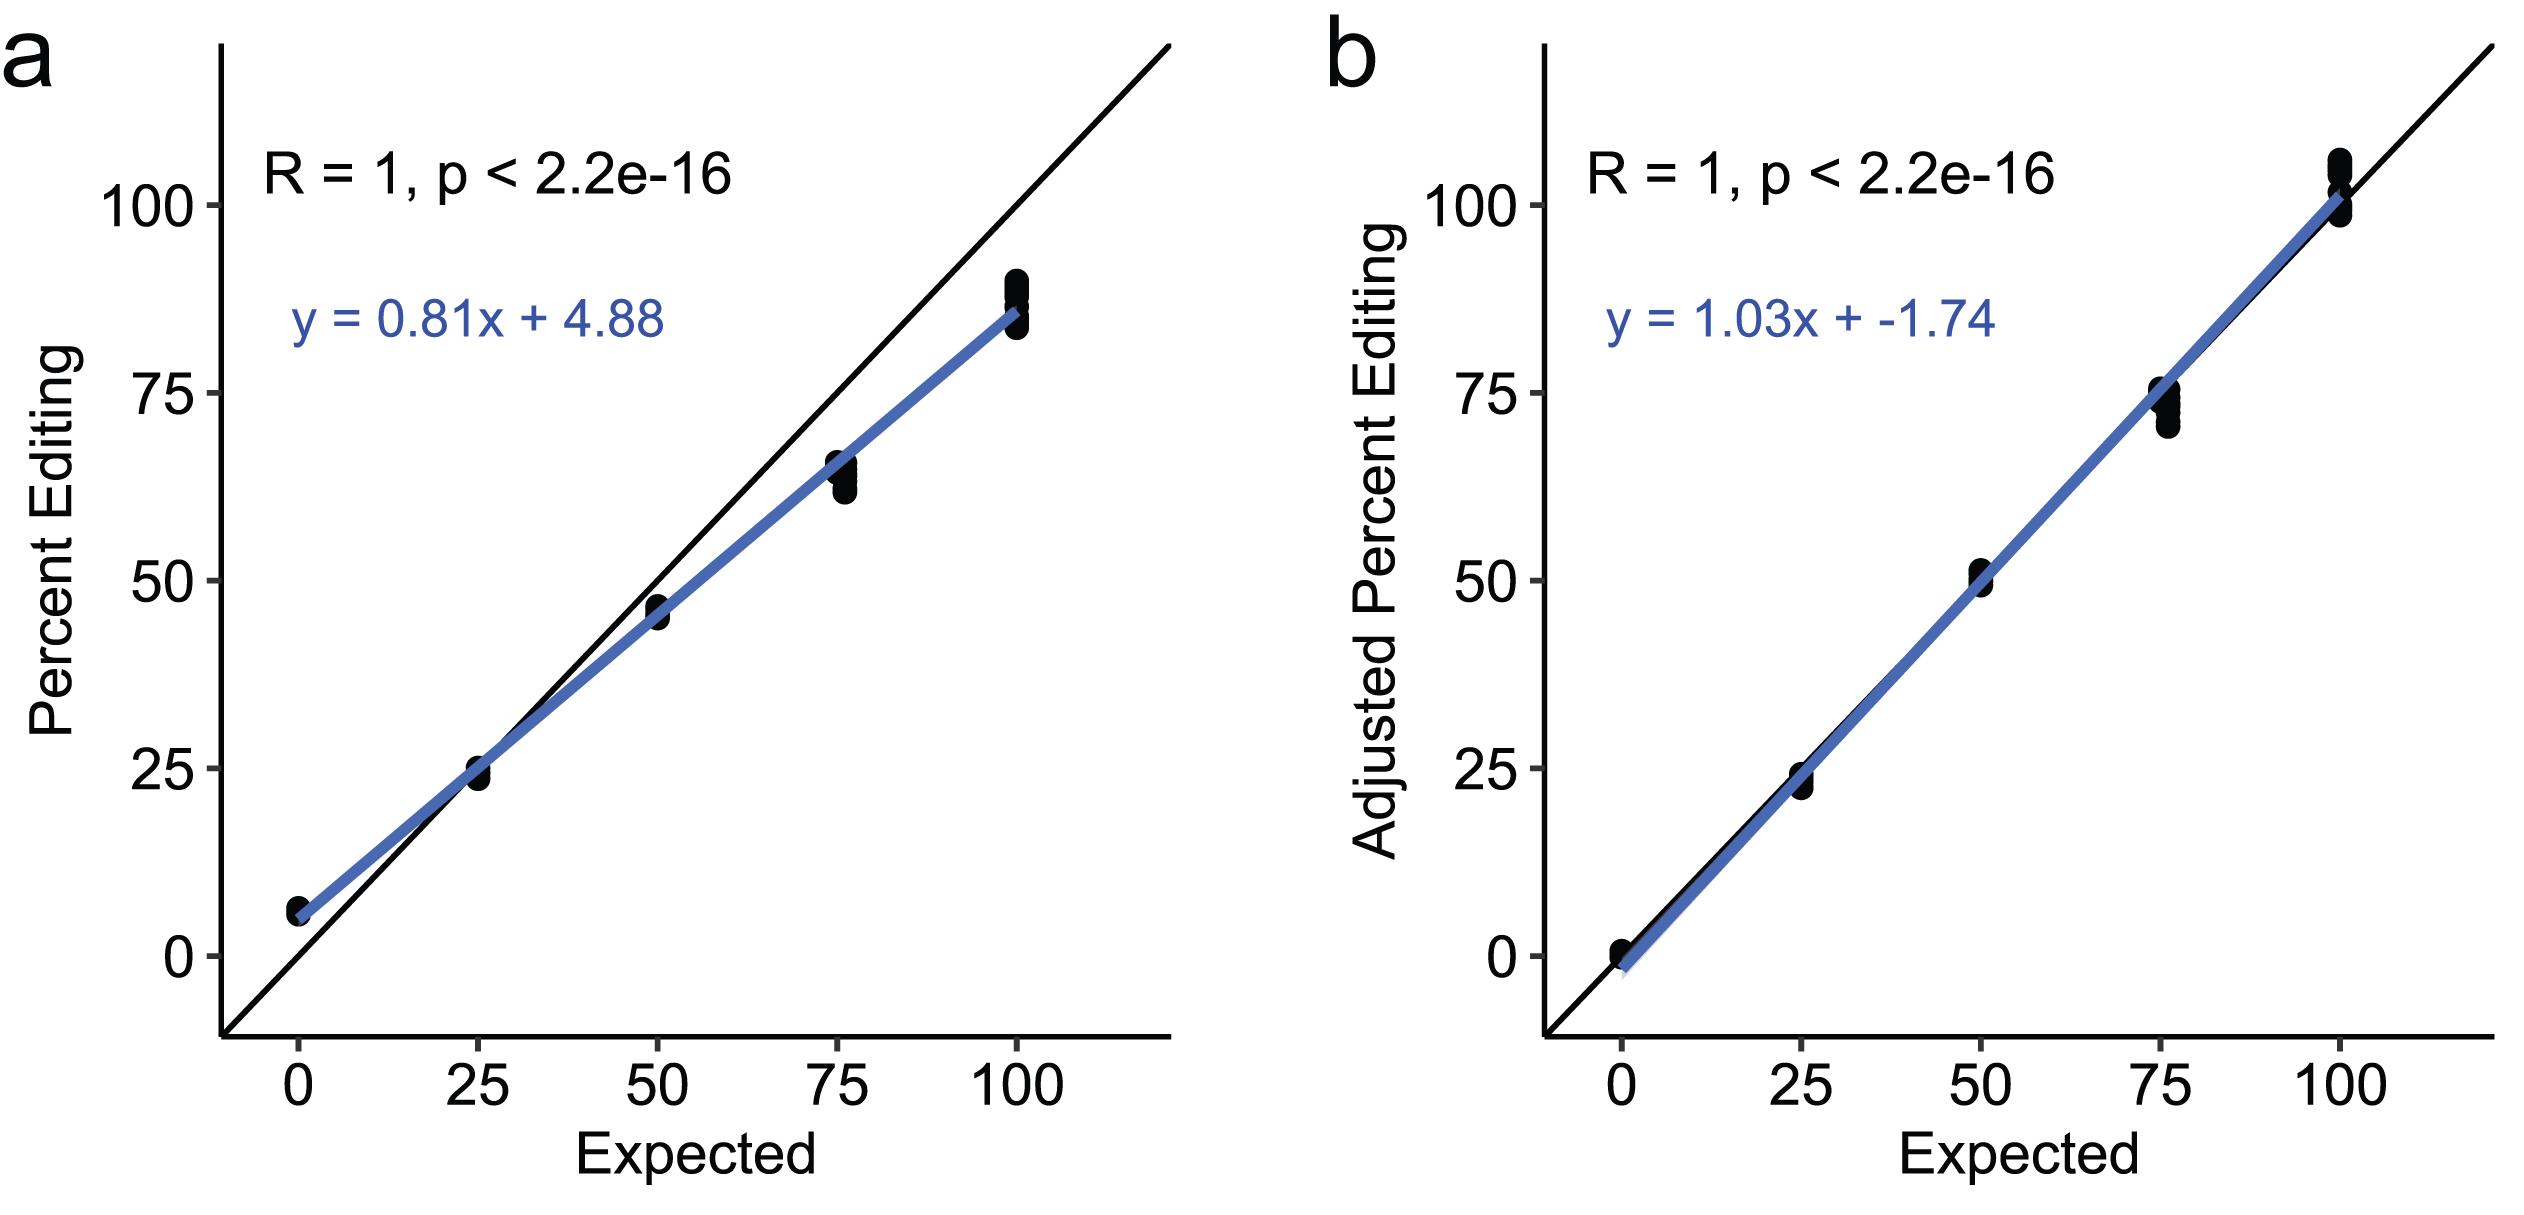
Figure 8. Assay accuracy is improved with calibration. (a) Comparison of measured percent editing and expected percent editing for the validation experiment, same as Figure 7e with the equation for the linear model included. (b) Comparison of adjusted percent editing and expected percent editing for the validation experiment.
3. The assay can be further multiplexed by additional barcoded reverse-transcription primers or by using multiple Illumina sequencing adapters with different index sequences.
4. The assay could be adapted to use in 384-well plates, though we have not tested this change. Additional barcoded reverse transcription primers will be needed. Liquid handling would be more challenging, so the use of automated liquid handlers would be beneficial. Depending on the plate used, reaction volumes may need to be adjusted to fit within the plate limitations.
5. Including “no RNA” or “no reverse transcriptase” controls in the experimental design (as in the validation study) could be useful, as they mimic RNA degradation or reverse transcriptase inhibition under the conditions being studied. These control reactions would simply be made by replacing the editing substrate from the RNA working mix or reverse transcriptase from the RT working mix with water. Alternatively, the user could compare “Total counts” across all conditions to identify reaction conditions in which RNA degradation or reverse transcriptase inhibition may have occurred: those reactions with “Total counts” that are substantially lower than the average for the experiment.
Troubleshooting
Problem 1: Too much or too little A-to-I editing.
Possible cause: Too much or too little ADAR1 is being used for the incubation time used in this protocol. We found the activity of ADAR1-p150 purchased as a purified recombinant protein to vary from lot to lot. The protocol above is based on a lot with lower activity.
Solutions: Adjust the incubation time for the A-to-I editing reaction or alter the final concentration of ADAR1 in the reaction.
Problem 2: Insufficient product at any step.
Possible cause: Something was left out of a reaction. There are multiple reaction mixes and steps in the protocol; omitting crucial components or using the wrong components are the most common problems we have encountered.
Solution: Be careful to add every component.
Problem 3: Insufficient read depth.
Possible cause: Poor library quality or underloading of the library due to inaccurate quantification. During library preparation, the wrong band was excised and purified following enrichment PCR. Quantification of the final library was not performed by a fluorometric method (Qubit), or the fluorometric assay was inaccurate due to user error or reagent degradation.
Solution: Ensure that the correct band is excised and purified following enrichment PCR. The size of the final library can be evaluated by agarose gel electrophoresis or other methods to verify it is the correct size. Perform fluorometric quantification of the final library in technical triplicates and verify whether all reagents are functioning properly by measuring an additional standard. Work with your sequencing facility to address underloading.
Supplementary information
The following supporting information can be downloaded here:
1. Table S1. Barcoded reverse transcription primers.
2. Table S2. Annotation template.
3. Table S3. Annotation template for analysis with calibration.
4. File S1. Annotated plasmid sequence for pTwist-5HT in .gb format.
5. File S2. Annotated plasmid sequence for pTwist-5HT_edit in .gb format.
Raw data for Figures 2–8 can be accessed on the Purdue University Research Repository at https://doi.org/10.4231/74E3-4R76.
Acknowledgments
This work was supported by NIH grants R00MD016946 and R35GM16221 and start-up funding from Purdue University and the Purdue Institute for Cancer Research. Thanks to Cassandra N. Smoak for assistance in proofreading the manuscript. This assay was developed from the Sanger-based approach for measuring A-to-I editing in biochemical assays used by the laboratory of Peter Beal, University of California Davis [28,29]. The Graphical overview was created in BioRender, Cottrell, K. A. (2026) https://BioRender.com/njl1eb9.
Author contributions
Conceptualization, K.A.C.; Investigation, E.N.G. and K.A.C.; Writing—Original Draft, E.N.G. and K.A.C.; Writing—Review & Editing, E.N.G. and K.A.C.; Funding acquisition, K.A.C.; Supervision, K.A.C.
Competing interests
The authors declare no conflicts of interest.
References
- Bazak, L., Haviv, A., Barak, M., Jacob-Hirsch, J., Deng, P., Zhang, R., Isaacs, F. J., Rechavi, G., Li, J. B., Eisenberg, E., et al. (2013). A-to-I RNA editing occurs at over a hundred million genomic sites, located in a majority of human genes. Genome Res. 24(3): 365–376. https://doi.org/10.1101/gr.164749.113
- Ramaswami, G. and Li, J. B. (2013). RADAR: a rigorously annotated database of A-to-I RNA editing. Nucleic Acids Res. 42: D109–D113. https://doi.org/10.1093/nar/gkt996
- Heraud-Farlow, J. E. and Walkley, C. R. (2020). What do editors do? Understanding the physiological functions of A-to-I RNA editing by adenosine deaminase acting on RNAs. Open Biol. 10(7): e200085. https://doi.org/10.1098/rsob.200085
- Higuchi, M., Maas, S., Single, F. N., Hartner, J., Rozov, A., Burnashev, N., Feldmeyer, D., Sprengel, R. and Seeburg, P. H. (2000). Point mutation in an AMPA receptor gene rescues lethality in mice deficient in the RNA-editing enzyme ADAR2. Nature. 406(6791): 78–81. https://doi.org/10.1038/35017558
- Higuchi, M., Single, F. N., Köhler, M., Sommer, B., Sprengel, R. and Seeburg, P. H. (1993). RNA editing of AMPA receptor subunit GluR-B: A base-paired intron-exon structure determines position and efficiency. Cell. 75(7): 1361–1370. https://doi.org/10.1016/0092-8674(93)90622-w
- Liddicoat, B. J., Piskol, R., Chalk, A. M., Ramaswami, G., Higuchi, M., Hartner, J. C., Li, J. B., Seeburg, P. H. and Walkley, C. R. (2015). RNA editing by ADAR1 prevents MDA5 sensing of endogenous dsRNA as nonself. Science. 349(6252): 1115–1120. https://doi.org/10.1126/science.aac7049
- Pestal, K., Funk, C. C., Snyder, J. M., Price, N. D., Treuting, P. M. and Stetson, D. B. (2015). Isoforms of RNA-Editing Enzyme ADAR1 Independently Control Nucleic Acid Sensor MDA5-Driven Autoimmunity and Multi-organ Development. Immunity. 43(5): 933–944. https://doi.org/10.1016/j.immuni.2015.11.001
- Mannion, N. M., Greenwood, S. M., Young, R., Cox, S., Brindle, J., Read, D., Nellåker, C., Vesely, C., Ponting, C. P., McLaughlin, P. J., et al. (2014). The RNA-Editing Enzyme ADAR1 Controls Innate Immune Responses to RNA. Cell Rep. 9(4): 1482–1494. https://doi.org/10.1016/j.celrep.2014.10.041
- Gannon, H. S., Zou, T., Kiessling, M. K., Gao, G. F., Cai, D., Choi, P. S., Ivan, A. P., Buchumenski, I., Berger, A. C., Goldstein, J. T., et al. (2018). Identification of ADAR1 adenosine deaminase dependency in a subset of cancer cells. Nat Commun. 9(1): 5450. https://doi.org/10.1038/s41467-018-07824-4
- Liu, H., Golji, J., Brodeur, L. K., Chung, F. S., Chen, J. T., deBeaumont, R. S., Bullock, C. P., Jones, M. D., Kerr, G., Li, L., et al. (2018). Tumor-derived IFN triggers chronic pathway agonism and sensitivity to ADAR loss. Nat Med. 25(1): 95–102. https://doi.org/10.1038/s41591-018-0302-5
- Kung, C. P., Cottrell, K. A., Ryu, S., Bramel, E. R., Kladney, R. D., Bao, E. A., Freeman, E. C., Sabloak, T., Maggi, L., Weber, J. D., et al. (2020). Evaluating the therapeutic potential of ADAR1 inhibition for triple-negative breast cancer. Oncogene. 40(1): 189–202. https://doi.org/10.1038/s41388-020-01515-5
- Ward, S. V., George, C. X., Welch, M. J., Liou, L. Y., Hahm, B., Lewicki, H., de la Torre, J. C., Samuel, C. E. and Oldstone, M. B. (2010). RNA editing enzyme adenosine deaminase is a restriction factor for controlling measles virus replication that also is required for embryogenesis. Proc Natl Acad Sci USA. 108(1): 331–336. https://doi.org/10.1073/pnas.1017241108
- Gélinas, J. F., Clerzius, G., Shaw, E. and Gatignol, A. (2011). Enhancement of Replication of RNA Viruses by ADAR1 via RNA Editing and Inhibition of RNA-Activated Protein Kinase. J Virol. 85(17): 8460–8466. https://doi.org/10.1128/jvi.00240-11
- Smoak, C. N., Gardner, E. N., Chua, R. N. and Cottrell, K. A. (2025). ZYS-1 is not an ADAR1 inhibitor. RNA. 31(12): 1703–1711. https://doi.org/10.1261/rna.080721.125
- Cottrell, K. A., Soto-Torres, L., Dizon, M. G. and Weber, J. D. (2021). 8-Azaadenosine and 8-Chloroadenosine are not Selective Inhibitors of ADAR. Cancer Res Commun. 1(2): 56–64. https://doi.org/10.1158/2767-9764.crc-21-0027
- Ding, H. Y., Yang, W. Y., Zhang, L. H., Li, L., Xie, F., Li, H. Y., Chen, X. Y., Tu, Z., Li, Y., Chen, Y., et al. (2020). 8-Chloro-Adenosine Inhibits Proliferation of MDA-MB-231 and SK-BR-3 Breast Cancer Cells by Regulating ADAR1/p53 Signaling Pathway. Cell Transplant. 29: 096368972095865. https://doi.org/10.1177/0963689720958656
- Zipeto, M. A., Court, A. C., Sadarangani, A., Delos Santos, N. P., Balaian, L., Chun, H. J., Pineda, G., Morris, S. R., Mason, C. N., Geron, I., et al. (2016). ADAR1 Activation Drives Leukemia Stem Cell Self-Renewal by Impairing Let-7 Biogenesis. Cell Stem Cell. 19(2): 177–191. https://doi.org/10.1016/j.stem.2016.05.004
- Minakuchi, M., Zhang, H., Cassel, J., Shiromoto, Y., Villanueva, J., Skordalakes, E., Salvino, J. M., Li, Q. and Nishikura, K. (2026). Identification of ADAR1i-124: The first effective A-to-I RNA editing inhibitor with promising cancer therapeutic potential. iScience. 29(2): 114615. https://doi.org/10.1016/j.isci.2025.114615
- Knutson, S. D., Ayele, T. M. and Heemstra, J. M. (2018). Chemical Labeling and Affinity Capture of Inosine-Containing RNAs Using Acrylamidofluorescein. Bioconjugate Chem. 29(9): 2899–2903. https://doi.org/10.1021/acs.bioconjchem.8b00541
- Keegan, L. P., Rosenthal, J. J., Roberson, L. M. and O'Connell, M. A. (2007). Purification and Assay of ADAR Activity. Meth Enzymol. 301–317. https://doi.org/10.1016/s0076-6879(07)24014-5
- Zhang, Z. and Carmichael, G. G. (2004). Methods for the Analysis of Adenosine-to-Inosine Editing in RNA. In: Schoenberg, D.R. (Eds.). mRNA Processing and Metabolism. 257: 075–084. https://doi.org/10.1385/1-59259-750-5:075
- Lai, F., Drakas, R. and Nishikura, K. (1995). Mutagenic Analysis of Double-stranded RNA Adenosine Deaminase, a Candidate Enzyme for RNA Editing of Glutamate-gated Ion Channel Transcripts. J Biol Chem. 270(29): 17098–17105. https://doi.org/10.1074/jbc.270.29.17098
- Roberson, L. M. and Rosenthal, J. J. (2006). An accurate fluorescent assay for quantifying the extent of RNA editing. RNA. 12(10): 1907–1912. https://doi.org/10.1261/rna.166906
- Cattenoz, P. B., Taft, R. J., Westhof, E. and Mattick, J. S. (2012). Transcriptome-wide identification of A > I RNA editing sites by inosine specific cleavage. RNA. 19(2): 257–270. https://doi.org/10.1261/rna.036202.112
- Morse, D. P. (2004). Identification of Substrates for Adenosine Deaminases That Act on RNA. Methods Mol Biol. 265: 199–218. https://doi.org/10.1385/1-59259-775-0:199
- Zhang, M., Deng, X., Gao, Y. and Wang, J. (2025). Re: Concerns Regarding the Validation of ZYS-1 as a Bona Fide ADAR1 Inhibitor. bioRxiv. e641892. https://doi.org/10.1101/2025.03.07.641892
- Fritzell, K., Xu, L. D., Otrocka, M., Andréasson, C. and Öhman, M. (2018). Sensitive ADAR editing reporter in cancer cells enables high-throughput screening of small molecule libraries. Nucleic Acids Res. 47(4): e22–e22. https://doi.org/10.1093/nar/gky1228
- Mendoza, H. G., Matos, V. J., Park, S., Pham, K. M. and Beal, P. A. (2023). Selective Inhibition of ADAR1 Using 8-Azanebularine-Modified RNA Duplexes. Biochemistry. 62(8): 1376–1387. https://doi.org/10.1021/acs.biochem.2c00686
- Thuy-Boun, A. S., Thomas, J. M., Grajo, H. L., Palumbo, C. M., Park, S., Nguyen, L. T., Fisher, A. J. and Beal, P. A. (2020). Asymmetric dimerization of adenosine deaminase acting on RNA facilitates substrate recognition. Nucleic Acids Res. 48(14): 7958–7972. https://doi.org/10.1093/nar/gkaa532
- Burns, C. M., Chu, H., Rueter, S. M., Hutchinson, L. K., Canton, H., Sanders-Bush, E. and Emeson, R. B. (1997). Regulation of serotonin-2C receptor G-protein coupling by RNA editing. Nature. 387(6630): 303–308. https://doi.org/10.1038/387303a0
- Buschmann, T. (2017). DNABarcodes: an R package for the systematic construction of DNA sample tags. Bioinformatics. btw759. https://doi.org/10.1093/bioinformatics/btw759
Article Information
Publication history
Received: Jul 22, 2026
Accepted: Oct 14, 2026
Available online: Nov 3, 2026
Published: Dec 5, 2026
Copyright
© 2026 The Author(s); This is an open access article under the CC BY-NC license (https://creativecommons.org/licenses/by-nc/4.0/).
How to cite
Gardner, E. N. and Cottrell, K. A. (2026). A Multiplexed Assay for High-Throughput Evaluation of In Vitro A-to-I Editing. Bio-protocol 16(23): e5876. DOI: 10.21769/BioProtoc.5876.

 Download Citation in RIS Format
Do you have any questions about this protocol?
Post your question to gather feedback from the community. We will also invite the authors of this article to respond.
 Post a Question


