


- Protocols

- Articles and Issues
- For Authors
- About
- Become a Reviewer


Measuring the ADP-Ribosylation-Dependent Release of PARP2 From DNA Using Stopped-Flow Fluorescence Polarization

(*contributed equally to this work) Published: Vol 16, Iss 23, Dec 5, 2026 DOI: 10.21769/BioProtoc.5874 Views: 39
Reviewed by: Elena A. OstrakhovitchSumeet NayakAntara SenguptaVipin K. Yadav
 PDF
 Ask a question

Original research article
The authors used this protocol in:

Jun 2026

Protocol Collections
Comprehensive collections of detailed, peer-reviewed protocols focusing on specific topics



Abstract
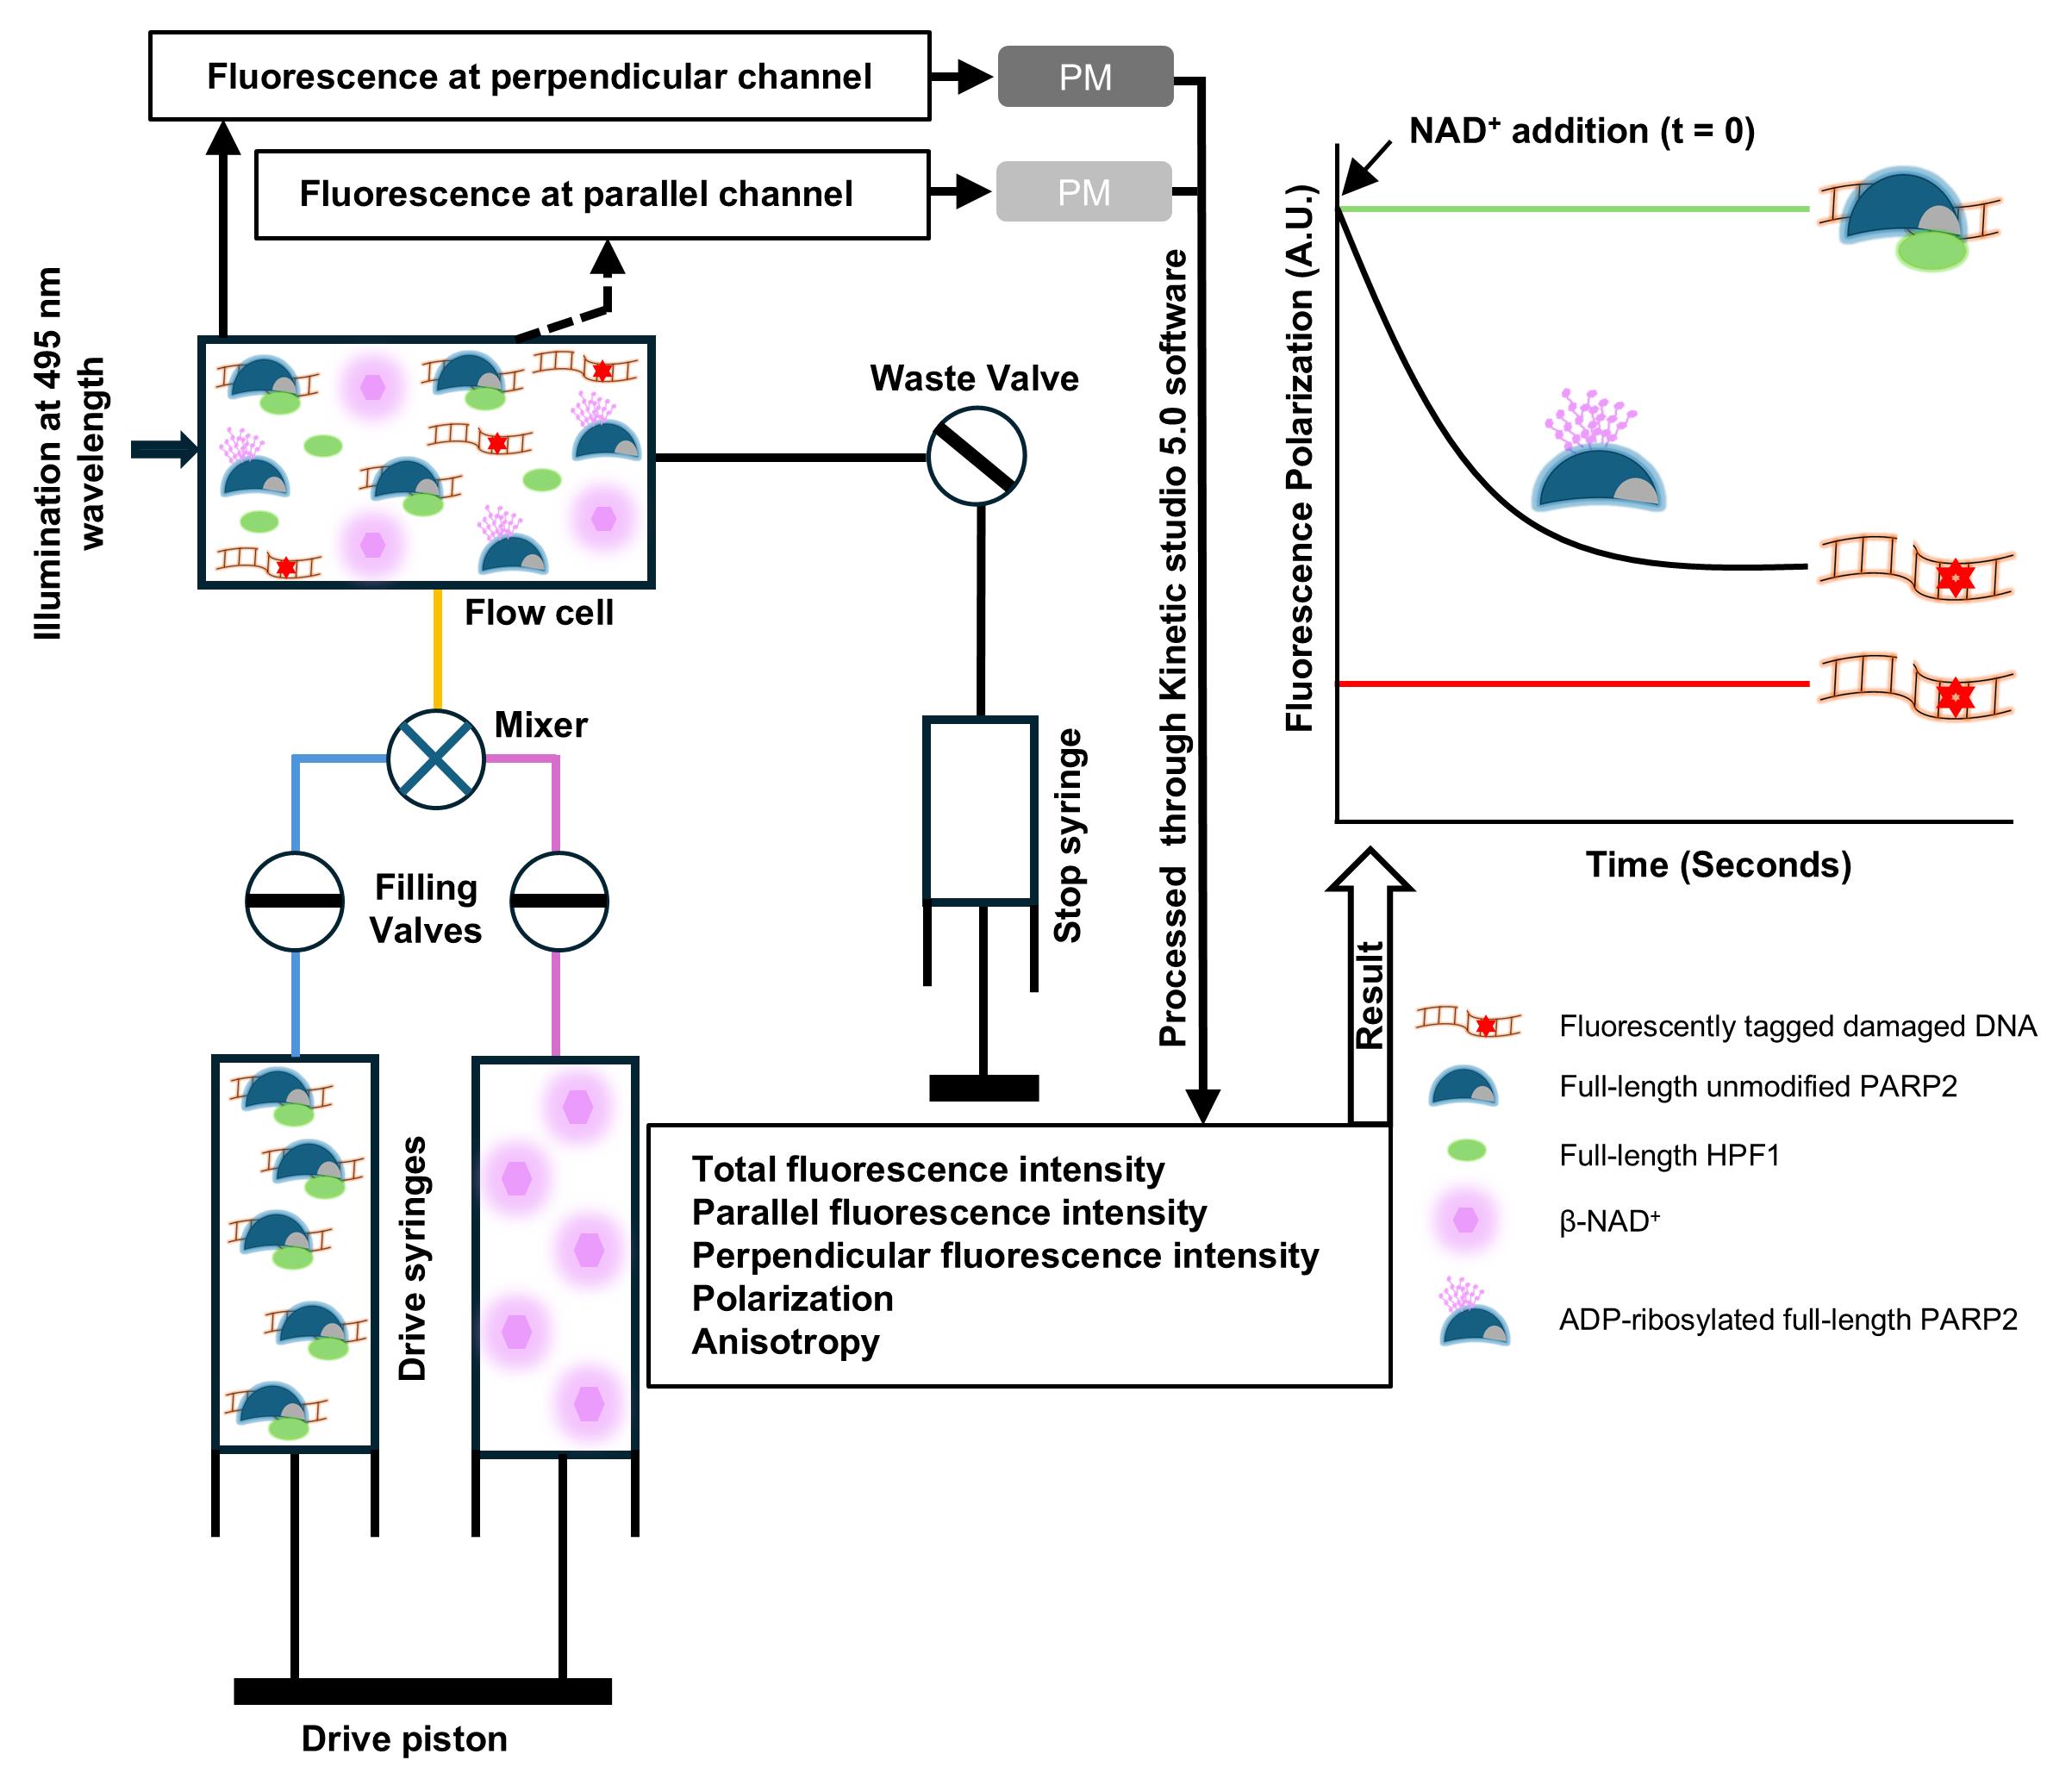
The ADP-ribosyltransferase PARP2 plays a major role in DNA damage repair mechanisms. It recognizes damaged DNA, resulting in poly-ADP-ribosylation (PARylation) of target proteins and itself. The automodification of PARP2, especially at N-terminal serine residues in the presence of histone PARylation factor 1 (HPF1), leads to its release from DNA. Here, we describe a stopped-flow-based fluorescence polarization method for the real-time measurement of PARP2 release from DNA damage by monitoring the change in fluorescence anisotropy of fluorescein-labeled DNA. The method is based on rapid mixing of a preformed DNA-PARP2-HPF1 complex with NAD+ and monitoring the release of PARP2 from DNA. The stopped-flow-based fluorescence anisotropy method provides a fast and sensitive measurement of PARP2 release from DNA that can be widely used to study the effect of PARP2 mutants or inhibitors on PARP2 activity and dissociation from DNA.
Key features
• Complete description of the application of a fluorescence polarization (FP)-based method to measure PARP2 DNA binding and release kinetics.
• Detailed procedures for measuring PARylation-dependent release of PARP2 from DNA using fluorescence polarization.
• Development of a sensitive, rapid, and easy-to-set-up method for measuring PARP2 release from DNA.
• The method is useful for measuring the effects of drugs on PARylation activity through PARP2 release from DNA.
Keywords: DNA damage DNA–protein interaction
PARP2
Poly ADP-ribosylation
Fluorescence polarization
Graphical overview
Background
PARP2 is involved in DNA damage repair mechanisms [1]. It recognizes DNA damage sites and activates the DNA repair cascade by producing poly-ADP-ribosyl moieties (PAR) from NAD+ to itself (automodification) and other target proteins [1–4]. PARP2 activity is modulated by a protein interacting with the PARP2 catalytic domain, Histone Parylation Factor 1 (HPF1), increasing the amount of automodification and targeting it to the serine residues [5,6]. PARP2 automodification results in an increased electrostatic repulsion due to the negative charge of PAR, which leads to PARP2 release from DNA [7,8]. To measure automodification-dependent PARP2 release from DNA, we used fluorescence polarization/fluorescence anisotropy (FP/FA). The fluorescently labeled DNA molecules rotate quickly in solution but, upon protein binding, the large-size DNA–protein complex exhibits lower rotational diffusion, thus increasing anisotropy. Therefore, changes in anisotropy are used to measure protein–DNA interactions and binding dynamics.
First, FP measuring conditions for DNA-PARP2 binding studies were optimized in 96-well plates using a Tecan Infinity M1000pro plate reader. To measure the automodification-dependent PARP2 release from DNA, a saturating (Kd = 4.8 ± 2.9 nM) concentration of PARP2 (200 nM) was mixed with 5 nM oligo-DNA, resulting in an increase in FP signal compared to oligo alone. The automodification reaction was initiated by the addition of 75 μM NAD+, and a decrease in FP signal was observed, reflecting PARP2 release from DNA. In the presence of HPF1, the FP signal decreased more rapidly, supporting the increased automodification of PARP2. However, in plate reader–based FP measurements, due to PAR generation, an initial increase in FP and subsequent PARP2 release was observed [9]. This complicates the monitoring and measurement of PARP2 release rates from DNA, especially when comparing release kinetics for multiple protein constructs. Therefore, to monitor comparative PARP2 release kinetics, we optimized a fluorescence polarization assay using stopped-flow for real-time monitoring of PARP2 release from DNA.
Materials and reagents
Reagents
1. Fluorescein sodium salt (Sigma-Aldrich, catalog number: F6377-100G, CAS: 518-47-8)
2. Fluorescein-labeled nicked double-stranded DNA with a 5′-phosphate oligo (5′ p GGA AGT CTT iFluorT TTG ACT TCC TCG AAG CTT TTG CTT CGA 3′) (Integrated DNA Technologies)
3. 4-(2-hydroxyethyl)-1-piperazineethanesulfonic acid (HEPES) (Fisher Bioreagents, catalog number: BP310-1, CAS: 7365-45-9)
4. Sodium chloride (NaCl) (Fisher Bioreagents, catalog number: BP358-1, CAS: 7647-14-5)
5. Bovine serum albumin (BSA) (Millipore, catalog number: 81-053-3, CAS: 9048-46-8)
6. Tris(2-carboxyethyl)phosphine (TCEP) (Apollo Scientific, catalog number: BIT0122, CAS: 51805-45-9)
7. Ethylenediaminetetraacetic acid (EDTA) (Amresco, catalog number: M101-1, CAS: 6381-92-6)
8. β-nicotinamide adenine dinucleotide (β-NAD+) (Sigma Life Science, catalog number: N0632-1G, CAS: 20111-18-6)
Solutions
1. Fluorescence polarization buffer (see Recipes)
2. Fluorescein solution (see Recipes)
3. Oligo stock preparation buffer (pH 8.0) (see Recipes)
4. Protein purifications (see Recipes)
5. 10 mM fluorescein (sodium salt) solution (see Recipes)
6. β-NAD+ in Milli-Q water (see Recipes)
Recipes
1. Fluorescence polarization buffer (pH 8.0)
| Reagent | Final concentration | Quantity or volume |
|---|---|---|
| HEPES (1 M) | 10 mM | 500 μL |
| NaCl (5 M) | 150 mM | 1.5 mL |
| TCEP (0.5 M) | 0.1 mM | 10 μL |
| EDTA (100 mM) | 0.1 mM | 50 μL |
| BSA (100 mg/mL) | 0.1 mg/mL | 50 μL |
| Distilled water | - | up to 50 mL |
Prepare fresh prior to use. Adjust to pH 8.0 using an electronic pH meter and filter the buffer using a 0.45-μm syringe filter.
2. Fluorescein solution (1 mL)
| Reagent | Final concentration | Quantity or volume |
|---|---|---|
| Fluorescein (10 mM) | 10 μM | 1 μL |
| Fluorescence polarization buffer | - | 999 μL |
3. Oligo stock preparation buffer (pH 8.0)
| Reagent | Final concentration | Quantity or volume |
|---|---|---|
| HEPES (1 M) | 10 mM | 100 μL |
| NaCl (5 M) | 100 mM | 200 μL |
| EDTA (100 mM) | 1 mM | 100 μL |
| Distilled water | - | up to 10 mL |
Store at 4 °C. Adjust to pH 8.0 using an electronic pH meter.
4. Protein purifications
| Protein | Length (amino acid) | Uniprot id | Purification reference |
|---|---|---|---|
| Full-length PARP2 | 583 | Q9UGN5 | Obaji et al. [10] |
| Full-length HPF1 | 346 | Q9NWY4 | Dhakar et al. [11] |
5. 10 mM fluorescein (sodium salt) solution
Prepare in absolute ethanol by mixing the powder in the solvent.
6. β-NAD+ in Milli-Q water
Prepare by mixing the powder in the solvent.
Laboratory supplies
1. 96-well polypropylene black microplates (Grenier Bio-One, catalog number: 650209)
2. 0.45 μm Minisart PES syringe filter (Sartorius, catalog number: 16533)
3. 5 mL plastic syringe (Fisherbrand, catalog number: 14955452)
4. 520 nm bandpass filter, FWHM 10 nm, 25 mm diameter (Andover Corporation, catalog number: 520FS10-25)
Equipment
1. Hi-Tech Scientific Kinet Asyst Stopped-Flow Spectrometer (TgK Scientific, model: SHU-61DX2)
2. Fisher brand water bath (Unity Lab Services, model: FSGPD05)
Software and datasets
1. GraphPad Prism 10.0 (Siemens ecosystem, 10.0)
2. Kinetic studio 5.0 (TgK Scientific, 5.0)
Procedure
A. Preparation of fluorescein-labeled nicked double-stranded DNA
Note: HPLC-purified fluorescein-labeled DNA was purchased from IDT.
1. Resuspend the lyophilized DNA in oligo stock preparation buffer to yield a 100 μM oligo stock.
2. Heat the oligonucleotide at 95 °C for 5 min in a water bath and cool on ice for 10 min to allow the formation of the nicked dumbbell-shaped secondary structure.
3. After 10 min, aliquot the oligo into 10 μL volumes and store at -20 °C.
B. Setting up the stopped-flow instrument for kinetic measurements
Note: Follow the specific instrument instructions.
1. Turn on the instrument 30 min in advance to allow sufficient warm-up of the lamp and stabilization of light intensity.
2. Place the bandpass filters in both parallel (main) and perpendicular (auxiliary) photomultiplier (PM) channels.
3. Wash the drive syringes and flow cell with water and then with buffer.
4. Fill one of the drive syringes with fluorescence polarization buffer and another syringe with 10 μM fluorescein diluted in the same buffer. Run at least three dummy shots.
5. For data collection, select data type as “fluorescence” and data type modifier as “anisotropy polarization” for both detection channels in the control panel of Kinetic studio 5.0 software.
6. Data points can be selected as per the needs of an experiment, i.e., 512, 1,024, etc., in the photomultiplier control settings.
7. Excite the fluorophore at 495 nm wavelength, drive the injection, and monitor the fluorescence intensities at 520 nm wavelength for both main and auxiliary channels using parallel and perpendicular polarized light, respectively.
8. Align the main and auxiliary signal intensities by adjusting the voltage of the PMs. This is important to balance the G-factor between parallel and perpendicular channels.
9. Save the parameters and measure anisotropy for fluorescently labeled oligos.
C. Measuring the ADP-ribosylation-dependent DNA release kinetics
1. To measure the real-time kinetics in conditions approaching full PARP2 and DNA occupancy, while at the same time avoiding the complication of extremely high and excess protein concentrations (as described in background information), prepare a reaction mixture in FP buffer using 400 nM (2× concentration) of each fluorescein-labeled oligo, PARP2 and HPF1.
2. Keep the filling valve in the load position and fill (1 mL, maximum syringe capacity) one of the drive syringes with the oligo–protein mixture and another with 1 mM NAD+.
3. Make sure both syringes are filled with the same amount of sample and are in contact with the drive piston so that the same amount of sample is injected during the experiment.
4. Switch both filling valves into the drive position.
5. Flush the waste from the stop-syringe and perform at least three dummy shots to fill the solvent tubing path and the flow cell with fresh protein and NAD+ samples.
6. Inject the protein and NAD+ (40 μL from each syringe) using the Kinetic studio software, which results in final concentrations of 200 nM and 500 μM of Oligo-PARP2-HPF1 complex and NAD+, respectively, in the reaction.
7. Monitor the fluorescence signals as single shots or as a series of shots (for example, 4 shots for 60 s each with 1,024 data points).
8. Once the reaction is completed, the software displays polarization, anisotropy, total fluorescence intensity, and fluorescence intensities from the main channel and the auxiliary channel.
9. Data can be collected through a series of shots, and average data for multiple reactions can also be collected.
10. Data can be analyzed using the built-in software Kinetic studio 5.0.
11. Export the raw data in “csv/txt” format for plotting the graph and analyzing data using other software.
Data analysis
1. To analyze the PARP2 release from DNA, open the anisotropy data in the Kinetic studio software.
2. Open the Data Analysis control panel and select the data range (t = 0 to the final data point) and the fitting model “first exponential decay (Y = -A × exp(-R × X) + C),” where:
Y = Anisotropy at given time
A = Maximum anisotropy
R = Rate of PARP2 release from DNA
C = Final anisotropy value after PARP2 automodification
3. Using the first exponential decay equation, calculate the rates of PARP2 release from DNA.
4. Average the release rates from independent data acquisitions and calculate the standard deviation.
5. To plot graphs using GraphPad software, first import the stopped-flow result from the csv/txt file into the Excel file.
6. Use time and anisotropy values in GraphPad and plot a graph (Figure 1).
7. For comparative analysis of multiple datasets, anisotropy values can be normalized using 100% for the oligo–protein complex and 0% for oligo alone.
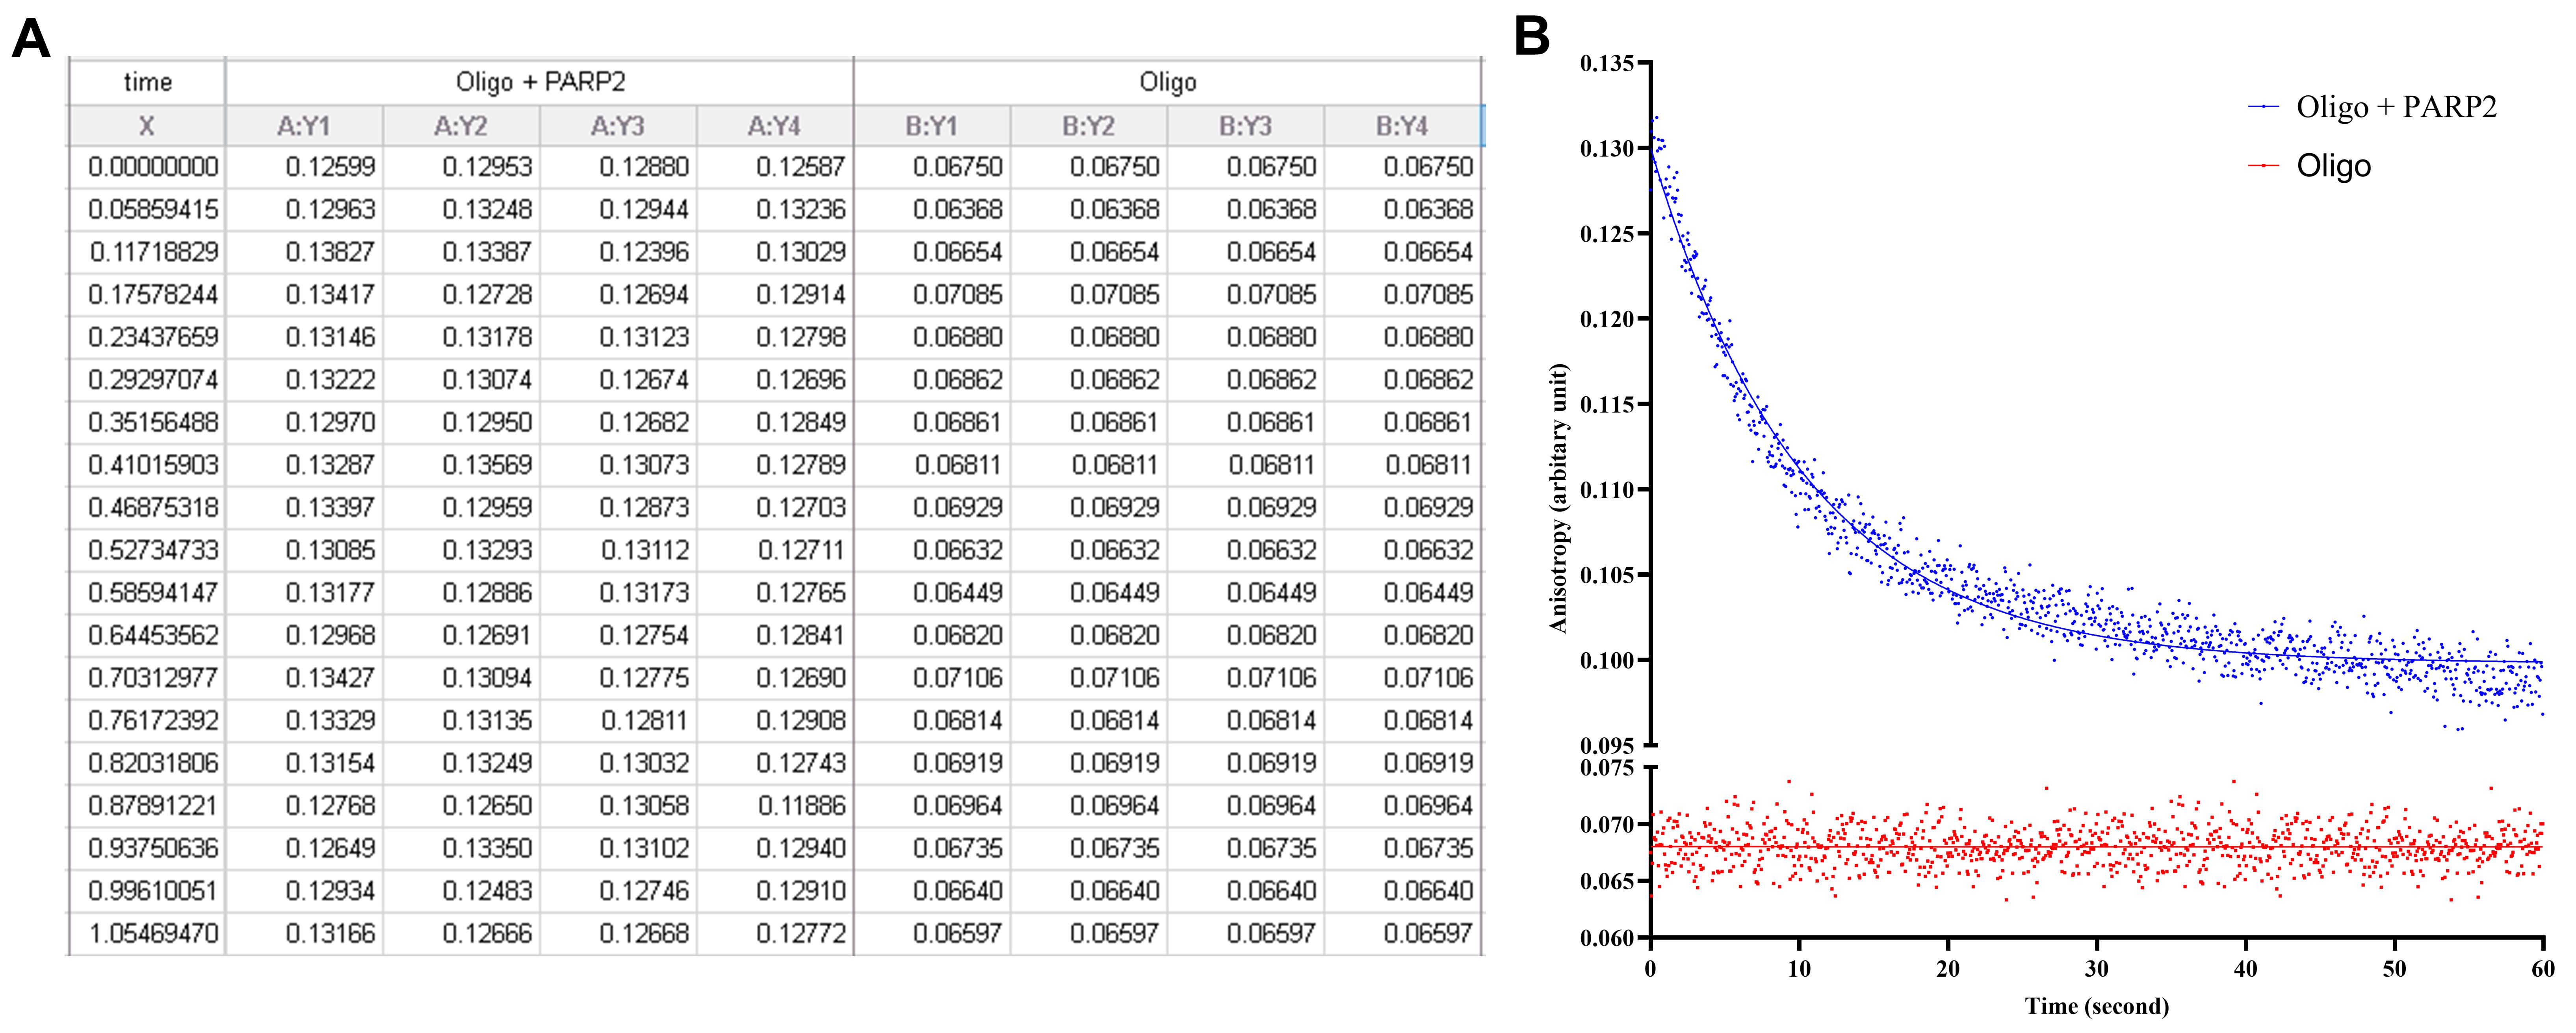
Figure 1. Fluorescence anisotropy data analysis. (A) Anisotropy data for oligo alone and oligo with PARP2 for the first 1 s after addition of 500 μM NAD+ to the reaction. (B) The initiation of the reaction by addition of NAD+ results in a decrease in fluorescence anisotropy of the oligo–PARP2 complex, corresponding to automodification-dependent PARP2 release from DNA. The decrease in FP was fitted with a first-order exponential decay, and the anisotropy of oligo alone remained unchanged.
Validation of protocol
This protocol has been used and validated in the following research article:
• Dhakar et al. [9]. Automodification of N-terminal serine residues facilitates PARP2 release from DNA. FEBS J. (Figure 5).
General notes and troubleshooting
General notes
1. It is recommended that, before starting the experiment, the main and auxiliary PM voltages are tuned using fluorescein as per instrument-specific guidelines.
2. Before running the PARP2 release experiment, always perform a test experiment with fluorescein-labeled oligo alone to make sure that the light source is stable and that the anisotropy for the fluorescein-labeled DNA is measurable.
3. After mixing DNA and proteins, incubate the samples at room temperature and make sure that the stopped-flow instrument temperature is maintained using a water bath.
4. If the instrument is a double mixing system, wash the unused syringes with water and fill them with the same reaction buffer.
5. After loading a new sample into the drive syringe, always perform at least three dummy shots before starting a data collection experiment.
6. Once the experiment is over, wash the syringes and flow cell with water. Perform dummy shots to wash the stop-syringe and repeat the washing with 5% isopropanol. Leave them filled with 5% isopropanol.
7. The method is sensitive to temperature fluctuations, as reaction rates are temperature-dependent. Therefore, changes in the observed rates may arise from minor variations in temperature rather than from the reaction under investigation. To overcome this, always collect multiple datasets to get reproducible results. In this study, the experiment was performed at 25 °C, and the temperature was regulated using a thermostatic water bath.
8. For comparison of multiple datasets, always use a previously measured sample reaction as a control to monitor effects from external factors and normalize the data accordingly.
9. For multiple datasets, run a statistical test (t-test for pairwise or ANOVA for multiple datasets) to analyze the significance of differences.
10. Store aliquots of NAD+ and fluorescein solution at -20 °C, protect from direct light for a longer shelf life (months to years), and use new aliquots for experiments to avoid freeze/thaw cycles.
11. The instrument has a dead time for reaction of less than 2 ms. As PARP2 release rate takes seconds, this is negligible and does not affect the measurement.
Troubleshooting
Problem 1: Formation of air bubbles when loading the drive syringe.
Possible cause: During sample loading into the drive syringe, air was trapped between the sample loading syringe and the drive syringe.
Solution: Put the filling valves in load mode and push back the solution from the drive syringe to the sample syringe so that the trapped bubble comes back into the sample syringe and does not enter the drive syringe. Then, fill the sample again into the drive syringe without injecting the bubble.
Problem 2: Unstable fluorescence signal during data acquisition.
Possible cause: The light source lamp was not turned ON for sufficient time, resulting in unstable light intensity or photobleaching of the fluorophore.
Solution: Turn ON the light source lamp for at least 30 min or more, so that the lamp gets sufficient time to warm up and the light intensity stabilizes. In case of photobleaching of the fluorophore, decrease the light intensity and use fresh samples to record the spectrum.
Problem 3: Signal variation between measurements.
Possible cause: Insufficient optimization of the G factor and temperature fluctuations can result in variations in signal in different experiments.
Solution: Carefully optimize the main and auxiliary channel voltages when setting up an instrument for measurement and maintain the drive syringe and flow-cell temperature by connecting the instrument to a thermostated water bath.
Acknowledgments
This work was funded by the Research Council of Finland (347026 for L.L., 354387 for A.G.P.). Biocenter Oulu Structural Biology core facility, member of Biocenter Finland, Instruct-ERIC Centre Finland and FINStruct, is gratefully acknowledged. We acknowledge the work of Rudolph et al. [12] on kinetics of DNA–protein using stopped-flow, which was referred to in the initial optimization of this protocol to measure PARP2 release from DNA.
This method was originally developed and validated in Dhakar et al. [9].
Author contributions
Conceptualization, A.G-P., L.L.; Investigation, S.S.D., T-R.K.; Writing—Original Draft, S.S.D.; Writing—Review & Editing, S.S.D., A.G-P., T-R.K., L.L.; Funding acquisition, A.G-P., L.L.; Supervision, A.G-P., L.L.
Competing interests
The authors declare no conflicts of interest.
References
- Amé, J. C., Rolli, V., Schreiber, V., Niedergang, C., Apiou, F., Decker, P., Muller, S., Höger, T., Murcia, J. d., de Murcia, G., et al. (1999). PARP-2, A Novel Mammalian DNA Damage-dependent Poly(ADP-ribose) Polymerase. J Biol Chem. 274(25): 17860–17868. https://doi.org/10.1074/jbc.274.25.17860
- Javle, M. and Curtin, N. J. (2011). The role of PARP in DNA repair and its therapeutic exploitation. Br J Cancer. 105(8): 1114–1122. https://doi.org/10.1038/bjc.2011.382
- Lüscher, B., Ahel, I., Altmeyer, M., Ashworth, A., Bai, P., Chang, P., Cohen, M., Corda, D., Dantzer, F., Daugherty, M. D., et al. (2021). ADP‐ribosyltransferases, an update on function and nomenclature. FEBS J. 289(23): 7399–7410. https://doi.org/10.1111/febs.16142
- Schreiber, V., Dantzer, F., Ame, J. C. and de Murcia, G. (2006). Poly(ADP-ribose): novel functions for an old molecule. Nat Rev Mol Cell Biol. 7(7): 517–528. https://doi.org/10.1038/nrm1963
- Palazzo, L., Leidecker, O., Prokhorova, E., Dauben, H., Matic, I. and Ahel, I. (2018). Serine is the major residue for ADP-ribosylation upon DNA damage. eLife. 7: e34334. https://doi.org/10.7554/elife.34334
- Suskiewicz, M. J., Zobel, F., Ogden, T. E. H., Fontana, P., Ariza, A., Yang, J. C., Zhu, K., Bracken, L., Hawthorne, W. J., Ahel, D., et al. (2020). HPF1 completes the PARP active site for DNA damage-induced ADP-ribosylation. Nature. 579(7800): 598–602. https://doi.org/10.1038/s41586-020-2013-6
- Ferro, A. M. and Olivera, B. M. (1982). Poly(ADP-ribosylation) in vitro. Reaction parameters and enzyme mechanism. J Biol Chem. 257(13): 7808–7813. https://doi.org/10.1016/s0021-9258(18)34453-3
- Zhong, Q., Xiao, X., Qiu, Y., Xu, Z., Chen, C., Chong, B., Zhao, X., Hai, S., Li, S., An, Z., et al. (2023). Protein posttranslational modifications in health and diseases: Functions, regulatory mechanisms, and therapeutic implications. MedComm. 4(3): e261. https://doi.org/10.1002/mco2.261
- Dhakar, S. S., Galera‐Prat, A., Cai, J., Preisser, J., Kiema, T., Ladurner, A. and Lehtiö, L. (2026). Automodification of N‐terminal serine residues facilitates PARP2 release from DNA. FEBS J. 293(11): 3274–3287. https://doi.org/10.1111/febs.70409
- Obaji, E., Haikarainen, T. and Lehtiö, L. (2016). Characterization of the DNA dependent activation of human ARTD2/PARP2. Sci Rep. 6(1): 34487. https://doi.org/10.1038/srep34487
- Dhakar, S. S., Galera-Prat, A. and Lehtiö, L. (2024). High-throughput screening assay for PARP-HPF1 interaction inhibitors to affect DNA damage repair. Sci Rep. 14(1): 3875. https://doi.org/10.1038/s41598-024-54123-8
- Rudolph, J. and Luger, K. (2019). Kinetics of DNA–protein association and dissociation by stopped-flow spectroscopy. Meth Enzymol. 625: 135–156. https://doi.org/10.1016/bs.mie.2019.04.025
Article Information
Publication history
Received: Aug 14, 2026
Accepted: Oct 19, 2026
Available online: Nov 11, 2026
Published: Dec 5, 2026
Copyright
© 2026 The Author(s); This is an open access article under the CC BY license (https://creativecommons.org/licenses/by/4.0/).
How to cite
Dhakar, S. S., Galera-Prat, A., Kiema, T. R. and Lehtiö, L. (2026). Measuring the ADP-Ribosylation-Dependent Release of PARP2 From DNA Using Stopped-Flow Fluorescence Polarization. Bio-protocol 16(23): e5874. DOI: 10.21769/BioProtoc.5874.

 Download Citation in RIS Format
Do you have any questions about this protocol?
Post your question to gather feedback from the community. We will also invite the authors of this article to respond.
 Post a Question


