


- Protocols

- Articles and Issues
- For Authors
- About
- Become a Reviewer


TurboID-Mediated Proteomic Study in the Primary Cilia of Embryonic Mouse Brain

Published: Vol 16, Iss 22, Nov 20, 2026 DOI: 10.21769/BioProtoc.5868 Views: 44
Reviewed by: Sam PatelAnonymous reviewer(s)
 PDF
 Ask a question

Original research article
The authors used this protocol in:
May 2026

Protocol Collections
Comprehensive collections of detailed, peer-reviewed protocols focusing on specific topics



Abstract
Primary cilia of radial glia are important signaling compartments during embryonic brain development, but their molecular composition in vivo remains difficult to characterize. Conventional ciliary isolation can introduce substantial non-ciliary contamination, whereas APEX-based proximity labeling requires hydrogen peroxide (H2O2) to initiate labeling, and BioID generally requires prolonged labeling times. Here, we describe a step-by-step protocol for in vivo proximity-labeling proteomics of radial glial primary cilia in the embryonic mouse telencephalon using a Cilium-TurboID transgenic mouse model. TurboID is targeted to radial glial cilia through a ΔARL13B-GFP fusion under the BLBP promoter, enabling rapid biotin labeling in freshly dissected embryonic brain tissue. Following labeling, the tissue is subjected to subcellular fractionation, neutravidin-based enrichment of biotinylated proteins, on-bead trypsin digestion, TMT labeling, and quantitative mass spectrometry. This workflow enables spatially targeted profiling of the low-abundance ciliary proteome directly in native embryonic brain tissue, while avoiding the need to physically isolate primary cilia and eliminating the requirement for H2O2 during proximity labeling. The rapid labeling kinetics of TurboID also provide improved temporal resolution compared with conventional BioID, making the workflow well-suited for investigating ciliary protein composition in developing neural tissues.
Key features
• Enables in vivo proteomic profiling of radial glial primary cilia in the embryonic mouse telencephalon.
• Uses a BLBP-driven Cilium-TurboID transgenic mouse for cell type- and cilium-targeted proximity labeling.
• Combines subcellular fractionation with neutravidin enrichment to improve recovery of ciliary proteins from brain tissue.
• Supports region-specific comparison of ciliary proteomes between dorsal and ventral telencephalon.
Keywords: Proximity labeling TurboID
Primary cilium
Radial glia
Embryonic mouse brain
In vivo proteomics
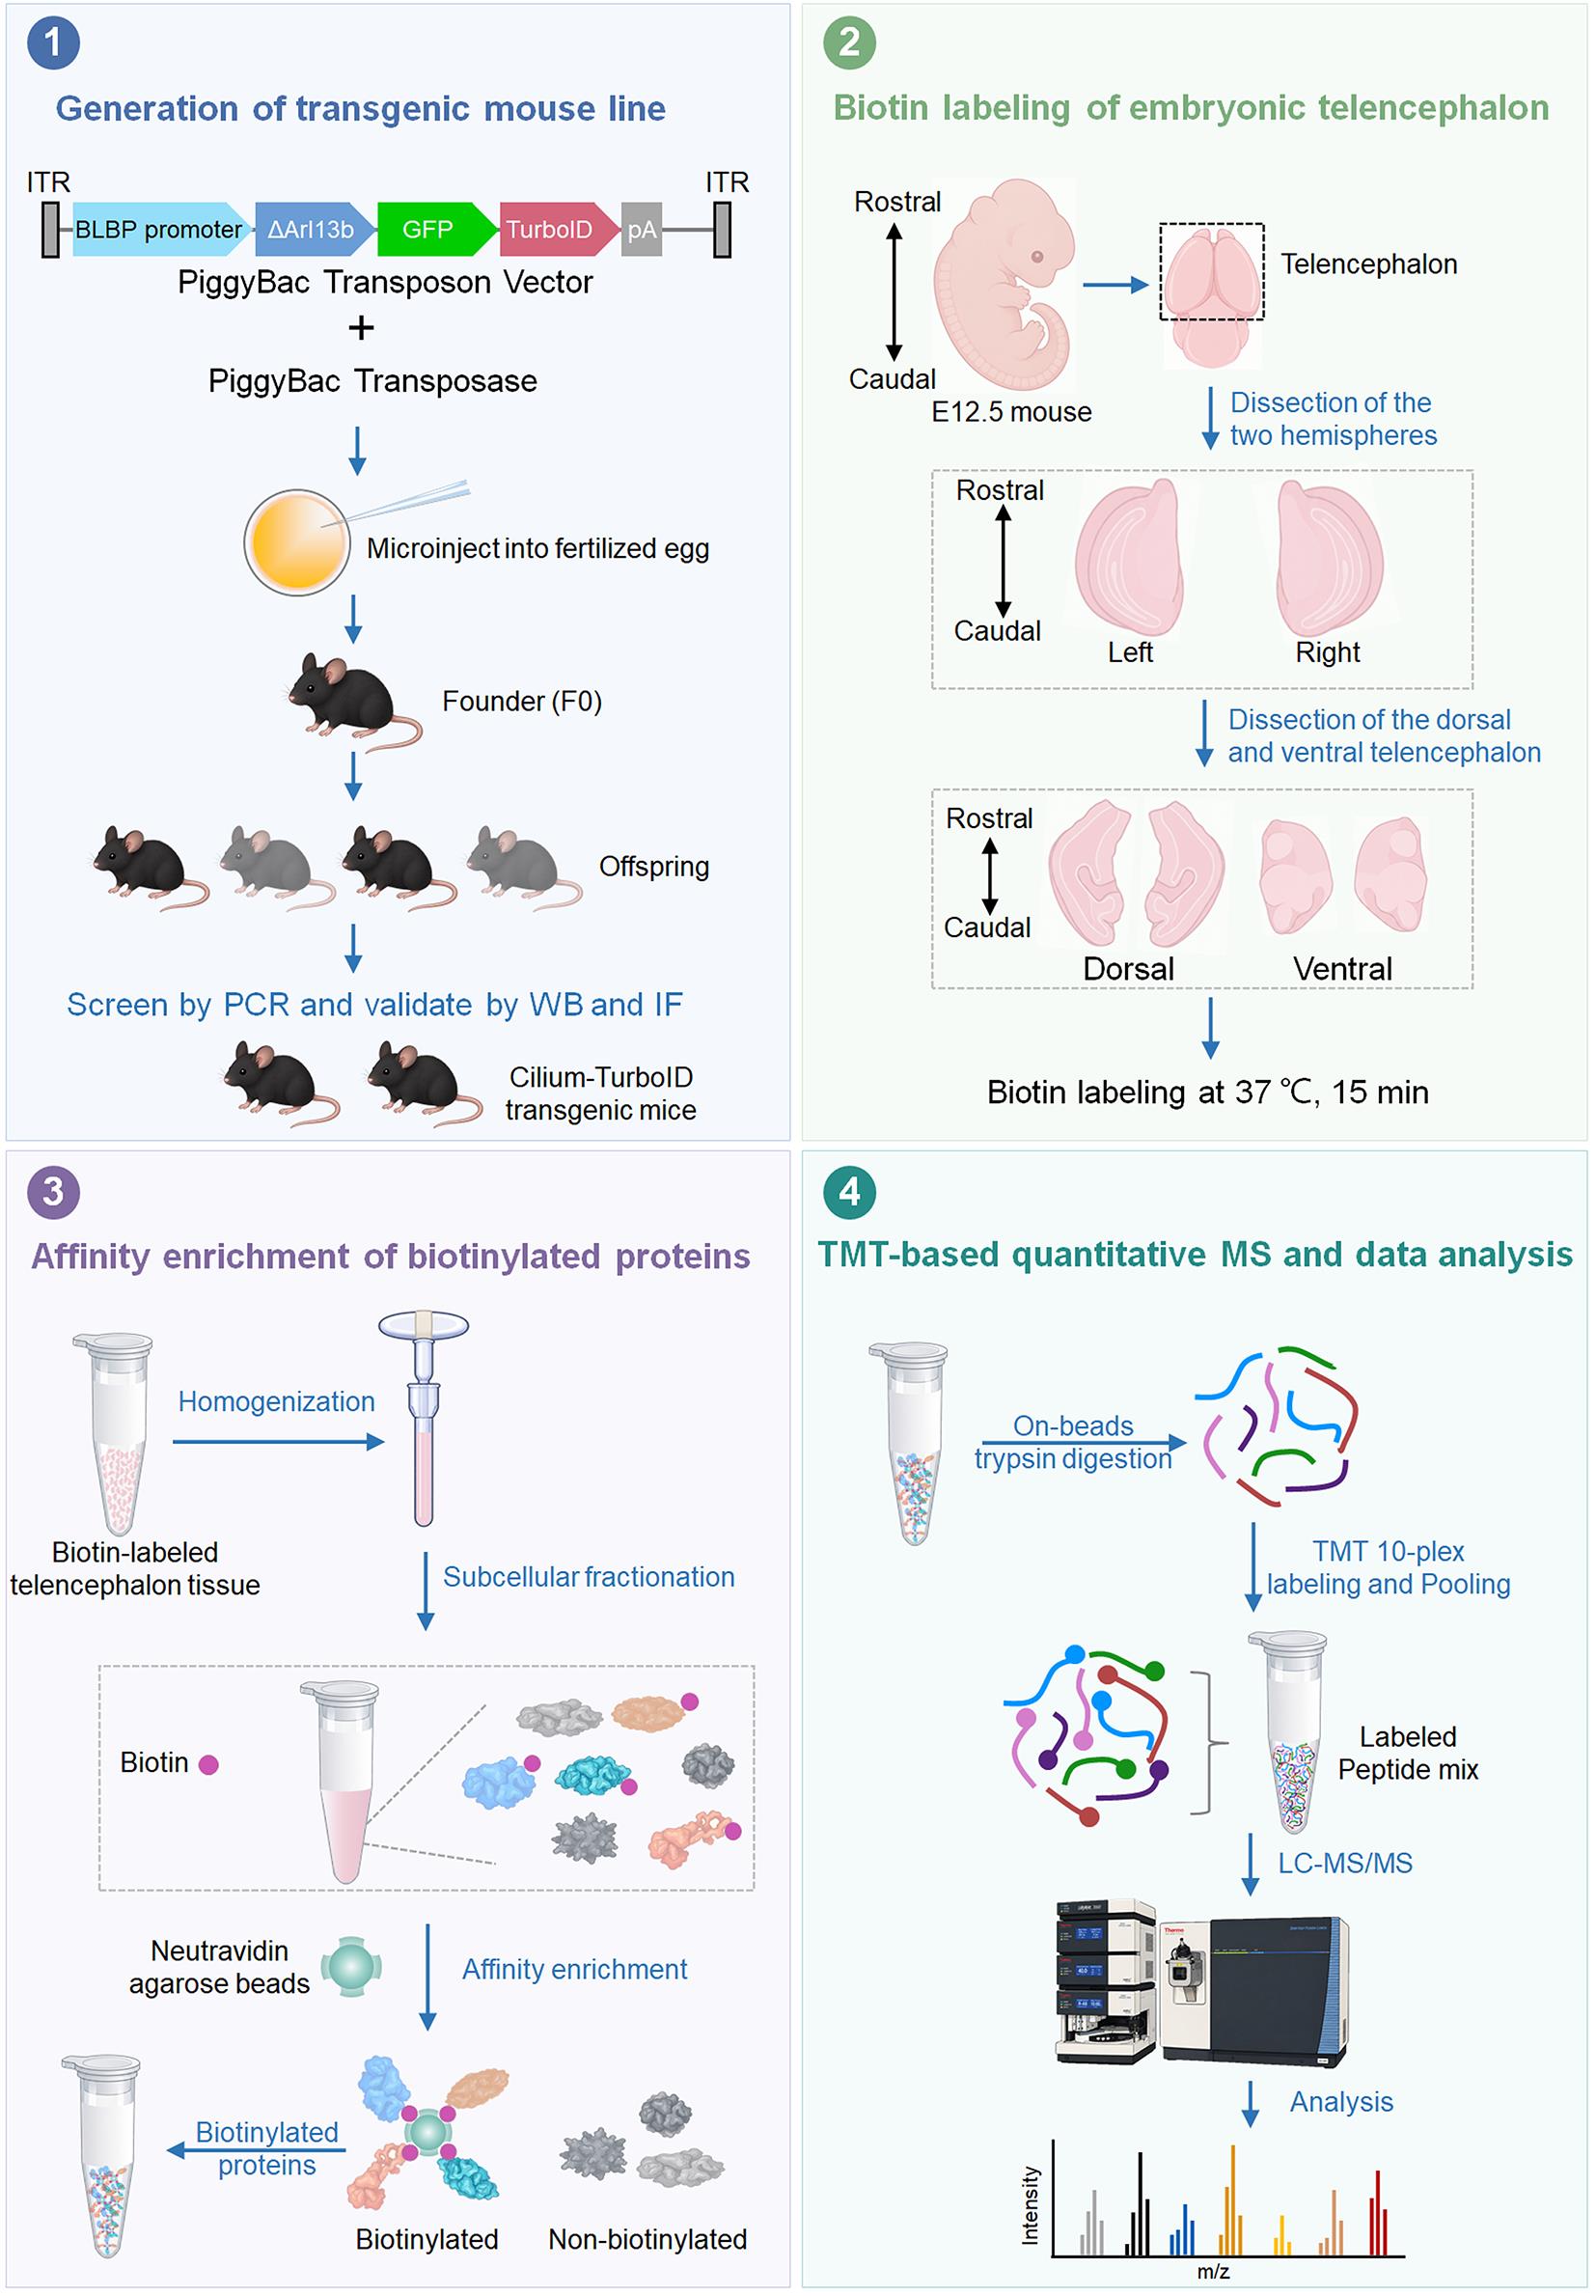
Graphical overview
Background
Primary cilia are specialized, microtubule-based cellular compartments that organize receptors and signaling proteins involved in developmental pathways such as Hedgehog (Hh) [1,2]. Their importance is particularly evident in the developing nervous system, where defects in ciliary assembly or signaling can disrupt neural progenitor behavior and cause brain abnormalities associated with ciliopathies [3–5]. In the embryonic telencephalon, radial glia (RG) are the major neural progenitors and maintain their primary cilia at the ventricular surface, where the cilia are positioned at the interface between progenitor cells and the cerebrospinal fluid (CSF) [6–8]. Identifying the proteins that reside in or transiently associate with these cilia is therefore important for understanding how ciliary signaling contributes to neural development and neurodevelopmental disease.
The molecular characterization of primary cilia in vivo remains technically challenging because the cilium is extremely small and comprises approximately 1/30,000 of the total cellular space [9,10]. Conventional ciliary proteomics has relied on physical isolation or biochemical enrichment of cilia. Although these approaches have successfully identified many ciliary proteins, isolation of primary cilia from complex mammalian tissues can result in substantial contamination from non-ciliary compartments and may preferentially recover abundant proteins [11]. Moreover, disrupting cells and isolating cilia before analysis can compromise weak or transient associations that occur within the native ciliary environments.
Proximity labeling provides an alternative approach in which proteins near a genetically targeted enzyme are covalently labeled before tissue disruption. APEX-based approaches provide rapid labeling but require hydrogen peroxide, whereas conventional BioID uses biotin without oxidative treatment but generally requires prolonged labeling [12]. TurboID, an engineered promiscuous biotin ligase, substantially accelerates biotinylation and enables proximity labeling on a timescale of minutes, making it well-suited to spatial proteomics in living cells and organisms [12–14]. Cilia-targeted proximity labeling has previously been used to characterize ciliary proteomes and to examine changes associated with Hh signaling in cultured cells [13,15,16]. However, applying proximity labeling to primary cilia in the developing brain presents additional challenges, including cell type- and cilium-specific targeting, the low abundance of ciliary proteins, and high background from abundant non-ciliary proteins in the surrounding tissue.
The present protocol addresses these challenges by combining cell type–specific genetic targeting of TurboID with tissue-level biochemical enrichment and quantitative mass spectrometry. In our approach, TurboID is targeted to the primary cilia of RG using a ΔARL13B-GFP-TurboID fusion under control of the BLBP promoter. The resulting transgenic mouse enables cilia-associated proteins to be labeled directly in the developing telencephalon. Rapid biotin labeling is followed by subcellular fractionation to reduce abundant non-target material, neutravidin-based enrichment of biotinylated proteins, and TMT (tandem mass tag)-based quantitative mass spectrometry. In the corresponding Cell Reports study, this workflow enabled profiling of RG ciliary proteins in the E12.5 dorsal and ventral telencephalon and identified 258 candidate ciliary proteins, including previously recognized ciliary proteins and components displaying regional differences between the two telencephalic domains [17].
The major advantage of this approach over physical cilium isolation is that proteins are labeled in the native tissue before biochemical processing, which preserves spatial information without requiring intact primary cilia to be isolated as a separate fraction. Compared with other proximity labeling methods, e.g., APEX and conventional BioID, this protocol using TurboID enables rapid, H2O2-free proximity labeling with shorter labeling times and improved temporal resolution [18,19]. Importantly, this in vivo proximity labeling captures the ciliary proteome within the physiological environment of the developing brain, where interactions among different cell types and developmental cues can influence ciliary protein composition and signaling. This provides an important advantage over cell culture–based proximity-labeling approaches, which may not fully recapitulate the multicellular and tissue-specific environment of the developing telencephalon. In addition, the use of neutravidin for affinity enrichment provides an effective strategy for recovering biotinylated proteins from tissue lysates while reducing nonspecific protein binding relative to streptavidin under the conditions used in this workflow. The combination of cell type–specific genetic targeting, optimized tissue fractionation, and neutravidin-based affinity enrichment therefore makes this workflow particularly suitable for profiling the low-abundance ciliary proteome of neural progenitor populations. However, low-level basal biotinylation was detectable in Cilium-TurboID tissue in the absence of exogenous biotin; this background was mitigated by optimizing the biochemical enrichment workflow and using neutravidin-based affinity capture [17]. In addition, because the protocol relies on a genetically engineered mouse model, establishing the transgenic line requires more time and resources than cell-based proximity-labeling approaches.
This workflow can be applied beyond the RG primary cilia examined here. By replacing the cell type–specific regulatory element or adapting the ciliary targeting strategy, it may be used to study ciliary proteomes in other neural populations and developmental stages, including specialized cilia in the ventricular system and choroid plexus. More broadly, the combination of genetically encoded proximity labeling, tissue fractionation, and quantitative proteomics provides a framework for investigating other spatially restricted protein environments in complex developing tissues.
Materials and reagents
Biological materials
1. Bacterial strains: TOP10 (Thermo Fisher Scientific, catalog number: C404010)
2. Cilium-TurboID transgenic C57BL/6 mouse (not commercially available [17])
Reagents
1. BLBP-GFP plasmid (Addgene, catalog number: 63174); Cilium-TurboID plasmid (not commercially available [17])
2. Ampicillin, sodium salt (Research Products International, catalog number: A40040-5.0)
3. Maxi Fast-Ion Plasmid kit (IBI Scientific, catalog number: Ib47122)
4. Proteinase K solution (20 mg/mL) (Fisher Scientific, catalog number: 25530049)
5. Triton X-100 (Sigma, catalog number: T8787-50 mL)
6. 2× Taq Master Mix (Dye Plus) (Vazyme, catalog number: P112-01)
7. DPBS (Fisher Scientific, catalog number: 14-190-136)
8. Biotin, molecular biology grade (Sigma, catalog number: B4501-1G)
9. DMSO, molecular biology grade (Sigma, catalog number: D8418-50ML)
10. Neurobasal medium (Thermo Fisher Scientific, catalog number: 21103-049)
11. 20% PFA (Fisher Scientific, catalog number: 50-980-493)
12. O.C.T. compound (Fisher Scientific, catalog number: 23-730-571)
13. Donkey serum (Sigma, catalog number: S30-100ML)
14. Chicken anti-GFP (Aves Labs, catalog number: GFP-1020)
15. Rabbit anti-ARL13B (Proteintech, catalog number: 17711–1-AP)
16. Donkey anti-chicken Alexa Fluor 488 (Jackson ImmunoResearch Labs, catalog number: 703-545-155)
17. Donkey anti-rabbit Rhodamine (Jackson ImmunoResearch Labs, catalog number: 711-025-152)
18. Donkey anti-rabbit Alexa Fluor 488 (Jackson ImmunoResearch Labs, catalog number: 711-545-152)
19. Alexa Fluor 647 Streptavidin (Jackson ImmunoResearch Labs, catalog number: 016-600-084)
20. Fluoromount-G mounting medium (SouthernBiotech, catalog number: 0100-01)
21. Hoechst 33258 (Sigma, catalog number: 94403-1ML)
22. 1 M sodium hydroxide (NaOH), molecular biology grade (Sigma, catalog number: 1091371003)
23. 36.5%–38.0% hydrochloric acid (HCl) (Fisher Scientific, catalog number: A144-500)
24. HEPES, molecular biology grade (Fisher Scientific, catalog number: BP310-500)
25. KCI, molecular biology grade (Fisher Scientific, catalog number: P217-500)
26. MgCl2, molecular biology grade (Fisher Scientific, catalog number: AC223211000)
27. 0.5 M EDTA (Fisher Scientific, catalog number: AAJ15694AE)
28. 0.5 M EGTA (Fisher Scientific, catalog number: 50-255-956)
29. Tris base, molecular biology grade (Fisher Scientific, catalog number: BP152-500)
30. NaCl, molecular biology grade (Fisher Scientific, catalog number: S271-500)
31. SDS, molecular biology grade (Fisher Scientific, catalog number: BP166-100)
32. Protease inhibitor cocktail (Roche, catalog number: 11836170001)
33. 10% NP-40 (Thermo Fisher Scientific, catalog number: 28324)
34. BCA Protein Assay kit (Thermo Fisher Scientific, catalog number: 23225)
35. Neutravidin agarose resin (Thermo Fisher Scientific, catalog number: 29201)
36. 2× Laemmli sample buffer (Bio-Rad Laboratories, catalog number: 1610737)
37. Mouse anti-GAPDH (Santa Cruz Biotechnology, catalog number: sc-32233)
38. HRP-conjugated donkey anti-rabbit IgG (Jackson ImmunoResearch Labs, catalog number: 711-035-152)
39. HRP-conjugated donkey anti-mouse IgG (Jackson ImmunoResearch Labs, catalog number: 715-035-151)
40. HRP-conjugated neutravidin (Thermo Fisher Scientific, catalog number: 31030)
41. SuperSignal West Pico PLUS Chemiluminescent Substrate (Thermo Fisher Scientific, catalog number: 34577)
42. 1 M Triethylammonium bicarbonate (TEAB) (Thermo Fisher Scientific, catalog number: 90114)
43. 10plex TMT label reagent set (Thermo Fisher Scientific, catalog number: 90110)
44. Pierce TCEP HCl (Thermo Fisher Scientific, catalog number: 20490)
45. 2-Chloroacetamide ≥98% (Sigma-Aldrich, catalog number: 22790)
46. Trypsin (Promega, catalog number: V5111)
47. Calcium chloride, molecular biology grade (Sigma-Aldrich, catalog number: C5670)
48. Resin, Acquity UPLC® BEH 1.7 μm C18 (Waters, catalog number: 186004690)
49. Water, HPLC grade (Optima LC-MS grade) (Thermo Fisher Scientific, catalog number: W6-4)
50. Acetonitrile, HPLC grade (Honeywell, catalog number: AH015-4)
51. Methanol, HPLC grade (J.T. Baker, catalog number: 9093-33)
52. Chloroform, HPLC grade (Thermo Fisher Scientific, catalog number: C298-4)
53. Trifluoroacetic acid (TFA), HPLC grade (Sigma-Aldrich, catalog number: T6508-10AMP)
54. Polymicro fused silica capillary tubing 100 μm (Molex, catalog number: 1068150023)
55. 11 PP vial crimp/snap 250 μL (Thermo Fisher Scientific, catalog number: C4011-13)
56. Snap-it seal (Thermo Fisher Scientific, catalog number: C4011-53)
57. Pierce HeLa protein digest standard (Thermo Fisher Scientific, catalog number: 88329)
58. Urea (Sigma-Aldrich, catalog number: U5128-110G)
59. Pierce High pH RP Peptide Fractionation kit (Thermo Fisher Scientific, catalog number: 84868)
60. Ethanol absolute (VWR, catalog number: 89125-186)
61. 0.4% Trypan Blue solution (Thermo Fisher Scientific, catalog number: 15250061)
62. Sucrose (Thermo Fisher Scientific, catalog number: ICN821713)
Solutions
1. Mouse tail digestion buffer (see Recipes)
2. 50 mM biotin stock solution (see Recipes)
3. Biotin labeling medium (see Recipes)
4. Blocking buffer (see Recipes)
5. 25× protease inhibitor cocktail buffer (see Recipes)
6. Subcellular fractionation buffer (see Recipes)
7. 10× TBS buffer (see Recipes)
Recipes
1. Mouse tail digestion buffer
| Reagent | Final concentration | Quantity or volume |
|---|---|---|
| KCl | 50 mM | 0.373 g |
| Tris | 10 mM | 0.121 g |
| Triton X-100 | 0.1% | 100 μL |
| Proteinase K | 0.4 mg/mL | 2 mL |
| H2O (MilliQ water) | n/a | * |
| Total | n/a | 100 mL |
*Mix until the reagents are fully dissolved and adjust the pH of the solution to 9.0 by adding HCl (36.5%–38.0%) while measuring with a pH meter. Then, bring the volume up to 100 mL with MilliQ water.
Store at 4 °C.
2. 50 mM biotin stock solution
| Reagent | Final concentration | Quantity or volume |
|---|---|---|
| Biotin | 50 mM | 0.5 g |
| DMSO | n/a | 41 mL |
| Total | n/a | 41 mL |
Store at -20 °C.
3. Biotin labeling medium
| Reagent | Final concentration | Volume |
|---|---|---|
| 50 mM biotin stock (Recipe 2) | 50 μM | 50 μL |
| Neurobasal medium | n/a | 49.95 mL |
| Total | n/a | 50 mL |
Aliquot and store at 4 °C for one month.
4. Blocking buffer
| Reagent | Final concentration | Volume |
|---|---|---|
| Donkey serum | 2% | 2 mL |
| Triton X-100 | 0.2% | 200 μL |
| DPBS | n/a | 97.8 mL |
| Total | n/a | 100 mL |
Store at 4 °C.
5. 25× protease inhibitor cocktail buffer
| Reagent | Final concentration | Quantity or volume |
|---|---|---|
| Protease inhibitor cocktail | 25× | 1 tablet |
| H2O (MilliQ water) | n/a | 2 mL |
| Total | n/a | 2 mL |
*Add the 25× protease inhibitor cocktail buffer to the subcellular fractionation buffer immediately before use to achieve a final concentration of 1×.
Store at -20 °C.
6. Subcellular fractionation buffer
| Reagent | Final concentration | Quantity or volume |
|---|---|---|
| HEPES | 20 mM | 4.77 g |
| KCI | 10 mM | 0.75 g |
| MgCl2 | 2 mM | 0.19 g |
| 0.5 M EDTA | 1 mM | 2 mL |
| 0.5 M EGTA | 1 mM | 2 mL |
| H2O (MilliQ water) | n/a | * |
| Total | n/a | 1 L |
*Mix until the reagents are fully dissolved and adjust the pH of the solution to 7.4 by adding 1 M NaOH while measuring with a pH meter. Then, bring the volume up to 1 L with MilliQ water. Just before use, add and dilute the 25× protease inhibitor cocktail buffer to the subcellular fractionation buffer to achieve a final concentration of 1×.
Store at 4 °C.
7. 10× TBS buffer
| Reagent | Final concentration | Quantity or volume |
|---|---|---|
| Tris | 200 mM | 24.23 g |
| NaCl | 1.5 M | 87.66 g |
| 0.5 M EDTA | 10 mM | 20 mL |
| H2O (MilliQ water) | n/a | * |
| Total | n/a | 1 L |
*Mix until the reagents are fully dissolved and adjust the pH of the solution to 7.4 by adding HCl (36.5% to 38.0%) while measuring with a pH meter. Then, bring the volume up to 1 L with MilliQ water.
Store at 4 °C.
Laboratory supplies
1. 10 cm dish (Fisher Scientific, catalog number: FB012924)
2. Moria ultra-fine forceps (Fine Science Tools, catalog number: 11370-40)
3. Moria ultra-fine curved forceps (Fine Science Tools, catalog number: 11370-42)
4. Extra-fine Bonn 8.5 cm scissors (Fine Science Tools, catalog number: 14085-08)
5. 15 mL conical tube (Corning, catalog number: 430791)
6. Polystyrene round-bottom tube (Falcon, catalog number: 352058)
7. Superfrost Plus microscope slides (Fisher Scientific, catalog number: 12-550-15)
8. Superslip coverslips (Fisher Scientific, catalog number: 12-541-056)
9. Tweezers (Fine Science Tools, catalog number: 11252-00)
10. Parafilm (Fisher Scientific, catalog number: PM999)
11. KIMBLE Dounce tissue grinder set (DWK Life Sciences, catalog number: D8938)
12. 1.5 mL protein LoBind tube (Eppendorf, catalog number: 22431081)
13. 5 mL protein LoBind tube (Eppendorf, catalog number: 30108302)
14. 1 mL syringe (BD Biosciences, catalog number: 309628)
15. 27-gauge needle (BD Biosciences, catalog number: 305136)
16. Plastic cryomolds (TedPella, catalog number: 27110)
17. StainTray with black lid (Simport, catalog number: M920-2)
18. PAP pen liquid blocker (Newcomer Supply, catalog number: NC9204359)
19. 0.2 mL PCR tube strips (Fisher Scientific, catalog number: 14230210)
20. Kimwipes (Fisher Scientific, catalog number: 06-666)
Equipment
1. Vortex mixer (Fisher Scientific, catalog number: 02-215-414)
2. Centrifuge (Eppendorf, model: 5702R)
3. Centrifuge (Eppendorf, model: 5804R)
4. VWR Digital Advanced 2 Block Heater (VWR, catalog number: 75838-282)
5. Leica stereomicroscope (Leica, model: S6E)
6. Confocal microscope (Zeiss, model: LSM 880)
7. Sonicator equipped with a microtip, measuring 3/32 inches in diameter (Branson, model: SLPt)
8. Leica cryostat (Leica, model: CM1860)
9. Orbitrap Fusion Lumos mass spectrometer (Thermo Fisher Scientific, catalog number: IQLAAEGAAPFADBMBHQ)
10. EASY-nLC 1200 (Thermo Fisher Scientific, catalog number: LC140)
11. Laser-based micropipette puller system (Sutter Instrument, catalog number: P-2000)
12. Thermomixer F1.5 (Eppendorf, catalog number: 5384000020)
13. Microfuge18 centrifuge (Beckman Coulter, catalog number: 367160)
14. Vacuum Centrifuge (Labconco, catalog number: 7810016)
15. Thermal Cycler (Bio-Rad, model: T100)
16. Real-Time PCR System (Applied Biosystems, model: QuantStudio 3)
17. Mini Gel Electrophoresis System (Thermo Fisher Scientific, model: Owl EasyCast B2)
18. Imaging Systems for blots and gels (Bio-Rad, model: ChemiDoc MP)
19. Trans-Blot Turbo Transfer Starter System (Bio-Rad, catalog number: 17001917)
Software and datasets
1. ProLuCID (Bruker Scientific LLC, IP2)
2. DTASelect2.0 (Bruker Scientific LLC, IP2)
3. Census2.0 (Bruker Scientific LLC, IP2)
4. RAWConverter (John R. Yates III Lab, Scripps Research, La Jolla)
5. XCalibur (Thermo Fisher Scientific, catalog number: OPTON-30965-7)
Procedure
A. Generation of the Cilium-TurboID transgenic mouse line via the PiggyBac transposon method
The PiggyBac transposon system is used to establish stable expression of the cilium-targeted TurboID (Cilium-TurboID) reporter in radial glia.
Note: For the generation of the Cilium-TurboID plasmid and its verification, please refer to our previously published protocol [12].
1. Engineer the PiggyBac donor construct with the expression cassette positioned between the 5′ and 3′ inverted terminal repeat sequences (ITRs), which are recognized by the PiggyBac transposase. The reporter cassette consists of the following components (Figure 1):
a. A radial glia-specific promoter (BLBP promoter) from the BLBP-GFP plasmid.
b. A ciliary targeting sequence derived from truncated ARL13B (ΔARL13B).
c. A fluorescent reporter GFP for visualization of transgene expression.
d. The TurboID biotin ligase.
Note: The construct was designed to direct TurboID specifically to the ciliary membrane of radial glial cells while minimizing perturbation of endogenous ciliary function.

Figure 1. Schematic illustrating the transgenic construct used to generate the Cilium-TurboID mouse model. The transgene encodes a single fusion protein, ΔARL13B-GFP-TurboID, in which ΔARL13B is a truncated form of ARL13B containing the N+RVEP+PR ciliary-targeting domains [13].
2. Co-inject the PiggyBac donor plasmid containing the expression cassette along with the PiggyBac transposase into zygotes.
Note: PiggyBac-mediated genomic integration was achieved by Cyagen Biosciences. During early embryonic development, the PiggyBac transposase recognizes the ITR sequences flanking the donor cassette and catalyzes the excision of the transgene from the donor plasmid followed by integration into genomic TTAA target sites.
3. Screen potential founder mice via genomic PCR using DNA extracted from tail biopsies.
Note: All mouse procedures were approved by the Institutional Animal Care and Use Committee (IACUC) of the University of California, Merced (protocol no. 2023-1151). Mice were maintained in a specific pathogen-free facility, monitored daily, and housed under a 12 h light/dark cycle at 20–22 °C with 40%–60% humidity.
a. Collect a 2–5 mm tail biopsy from each mouse and place it into a microcentrifuge tube.
b. Add 100 μL of tail digestion buffer per tail piece in a microcentrifuge tube.
c. Incubate the samples at 56 °C overnight to digest the tissue.
d. Heat the samples at 98 °C for 13 min to denature the Proteinase K.
e. Centrifuge the tubes at maximum speed for 15 min.
f. Use the clarified supernatant directly as the PCR template.
g. Prepare the 25 μL PCR reaction using 10 μM forward and reverse primers (Table 1).
Table 1. Components of the reaction mix
| Component | Volume (μL) |
|---|---|
| ddH2O | 9 μL |
| Forward primer (10 μM) | 1 μL |
| Reverse primer (10 μM) | 1 μL |
| 2× Taq Master Mix | 12.5 μL |
| Genomic DNA | 1.5 μL |
| Total | 25 μL |
h. Perform PCR amplification under the cycling conditions given in Table 2.
Table 2. PCR reaction conditions
| Step | Temperature | Time | Cycles |
|---|---|---|---|
| Initial denaturation | 94 °C | 3 min | 1× |
| Denaturation | 94 °C | 30 s | |
| Annealing | 60 °C | 35 s | 35× |
| Extension | 72 °C | 35 s | |
| Additional extension | 72 °C | 10 min | 1× |
| Hold | 4 °C | ∞ |
Note: Three controls used in PCR genotyping are water control (no DNA template added), positive control (400 ng of mouse genomic DNA spiked with an amount of transgene injection DNA that is equivalent to 5 copies of transgene per diploid mouse genome), and wild-type control (400 ng of mouse genomic DNA).
4. Establish a stable Cilium-TurboID transgenic mouse line.
a. Breed the selected positive founder (F0) transgenic mice with wild-type (WT) mice across multiple generations.
b. Intercross these high-expressing hemizygous/heterozygous mice to eventually establish a stable, homozygous mouse line.
Notes:
1. The PiggyBac system can result in multiple transgene integration events at random loci across the genome. Breeding across multiple generations (backcrossing to WT) is essential to segregate these independent integration sites.
2. Genomic qPCR was performed to detect the integrated transgene and assess its relative copy number (Table 3). Positive animals were selected for breeding based on robust and stable transgene integration. Homozygosity was subsequently determined based on the transgene segregation pattern in offspring, rather than solely on genomic qPCR signal.
Table 3. qPCR primers used to identify offspring in each generation
| Primers | Sequence (5′ to 3′) |
|---|---|
| Transgene-forward | GAATCGGCGAGCTGAAGAGT |
| Transgene-reverse | CATTGGGCCATTTGACTCGC |
| GAPDH-forward | AGCCATCAGCTATGCACGTA |
| GAPDH-reverse | GCCTCGGCTGCTCAAAGAAT |
B. Validation of Cilium-TurboID mouse line by immunofluorescence (IF)
B1. Embryonic brain tissue embedding and cryosectioning
1. Tissue fixation
a. Harvest E12.5 embryos and, under a dissecting stereomicroscope, gently dissect out the brains to avoid mechanical damage to the cortical surface.
b. Transfer the dissected brains into a tube containing fresh 4% PFA in DPBS and fix overnight at 4 °C.
2. Cryoprotection
a. Following fixation, wash the brains briefly in 1× DPBS (3 times, 5 min each) at 4 °C to remove excess PFA that might interfere with optimal freezing.
b. Transfer the brains into a cryoprotectant solution of 30% sucrose in DPBS.
c. Incubate the tissues at 4 °C until the brains completely sink to the bottom of the tube, indicating full tissue equilibration. Note: This step typically takes overnight for E12.5 embryonic brains but may require up to 24 h.
3. O.C.T. embedding
a. Remove the brains from the 30% sucrose solution and briefly blot the excess sucrose using a lint-free wipe (e.g., Kimwipe).
Note: Removing excess sucrose is critical to prevent the O.C.T. compound from separating from the tissue during sectioning.
b. Fill a plastic cryomold halfway with O.C.T. compound, being careful to avoid introducing air bubbles.
c. Transfer the brain into the cryomold and embed it fully in the O.C.T. compound.
d. Carefully orient the brain with the olfactory bulb facing downward.
Note: This orientation is standard for obtaining coronal sections, cutting from the rostral (anterior) to the caudal (posterior) end of the brain.
e. Top off the mold with additional O.C.T. to fully encase the tissue, ensuring no bubbles are trapped near the brain surface.
4. Tissue freezing
a. Prepare a freezing bath in an ice bucket by carefully adding small pieces of dry ice to 100 mL of 100% ethanol. Wait until the rapid bubbling subsides and the slurry reaches a steady, extremely cold temperature.
b. Using long forceps, carefully lower the cryomold into the dry ice–ethanol bath, allowing it to float on the surface of the slurry.
Note: Do not submerge the mold entirely; avoid any splashing of ethanol into the O.C.T., as alcohol will severely compromise the freezing matrix and subsequent sectioning quality.
c. Monitor the orientation of the brain as the O.C.T. transitions from clear to opaque white.
Note: You can use a fine needle to make micro-adjustments to the brain's position just before the O.C.T. completely freezes.
d. Once the block is entirely frozen solid, immediately transfer the frozen block to a freezer at -20 °C or -80 °C for longer-term storage.
Note: While the tissue remains suitable for immunostaining at -20 °C for up to two months, the best immunohistochemistry results, particularly for resolving fine cellular structures, are obtained using freshly frozen tissues.
5. Cryosectioning and mounting
a. Equilibrate the frozen O.C.T. blocks inside the cryostat chamber (typically set between -20 and -22 °C) for at least 30 min prior to sectioning to prevent the block from cracking.
Note: Set the cryostat chamber temperature to approximately -20 °C and the blade temperature to approximately -20 °C during cryosectioning. These temperatures may be adjusted slightly depending on the cryostat and tissue condition.
b. Slice the embedded brains into 10–20 μm thick coronal sections.
c. Use a fine paintbrush to keep the sections flat against the cryostat stage and carefully mount the sections onto SuperFrost Plus positively charged slides to ensure maximum tissue adhesion.
d. Allow the mounted sections to air-dry at room temperature for 20–30 min.
Note: This drying step securely binds the tissue to the glass.
e. Proceed immediately to immunofluorescence staining or store the slide boxes at -20 °C for up to two months.
Note: As with the blocks, the best staining results are achieved on freshly cut tissues.
B2. Immunofluorescence staining on mouse embryonic brain sections
1. Wash the slide-mounted sections with 1× DPBS three times for 5 min each to completely dissolve and clear the O.C.T. compound.
2. Gently wipe the edges of the slides without allowing the tissue sections to dry.
3. Use a hydrophobic barrier pen (PAP pen) to draw a continuous circle around the tissue sections.
Note: This confines the subsequent staining solutions and minimizes reagent volume.
4. Permeabilize and block by applying blocking buffer directly onto the slides, ensuring all tissue sections are completely covered. Incubate for 1 h at room temperature.
5. Aspirate the blocking buffer. Apply the primary antibody diluted to the optimized concentration in the blocking buffer. Incubate the sections for 1 h at room temperature, or overnight (12 h) at 4 °C for optimal tissue penetration.
Note: Dilute the primary antibodies using the specified ratios: chicken anti-GFP (1:500) and rabbit anti-ARL13B (1:400).
6. Wash the slides with 1× DPBS three times, 5 min each, to remove unbound primary antibodies.
7. Apply the fluorophore-conjugated secondary antibody diluted in the blocking buffer. Incubate for 1 h at room temperature in the dark.
Note: Dilute the secondary antibodies using the specified ratios: donkey anti-chicken Alexa Fluor 488 (1:200) and donkey anti-rabbit rhodamine (1:100). Follow the specified antibody dilutions and incubation times.
8. Aspirate the secondary antibody. Counterstain the nuclei by applying 1 μg/mL Hoechst 33258 in DPBS for 10 min at room temperature.
9. Wash the slides with 1× DPBS three times, 5 min each.
10. Mount the sections using an antifade mounting reagent, Fluoromount-G, and carefully place a coverslip over the tissue.
Note: Store slides at -20 °C in a cardboard slide tray for longer term (up to two months). For optimal tissue morphology and fluorescence preservation, freshly prepared slides are recommended whenever possible.
11. Image the brain tissue with a confocal microscope with a 100× oil-immersion lens (Figure 2).
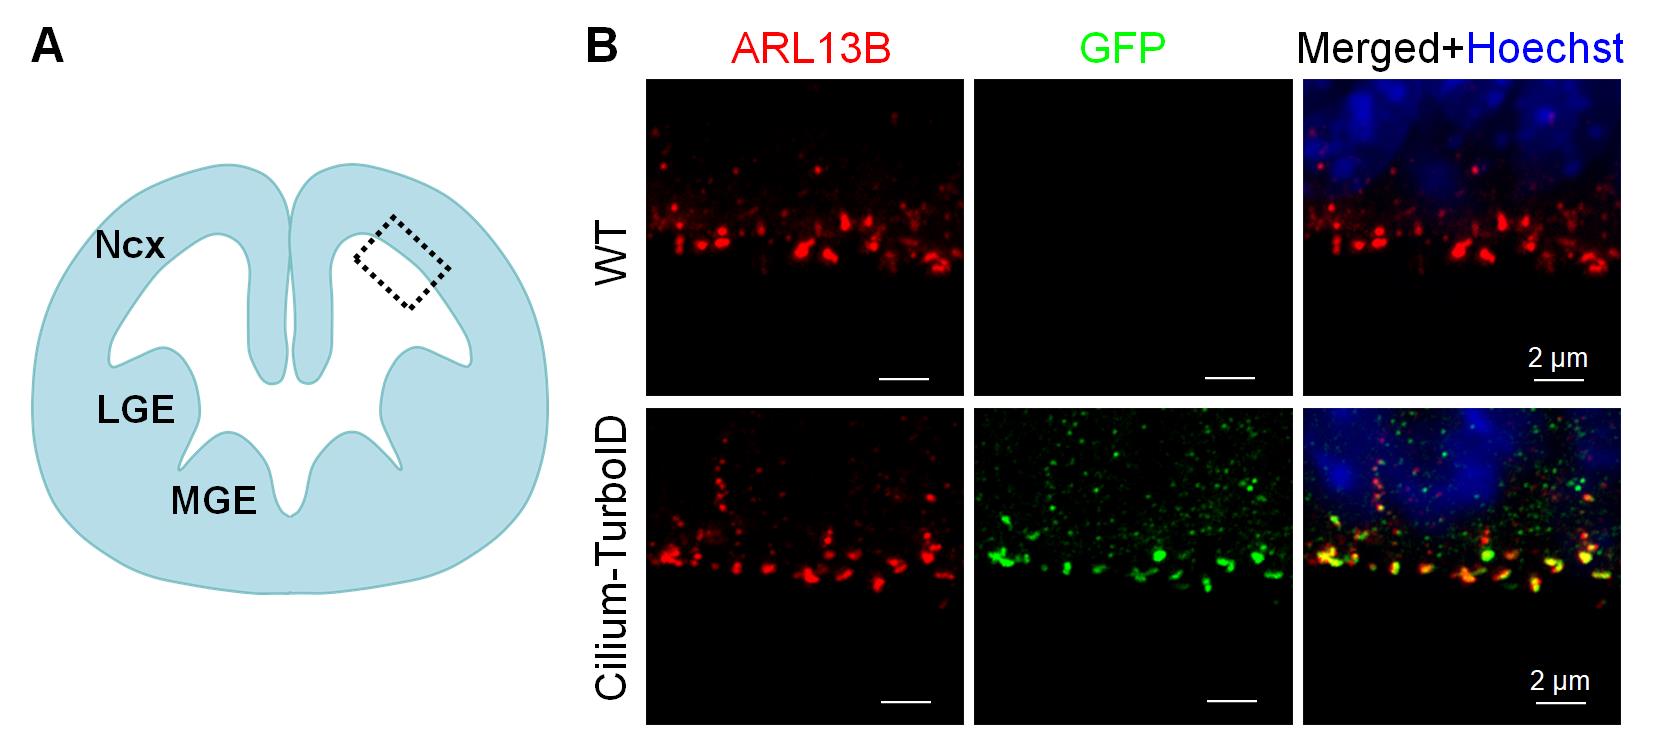
Figure 2. Immunofluorescence of cortical sections from the telencephalon of E12.5 embryos. (A) Schematic illustration of the embryonic brain section. Ncx, neocortex; LGE, lateral ganglionic eminence; MGE, medial ganglionic eminence. (B) Immunofluorescence staining of coronal sections of the E12.5 embryonic telencephalon. The fusion protein was detected by GFP immunostaining (green), cilia were labeled with ARL13B (red), and nuclei were visualized with Hoechst 33258 (blue). Regions indicated by gray dashed boxes in (A) are shown at higher magnification. Images shown are representative of 12 independent embryos from two litters and three independent experiments. Scale bars, 2 μm.
B3. Whole-mount staining of the primary cilia of embryonic radial glia
For detailed procedures for dissection and whole-mount preparation of the mouse embryonic telencephalon, please refer to our previously published protocol [20].
Notes:
1. Perform the biotin labeling prior to brain tissue fixation. Following dissection, immerse the embryonic telencephalon in biotin-labeling medium and incubate for 15 min at 37 °C. Following labeling, wash the tissue three times with DPBS for 5 min each, and then proceed with fixation in 4% PFA and immunofluorescence staining. Image the brain tissue with a confocal microscope with a 100× oil-immersion lens (Figure 3).
2. Dilute the primary antibodies using the specified ratios: chicken anti-GFP (1:500) and rabbit anti-ARL13B (1:400). Dilute the secondary antibodies and the streptavidin detection reagent using the specified ratios: donkey anti-chicken Alexa Fluor 488 (1:200), donkey anti-rabbit rhodamine (1:100), and Alexa Fluor 647 streptavidin (1:200). Do not overstain with secondary antibody!
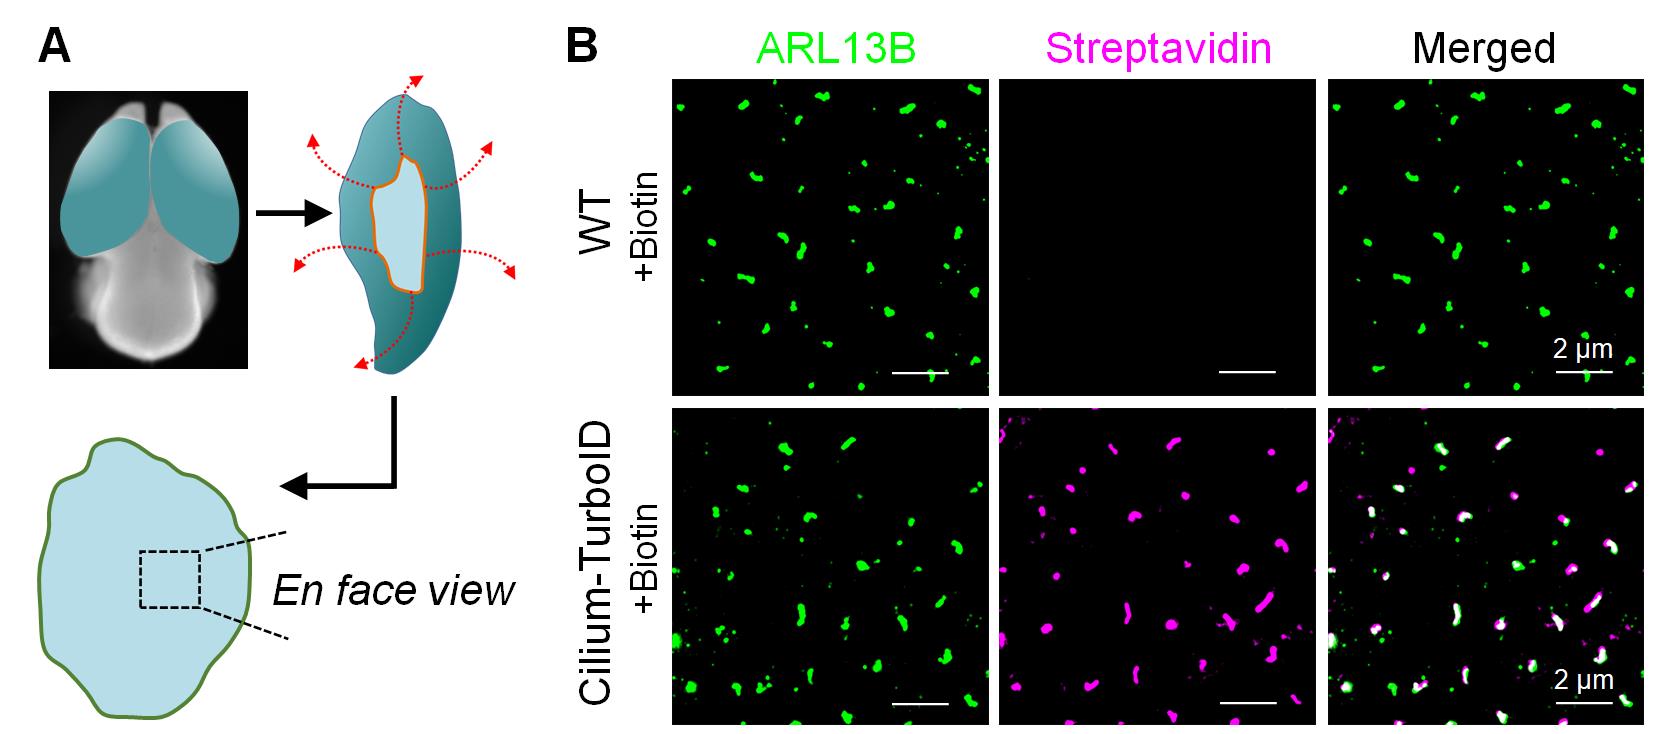
Figure 3. Whole-mount staining of primary cilia in embryonic radial glia. (A) Schematic illustration of the whole-mount preparation of the embryonic cortex. The two hemispheres were separated and radially opened around the ventral region to expose the ventricular surface. The inner surface of the cortex was then directly imaged en face. (B) Whole-mount staining of the neocortex from Cilium-TurboID transgenic and wild-type (WT) E12.5 embryos following biotin labeling. Embryonic cortices were incubated with 50 μM biotin for 15 min at 37 °C and subsequently fixed for immunostaining. Primary cilia were labeled with ARL13B (green), and biotinylated proteins were detected with streptavidin Alexa Fluor 647 (magenta). Images shown are representative of 12 independent embryos from two litters and three independent experiments. Scale bars, 2 μm.
C. Validation of Cilium-TurboID mouse line by neutravidin pulldown and western blotting (WB)
1. Harvest 10–12 embryonic day 12.5 (E12.5) WT and Cilium-TurboID mouse brains and freshly dissect the neocortex (dorsal telencephalon) and ganglion eminences (ventral telencephalon).
2. Incubate the dissected brain tissues (WT and Cilium-TurboID) in prewarmed neurobasal medium containing 50 μM biotin for 15 min at 37 °C. Add DMSO instead of biotin to the medium for the non-labeled control brain tissues (WT and Cilium-TurboID).
3. Terminate the labeling reaction by rapidly aspirating the labeling medium and washing the tissue chunks four times with large volumes of ice-cold DPBS. Keep samples on ice continuously.
4. Homogenize tissues mechanically with Dounce tissue grinder by adding 500 μL of subcellular fractionation buffer containing protease inhibitors. Incubate for 15 min on ice.
Note: Use 500 μL of subcellular fractionation buffer for 10 hemispheres. Homogenize tissue samples with 10–15 Dounce strokes to achieve initial tissue disruption.
5. Pass the tissue suspension through a 27-gauge needle 15 times (or until all cells are lysed) to physically disrupt the cells. Leave it on ice for 20 min.
Note: To verify cell lysis, stain a small aliquot with Trypan Blue. Lysed cells will appear blue under a brightfield microscope, whereas intact cells will exclude the dye and remain unstained.
6. Centrifuge the sample at 720× g (3,000 rpm) for 5 min at 4 °C. The pellet contains nuclei, while the supernatant contains the cytoplasmic, membrane, and mitochondrial fractions. Transfer the supernatant to a fresh tube and centrifuge at 10,000× g (8,000 rpm) for 5 min at 4 °C. The pellet contains mitochondria. Transfer the resulting supernatant to a fresh tube and keep on ice; this fraction contains the cytoplasmic and membrane proteins and is used for subsequent processing.
Note: This step removes highly abundant nuclear contaminants like histones that would otherwise overwhelm the affinity matrix. Supernatant samples can be safely stored at -80 °C until further processing.
7. Add appropriate volumes of ice-cold 10× TBS, 10% NP-40, and 1% SDS to the supernatant, bringing the final buffer composition to 1× TBS, 0.5% NP-40, and 0.1% SDS. Pipette gently to ensure a homogeneous mixture.
8. Sonicate the supernatant in an ice-water bath for 5–10 cycles (3-s pulse, 10-s rest) to disrupt any remaining membrane complexes.
Note: Operate the sonicator at 50% amplitude and ensure the sample remains thoroughly chilled to prevent heat-induced protein degradation.
9. Centrifuge the lysate at 10,000× g for 15 min at 4 °C, then carefully transfer the clarified supernatant to a pre-chilled protein LoBind tube and maintain on ice.
10. Measure protein concentration via a BCA assay and normalize all sample inputs to an identical protein mass.
Note: Prepare 1:2, 1:5, and 1:10 dilutions of the lysates to ensure the protein concentration falls within the linear range of the standard curve. As a benchmark, 10 hemispheres from E12.5 brains typically yield approximately 0.7 mg of total protein.
11. Reserve an aliquot containing 50 μg of total protein as the input control for western blotting.
12. Preparation and equilibration of neutravidin agarose resins:
a. Equilibrate the neutravidin agarose resin slurry and all necessary wash buffers to room temperature prior to use.
b. Thoroughly resuspend the resin to ensure a homogeneous mixture by gently vortexing, repeated inversion, or placing the stock vial on a rotating platform.
c. Transfer 50 μL of the homogeneous slurry (equivalent to 25 μL of settled resin) into a 1.5 mL protein LoBind tube.
d. Centrifuge the tube at 500× g for 1 min, then carefully aspirate and discard the storage solution supernatant.
e. Wash step: Add 1 mL of 1× TBS buffer to the resin bed. Gently vortex or invert the tube several times to resuspend the resin. Centrifuge at 500× g for 1 min and discard the supernatant. Repeat this wash step one additional time.
Note: Never allow the agarose resin bed to dry out. Immediately add the subsequent buffer or protein lysate directly after removing the supernatant.
13. Transfer the normalized protein lysates to the tube containing the pre-washed, equilibrated neutravidin agarose resin. Incubate the mixture for 1.5 h at room temperature on an end-over-end rotator to allow for optimal binding of the biotinylated proteins.
Note: For each sample, 0.65 mg of total protein in 600 μL of lysate was applied to 25 μL of settled neutravidin agarose resin.
14. Pellet the resin by centrifuging at 500× g for 1 min. Carefully aspirate and discard the supernatant, taking care not to disturb the resin bed.
15. Wash the protein-bound resin two times with the lysis buffer. For each wash, add the buffer, invert the tube gently to mix, centrifuge at 500× g for 1 min, and discard the supernatant.
16. Wash the resin four times with 1× DPBS. Follow the same procedure: resuspend the resin in 1× DPBS, centrifuge at 500× g for 1 min, and carefully aspirate the supernatant. After the final (fourth) wash, remove as much residual DPBS as possible without aspirating the beads.
17. Elute the captured biotinylated proteins directly from the neutravidin agarose resin by resuspending the pellet in 50 μL of 2× Laemmli sample buffer supplemented with 2-mercaptoethanol.
18. Boil the resin mixture at 90–95 °C for 5–10 min to fully denature and release the bound proteins, then immediately plunge the tube into ice to cool. Centrifuge the tube at 500× g for 1 min to pellet the agarose resin and carefully transfer the protein-containing supernatant into a fresh 1.5 mL microcentrifuge tube.
19. Separate the eluted proteins using 10% SDS-polyacrylamide gel electrophoresis (SDS-PAGE) and transfer the proteins to a PVDF membrane.
20. Block the membrane with 5% BSA in TBST for 1 h at room temperature. Incubate the membrane with primary antibodies overnight at 4 °C or for 2 h at room temperature, followed by three washes with TBST for 5–10 min each. Incubate with the HRP-conjugated secondary antibody for 1 h at room temperature, followed by three washes with TBST for 5–10 min each. For detection of biotinylated proteins, incubate with HRP-conjugated neutravidin.
21. Detect the protein bands using the SuperSignal West Pico chemiluminescence substrate and acquire images using a ChemiDoc MP imaging system under conditions that avoid signal saturation (Figure 4).
Notes:
1. Electrophoresis parameters: Initiate the gel run at 100 V. Once the samples migrate past the stacking gel and enter the separating gel, increase the voltage to 120 V. Continue running for 1–2 h until the blue dye front reaches the bottom edge of the gel.
2. Antibody dilutions: Prepare the primary and secondary antibodies at the following validated working ratios: rabbit anti-ARL13B (1:2,000), mouse anti-GAPDH (1:2,000), HRP-conjugated donkey anti-rabbit IgG (1:10,000), HRP-conjugated donkey anti-mouse IgG (1:10,000), and HRP-conjugated neutravidin (1:10,000).
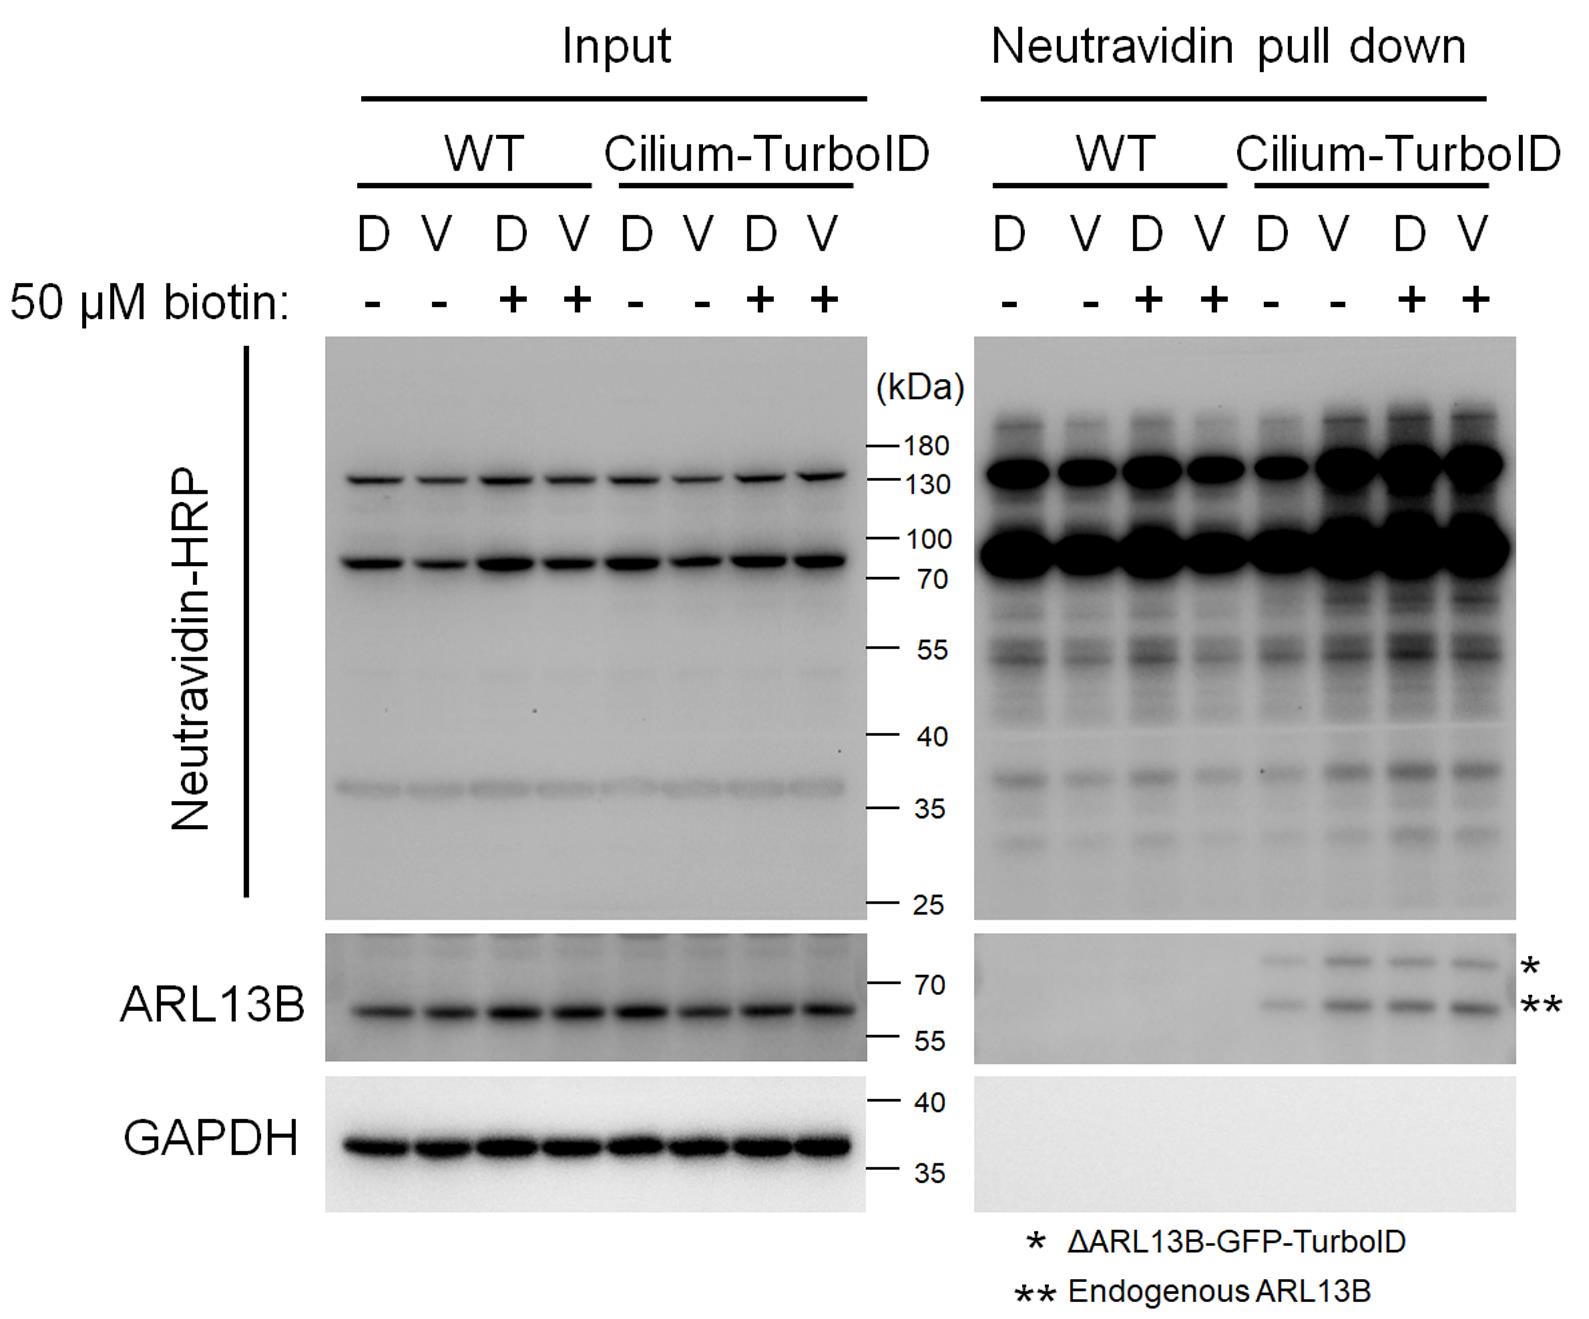
Figure 4. Western blot analysis of biotinylated proteins enriched using neutravidin agarose beads. Dorsal (D) and ventral (V) telencephalic regions from E12.5 wild-type (WT) and Cilium-TurboID embryos were incubated with or without 50 μM biotin for 15 min at 37 °C. Tissues were then lysed, and biotinylated proteins were enriched using neutravidin agarose beads. Each lane represents a pool of lysates from 10–12 embryonic brains. Biotinylated proteins were detected using neutravidin-HRP. Immunoblotting with an anti-ARL13B antibody revealed that both endogenous ARL13B and the transgenic ΔARL13B-GFP-TurboID fusion protein were biotinylated in Cilium-TurboID brains and consequently enriched by neutravidin affinity capture. The displayed blot is representative of three independent experiments.
D. Embryonic brain lysis and affinity purification for mass spectrometry analysis
1. Collect and label embryonic brains. For each labeling condition (WT + biotin, transgenic + biotin, and transgenic + vehicle), collect 420–430 embryonic brains. Perform biotin labeling and tissue washing as described in Section C.
2. Homogenize the tissue. Add 10 mL of subcellular fractionation buffer containing protease inhibitors to the labeled tissues. Homogenize using 10–15 Dounce strokes and incubate for 15 min on ice.
3. Pass the tissue suspension through a 27-gauge needle 15 times or until complete cell lysis is achieved.
4. Centrifuge the homogenate at 720× g (3,000 rpm) for 5 min at 4 °C. Transfer the supernatant to a fresh tube without disturbing the pellet.
5. Centrifuge the recovered supernatant at 10,000× g (8,000 rpm) for 5 min at 4 °C. Transfer the resulting supernatant to a fresh tube.
6. Lyse membrane-associated complexes. Adjust the supernatant to final concentrations of 1× TBS, 0.5% NP-40, and 0.1% SDS. Sonicate for 5–10 cycles (3 s pulse, 10 s rest) at 50% amplitude, keeping the sample on ice.
7. Centrifuge the sample at 10,000× g for 15 min at 4 °C. Transfer the clarified supernatant to a fresh, pre-chilled protein LoBind tube and keep on ice.
8. Measure the total protein concentration using a BCA assay. For each labeling condition, use 15 mg of total protein, divided evenly into three biological replicates.
9. Prepare the neutravidin agarose resin. Use 400 µL of settled neutravidin agarose resin per labeling condition. Equilibrate the resin and wash buffers to room temperature and wash the resin twice with 1× TBS, as described in Section C.
10. Add the normalized lysates to the equilibrated neutravidin agarose resin and incubate for 1.5 h at room temperature on an end-over-end rotator.
11. Centrifuge at 500× g for 1 min and carefully remove the supernatant. Wash the resin twice with lysis buffer and four times with DPBS, centrifuging at 500× g for 1 min after each wash.
12. After the final DPBS wash, remove as much residual DPBS as possible without disturbing the resin.
Note: Do not elute the proteins with SDS sample buffer. Retain the neutravidin agarose resin containing the enriched biotinylated proteins and store at −80 °C until further processing for mass spectrometry analysis.
E. On-beads trypsin digestion and TMT labeling
Note: In our work, the neutravidin agarose resin containing the enriched proteins was transferred to the Yates Laboratory at Scripps Research Institute for mass spectrometry analysis and downstream MS data processing [17].
1. Protein denaturation and reduction: Resuspend the neutravidin agarose resin containing the enriched proteins in 8 M urea in 100 mM TEAB. Reduce disulfide bonds with 5 mM TCEP and alkylate free cysteine residues with 2-chloroacetamide.
2. Protein precipitation: Precipitate the bead-bound proteins using methanol/chloroform.
3. On-beads digestion: Digest the precipitated bead-bound proteins with trypsin in 1 M urea and 100 mM TEAB.
4. TMT labeling: Dry the resulting peptides by vacuum centrifugation and label them with 10-plex TMT reagents according to the manufacturer’s instructions. Use one TMT channel as an internal reference, consisting of one-tenth of the total protein from each of the other nine channels.
5. Peptide fractionation: Pool the TMT-labeled peptides, dry them by vacuum centrifugation, and fractionate them by high-pH reverse-phase chromatography into four fractions using 12.5%, 17.5%, 22.5%, and 50% acetonitrile, according to the manufacturer’s protocol.
F. Mass spectrometry
In our work, mass spectrometry was performed by the Yates Laboratory at the Scripps Research Institute using a Fusion Lumos mass spectrometer. Peptides were separated on a 25 cm × 100 μm C18 column using a 140-min nanoflow liquid chromatography (Nlc) gradient at 300 nL/min and analyzed in data-dependent acquisition mode. Full MS1 scans were acquired in the Orbitrap at 120,000 resolution, followed by collision-induced dissociation (CID) MS/MS in the ion trap. TMT reporter ions were quantified using synchronous precursor selection (SPS) MS3 acquisition at 7,500 resolution, with monoisotopic precursor selection and 10-s dynamic exclusion [17].
G. MS data processing and analysis
In our work, MS data processing and analysis were performed by the Yates Laboratory at the Scripps Research Institute using the Integrated Proteomics Pipeline (IP2). Tandem mass spectra were extracted with RawConverter and searched with ProLuCID against the reviewed Mus musculus UniProt database supplemented with the modified ARL13B-GFP-TurboID sequence, streptavidin, and common contaminants. Carbamidomethylation and TMT labeling were specified as static modifications. Protein identifications were filtered with DTASelect2 using a target-decoy strategy at a 1% spectrum-level false discovery rate. TMT reporter ion intensities were quantified with Census2 using an isobaric purity threshold of 0.6 and normalized to the internal reference channel [17].
Validation of protocol
This protocol has been used and validated in the following research article:
• Liu et al. [17]. Proximity labeling proteomics maps radial glial ciliary proteins across the developing telencephalon. Cell Reports, 2026, 45(5):117355. (Figures 1 and 2, Supplementary figures 1 and 2)
General notes and troubleshooting
General notes
Successful TurboID labeling should be evaluated at both imaging and biochemical levels. For imaging experiments, the TurboID fusion protein should show appropriate ciliary localization, and biotin labeling should produce a detectable streptavidin signal at the ciliary region. For biochemical enrichment, biotinylated proteins should be readily detectable after NeutrAvidin affinity capture, with substantially lower signal in WT and no-exogenous-biotin controls. Because TurboID labeling efficiency can be affected by transgene expression, tissue handling, biotin exposure, and developmental stage, experimental and control samples should be processed in parallel using standardized conditions.
Troubleshooting
Problem 1: Tissue detaches or “pops out” of the O.C.T. block during sectioning.
Possible cause: Residual sucrose remains on the tissue surface before O.C.T. embedding, preventing proper adhesion between the tissue and O.C.T.
Solution: Thoroughly blot the tissue with a Kimwipe to remove excess sucrose before embedding it in O.C.T.
Problem 2: Severe freezing artifacts or disrupted cellular morphology are observed in the tissue sections.
Possible cause: The cryomold was submerged in the dry ice–ethanol bath, allowing ethanol to contact the O.C.T. surface and alter its freezing properties.
Solution: Freeze the cryomold without submerging it in the dry ice–ethanol bath and avoid splashing ethanol onto the O.C.T.
Problem 3: The ventricular surface of the embryonic telencephalon, including primary cilia, is damaged or poorly preserved.
Possible cause: Mechanical abrasion of the ventricular zone during dissection, where radial glial primary cilia are densely localized.
Solution: Handle the tissue only by its edges or olfactory bulbs and minimize contact with the ventricular surface until fixation is complete.
Problem 4: Reduced tissue quality or weak detection of biotinylated proteins after storage of fixed tissue blocks or sections.
Possible cause: Prolonged storage of frozen O.C.T. blocks or sections.
Solution: Although blocks and sections can be stored at -20 °C for up to 2 months, use freshly frozen and freshly sectioned tissue whenever possible for optimal structural preservation and proximity-labeling detection.
Problem 5: Tissue sections show increased background fluorescence.
Possible cause: The sections were allowed to dry during slide preparation or staining.
Solution: Avoid drying the tissue when wiping the slides and keep sections hydrated throughout the procedure.
Problem 6: High nonspecific fluorescence or poor visualization of primary cilia is observed.
Possible cause: Excessive secondary antibody incubation or incomplete removal of unbound antibodies from the relatively thick cryosections.
Solution: Limit the secondary antibody incubation to 1 h and follow the specified antibody dilution and incubation conditions. Perform thorough 1× DPBS washes and gently agitate the slides on a platform shaker during each 5-min wash.
Problem 7: Difficulty determining whether labeling was successful.
Possible cause: Insufficient TurboID expression or activity; inadequate biotin exposure; inefficient tissue penetration.
Solution: Verify that the Cilium-TurboID fusion protein is predominantly localized to primary cilia. Maintain the labeling conditions within the validated range and include WT controls processed in parallel. Assess labeling by whole-mount fluorescence using streptavidin-conjugated fluorophore and by streptavidin/NeutrAvidin-based immunoblotting. Successful labeling should show substantially stronger biotinylated-protein signal in Cilium-TurboID tissue after biotin treatment than in WT or no-biotin controls, together with appropriate ciliary localization of the TurboID fusion protein.
Acknowledgments
We thank all authors from the corresponding original research paper in which this protocol was used: Cell Reports [17]. This work was supported by the National Science Foundation CAREER award (IOS-2143711) to X.G.
Author contributions
X. Liu: Conceptualization and writing—original draft, review, and editing. X. Ge: Conceptualization, review, and editing.
Competing interests
The authors declare no conflicts of interest.
Ethical considerations
All mouse work was performed according to guidelines approved by the IACUC of the University of California, Merced (animal protocol no. 2023-1151).
References
- Singla, V. and Reiter, J. F. (2006). The Primary Cilium as the Cell's Antenna: Signaling at a Sensory Organelle. Science. 313(5787): 629–633. https://doi.org/10.1126/science.1124534
- Goetz, S. C. and Anderson, K. V. (2010). The primary cilium: a signalling centre during vertebrate development. Nat Rev Genet. 11(5): 331–344. https://doi.org/10.1038/nrg2774
- Reiter, J. F. and Leroux, M. R. (2017). Genes and molecular pathways underpinning ciliopathies. Nat Rev Mol Cell Biol. 18(9): 533–547. https://doi.org/10.1038/nrm.2017.60
- Valente, E. M., Rosti, R. O., Gibbs, E. and Gleeson, J. G. (2013). Primary cilia in neurodevelopmental disorders. Nat Rev Neurol. 10(1): 27–36. https://doi.org/10.1038/nrneurol.2013.247
- Liu, S., Trupiano, M. X., Simon, J., Guo, J. and Anton, E. S. (2021). The essential role of primary cilia in cerebral cortical development and disorders. Curr Top Dev Biol. 142: 99–146. https://doi.org/10.1016/bs.ctdb.2020.11.003
- Kriegstein, A. and Alvarez-Buylla, A. (2009). The Glial Nature of Embryonic and Adult Neural Stem Cells. Annu Rev Neurosci. 32(1): 149–184. https://doi.org/10.1146/annurev.neuro.051508.135600
- Lehtinen, M. K. and Walsh, C. A. (2011). Neurogenesis at the Brain–Cerebrospinal Fluid Interface. Annu Rev Cell Dev Biol. 27(1): 653–679. https://doi.org/10.1146/annurev-cellbio-092910-154026
- Lehtinen, M. K., Zappaterra, M. W., Chen, X., Yang, Y. J., Hill, A. D., Lun, M., Maynard, T., Gonzalez, D., Kim, S., Ye, P., et al. (2011). The Cerebrospinal Fluid Provides a Proliferative Niche for Neural Progenitor Cells. Neuron. 69(5): 893–905. https://doi.org/10.1016/j.neuron.2011.01.023
- Delling, M., DeCaen, P. G., Doerner, J. F., Febvay, S. and Clapham, D. E. (2013). Primary cilia are specialized calcium signalling organelles. Nature. 504(7479): 311–314. https://doi.org/10.1038/nature12833
- Mukhopadhyay, S., Badgandi, H. B., Hwang, S. h., Somatilaka, B., Shimada, I. S. and Pal, K. (2017). Trafficking to the primary cilium membrane. Mol Biol Cell. 28(2): 233–239. https://doi.org/10.1091/mbc.e16-07-0505
- Ishikawa, H., Thompson, J., Yates, J. R. and Marshall, W. F. (2012). Proteomic Analysis of Mammalian Primary Cilia. Curr Biol. 22(5): 414–419. https://doi.org/10.1016/j.cub.2012.01.031
- Liu, X. and Ge, X. (2025). TurboID Labeling and Analysis of Proteins in the Primary Cilium. Bio Protoc. 15(1370): e5303. https://doi.org/10.21769/bioprotoc.5303
- Liu, X., Yam, P. T., Schlienger, S., Cai, E., Zhang, J., Chen, W. J., Torres Gutierrez, O., Jimenez Amilburu, V., Ramamurthy, V., Ting, A. Y., et al. (2024). Numb positively regulates Hedgehog signaling at the ciliary pocket. Nat Commun. 15(1): 3365. https://doi.org/10.1038/s41467-024-47244-1
- Branon, T. C., Bosch, J. A., Sanchez, A. D., Udeshi, N. D., Svinkina, T., Carr, S. A., Feldman, J. L., Perrimon, N. and Ting, A. Y. (2018). Efficient proximity labeling in living cells and organisms with TurboID. Nat Biotechnol. 36(9): 880–887. https://doi.org/10.1038/nbt.4201
- Mick, D. U., Rodrigues, R. B., Leib, R. D., Adams, C. M., Chien, A. S., Gygi, S. P. and Nachury, M. V. (2015). Proteomics of Primary Cilia by Proximity Labeling. Dev Cell. 35(4): 497–512. https://doi.org/10.1016/j.devcel.2015.10.015
- May, E. A., Kalocsay, M., D’Auriac, I. G., Schuster, P. S., Gygi, S. P., Nachury, M. V. and Mick, D. U. (2021). Time-resolved proteomics profiling of the ciliary Hedgehog response. J Cell Biol. 220(5): e202007207. https://doi.org/10.1083/jcb.202007207
- Liu, X., Gutierrez, O. T., Baboo, S., Cai, E., Kaur, G., Al-Issa, Y., Diedrich, J. K., Yates, J. R. and Ge, X. (2026). Proximity labeling proteomics maps radial glial ciliary proteins across the developing telencephalon. Cell Rep. 45(5): 117355. https://doi.org/10.1016/j.celrep.2026.117355
- Hung, V., Udeshi, N. D., Lam, S. S., Loh, K. H., Cox, K. J., Pedram, K., Carr, S. A. and Ting, A. Y. (2016). Spatially resolved proteomic mapping in living cells with the engineered peroxidase APEX2. Nat Protoc. 11(3): 456–475. https://doi.org/10.1038/nprot.2016.018
- Gupta, G. D., Coyaud, Ã., Gonçalves, J., Mojarad, B. A., Liu, Y., Wu, Q., Gheiratmand, L., Comartin, D., Tkach, J. M., Cheung, S. W., et al. (2015). A Dynamic Protein Interaction Landscape of the Human Centrosome-Cilium Interface. Cell. 163(6): 1484–1499. https://doi.org/10.1016/j.cell.2015.10.065
- Gutierrez, O., Liu, X. and Ge, X. (2025). Whole-Mount Visualization of Primary Cilia in the Developing Mouse Brain. Bio Protoc. 15(1387): e5538. https://doi.org/10.21769/bioprotoc.5538
Article Information
Publication history
Received: Aug 16, 2026
Accepted: Oct 8, 2026
Available online: Oct 23, 2026
Published: Nov 20, 2026
Copyright
© 2026 The Author(s); This is an open access article under the CC BY-NC license (https://creativecommons.org/licenses/by-nc/4.0/).
How to cite
Liu, X. and Ge, X. (2026). TurboID-Mediated Proteomic Study in the Primary Cilia of Embryonic Mouse Brain. Bio-protocol 16(22): e5868. DOI: 10.21769/BioProtoc.5868.

 Download Citation in RIS Format
Do you have any questions about this protocol?
Post your question to gather feedback from the community. We will also invite the authors of this article to respond.
 Post a Question


