


- Protocols

- Articles and Issues
- For Authors
- About
- Become a Reviewer


Long-Term Neutrophil Depletion and Flow Cytometric Analysis of Brain Neutrophils in the 5xFAD Mouse Model

Published: Vol 16, Iss 21, Nov 5, 2026 DOI: 10.21769/BioProtoc.5864 Views: 60
Reviewed by: Sébastien GillotinSreesankar EaswaranAnonymous reviewer(s)
 PDF
 Ask a question


Protocol Collections
Comprehensive collections of detailed, peer-reviewed protocols focusing on specific topics



Abstract
Neutrophils are the most abundant circulating leukocytes in human blood and have been implicated in the progression of Alzheimer’s disease (AD). Elevated neutrophil numbers have been observed in the blood and brain parenchyma of AD patients and mouse models, yet their precise pathological role remains poorly understood. A major barrier to progress is the lack of validated protocols for long-term neutrophil depletion and reliable recovery of brain-infiltrating neutrophils for characterization. Here, we describe a step-by-step protocol for sustained neutrophil depletion in the 5xFAD mouse model using intraperitoneal injection of an anti-Ly6G antibody for six weeks. We used a dose-escalation strategy to maintain depletion efficiency, as neutrophil regeneration increases over time. We also applied a previously established flow cytometry method to monitor neutrophil depletion in peripheral blood, using an antibody panel designed to avoid interference from the depleting anti-Ly6G clone. Furthermore, we present an optimized brain tissue processing workflow that combines mechanical dissociation with Percoll density gradient centrifugation to collect brain-infiltrating neutrophils for downstream flow cytometric analysis. Here, this workflow was applied and validated in the 5xFAD mouse model but is not specific to AD brain tissue and may be applicable to other mouse models.
Key features
• Depletion of circulating neutrophils in mice.
• Assessment of neutrophil depletion efficiency in mouse blood.
• Processing of mouse brain parenchyma and recovery of brain-infiltrating neutrophils.
• Flow cytometric analysis of neutrophils isolated from mouse brain tissue.
Keywords: 5xFAD Neutrophil depletion
Neutrophil isolation
Flow cytometry
Anti-Ly6G
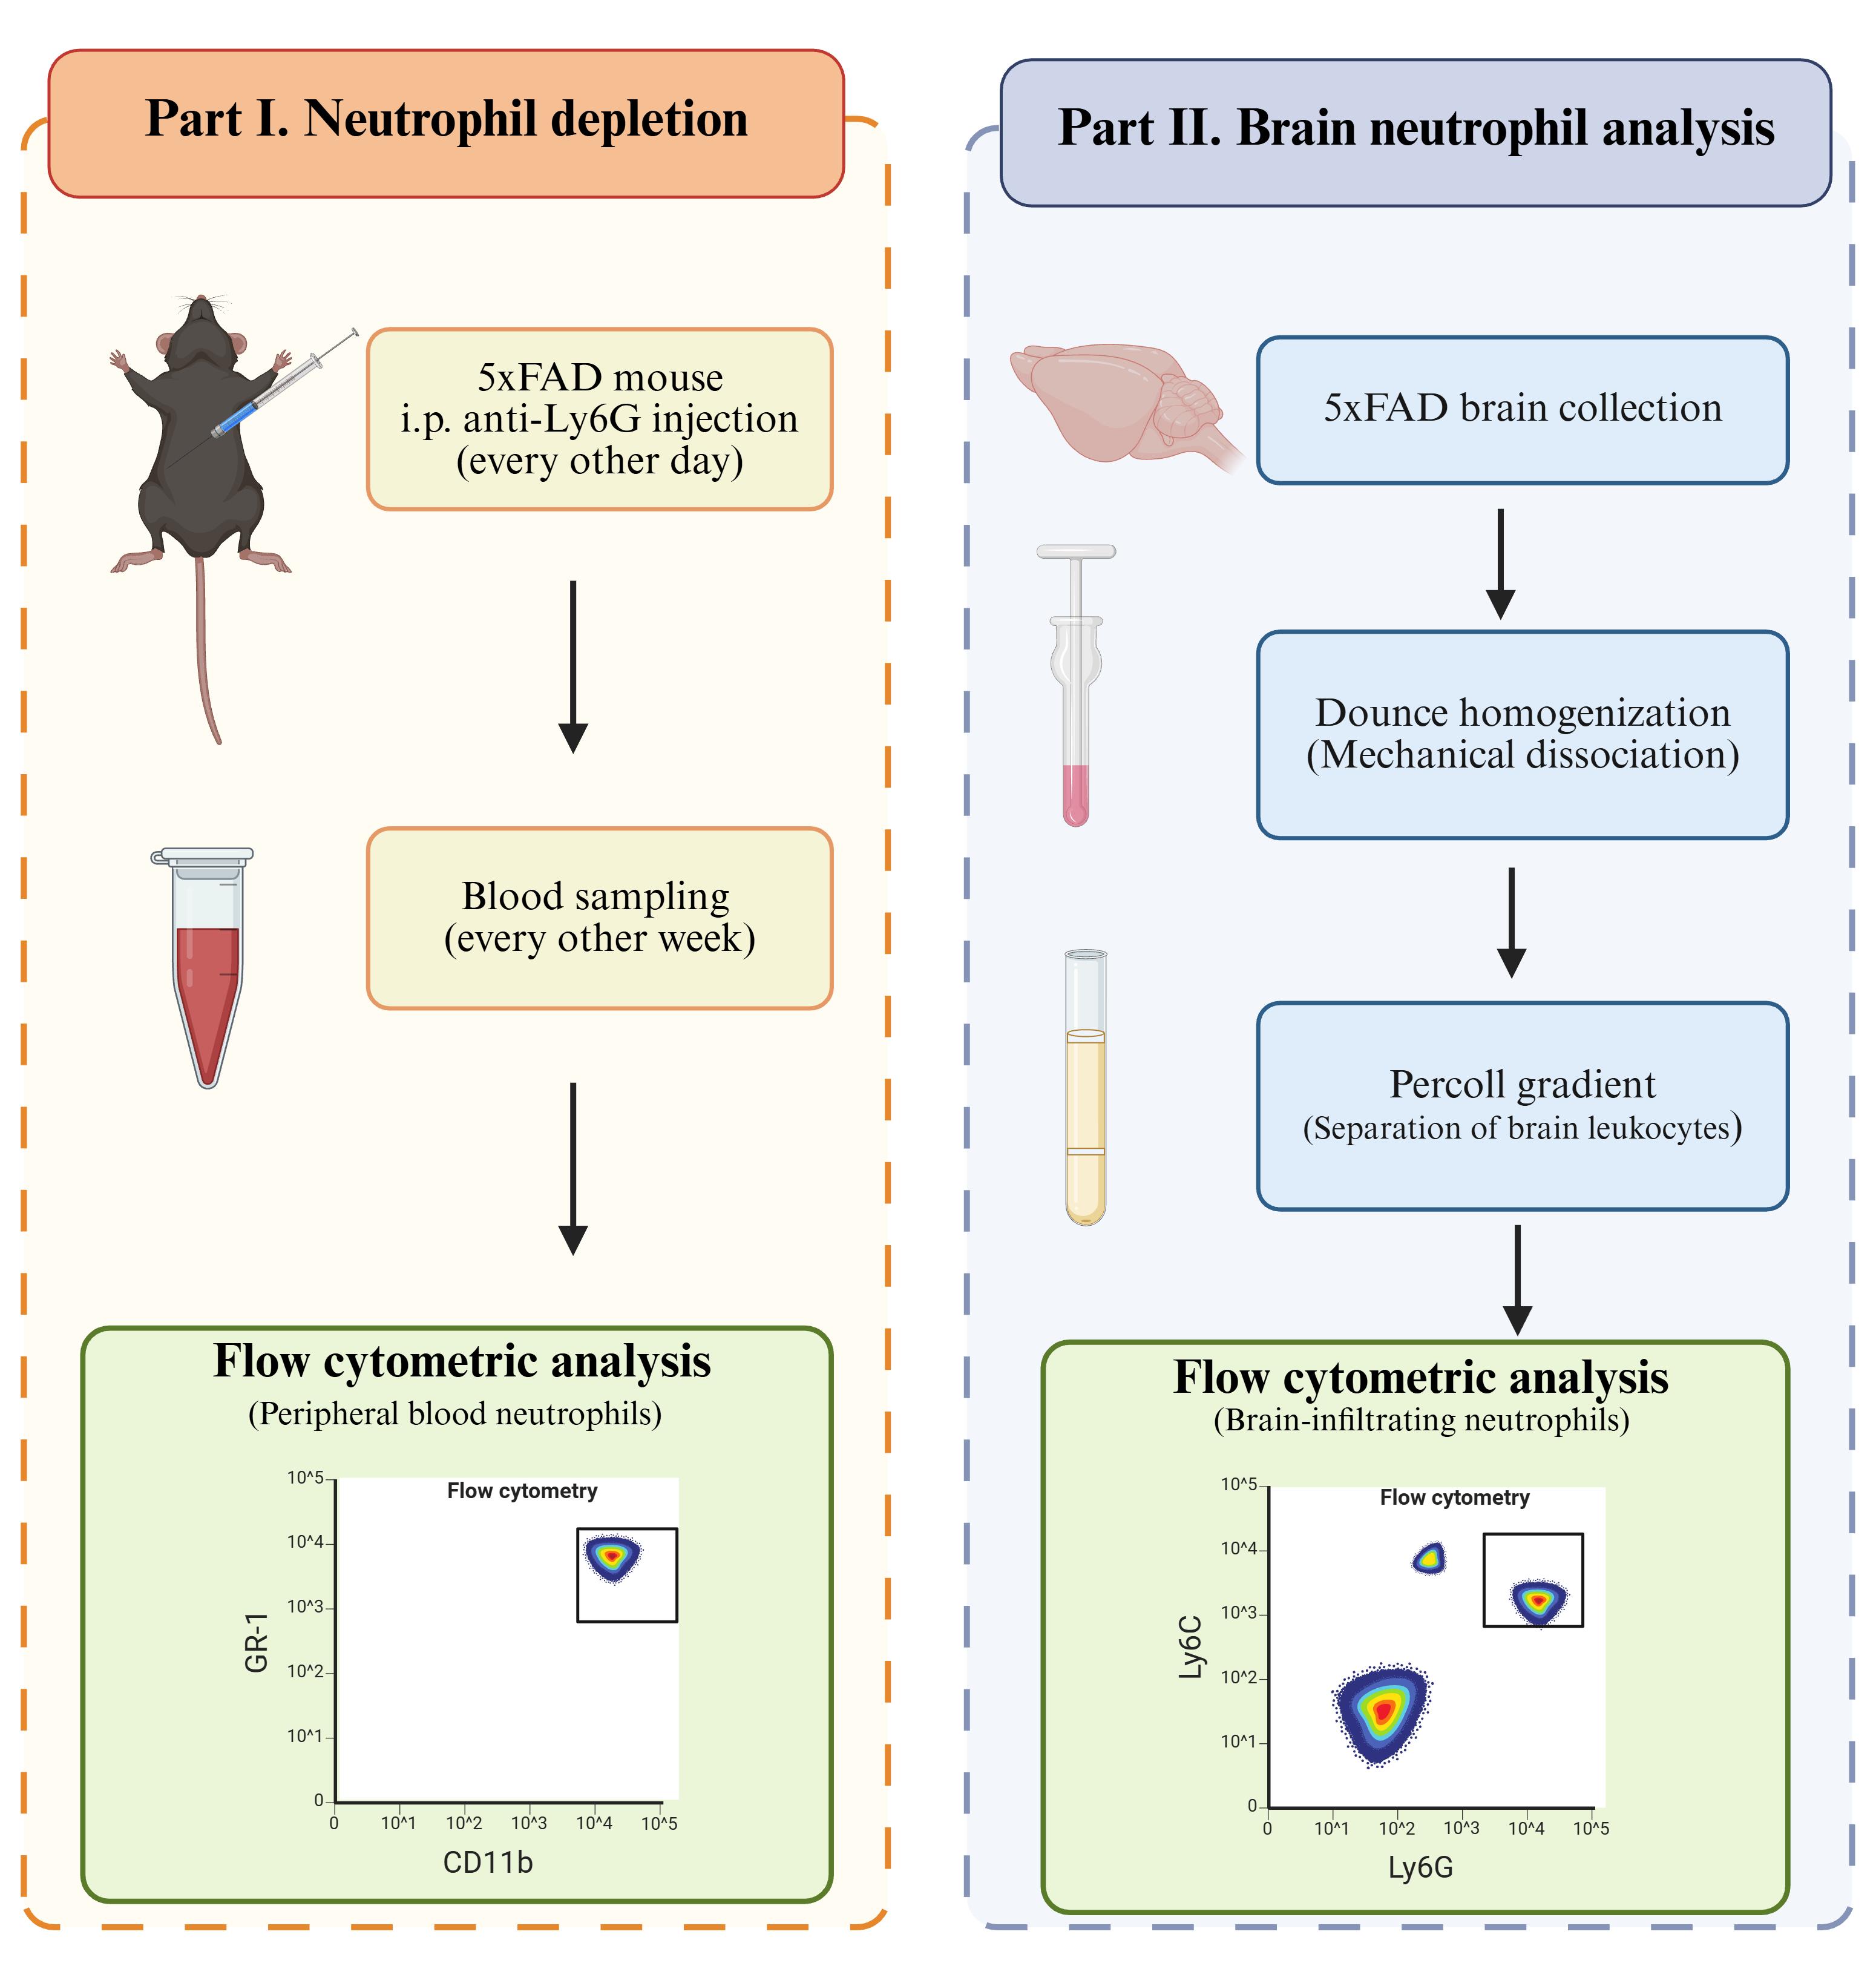
Graphical overview
Background
Alzheimer’s disease (AD) is one of the most serious neurodegenerative disorders worldwide. The pathology of AD is complex and involves multiple pathologies, including amyloid-β accumulation, tau neurofibrillary tangles, abnormal neuroinflammation, and oxidative stress. Recently, increasing evidence has suggested that innate immune cells contribute to the progression of AD. Elevated neutrophil numbers have been observed in patients with AD and in the brains of AD mouse models, including 5xFAD and 3xTg mice, compared with healthy controls [1,2]. Neutrophils may contribute to disease progression by impairing cerebral blood flow and vascular function [3]. However, the precise role of neutrophils in AD pathologies remains unclear. Experimental approaches that enable sustained manipulation of neutrophils and subsequent characterization of brain-associated neutrophils are therefore valuable for investigating their contribution to AD and other chronic neurodegenerative diseases.
Neutrophil depletion using anti-Ly6G antibodies is widely used to investigate neutrophil function in mouse models. Most published depletion protocols, however, use treatment periods of less than two to three weeks [4,5]. The commonly used rat anti-Ly6G clone 1A8 can induce anti-rat antibodies following repeated administration, potentially accelerating clearance of the injected antibody and reducing depletion efficiency during prolonged treatment [6]. The use of murinized anti-Ly6G antibodies provides an approach for overcoming this limitation. Olofsen et al. demonstrated sustained neutrophil depletion using a murinized anti-Ly6G antibody for 28 days [7]. However, chronic neurodegenerative diseases may require neutrophil manipulation over longer experimental periods, and the performance of prolonged depletion strategies in an AD model has not been established. In addition, prolonged anti-Ly6G treatment creates challenges for monitoring depletion because occupancy of Ly6G by the depleting antibody can interfere with subsequent detection of the same epitope. Alternative identification strategies, including forward scatter (FSC)/side scatter (SSC) characteristics in combination with GR-1 and CD11b expression, can therefore be used to evaluate circulating neutrophils during treatment as described before [7].
In addition to sustained depletion, investigation of neutrophil function in neurodegenerative disease requires reliable recovery and characterization of neutrophils from brain tissue. Current studies investigating neutrophils in AD have primarily relied on microscopy to identify neutrophils within the brain parenchyma [8]. Flow cytometry provides an alternative approach that enables phenotypic characterization of individual immune-cell populations, but established protocols for brain immune-cell isolation generally focus on microglia or broader myeloid populations [9–11]. Mechanical tissue dissociation and Percoll density-gradient separation are established methods for recovering leukocytes from brain tissue. Nevertheless, analysis of brain-infiltrating neutrophils remains technically challenging because neutrophils represent a small fraction of brain leukocytes and are short-lived cells that can be sensitive to tissue processing. Thus, a workflow that applies established brain leukocyte isolation approaches specifically to the recovery and flow cytometric characterization of neutrophils would facilitate their investigation in AD mouse models.
Here, we describe two independent procedures for studying neutrophils in the 5xFAD mouse model of AD. Part I and Part II can be performed independently according to the experimental objective. However, they may also be combined when both long-term neutrophil depletion and subsequent analysis of brain-associated neutrophils are required. Part I describes neutrophil depletion. We adopted the use of murine anti-Ly6G and the alternative flow cytometric identification strategy described for long-term depletion [7], while extending the experimental setting from a 28-day timeline to a 6-week treatment in a chronic neurodegenerative disease model. Part II describes the processing of brain tissue for flow cytometric analysis of brain-infiltrating neutrophils. We apply established mechanical dissociation and Percoll-based leukocyte separation procedures [11] to 5xFAD mouse brain, using gentle mechanical homogenization followed by 40%/80% Percoll density-gradient separation and flow cytometric identification of neutrophils. This workflow consistently enabled the identification of a distinct CD45+CD11b+Ly6G+Ly6Cmed population in both wild-type and 5xFAD mouse brains. Thus, rather than introducing the individual depletion, dissociation, or density-gradient techniques themselves, the present protocol extends and integrates these approaches for prolonged neutrophil manipulation and subsequent brain neutrophil analysis in an AD mouse model.
Materials and reagents
Biological materials
1. 5xFAD mice, B6.Cg-Tg(APPSwFlLon,PSEN1*M146L*L286V)6799Vas/Mmjax (The Jackson Laboratory, MMRRC Strain #034848-JAX), 4 months old, male and female
Reagents
1. Bovine serum albumin (BSA) (Sigma-Aldrich, catalog number: A7906)
2. Isoflurane (Piramal, catalog number: ISO-6)
3. Ophthalmic forceps (Med Vet International, catalog number: 50-307-2670)
4. 10× Phosphate-buffered saline (PBS) (Teknova, catalog number: P0195)
5. 10× Hank’s balanced salt solution (HBSS) (Gibco, catalog number: 14185052)
6. Gibco 1× HBSS, no calcium, no magnesium (Gibco, catalog number: 14170112)
7. InVivoPure pH 7.0 dilution buffer (Bioxcell, catalog number: IP0070)
8. RecombiMAb mouse IgG2a isotype control, unknown specificity (Bioxcell, catalog number: CP160)
9. RecombiMAb anti-mouse Ly6G (Bioxcell, catalog number: CP129)
10. BD Pharm LyseTM lysing buffer (BD Pharmingen, catalog number: 555899)
11. Percoll centrifugation media (Cytiva, catalog number: 17089102)
12. Anti-mouse CD16/CD32 (mouse BD Fc block) (BD Pharmingen, catalog number: 553141)
13. UltraComp eBeadsTM Plus compensation beads (Invitrogen, catalog number: 01-3333-42)
14. SYTOX blue nucleic acid stain (Invitrogen, catalog number: S11348)
15. Invitrogen™ EDTA (0.5 M), pH 8.0, RNase-free (Invitrogen, catalog number: AM9260G)
16. Antibodies (Tables 1 and 2)
Table 1. Antibody panel used for evaluating neutrophil depletion
| Antibody | Clone | Fluorophore | Company | Catalog number | Dilution |
|---|---|---|---|---|---|
| CD45 | QA17A26 | FITC | BioLegend | 157608 | 1:100 |
| CD170 (Siglec-F) | S17007L | PE/Cyanine7 | BioLegend | 155527 | 1:100 |
| CD115 (CSF-1R) | AFS98 | PE | BioLegend | 135505 | 1:100 |
| Ly6G/Ly6C (Gr-1) | RB6-8C5 | APC | BioLegend | 108411 | 1:100 |
| CD11b | M1/70 | APC/Cyanine7 | BioLegend | 101225 | 1:100 |
Table 2. Antibody panel used for brain-infiltrating neutrophils
| Antibody | Clone | Fluorophore | Company | Catalog number | Dilution |
| CD45 | QA17A26 | FITC | BioLegend | 157608 | 1:100 |
| Ly6G | 1A8 | APC | BioLegend | 127613 | 1:100 |
| Ly6C | HK1.4 | PE/Dazzle 594 | BioLegend | 128043 | 1:100 |
| CD11b | M1/70 | APC/Cyanine7 | BioLegend | 101225 | 1:100 |
Solutions
1. 1× PBS (see Recipes)
2. Flow buffer (see Recipes)
3. Isotonic Percoll (see Recipes)
4. 80% Percoll (see Recipes)
5. 40% Percoll (see Recipes)
Recipes
1. 1× PBS
| Reagent | Quantity or volume |
|---|---|
| Milli-Q water | 900 mL |
| 10× PBS | 100 mL |
| Total | 1 L |
Note: The 1× PBS used for mouse perfusion is stored at 4 °C for up to 6 months.
2. Flow buffer
| Reagent | Final concentration | Quantity or volume |
|---|---|---|
| BSA | 0.5% | 2.5 g |
| 1× PBS | n/a | 500 mL |
| Total | 500 mL |
Note: The flow buffer is stored at 4 °C for up to 3 months.
3. Isotonic Percoll
| Reagent | Quantity or volume |
|---|---|
| Percoll | 49.5 mL |
| 10× HBSS | 5.5 mL |
| Total | 55 mL |
Note: Isotonic Percoll should be freshly prepared.
4. 80% Percoll
| Reagent | Quantity or volume |
|---|---|
| Isotonic Percoll | 30 mL |
| 1× HBSS | 7.5 mL |
| Total | 37.5 mL |
Note: 80% Percoll should be freshly prepared.
5. 40% Percoll
| Reagent | Quantity or volume |
|---|---|
| Isotonic Percoll | 24 mL |
| 1× HBSS | 36 mL |
| Total | 60 mL |
Note: 40% Percoll should be freshly prepared.
Laboratory supplies
1. 1.5 mL tubes (Eppendorf, catalog number: 05-402-25)
2. 6-well plates (Fisherbrand, catalog number: FB012927)
3. 70 μm mesh (Falcon, catalog number: 352350)
4. 15 mL centrifuge tube (Fisherbrand, catalog number: 07-200-886)
5. Surflo winged infusion set (Terumo, catalog number: SV-25BLK)
6. 60 mL syringe (Axiom, catalog number: MK-1235525)
Equipment
1. Legato syringe pumps (KD Scientific, model: Legato270)
2. Attune NxT Flow Cytometer (Thermo Fisher, model: Attune NxT)
Software and datasets
1. Prism v9.3 (GraphPad, 11/15/2021)
2. FlowJoTM v10.8 Software (BD Life Sciences, 2023)
Procedure
Part I. Neutrophil depletion
A. Intraperitoneal (i.p.) injection of anti-Ly6G
1. Restrain the mouse with your non-dominant hand. Hold the mouse with its head slightly lower than its abdomen.
2. Identify the injection region, which is the lower right quadrant of the abdomen, to reduce the chance of damaging the abdominal organs.
Note: If multiple injections are required on the same mouse, it is acceptable to alternate between the right and left sides of the lower abdomen.
3. Swab the injection site with an alcohol pad to sanitize.
4. Insert the needle at a 30–40° angle into the injection region.
5. Pull back on the plunger to ensure negative pressure and that no liquid is aspirated into the syringe. Do not move the needle further in or out of the abdomen when pulling back on the plunger or injection.
a. If any liquid is aspirated, withdraw the needle and monitor the mouse for 5–10 min before re-attempting the injection. If the animal appears fine, attempt again and adjust the injection and angle slightly. Monitor the animal again for 5–10 min after the second injection.
b. If no liquid is aspirated, you can proceed to inject the reagent.
6. Push the plunger to inject 100 μL of anti-Ly6G solution. The needle should always stay in position during injections.
Notes:
1. Administer anti-Ly6G antibody by i.p. injection every other day.
2. The dose may be increased from 100 to 200 μg per mouse in the later stage because depletion efficiency may decrease after week 3. Increase the dose to 200 μg if depletion efficiency drops and maintain circulating neutrophils at <1% of CD45+ leukocytes.
3. We maintained neutrophil depletion for up to 6 weeks, with sustained depletion efficiency throughout the treatment period (see Validation).
B. Submandibular blood collection and flow cytometry analysis
1. Coat 1.5 mL tubes with EDTA.
a. Add 500–800 μL of 0.5 M EDTA (pH 7.3–7.4) to 1.5 mL tubes.
b. Vortex at maximum speed for 5–10 s.
c. Aspirate the 0.5 M EDTA.
d. Add 7.5 μL of new 0.5 M EDTA for each 1.5 mL tube.
Note: 7.5 μL of 0.5 M EDTA is sufficient for 50 μL of blood (final EDTA concentration of ~50 mM). It is important to maintain a consistent EDTA concentration of ~50 mM across samples. If a larger volume of blood is collected, adjust the volume of 0.5 M EDTA proportionally.
2. Poke the blood collection lancet into the submandibular vein swiftly.
3. Collect 2–3 drops (50–75 μL) of blood.
Note: Empirically, 50 μL of blood yields at least 50,000 singlet events, which is sufficient for evaluating the cell populations.
4. Flick the tubes briefly to mix blood with EDTA in the tube.
5. Store the blood on ice before red blood cell lysis.
Notes:
1. CD115 undergoes internalization over time. It is recommended to proceed with the following steps within 1 h of blood collection and to keep the sample on ice at all times.
2. Collect peripheral blood every other week before the scheduled anti-Ly6G injection to evaluate neutrophil depletion efficiency by flow cytometry.
C. Antibody staining
1. Add 1 mL of BD Pharm LyseTM lysing buffer and incubate at room temperature for 5 min to lyse red blood cells.
2. Centrifuge at 300× g for 5 min to collect pellets.
3. Wash with flow buffer and repeat centrifugation.
Note: Successful red blood cell lysis should result in a small and pale pellet with minimal visible red coloration (Figure 1A). If the pellet remains distinctly red (Figure 1B), indicating substantial red blood cell contamination, repeat steps C1–3 again.
Figure 1. Representative examples of acceptable and inadequate red blood cell lysis. (A) Acceptable red blood cell lysis. (B) Inadequate red blood cell lysis.
4. Remove the supernatant after centrifugation.
5. Antibody staining with antibody master mix (see Table 1):
a. Prepare antibody master mix for the samples. Use each antibody at 1:100 final dilution (0.5 μL in 50 μL of staining buffer per sample).
b. Add 50 μL of the antibody master mix to each sample and resuspend.
6. Prepare a single-color compensation control using one drop of compensation beads mixed with 1 μL of each antibody.
7. Incubate at 4 °C for 30 min, protected from light, for both cells and compensation beads.
Notes:
1. The antibody panel used for neutrophil depletion is as follows: CD45-FITC, CD115-PE, Siglec-F-PE/Cy7, GR-1-APC, and CD11b-APC-Cy7 (see Table 1).
2. The fluorescence minus one (FMO) controls for each antibody were also prepared for negative gating.
8. Wash the cells twice with at least 800 μL of flow buffer.
9. Resuspend the cells in flow buffer containing SYTOX blue viability dye at a 1:2,500 final dilution.
10. Flow cytometry analysis:
a. Run unstained control and stained samples to adjust flow cytometer voltages for each channel. Make sure the signals are within scale.
b. Run the compensation beads to set up the compensation matrix.
c. Run samples based on the gating strategy in section D (Data analysis).
D. Data analysis
Gating strategy and identification of immune cells
1. Selecting singlets and excluding doublets (Figure 2A): Use an FSC-H vs. FSC-A density plot to exclude doublets.
Note: An SSC-H vs. SSC-A plot can also be used to exclude doublets.
2. Selecting live cells (Figure 2B): Use a viability dye and exclude viability dye-positive cells to retain only live cells.
3. Identifying leukocytes (Figure 2C): Select CD45+ cells to identify the total leukocyte population.
4. Excluding eosinophils and monocytes (Figure 2D and E): Exclude Siglec-F+ eosinophils and CD115+ monocytes from the CD45+ population.
5. Identifying granulocytes (Figure 2F): Identify the remaining granulocyte population based on FSC/SSC characteristics.
6. Identifying neutrophils (Figure 2G): Confirm neutrophils as GR-1+CD11b+ cells within the granulocyte gate.
7. Calculating neutrophil depletion efficiency: Determine depletion efficiency by quantifying the percentage of GR-1+CD11b+ neutrophils relative to the total CD45+ leukocyte population. This value is used to assess neutrophil depletion efficiency.
Note: Flow cytometry data were acquired in .fcs files and analyzed by FlowJo.
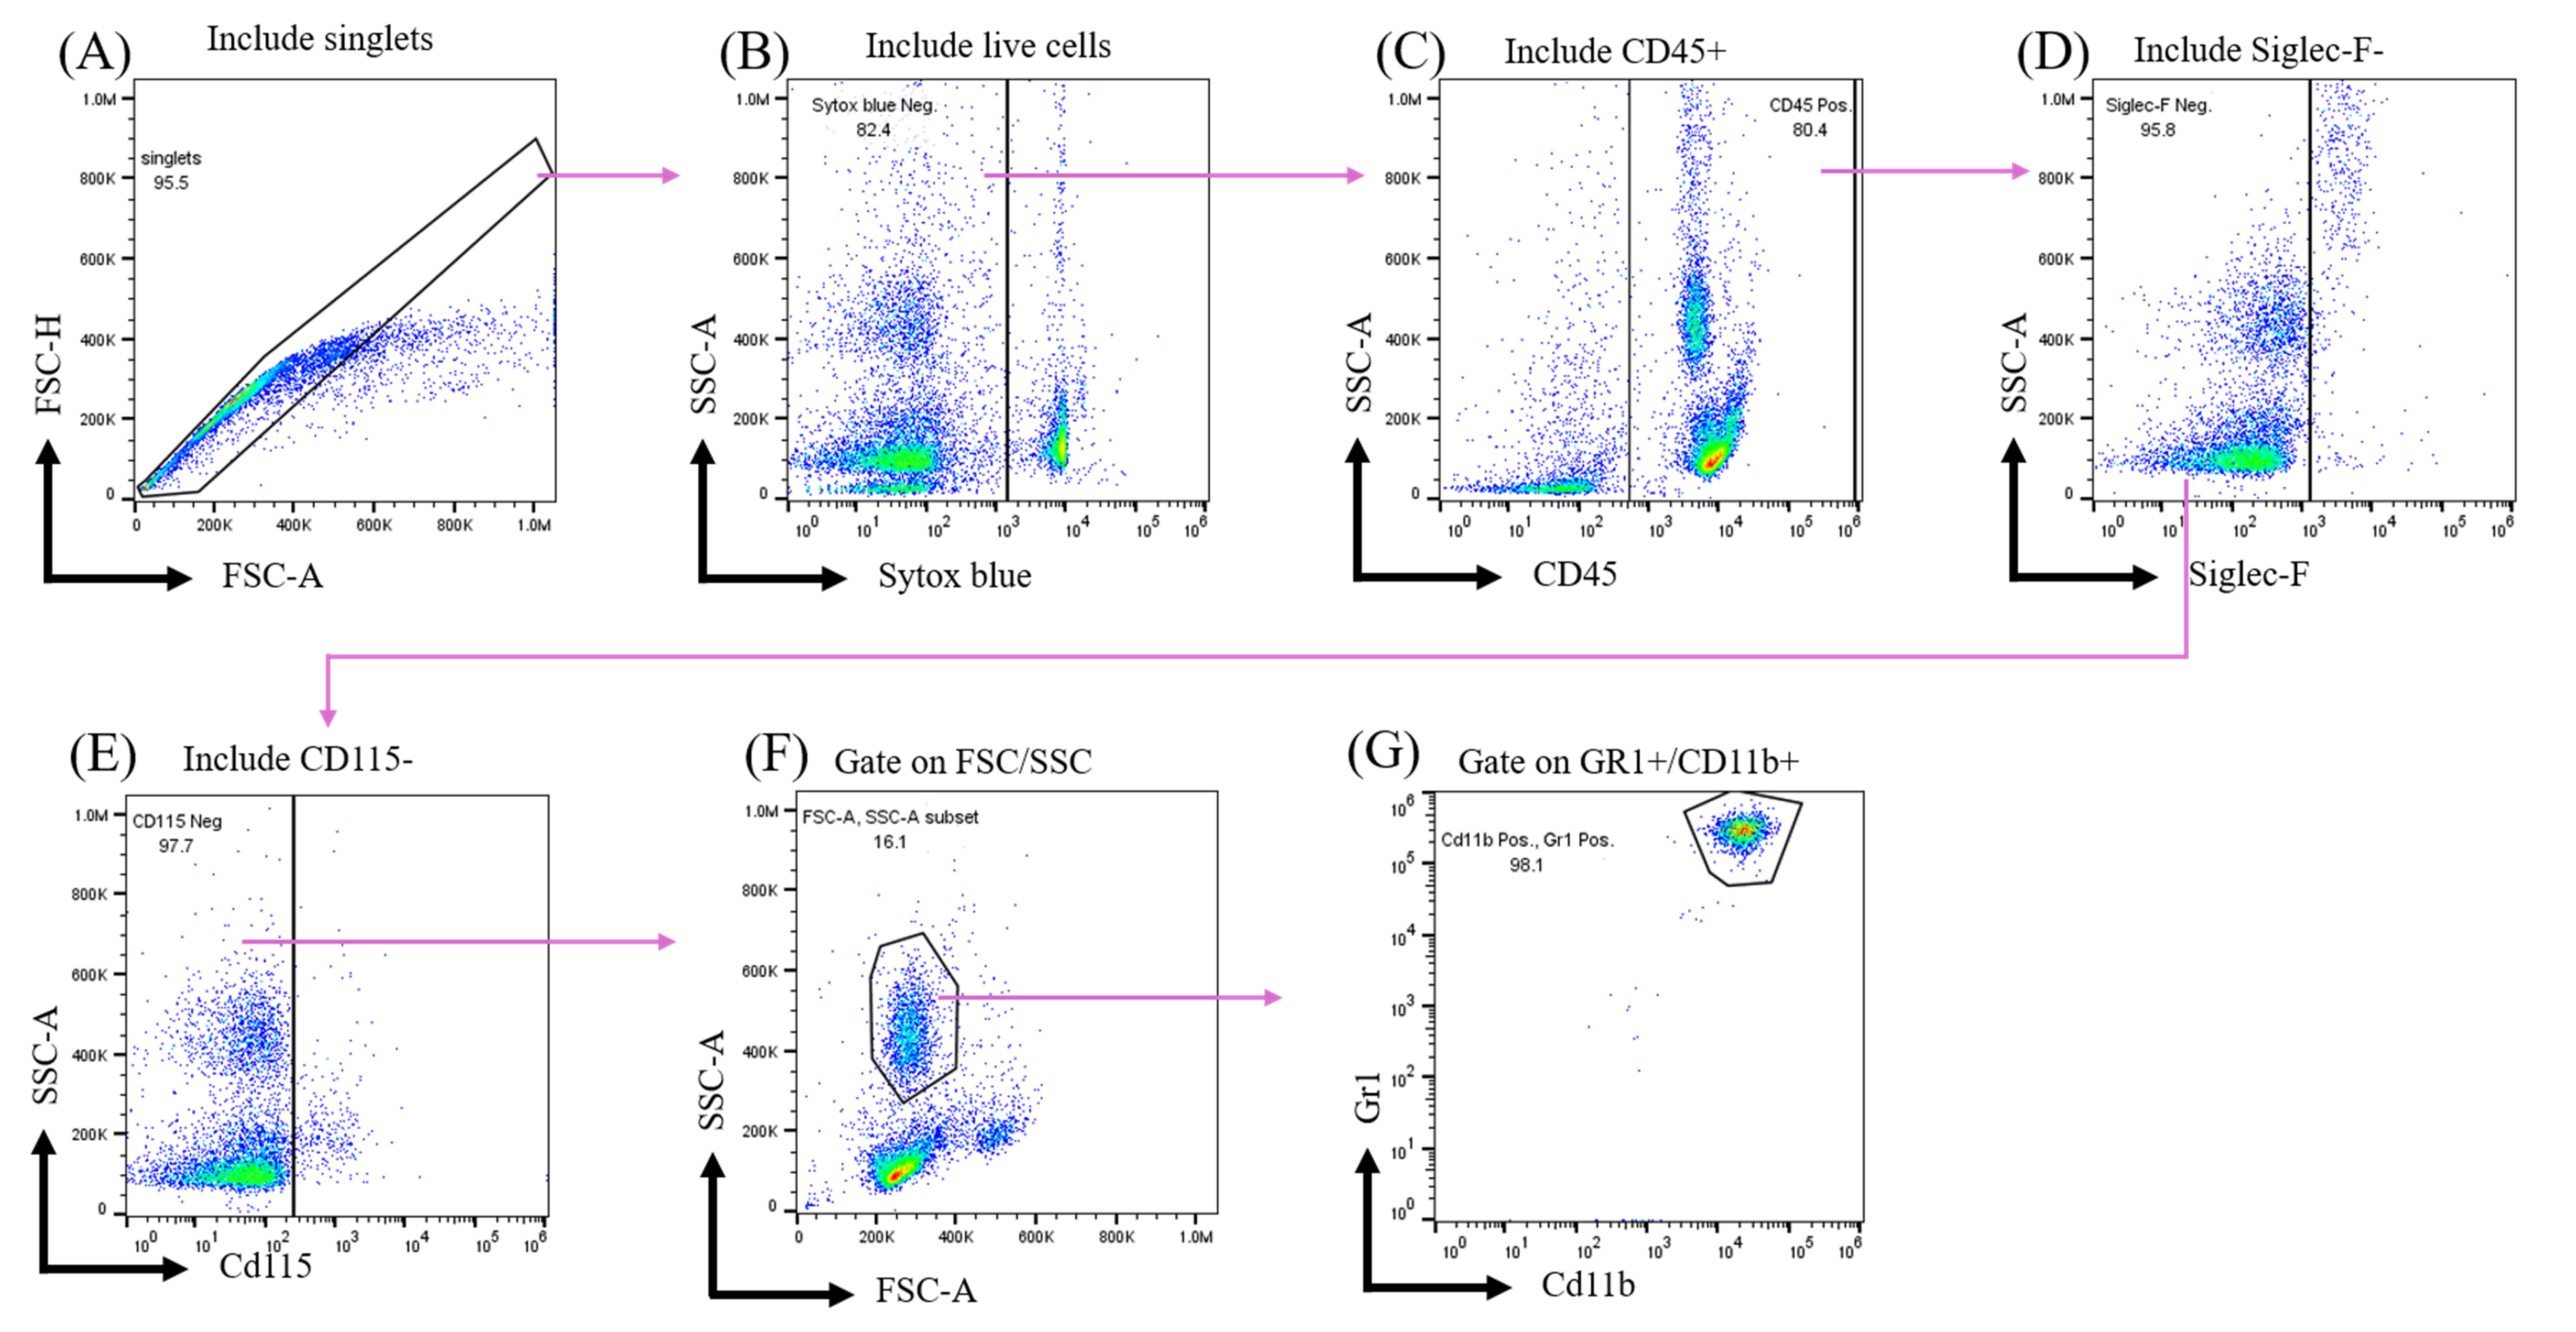
Figure 2. Flow cytometric analysis of blood neutrophils. Cell populations are analyzed using the following gating strategy: (A) Singlets are selected first. (B) Dead cells are excluded by a dead cell dye, SYTOX Blue. (C) CD45+ leukocytes are then selected, and (D, E) Siglec-F-CD115- cells are gated. (F) Based on FSC/SSC characteristics, the granulocyte population is identified, and (G) neutrophils are defined as GR-1+CD11b+ cells.
Part II. Brain-infiltrating neutrophil analysis by flow cytometry
A. Transcardiac perfusion
1. Incubate the mouse with isoflurane vapor in a 500 mL beaker covered with tin foil.
2. Once the mouse has stopped breathing (no visible chest movement), remove it from the chamber and secure it on the surgery board.
3. Grip the xiphoid with ophthalmic forceps and make a lateral incision with surgical scissors. The incision should be below the diaphragm.
4. Make a lateral cut through the diaphragm and cut open both sides of the rib cage. You should see that the heart is still beating.
5. Open the chest by gripping the xiphoid. Use a needle to secure the xiphoid on the surgery board.
6. Start the syringe pump and cut the right atrium to make a blood outlet.
7. Immediately insert the perfusion needle into the left ventricle.
8. Perfuse the mouse transcardially with ice-cold 1× PBS until the liver is cleared of blood and becomes pale in color.
a. Deliver approximately 50–60 mL of cold 1× PBS at a flow rate of 10 mL/min using a syringe pump.
Notes:
1. A flow rate of 10–12 mL/min and a total volume of 50–60 mL of cold PBS can be used.
2. Confirm that the liver has turned pale before stopping the perfusion. Incomplete perfusion will leave peripheral leukocytes in the brain vasculature, increasing the background in downstream flow cytometry analysis.
B. Brain collection
1. Cut the neck of the mouse to remove the mouse’s head from the body.
2. Trim off any residual muscle on the caudal side of the head.
3. Cut through the midline of the brain by inserting less than 1 mm of the fine scissors to make sure not to disrupt the brain parenchyma.
4. Cut all the way to the front of the eyes.
5. Cut two vertical lines right in front of the eyes.
6. Open the two halves of the skull from the top with fine forceps.
7. Use a spatula to scoop out the mouse brain (cerebrum and cerebellum) and transfer it into 1× HBSS on ice before further processing.
Note: It is recommended to process the brain samples within 1 h after this step to better preserve cell viability.
C. Brain homogenization
1. Homogenize the brain in 5 mL of 1× HBSS using a Dounce homogenizer. Use the loose pestle (pestle A) and apply slow and gentle strokes on ice.
Note: Homogenize slowly and gently. Excessive force or speed may reduce cell viability and yield. Approximately 30–40 strokes are needed until no large white (>0.1 mm) chunks remain in the homogenate.
2. After homogenization, the homogenate can be aspirated easily with P1000 pipette tips with no blockage by chunks.
D. Percoll density gradient separation
1. Place a 70-μm nylon mesh cell strainer into the wells of a 6-well plate.
2. Transfer the homogenate and filter it through the cell strainer to remove debris and undissociated tissue.
3. Centrifuge at 4 °C to pellet cells and remove supernatant.
4. Resuspend pellets in 8 mL of 40% Percoll.
5. Add 5 mL of 80% Percoll to a clean 15-mL tube first.
6. Carefully layer the 8 mL of 40% Percoll cell suspension on top of 5 mL of 80% Percoll.
Note: To layer 40% Percoll over 80% Percoll to form a gradient, use a wide-bore pipette to load the solution gently to avoid disturbing the interface.
7. Centrifuge at 325× g for 30 min at room temperature with acceleration set to the lowest and no brake.
Note: Do not use the centrifuge brake. Abrupt deceleration disrupts the Percoll interface, reducing cell recovery. Room temperature can maintain the Percoll gradient. The total centrifuging time may be 50–60 min, depending on the centrifuge.
8. After centrifugation, a white buffy layer appears between the 40%/80% Percoll. Collect the cells at the 40%/80% Percoll interface with a glass Pasteur pipette.
Notes:
1. Aspirate the buffy interface directly; no need to remove the upper layer first.
2. Collect no more than 2 mL of cell suspension from the interface.
E. Antibody staining and flow cytometry analysis
1. Add 10 times the volume of 1× PBS to wash the collected cells.
2. Invert the tubes 3–5 times to mix.
3. Centrifuge at 300× g for 5 min.
4. Fc receptor blocking:
a. Use Fc blocker at a ratio of 2 μL stock:100 μL staining buffer.
b. Resuspend cells in 40 μL of the Fc block mix and incubate at 4 °C for 10 min.
5. Antibody staining with antibody master mix (see Table 2):
a. Use each antibody at a 1:100 final dilution (0.5 μL in 10 μL of staining buffer per sample).
b. Add 10 μL of the antibody master mix to each sample already containing Fc blockers and mix gently.
Note: Fc blocker does not need to be removed before antibody staining.
c. Prepare single-color compensation controls using one drop of compensation beads mixed with 1 μL of each antibody.
d. Incubate at 4 °C for 30 min, protected from light, for both cells and compensation beads.
Notes:
1. The antibody panel used in this protocol is CD45-FITC, Ly6G-APC, Ly6C-PE/Dazzle 594, and CD11b-APC/Cy7 (see Table 2).
2. The FMO controls for each antibody were also prepared for negative gating.
e. Wash the cells with at least 800 μL of flow buffer twice.
f. Resuspend the cells in flow buffer containing SYTOX blue viability dye at a 1:2,500 dilution.
6. Flow cytometry analysis:
a. Run unstained control and stained samples to adjust flow cytometer voltages for each channel. Make sure the signals are within scale.
b. Run the compensation beads to set up the compensation matrix.
c. Run samples based on the gating strategy in section F.
F. Data analysis
1. Excluding debris (Figure 3A): Use an FSC vs. SSC density plot to identify the cell population and exclude debris.
2. Selecting singlets (Figure 3B): Use a forward scatter height vs. forward scatter area (FSC-H vs. FSC-A) density plot to exclude doublets. A side scatter height vs. side scatter area (SSC-H vs. SSC-A) plot can also be used.
3. Selecting live cells (Figure 3C): Use a viability dye and exclude viability dye-positive cells (dead cells) to retain only live cells.
4. Identifying leukocytes (Figure 3D): Select CD45+ cells to identify the total leukocyte population.
5. Identifying myeloid cells (Figure 3E): Gate on CD11b+ cells within the CD45+ leukocyte population.
6. Identifying neutrophils (Figure 3F): Identify neutrophils as Ly6CmedLy6G+ cells within the CD45+CD11b+ myeloid cell population.
7. Quantifying brain neutrophils: Determine the percentage of CD45+CD11b+Ly6CmedLy6G+ neutrophils relative to the total CD45+ leukocyte population.
Note: Flow cytometry data were acquired in .fcs files and analyzed by FlowJo.
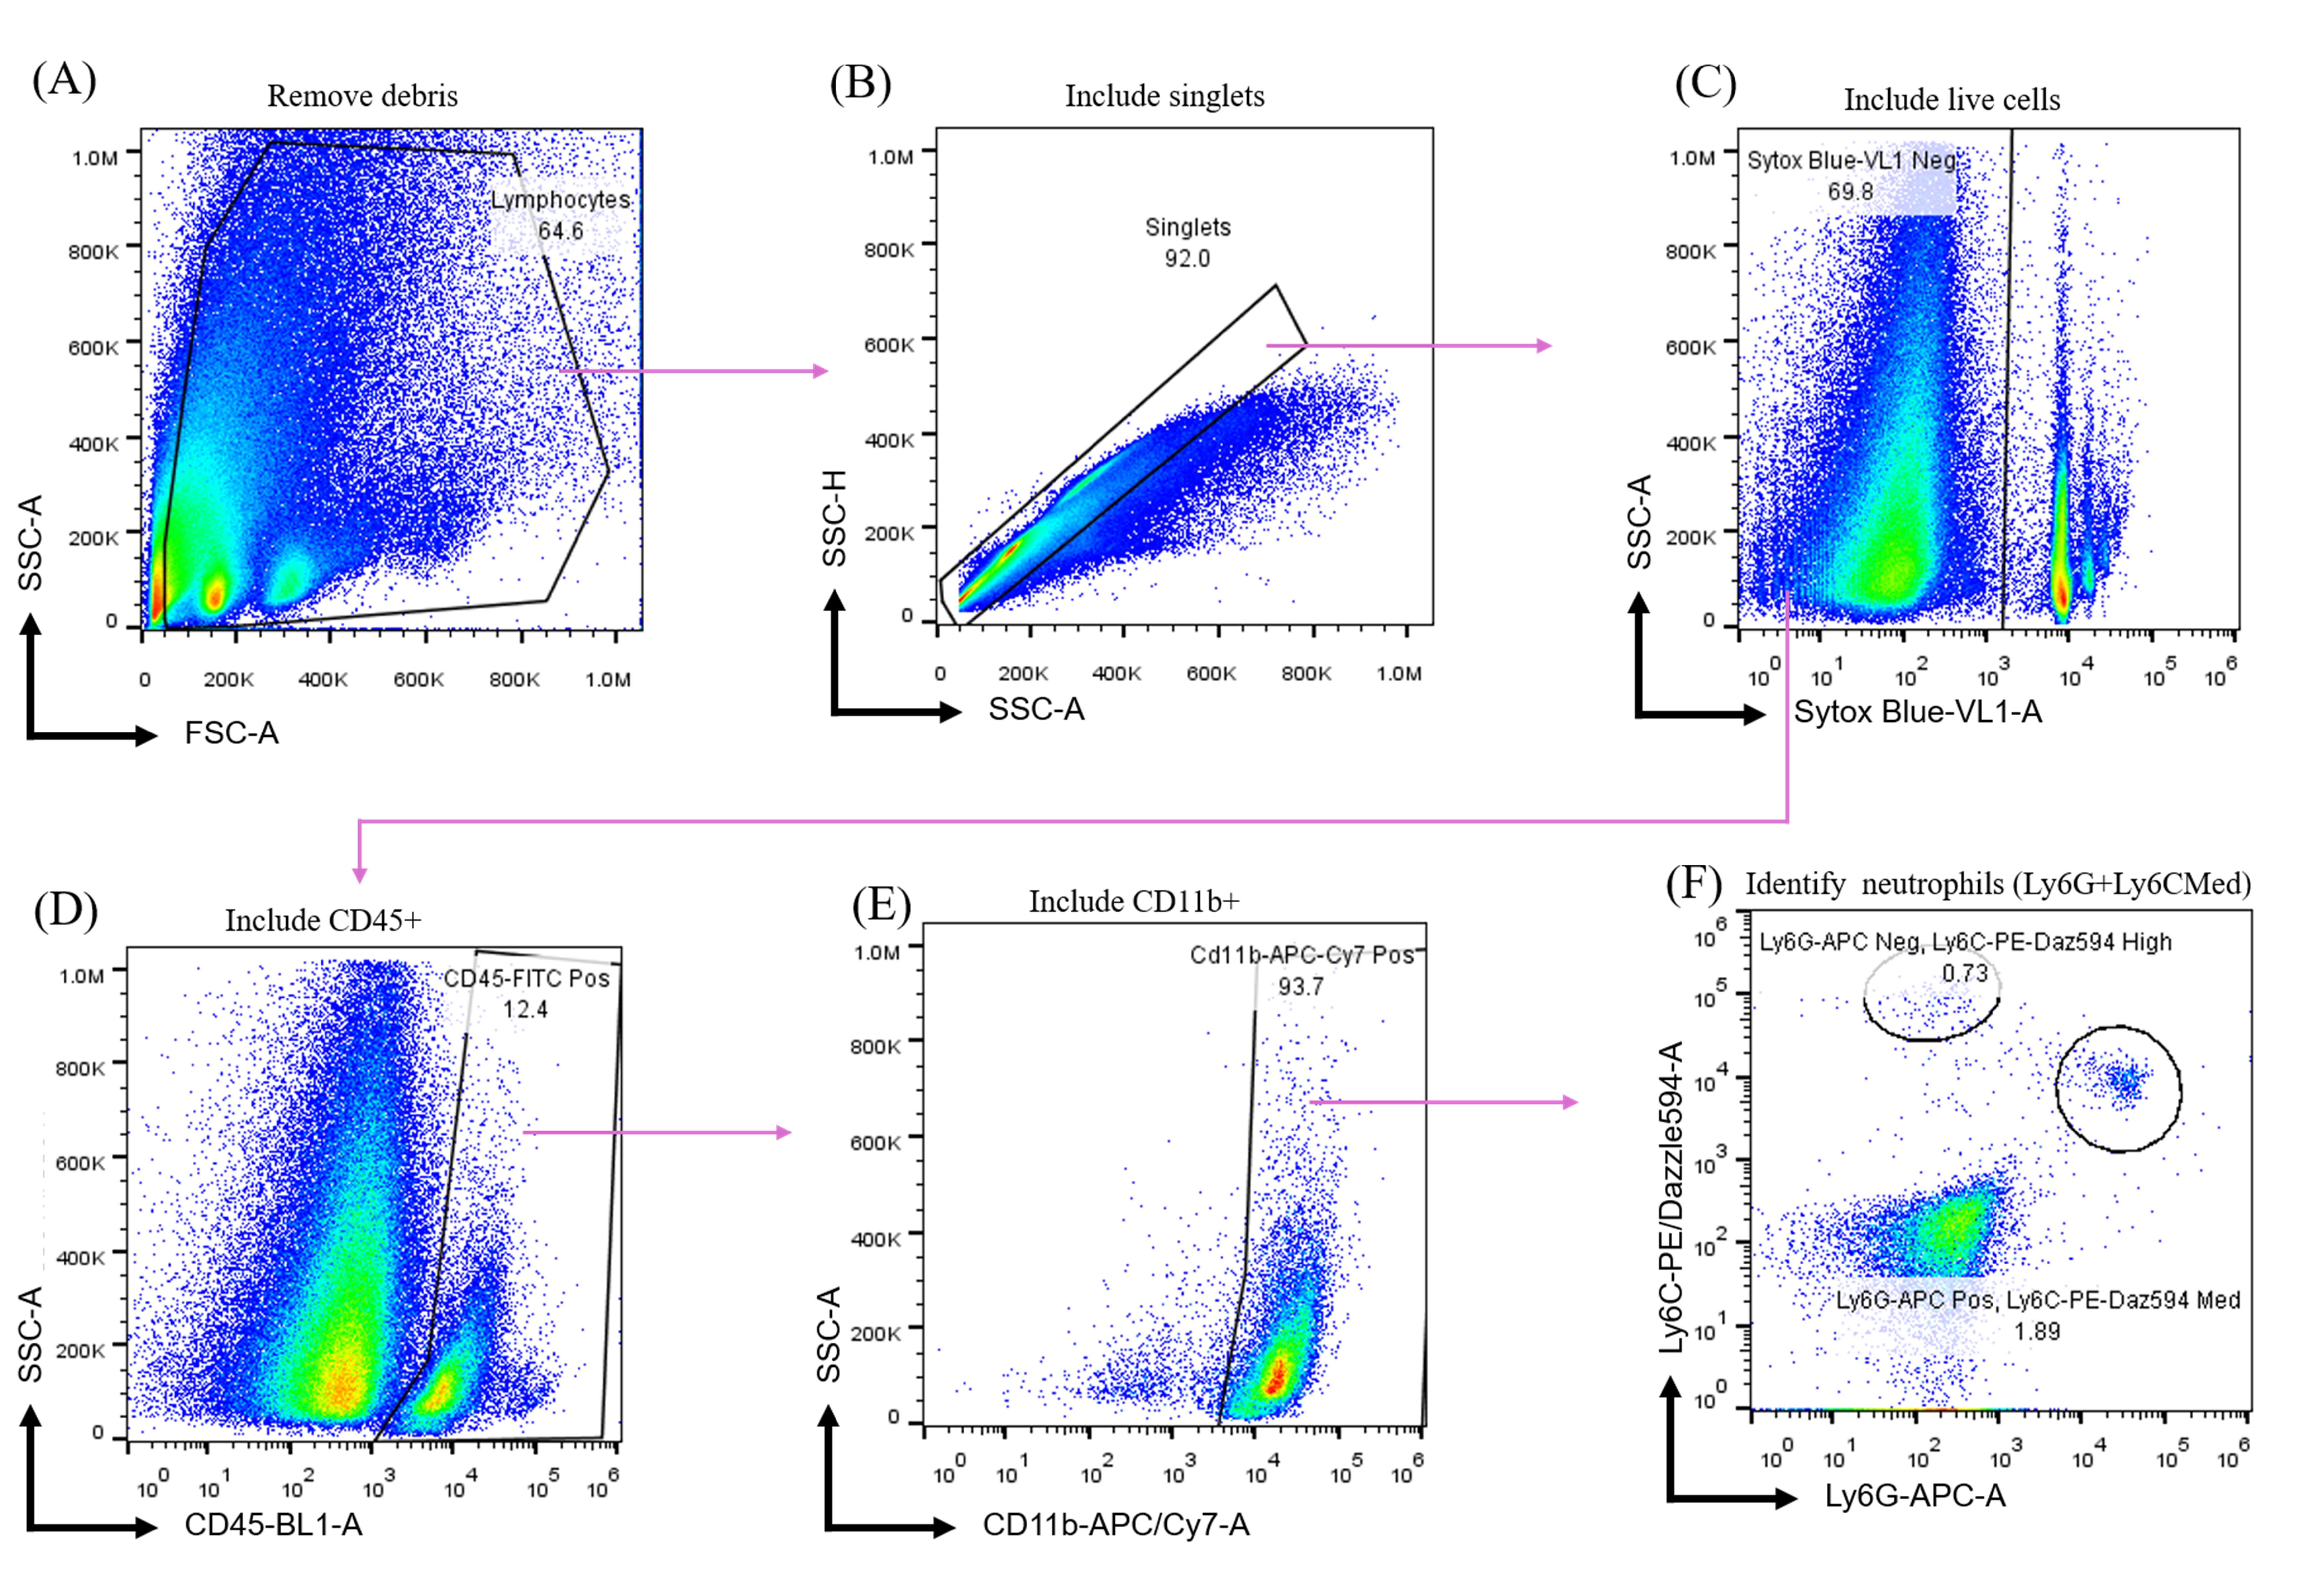
Figure 3. Flow cytometry analysis of neutrophils. Cell populations are analyzed using the following gating strategy: (A) Debris is first excluded based on forward- and side-scatter plots, (B) followed by singlet gating. (C) Live cells are then selected by excluding SYTOX Blue-positive cells. (D) Among live cells, CD45+ leukocytes are gated, (E) followed by CD11b+ myeloid cells. (F) Neutrophils are identified as Ly6G+ Ly6Cmed cells.
Validation of protocol
In our experience, successful preparations typically yielded over 70% SYTOX Blue-negative events (live cells) among total singlets during flow cytometric acquisition. Brain neutrophils represented approximately 0.3%–6% of CD45+ leukocytes, with a distinct Ly6G+ population among CD11b+. In our experiments, approximately 100–1,000 CD45+CD11b+Ly6G+Ly6Cmed neutrophil events were typically recovered per brain. Preparations with substantially fewer viable events, low viability, or no clearly distinguishable Ly6G+Ly6C^med population may indicate compromised tissue processing or Percoll separation.
To validate Part I (depletion of peripheral blood neutrophils), we separated mice into three groups: wild type injected with buffer, 5xFAD injected with isotype, and 5xFAD injected with anti-Ly6G. Each group contained at least three mice. Anti-Ly6G effectively depletes peripheral neutrophils compared to the isotype control and wild type (Figure 4A). Depletion was less effective at week 4 with 100 μg of anti-Ly6G per mouse, so we escalated the dose to 200 μg per mouse and successfully depleted neutrophils through week 6 (Figure 4B).
Figure 4. Depletion of peripheral neutrophils. (A) Representative plots of neutrophil depletion in wild-type or 5xFAD mice. The mice were intraperitoneally (i.p.) injected with buffer, isotype, or anti-Ly6G. (B) Quantitative data on neutrophil depletion efficiency. 3–4 mice were included in each group at each time point. Data are presented as mean ± SEM. Statistical comparisons were performed using two-way ANOVA followed by Dunnett’s multiple-comparisons test between the anti-Ly6G and isotype control groups at each time point. *P < 0.05, **P < 0.01, ***P < 0.001. The P-value for each time point is <0.0001 at week 1, 0.0111 at week 2, 0.0044 at week 3, and 0.0003 at week 6. Graphs were generated and statistical analysis was performed using GraphPad Prism.
For the validation of Part II (brain neutrophil analysis), a distinct CD45+CD11b+Ly6G+Ly6Cmed neutrophil population was consistently identified in both wild-type and 5xFAD mice of both sexes (Figure 5A). Quantitative analysis of the neutrophil population is presented in Figure 5B. The quantitative data are derived from four independent experiments with at least three mice of each sex and genotype of 4-month-old mice. To compare this protocol for neutrophil collection from the AD mouse brain with an alternative approach, we also evaluated a second method that employed enzyme dissociation and different Percoll concentrations. Two key conditions were modified: the brain dissociation method and the myeloid collection strategy. This alternative approach is commonly used in general tissue dissociation. First, enzymatic dissociation was used instead of mechanical homogenization on ice. Briefly, brains were perfused with PBS and minced into pieces (<1 mm). Tissue fragments were then incubated with 20 U/mL DNase I and 1 mg/mL collagenase IV in RPMI media supplemented with 10% FBS for 40 min at 37 °C. Second, to recover myeloid cells, the cell suspension was resuspended in 30% Percoll, layered onto 70% Percoll, and centrifuged at 1,300× g for 20 min. The buffy layer between 30% and 70% Percoll was collected. After washing, samples were stained with anti-mouse CD45, anti-mouse Ly6G-APC, and SYTOX Blue before flow cytometry analysis (Figure 5C). No distinct Ly6G+ population was observed in either wild-type or 5xFAD mice using this alternative approach (left/middle panel, Figure 5D). For reference, the Ly6G+ gating from mouse blood is shown as a positive control (right panel, Figure 5D). We did not investigate these two conditions separately (tissue dissociation condition and Percoll gradient). To minimize compromised cell viability caused by enzyme digestion and high temperature, tissues were gently homogenized on ice using a Dounce homogenizer. In this protocol, we propose a reliable neutrophil recovery approach to collect neutrophils from the AD mouse brain parenchyma. Due to the nature of this protocol, it is not limited to neurodegenerative disease. This recovery method may also be applied to other disease models.
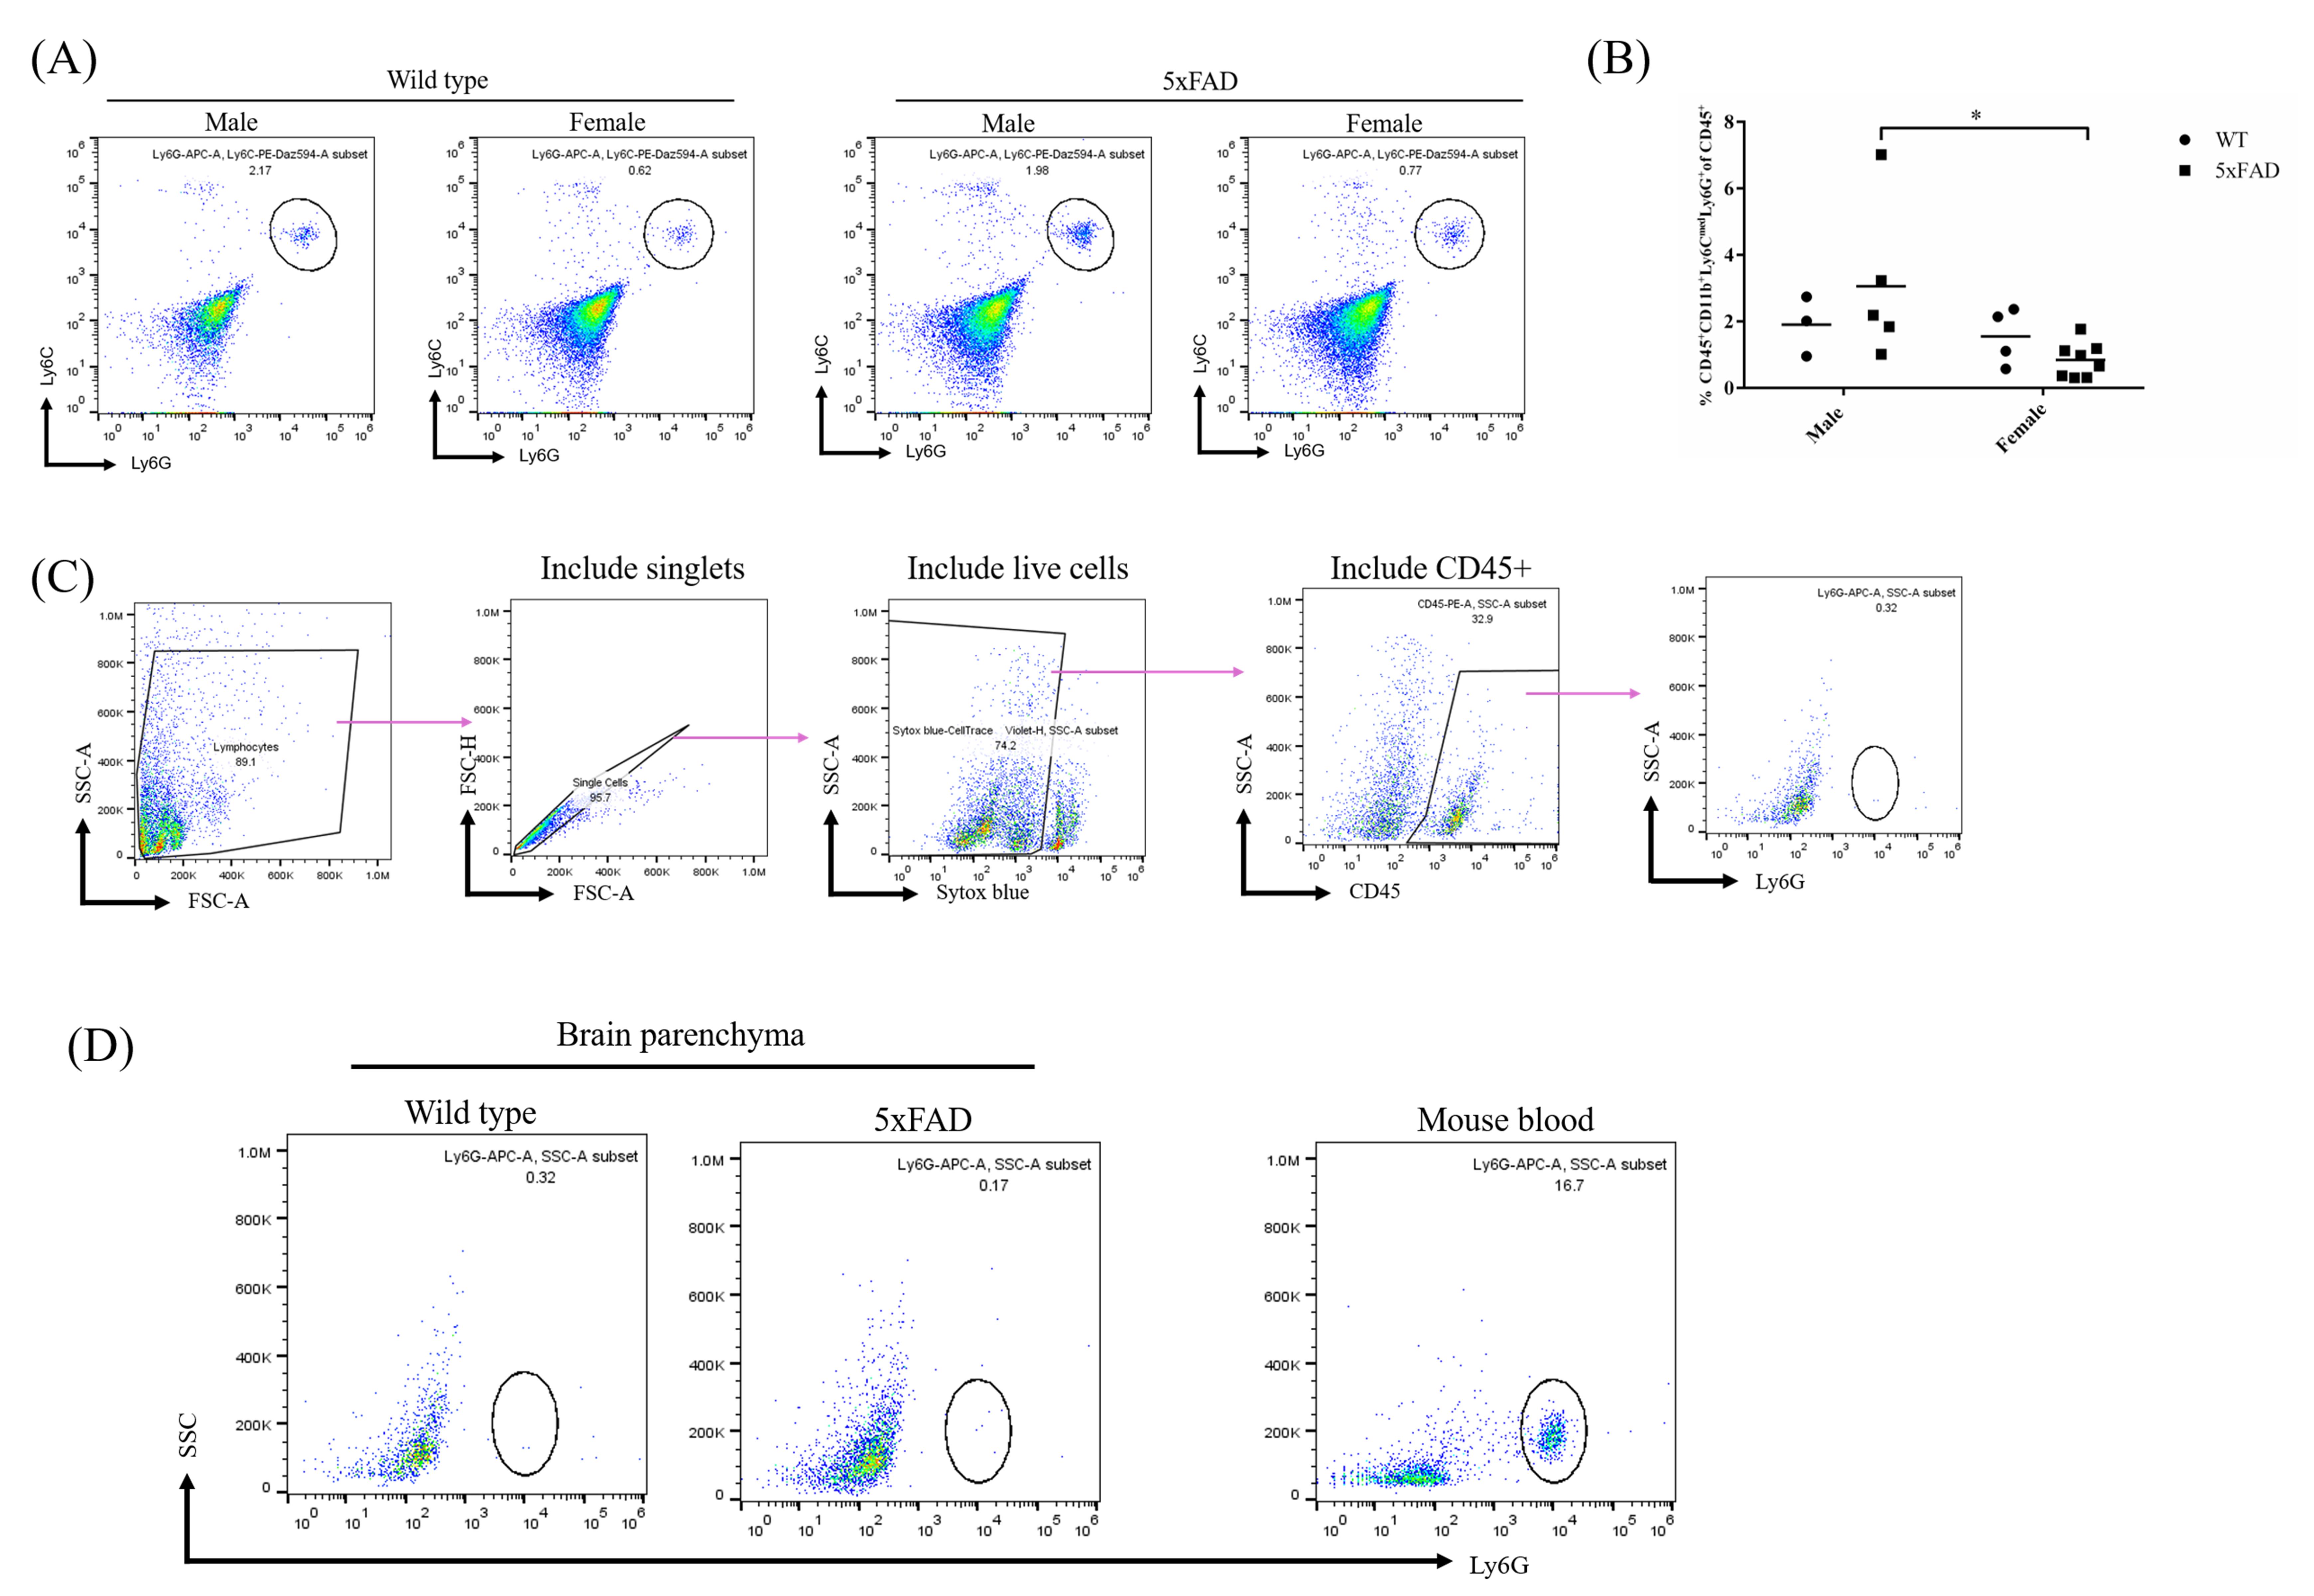
Figure 5. Neutrophil populations from the brains of wild-type or 5xFAD mice. (A) Representative flow cytometry plots of neutrophil populations from the mouse brain. (B) Quantitative data of neutrophil frequency in the brain parenchyma. The data are from four independent experiments. Each dot represents a biological repeat. Statistical comparisons were performed using a two-way ANOVA, followed by Sidak’s multiple-comparisons test. *P < 0.05, P = 0.0185. Graphs were generated and statistical analysis was performed using GraphPad Prism. (C) Gating strategy of a neutrophil population from the alternative approach. The cells are gated by excluding debris and including singlets, live cells. Then, CD45+ cells are included and examined for Ly6G+ expression. (D) Representative plots using the alternative method. Left panel: Ly6G+ population from the wild-type mouse brain. Middle panel: Ly6G+ population from the 5xFAD mouse brain. Right panel: Ly6G+ population from the mouse blood.
Limitations
Prolonged neutrophil depletion requires repeated antibody administration and monitoring. Maintenance of depletion may require dose adjustment over time. In addition, because brain-infiltrating neutrophils are relatively rare, their recovery may vary depending on factors such as perfusion efficiency, tissue dissociation, Percoll gradient preparation, and sample processing time. These factors may limit direct generalization of the protocol to other disease models, so appropriate validation should be performed when the workflow is adapted to different applications
General notes and troubleshooting
Troubleshooting
Problem 1: Low neutrophil depletion efficiency in peripheral blood after a few weeks.
Possible cause(s): Increased cell regeneration rate and insufficient antibody dose.
Solution(s): Inject more anti-Ly6G and monitor depletion efficiency two days later.
Problem 2: No visible buffy layer at the 40%/80% Percoll interface.
Possible cause(s): This may result from failure to layer the Percoll solutions properly or from applying the centrifuge brake during deceleration.
Solution(s): Check whether the interface is visible after layering with Percoll solution and make sure to set the acceleration and deceleration rates to the lowest setting.
Acknowledgments
This work is supported by NIH NIGMS (grant no. R35GM119787 to Q.D.) and NIH NCI (grant no. R37CA265926 and R01CA293514 to X.B.). We gratefully acknowledge the Purdue Drug Discovery Chemical Genomics Facility for providing access to the Attune NxT Flow Cytometer, which was used to generate data for this study. We gratefully acknowledge the staff of the Purdue University Laboratory Animal Program (LAP) for their excellent animal care and husbandry.
Author contributions
Protocol Development, H.H.; Protocol Optimization or Validation, H.H.; Writing—Original Draft, H.H.; Writing—Review & Editing, Q.D. and X.B.; Funding acquisition, Q.D. and X.B.; Supervision, Q.D. and X.B.
Competing interests
The authors declare no financial or non-financial competing interests.
Ethical considerations
All animal experiments were performed in accordance with institutional guidelines approved by the Purdue Animal Care and Use Committee (PACUC) under the protocol number IPROTO2207002283.
References
- Smyth, L. C. D., Murray, H. C., Hill, M., van Leeuwen, E., Highet, B., Magon, N. J., Osanlouy, M., Mathiesen, S. N., Mockett, B., Singh-Bains, M. K., et al. (2022). Neutrophil-vascular interactions drive myeloperoxidase accumulation in the brain in Alzheimer’s disease. Acta Neuropathol Commun. 10(1): e1186/s40478–022–01347–2. https://doi.org/10.1186/s40478-022-01347-2
- Zenaro, E., Pietronigro, E., Bianca, V. D., Piacentino, G., Marongiu, L., Budui, S., Turano, E., Rossi, B., Angiari, S., Dusi, S., et al. (2015). Neutrophils promote Alzheimer's disease–like pathology and cognitive decline via LFA-1 integrin. Nat Med. 21(8): 880–886. https://doi.org/10.1038/nm.3913
- Cruz Hernández, J. C., Bracko, O., Kersbergen, C. J., Muse, V., Haft-Javaherian, M., Berg, M., Park, L., Vinarcsik, L. K., Ivasyk, I., Rivera, D. A., et al. (2019). Neutrophil adhesion in brain capillaries reduces cortical blood flow and impairs memory function in Alzheimer’s disease mouse models. Nat Neurosci. 22(3): 413–420. https://doi.org/10.1038/s41593-018-0329-4
- Gong, H. H., Worley, M. J., Carver, K. A., Goldstein, D. R. and Deng, J. C. (2023). Neutrophils drive pulmonary vascular leakage in MHV-1 infection of susceptible A/J mice. Front Immunol. 13: e1089064. https://doi.org/10.3389/fimmu.2022.1089064
- Moynihan, K. D., Opel, C. F., Szeto, G. L., Tzeng, A., Zhu, E. F., Engreitz, J. M., Williams, R. T., Rakhra, K., Zhang, M. H., Rothschilds, A. M., et al. (2016). Eradication of large established tumors in mice by combination immunotherapy that engages innate and adaptive immune responses. Nat Med. 22(12): 1402–1410. https://doi.org/10.1038/nm.4200
- Boivin, G., Faget, J., Ancey, P. B., Gkasti, A., Mussard, J., Engblom, C., Pfirschke, C., Contat, C., Pascual, J., Vazquez, J., et al. (2020). Durable and controlled depletion of neutrophils in mice. Nat Commun. 11(1): e1038/s41467–020–16596–9. https://doi.org/10.1038/s41467-020-16596-9
- Olofsen, P. A., Stip, M. C., Jansen, J. H. M., Chan, C., Nederend, M., Tieland, R. G., Tsioumpekou, M. and Leusen, J. H. W. (2022). Effective, Long-Term, Neutrophil Depletion Using a Murinized Anti-Ly-6G 1A8 Antibody. Cells. 11(21): 3406. https://doi.org/10.3390/cells11213406
- Aries, M. L. and Hensley-McBain, T. (2023). Neutrophils as a potential therapeutic target in Alzheimer’s disease. Front Immunol. 14: e1123149. https://doi.org/10.3389/fimmu.2023.1123149
- Chang, Y. G., Lin, H. C., Chang, C. P., Lai, H. L., Chen, H. M., Huang, H., Chang, P. R., Wu, C. W., Ho, C. J., Chu, T., et al. (2025). Equilibrative nucleoside transporter 2 modulates inosine catabolism to influence astrocyte metabolism and reactivity. Cell Rep. 44(10): 116420. https://doi.org/10.1016/j.celrep.2025.116420
- Liu, Z., Gu, Y., Shin, A., Zhang, S. and Ginhoux, F. (2020). Analysis of Myeloid Cells in Mouse Tissues with Flow Cytometry. STAR Protoc. 1(1): 100029. https://doi.org/10.1016/j.xpro.2020.100029
- Dang, M. T., Mafra, F. and Haldar, M. (2021). Isolation of myeloid cells from mouse brain tumors for single-cell RNA-seq analysis. STAR Protoc. 2(4): 100957. https://doi.org/10.1016/j.xpro.2021.100957
Article Information
Publication history
Received: Jul 28, 2026
Accepted: Oct 2, 2026
Available online: Oct 21, 2026
Published: Nov 5, 2026
Copyright
© 2026 The Author(s); This is an open access article under the CC BY-NC license (https://creativecommons.org/licenses/by-nc/4.0/).
How to cite
Huang, H., Bao, X. and Deng, Q. (2026). Long-Term Neutrophil Depletion and Flow Cytometric Analysis of Brain Neutrophils in the 5xFAD Mouse Model. Bio-protocol 16(21): e5864. DOI: 10.21769/BioProtoc.5864.

 Download Citation in RIS Format
Do you have any questions about this protocol?
Post your question to gather feedback from the community. We will also invite the authors of this article to respond.
 Post a Question


