


- Protocols

- Articles and Issues
- For Authors
- About
- Become a Reviewer


Preparation of Phosphoinositide-Containing Supported Lipid Bilayers and Quantitative Assessment of Protein Recruitment to Membrane Surfaces

Published: Vol 16, Iss 20, Oct 20, 2026 DOI: 10.21769/BioProtoc.5853 Views: 33
Reviewed by: Devika AndhareSrajan KapoorGundeep Kaur
 PDF
PDF  Ask a question

Protocol Collections
Comprehensive collections of detailed, peer-reviewed protocols focusing on specific topics




Abstract
Small GTPases and many other peripheral membrane proteins regulate essential cellular processes through dynamic interactions with cellular membranes. These interactions are often controlled by membrane composition, particularly phosphoinositides (PIPs), which modulate the recruitment of GTPases, their regulators, and their effectors. Quantitative characterization of protein recruitment to defined membrane environments remains technically challenging. Here, we describe a protocol for preparing supported lipid bilayers (SLBs) containing defined phosphoinositide compositions in polydimethylsiloxane (PDMS) chambers and monitoring protein recruitment by total internal reflection fluorescence (TIRF) microscopy. Purified fluorescently labeled proteins are incubated with SLBs to measure membrane association in real time under controlled biochemical conditions. The method enables quantitative analysis of membrane recruitment kinetics and comparison of protein binding across different lipid compositions or in the presence of partner proteins. Combining the biochemical precision of a reconstituted membrane system with the sensitivity of TIRF imaging, this protocol provides a robust and versatile platform for studying lipid-dependent membrane recruitment. Although developed to investigate small GTPase signaling, it is readily applicable to a wide range of peripheral membrane proteins and membrane-associated signaling mechanisms.
Key features
• Reconstitutes small GTPase membrane recruitment on PIP-containing supported lipid bilayers compatible with TIRF microscopy.
• Enables quantitative comparison of lipid-dependent binding across defined membrane compositions, including phosphoinositide species, phosphatidylserine content, and additional membrane components.
• Suitable for purified small GTPases, GEFs, GAPs, and effectors, allowing direct testing of multicomponent membrane recruitment under controlled biochemical conditions.
• Can be adapted for steady-state measurements, recruitment kinetics, and protein competition assays to dissect any membrane-dependent signaling mechanism.
Keywords: Supported lipid bilayers Phosphoinositides
Small GTPases
TIRF microscopy
Membrane binding
Phosphoinositides
Small GTPases
TIRF microscopy
Membrane binding
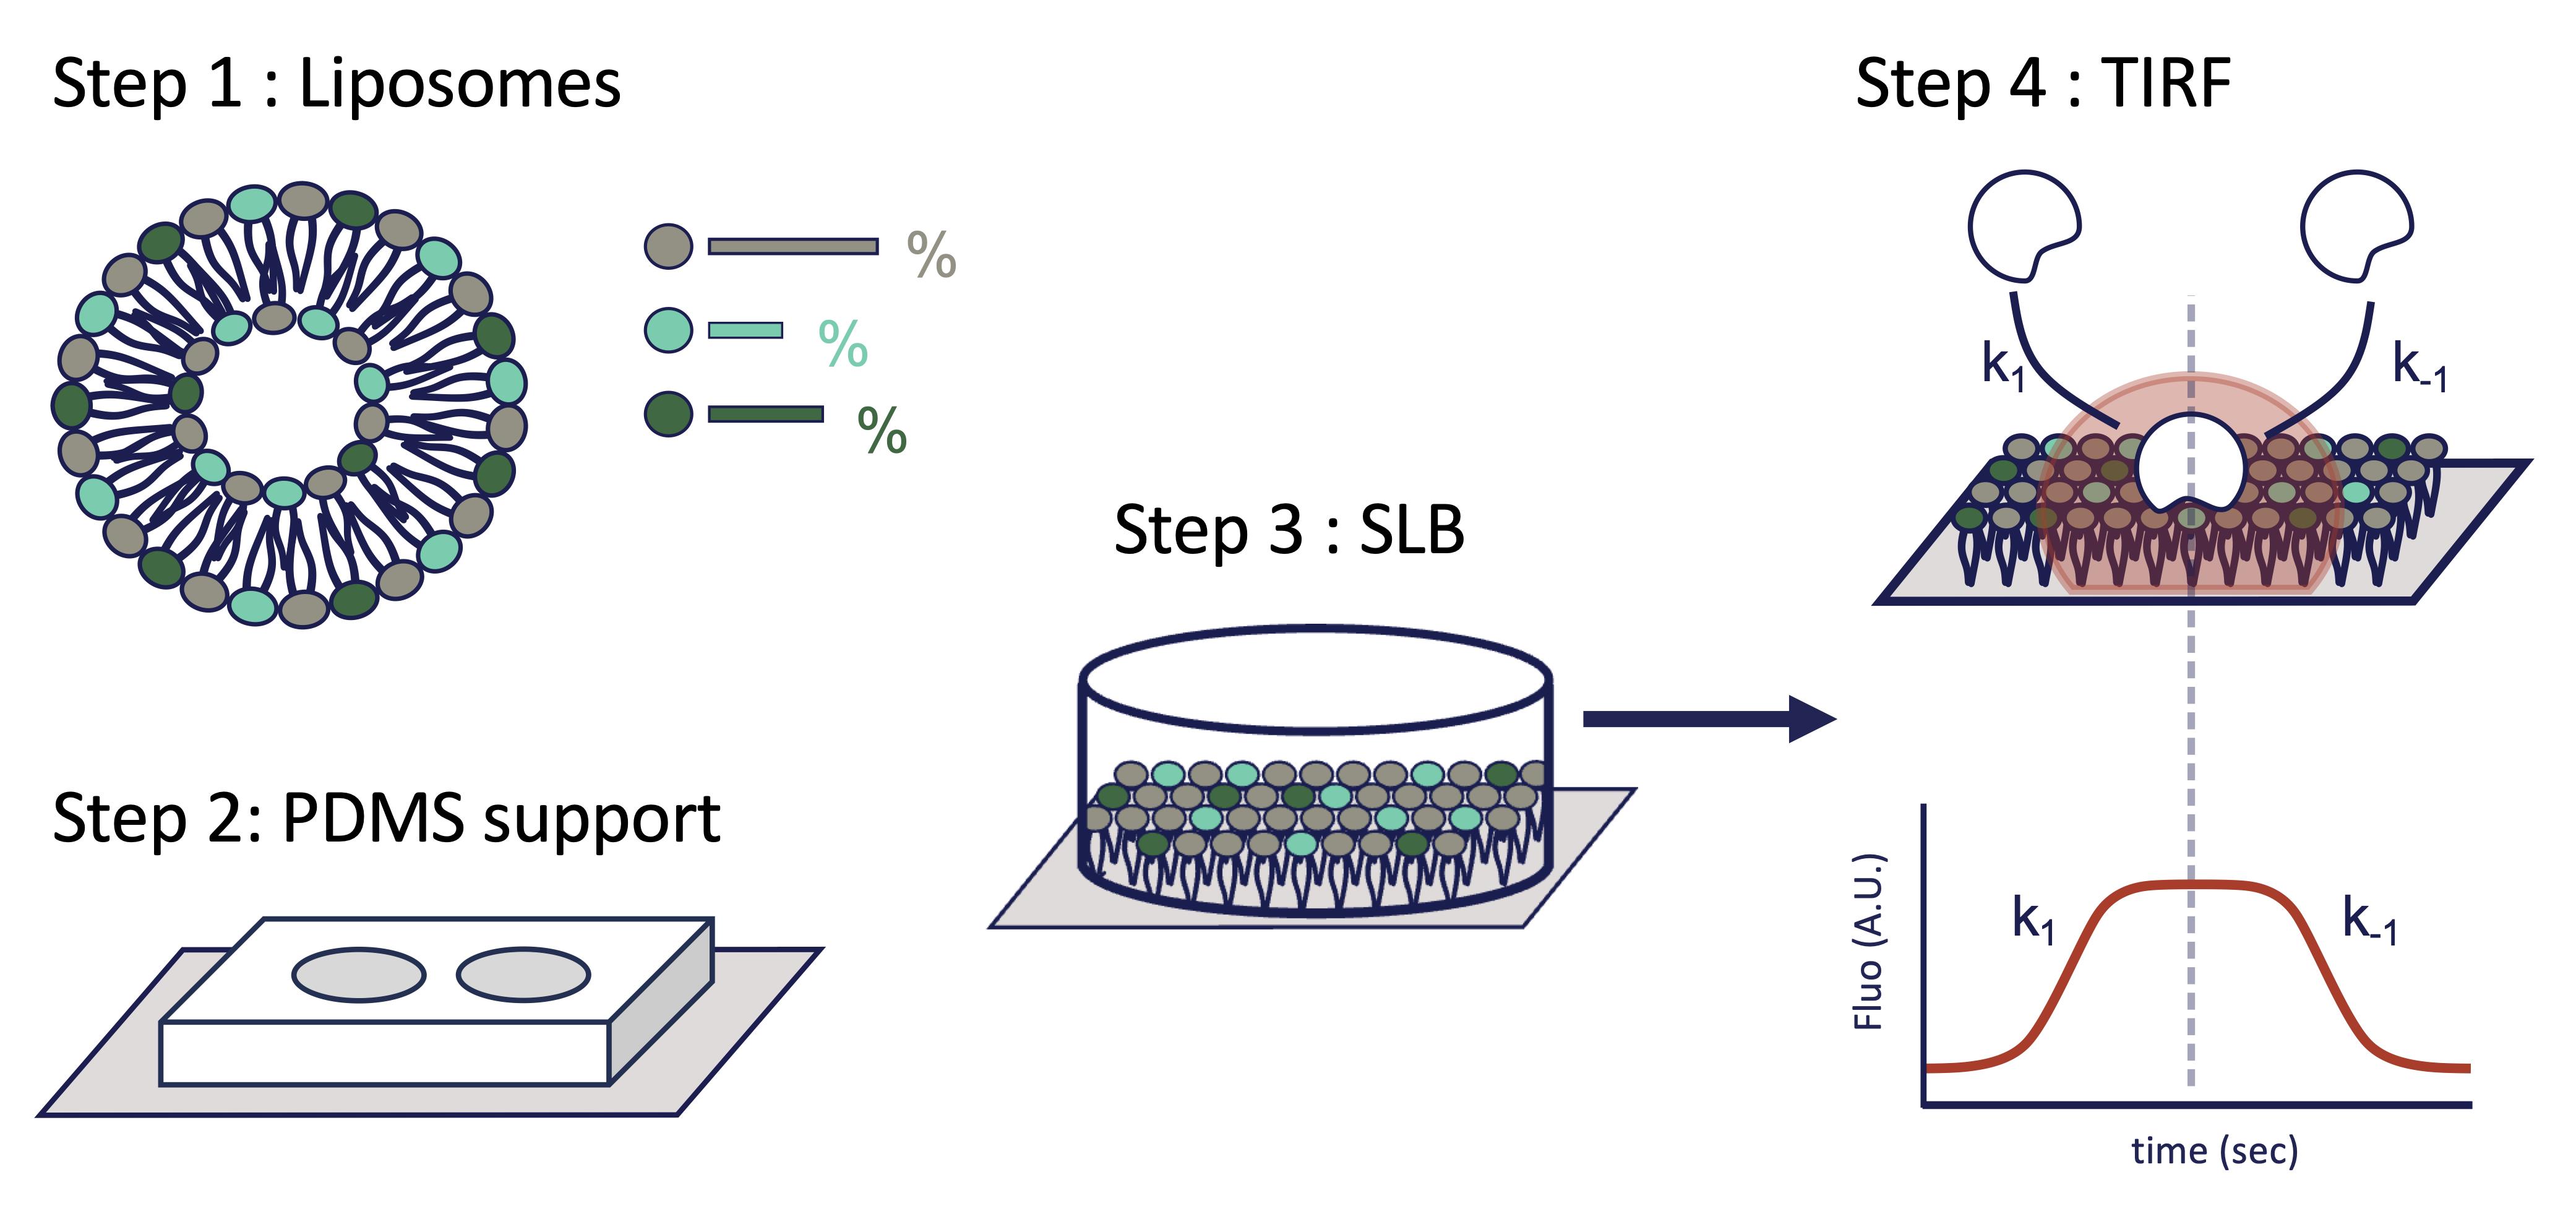
Graphical overview
Background
Membrane interfaces provide dynamic platforms for numerous peripheral proteins that reversibly associate with lipid bilayers. The thermodynamic (binding avidity) and kinetic parameters governing these interactions—including the apparent recruitment (kobs) and dissociation (koff) rate constants—determine their specificity, efficiency, and temporal regulation. This is particularly important for small GTPases of the Ras superfamily.
Small GTPases function as molecular switches that regulate cell polarity, migration, membrane trafficking, cytoskeletal remodeling, and immune signaling [1]. Small GTPases constitute a paradigm for peripheral membrane proteins that dynamically associate with the cytosolic leaflet of the plasma membrane [2]. Their activation is tightly regulated by guanine nucleotide exchange factors (GEFs), which catalyze GDP-to-GTP exchange [3]; their inactivation and membrane dissociation are promoted by GTPase-activating proteins (GAPs), which stimulate GTP hydrolysis. Increasing evidence indicates that these regulatory reactions are not solely determined by protein–protein interactions but are strongly influenced by the membrane environment itself, including curvature, phosphoinositide composition, membrane charge, and lipid packing (reviewed in [4]). In addition, nanoscale membrane heterogeneities generated by phase separation create microenvironments with distinct biochemical and biophysical properties [5–7].
Reconstituting these processes in defined biomimetic systems has emerged as an important strategy to dissect the molecular principles governing spatiotemporal signal transduction, i.e., both their kinetic and thermodynamic features (reviewed in [8–10]). Several methodologies have been developed to investigate protein–membrane interactions in small GTPase signaling. Classical liposome co-sedimentation or flotation assays provide robust biochemical measurements of membrane association but lack spatial and temporal resolution [11]. Surface plasmon resonance and related biophysical approaches enable quantitative affinity measurements but do not reproduce the dynamic organization of signaling complexes on membrane surfaces. In contrast, live-cell imaging captures signaling in physiological contexts but often complicates mechanistic interpretation because of the complexity and heterogeneity of cellular environments.
Supported lipid bilayers (SLBs) combined with total internal reflection fluorescence (TIRF) microscopy provide a powerful intermediate approach by enabling direct visualization of membrane recruitment, diffusion, clustering, and signaling reactions in a controlled yet biomimetic environment. Previous work demonstrated that membrane confinement and local organization strongly influence small GTPase signaling outputs such as effector engagement [6,12–14]. Recent studies further highlighted how membrane composition and phosphoinositide identity modulate GEF activity and downstream signaling transmission [15].
The protocol presented here describes the preparation of supported lipid bilayers and their use in quantitative TIRF microscopy assays to monitor protein recruitment to membrane surfaces [13,16–18]. Compared with bulk biochemical approaches, this method provides direct access to membrane binding kinetics, residence times, lateral diffusion, nanoscale organization, and dynamic protein exchange under defined experimental conditions. The protocol is readily adaptable to systematic variations in lipid composition, including phosphoinositide content, cholesterol levels, membrane charge, and protein density. It also allows simultaneous visualization in real time of multiple fluorescently labeled proteins. Throughout this protocol, membrane recruitment refers to the accumulation of fluorescent proteins at the supported lipid bilayer resulting from direct lipid binding, interactions with membrane-associated partners, or both.
A major advantage of this approach is its versatility and quantitative nature. Beyond small GTPase signaling, the protocol can be adapted to study membrane-associated enzymatic reactions, scaffold assembly, cytoskeletal coupling, receptor signaling, protein phase separation, and dynamic signaling networks. The use of purified components additionally facilitates mechanistic interpretation and quantitative modeling of signaling reactions.
Several limitations should nevertheless be considered. Supported lipid bilayers do not fully reproduce the complexity, asymmetry, curvature, and active remodeling of cellular membranes. Certain curvature-sensitive or transmembrane systems may therefore require complementary approaches such as giant unilamellar vesicles or proteoliposomes. Despite these limitations, SLB-based TIRF assays provide a robust and accessible platform for dissecting membrane-associated signaling mechanisms with high spatiotemporal resolution.
Materials and reagents
Reagents
Liposomes
1. Chloroform (Sigma-Aldrich, catalog number: 366927-1L)
2. Argon gas
3. HEPES [4-(2-hydroxyethyl)-1-piperazineethanesulfonic acid], 1 M, pH 7.8 (Sigma-Aldrich, catalog number: H4034)
4. NaCl, 5 M (Euromedex, catalog number: 1112-A)
5. Phosphatidylcholine (Avanti, catalog number: 840054P-200mg, soy)
6. Phosphatidylethanolamine (Avanti, catalog number: 840022P-25mg, brain, porcine)
7. Phosphatidylserine (Avanti, catalog number: 840032P-25mg, brain, porcine)
8. Cholesterol (Avanti, catalog number: 700000-100mg, ovine)
9. NBD-PE [N-(7-nitrobenz-2-oxa-1,3-diazol-4-yl) phosphoethanolamine] (Avanti, catalog number: 840145P-1mg, 18:1)
10. Phosphatidylinositol-3,4-bisphosphate (Avanti, catalog number: 850153P-100μg, 18:1)
11. DGS-NiNTA (1,2-dioleoyl-sn-glycero-3-[(N-(5-amino-1-carboxypentyl)iminodiacetic acid)succinyl] (nickel salt) (Avanti, catalog number: A89404, 5mg, 18:1)
PDMS support
1. Sylgard 184 silicone elastomer (Sigma-Aldrich, catalog number: 761036-5EA)
2. Ethanol (≥99.8%) (VWR Chemicals, PROLABO, catalog number: 20821296-1L)
3. Isopropanol (≥99.8%) (Fluka, catalog number: 34965-1L)
4. Deionized water and MilliQ water
5. Absolute acetone (≥99.8%) (Merck, catalog number: 100014)
6. HMDS (hexamethyldisilazane) (Sigma-Aldrich, catalog number: 440191-100ML)
SLB
1. CaCl2, 1 M (Merck, catalog number: 10035-04-8)
TIRF imaging
1. Immersion oil (e.g., ZEISS, catalog number: 444960 518F)
Solutions
1. Lipid stock solutions in chloroform (see Recipes)
2. HN buffer (see Recipes)
3. SLB-FB buffer (see Recipes)
4. HEPES 20 mM (pH 7.5) (see Recipes)
Recipes
1. Lipid stock solutions in chloroform
| Lipids | Mass (mg) | Volume (mL) | Concentration (mM) |
|---|---|---|---|
| Phosphatidylcholine (PC) | 100 | 4.0 | 32.2 |
| Phosphatidylethanolamine (PE) | 25 | 2.5 | 13.0 |
| Phosphatidylserine (PS) | 25 | 2.5 | 12.3 |
| Cholesterol (cholesterol) | 100 | 13.3 | 19.4 |
| N-(7-nitrobenz-2-oxa-1,3-diazol-4-yl) phosphoethanolamine (NBD-PE) | 1 | 1.0 | 1.0 |
| Phosphatidylinositol-3,4-bisphosphate (PI(3,4)P2) | 0.1 | 0.1 | 0.9 |
| 1,2-dipalmitoyl-sn-glycero-3-[(N-(5-amino-1-carboxypentyl)iminodiacetic acid)succinyl] (DGS-NiNTA) | 10 | 2.0 | 4.8 |
We provide an example of the lipid composition used in the experiments presented in this protocol.
See the table below to prepare 0.5 mL of lipid stock solutions at a final lipid concentration of 2.0 mM (thereafter, “2 mM liposome”).
Lipid stock solutions to prepare 0.5 mL at 2 mM liposome
| Reagent | Target composition (%) | Stock volume required (μL) |
|---|---|---|
| PC | 31 | 10 |
| PE | 20 | 15 |
| PS | 20 | 16 |
| Cholesterol | 20 | 10 |
| NBD-PE | 1 | 10 |
| PI(3,4)P2 | 4 | 44 |
| DGS-NiNTA | 4 | 8 |
2. HN buffer
HEPES 20 mM (pH 7.5), NaCl 100 mM
3. SLB-FB buffer
HEPES 20 mM (pH 7.5), NaCl 120 mM, DTT 1 mM
4. HEPES 20 mM (pH 7.5)
NaCl 120 mM, DTT 1 mM, MgCl2 1 mM
Laboratory supplies
Liposomes
1. 1.5 mL opaque tubes (e.g., Eppendorf, catalog number: 0030120191) and Amber tubes (Eppendorf, catalog number: 10458312)
2. Glass vials (e.g., WHEATON®, catalog number: DWKW224681) (2 mL)
3. Powder-free nitrile gloves (e.g., SHIELD Scientific, catalog number: 625124)
4. Quickfit® round-bottom flasks (e.g., Sigma-Aldrich, catalog number: Z302732-1EA)
PDMS support
1. Silicon master molds (photolithography generated) (homemade)
2. Aluminum foil (e.g., Sigma-Aldrich, catalog number: Z691577)
3. Adhesive tape (e.g., Scotch 3M)
4. Glass coverslips, e.g., 24 × 60 mm with 0.13–0.17 mm thickness (VWR, catalog number: 48404-133)
5. 6-mm biopsy punch (e.g., Dutscher, catalog number: 030740)
SLB
1. Glass coverslip holder
Equipment
Liposomes
1. Rotavapor (e.g., Labortechnik AG, model: eR-II BÜCHI)
2. Vacuum pump (e.g., Büchi Labortechnik AG, model: V-700 with vacuum controller V-850)
3. Liquid cooling system (e.g., Fisher Bioblock Scientific)
4. Vortex mixer (e.g., Sigma-Aldrich, catalog number: Z258423-1EA)
5. Hamilton® syringes [e.g., Sigma-Aldrich, catalog numbers: HAM80075-1EA (10 μL); HAM7656-01-1EA (100 μL); 20739 (500 μL)]
PDMS support
1. Ultrasonic bath (e.g., Bandelin SONOREX, Merck, catalog number: Z659460)
2. Vacuum desiccator or vacuum chamber
3. Oven (75 °C)
4. Plasma cleaner (e.g., Harrick, catalog number: PDC-32G-2, 230V)
5. Closed chamber/container for HMDS vapor silanization
6. Chemical hood
TIRF imaging
1. Cyanine5.5 succinimidyl ester (CY5.5-SE) (e.g., Cytiva, catalog number: 10461835)
2. TIRF microscope, e.g., Nikon Ti-E inverted equipped with a 100× TIRF Nikon objective (NA 1.49, oil immersion) and a 1.5× Nikon magnification lens. Fluorescence excitation is achieved using 488, 561, and 640 nm lasers: 488 nm Coherent OBIS laser 150 mW for NBD-PE and GFP-derived probes; 561 nm Coherent OBIS laser 100 mW Cy3 protein fluorophores; 640 nm Coherent OBIS laser 150 mW for Cy5 or Cy5.5-labeled proteins. Excitation light and fluorescence emission are separated using a quad-band dichroic filter (TRF89901v2-NK, Chroma), and the fluorescence signal will be detected on an EMCCD camera (iXion Ultra 897, Andor, pixel size = 107 nm). Hardware control and image acquisition are performed using MetaMorph (Molecular Devices, v7.8.13.0)
3. Centrifuge (e.g., Sigma-Aldrich, model: Eppendorf EP5810000010-1EA)
4. Vacuum pump (e.g., Lagerwerk, model: KNF N86 KN.18)
Software and datasets
Image acquisition and TIRF illumination were controlled using MetaMorph Microscopy Automation and Image Analysis Software (Molecular Devices, San Jose, CA, USA; RRID: SCR_002368) and iLAS2/Modular TIRF control software (Gataca Systems, Massy, France). Quantification of membrane-associated fluorescence was performed with Fiji software [19] and fitting of raw curves and statistical analysis with PRISM 10 (GraphPad).
Procedure
A. Timing and storage considerations
Liposome stocks can be aliquoted and stored at -20 or -80 °C for several months without noticeable loss of their ability to form supported lipid bilayers, provided repeated freeze/thaw cycles are avoided. In contrast, PDMS chambers should be freshly plasma-bonded to glass coverslips immediately before SLB formation, as plasma activation gradually decays over time. Likewise, SLBs should be prepared immediately before imaging and used within 1 h of formation to ensure optimal membrane integrity, fluidity, and reproducibility of protein recruitment measurements.
B. (Step 1) Liposomes (preparation time: 2 h)
In order to prepare 0.5 mL of a 2 mM liposome suspension with molar composition 31% PC, 20% PE, 20% cholesterol, 20% PS, 4% PI(3,4)P2, 4% DGS-NiNTA, and 1% NBD-PE, solubilize lipids in chloroform as indicated in the Recipes section.
1. Lipid preparation
a. Use powder-free nitrile gloves (chloroform-resistant).
b. To avoid cross-contamination between lipids, rinse the Hamilton syringe six times with chloroform before each new lipid transfer: three rinses in a primary cleaning reservoir followed by three rinses in fresh chloroform.
c. Weigh the lipid powder directly in the test tube. Alternatively, resuspend the entire amount of powder when working with small quantities (e.g., 100 μg).
d. Add chloroform using a Hamilton syringe and gently mix.
e. Aliquot the lipid solution into vials sealed under an inert atmosphere: flush the vial with argon just before closing the cap, then seal it with tape to prevent leakage.
f. Store all lipid stocks at -20 °C.
2. Liposome preparation
a. Set the cryostat to -10 °C and the water bath to 37 °C.
b. Clean the round-bottom flask by adding chloroform and shaking it. Repeat three times to ensure it is properly cleaned.
c. Add the lipid stock solutions prepared in step B1.
d. Add 500 μL of chloroform; this helps form a thin lipid film and facilitates resuspension.
e. Fix the flask to the Rotavapor using parafilm or tape, then partially immerse it in the 37 °C water bath.
f. Turn on the Rotavapor and set the rotation speed to ~100 rpm.
g. Allow rotation for 5 min; this step ensures homogeneous lipid mixing.
h. Turn off the water bath, but keep the flask immersed.
i. Ensure that the system is properly sealed.
j. Turn on the vacuum pump to reach ~200 mbar.
k. Leave under vacuum for 30 min or more.
l. Check that chloroform has been fully evaporated. If not, perform an additional drying cycle.
m. Stop the pump, then slowly reintroduce argon until atmospheric pressure is reached before removing the round-bottom flask.
n. Resuspend the lipid film by adding 0.5 mL of HN buffer directly into the round-bottom flask, then vortex until complete resuspension is achieved.
o. Aliquot the suspension into amber tubes, typically 100 μL per tube, to prevent photobleaching of fluorescent lipids (e.g., NBD-PE).
p. Clean the round-bottom flask with hot water and detergent. Rinse thoroughly with deionized water, followed by Milli-Q water and ethanol, and allow it to air-dry completely; the glassware used for lipid solution storage should not be reused.
Notes:
1. Safety: Chloroform needs to be handled in a certified chemical fume hood with appropriate personal protective equipment and disposed of as halogenated solvent waste according to institutional regulations.
2. Prepare defined lipid stock solutions promptly, minimizing repeated freeze/thaw cycles and following the manufacturer’s storage recommendations.
3. Gentle drying under a stream of nitrogen is an alternative to the drying method described in the main workflow.
4. Resuspension of the lipid film may be difficult with some lipid compositions, particularly with high cholesterol content and low proportions of charged lipids. To improve resuspension, preheat the HN buffer to 37 °C before use.
5. Do not heat the lipid mixture during prolonged drying under vacuum, as elevated temperatures may promote lipid degradation or oxidation.
6. Liposomes were intentionally used without extrusion because spontaneous vesicle rupture is sufficient for SLB formation under these conditions.
C. (Step 2) PDMS support (preparation time: 4 h)
Note: PDMS wells are fabricated from silicon wafer master molds (homemade) and bonded to glass coverslips to generate isolated compartments for supported lipid bilayer formation.
1. Coverslip cleaning and plasma activation
a. Place four glass coverslips in a glass coverslip holder and immerse them in fresh absolute acetone.
b. Sonicate for 10 min at maximum power.
c. Remove the coverslips and gently blot excess acetone using lint-free absorbent paper.
d. Discard the used acetone according to institutional chemical waste regulations.
e. Rinse the glass coverslip holder three times with Milli-Q water.
f. Transfer the coverslips to fresh Milli-Q water and sonicate for 10 min.
g. Transfer the coverslips immediately to fresh ethanol or isopropanol.
h. Sonicate the coverslips for 10 min at maximum power.
i. Remove the coverslips and dry thoroughly under a stream of nitrogen gas. Avoid touching the cleaned glass surface with fingers or forceps tips.
j. Coverslips may be stored in ethanol or isopropanol until use.
2. PDMS preparation
a. Place the silicon master molds in a closed container.
b. Add a small volume of HMDS into the same container and seal it.
c. Expose the molds to HMDS vapor to silanize the surface for at least 20 min. Keep the mold in the HMDS atmosphere until PDMS casting. This treatment facilitates the removal of cured PDMS and helps preserve the molds for repeated use.
d. Prepare PDMS (Sylgard 184) by mixing the base and curing agent at a 10:1 ratio. Mix thoroughly until the solution contains numerous air bubbles.
e. Sonicate the mixture for 5 min to improve homogenization, then degas it under vacuum for at least 45 min, until all visible and non-visible bubbles are removed.
f. Place each silanized master mold on aluminum foil with a 10-mm-high border, ensuring that the wafer is well seated to prevent PDMS leakage underneath.
g. Gently pour 7 mL of the degassed PDMS onto the center of the mold without moving the wafer, forming a uniform layer approximately 5–8 mm thick. After degassing, no bubbles should remain in the PDMS, and care should be taken to avoid introducing new bubbles during pouring. The approximate PDMS thickness should be between 5 and 8 mm.
h. Cure the PDMS in an oven at 75 °C for 2 h.
i. Remove the mold–PDMS assemblies from the oven and allow them to cool to room temperature.
j. Carefully peel the cured PDMS from the master mold, taking care not to damage the patterned surface.
k. Cut the PDMS into individual pieces of suitable size for microscopy and handling.
l. Using a 6-mm biopsy punch, create circular wells in each PDMS piece. These wells serve as compartments for SLB formation and subsequent protein recruitment assays.
m. Remove dust and small debris from the PDMS surface using transparent 3M adhesive tape.
n. Place the punched PDMS pieces, with the well side facing upward, together with clean glass coverslips in a plasma cleaner.
o. Place the cleaned coverslips and PDMS chambers in the plasma cleaner with the surfaces to be bonded facing upward.
p. Evacuate the chamber to 200 mTorr and refill with oxygen to 1,000 mTorr.
q. Repeat the evacuation/refill cycle three times.
r. Adjust the chamber pressure to 300 mTorr.
s. Expose the samples to oxygen plasma for 20 s.
t. Immediately place each PDMS chamber onto the activated glass coverslip to form a sealed device.
u. Incubate the assembled devices at 75 °C for at least 5 min to strengthen bonding.
v. Verify that the PDMS is firmly attached to the glass before proceeding to SLB formation.
Notes:
1. Plasma-activated surfaces rapidly lose reactivity. Cured, unbonded PDMS pieces can be stored for up to one week before plasma activation. In contrast, plasma-bonded PDMS chambers should be used immediately for SLB formation.
2. Handle coverslips only with clean forceps and avoid touching the glass surface after cleaning.
3. Dust particles are one of the most common causes of defective supported lipid bilayers. Work in a clean environment and protect cleaned coverslips from airborne contamination.
4. Any residue of detergent, organic solvent, grease, or dust can impair vesicle fusion and lead to incomplete bilayer formation.
5. The incomplete bonding is typically recognized by leakage or local detachment of the PDMS from the coverslip. Such chambers should not be used for SLB formation because leakage and loss of chamber integrity compromise reproducibility. The chamber should be discarded and bonding repeated using freshly cleaned and freshly plasma-activated surfaces, while checking surface cleanliness, plasma treatment, and the delay between activation and contact.
6. An example of the final chamber design is shown in Figure 1.
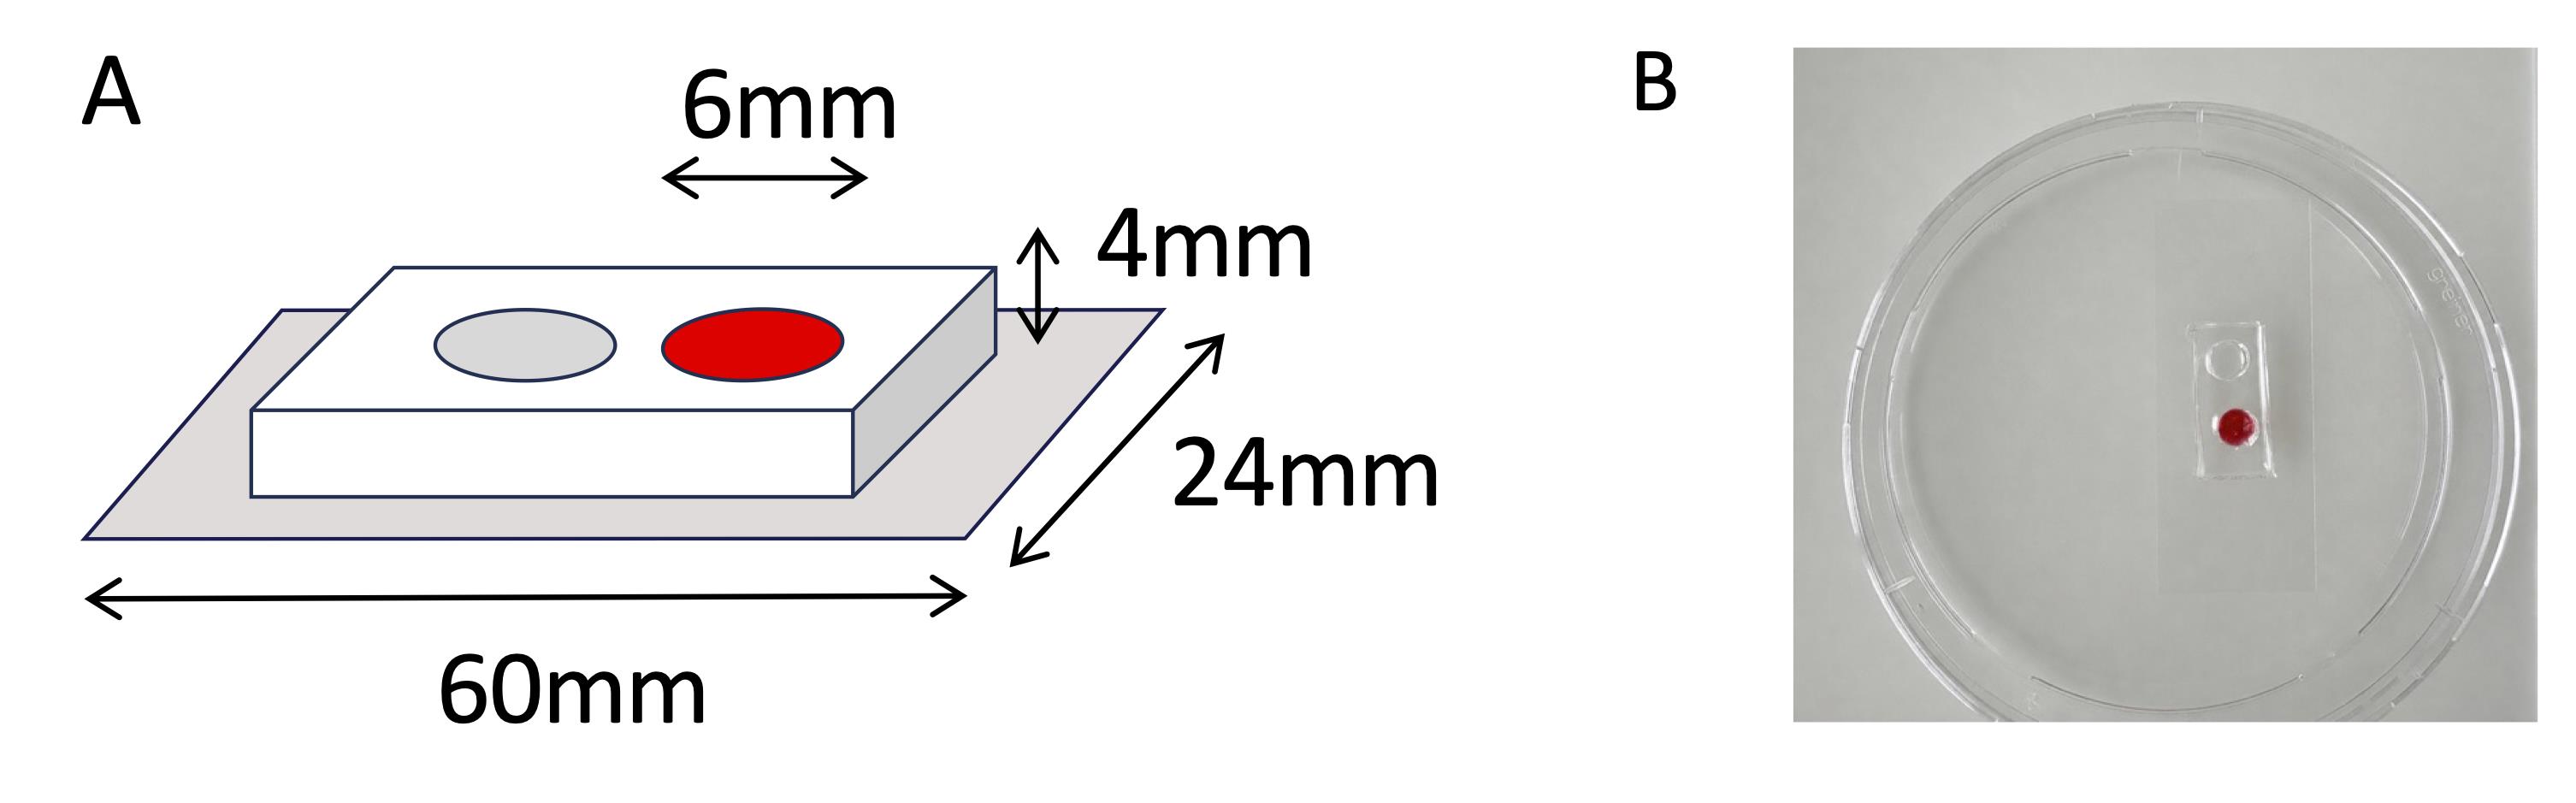
Figure 1. Characteristics of the PDMS support. (A) Design and dimensions of the PDMS support. This design allows reaction volumes between 50 and 100 μL. (B) Representative photograph of a prepared PDMS support. Ponceau Red was added to one well to facilitate visualization.
D. (Step 3) SLB preparation (preparation time: 2 h)
1. Thaw the 2 mM liposome stock prepared as described in step B1. Do not sonicate or extrude the liposomes after thawing.
2. Dilute the liposomes to reach a final lipid concentration of 0.2 mM in SLB-FB buffer. This corresponds to a ten-fold dilution of the 2 mM liposome stock.
3. Add CaCl2 to a final concentration of 10 mM and mix gently by pipetting.
4. Add 100 μL of the liposome/CaCl2 mixture into each PDMS well (6 mm diameter).
5. Incubate for 5 min at room temperature (20–25 °C) to allow vesicle adsorption, rupture, and supported lipid bilayer formation.
6. Wash the supported lipid bilayer 10 times by carefully exchanging 40 μL of solution at each wash step while maintaining a thin liquid layer above the membrane surface. Do not allow the membrane to dry.
7. Perform the first five washes using SLB formation buffer.
8. Perform the final five washes SLB-FB buffer.
9. The supported lipid bilayer is now ready for protein recruitment experiments and TIRF microscopy analysis.
Notes:
1. SLB formation must be done immediately after chamber preparation.
2. Glass cleanliness is essential for successful SLB formation. Poorly cleaned coverslips frequently result in discontinuous membranes, dark patches, poor vesicle fusion, or accumulation of unfused liposomes (Figure 2). All cleaning steps should be performed under a chemical hood using clean glassware and fresh solvents.
3. A piranha-based protocol may be used to clean the glass surface.
4. MgCl2 is added during the protein-imaging step because Mg2+ is required to stabilize nucleotide binding to small GTPases and thereby preserve the defined nucleotide-loaded state during recruitment measurements. MgCl2 is not required for the preceding SLB-formation/washing step and is therefore introduced only in the imaging buffer.
5. If uniform bilayers cannot be obtained under calcium-assisted conditions, users are advised to use an alternative SLB-formation strategy validated for their lipid composition (for example, a solvent-assisted bilayer formation method or another established vesicle-fusion condition).
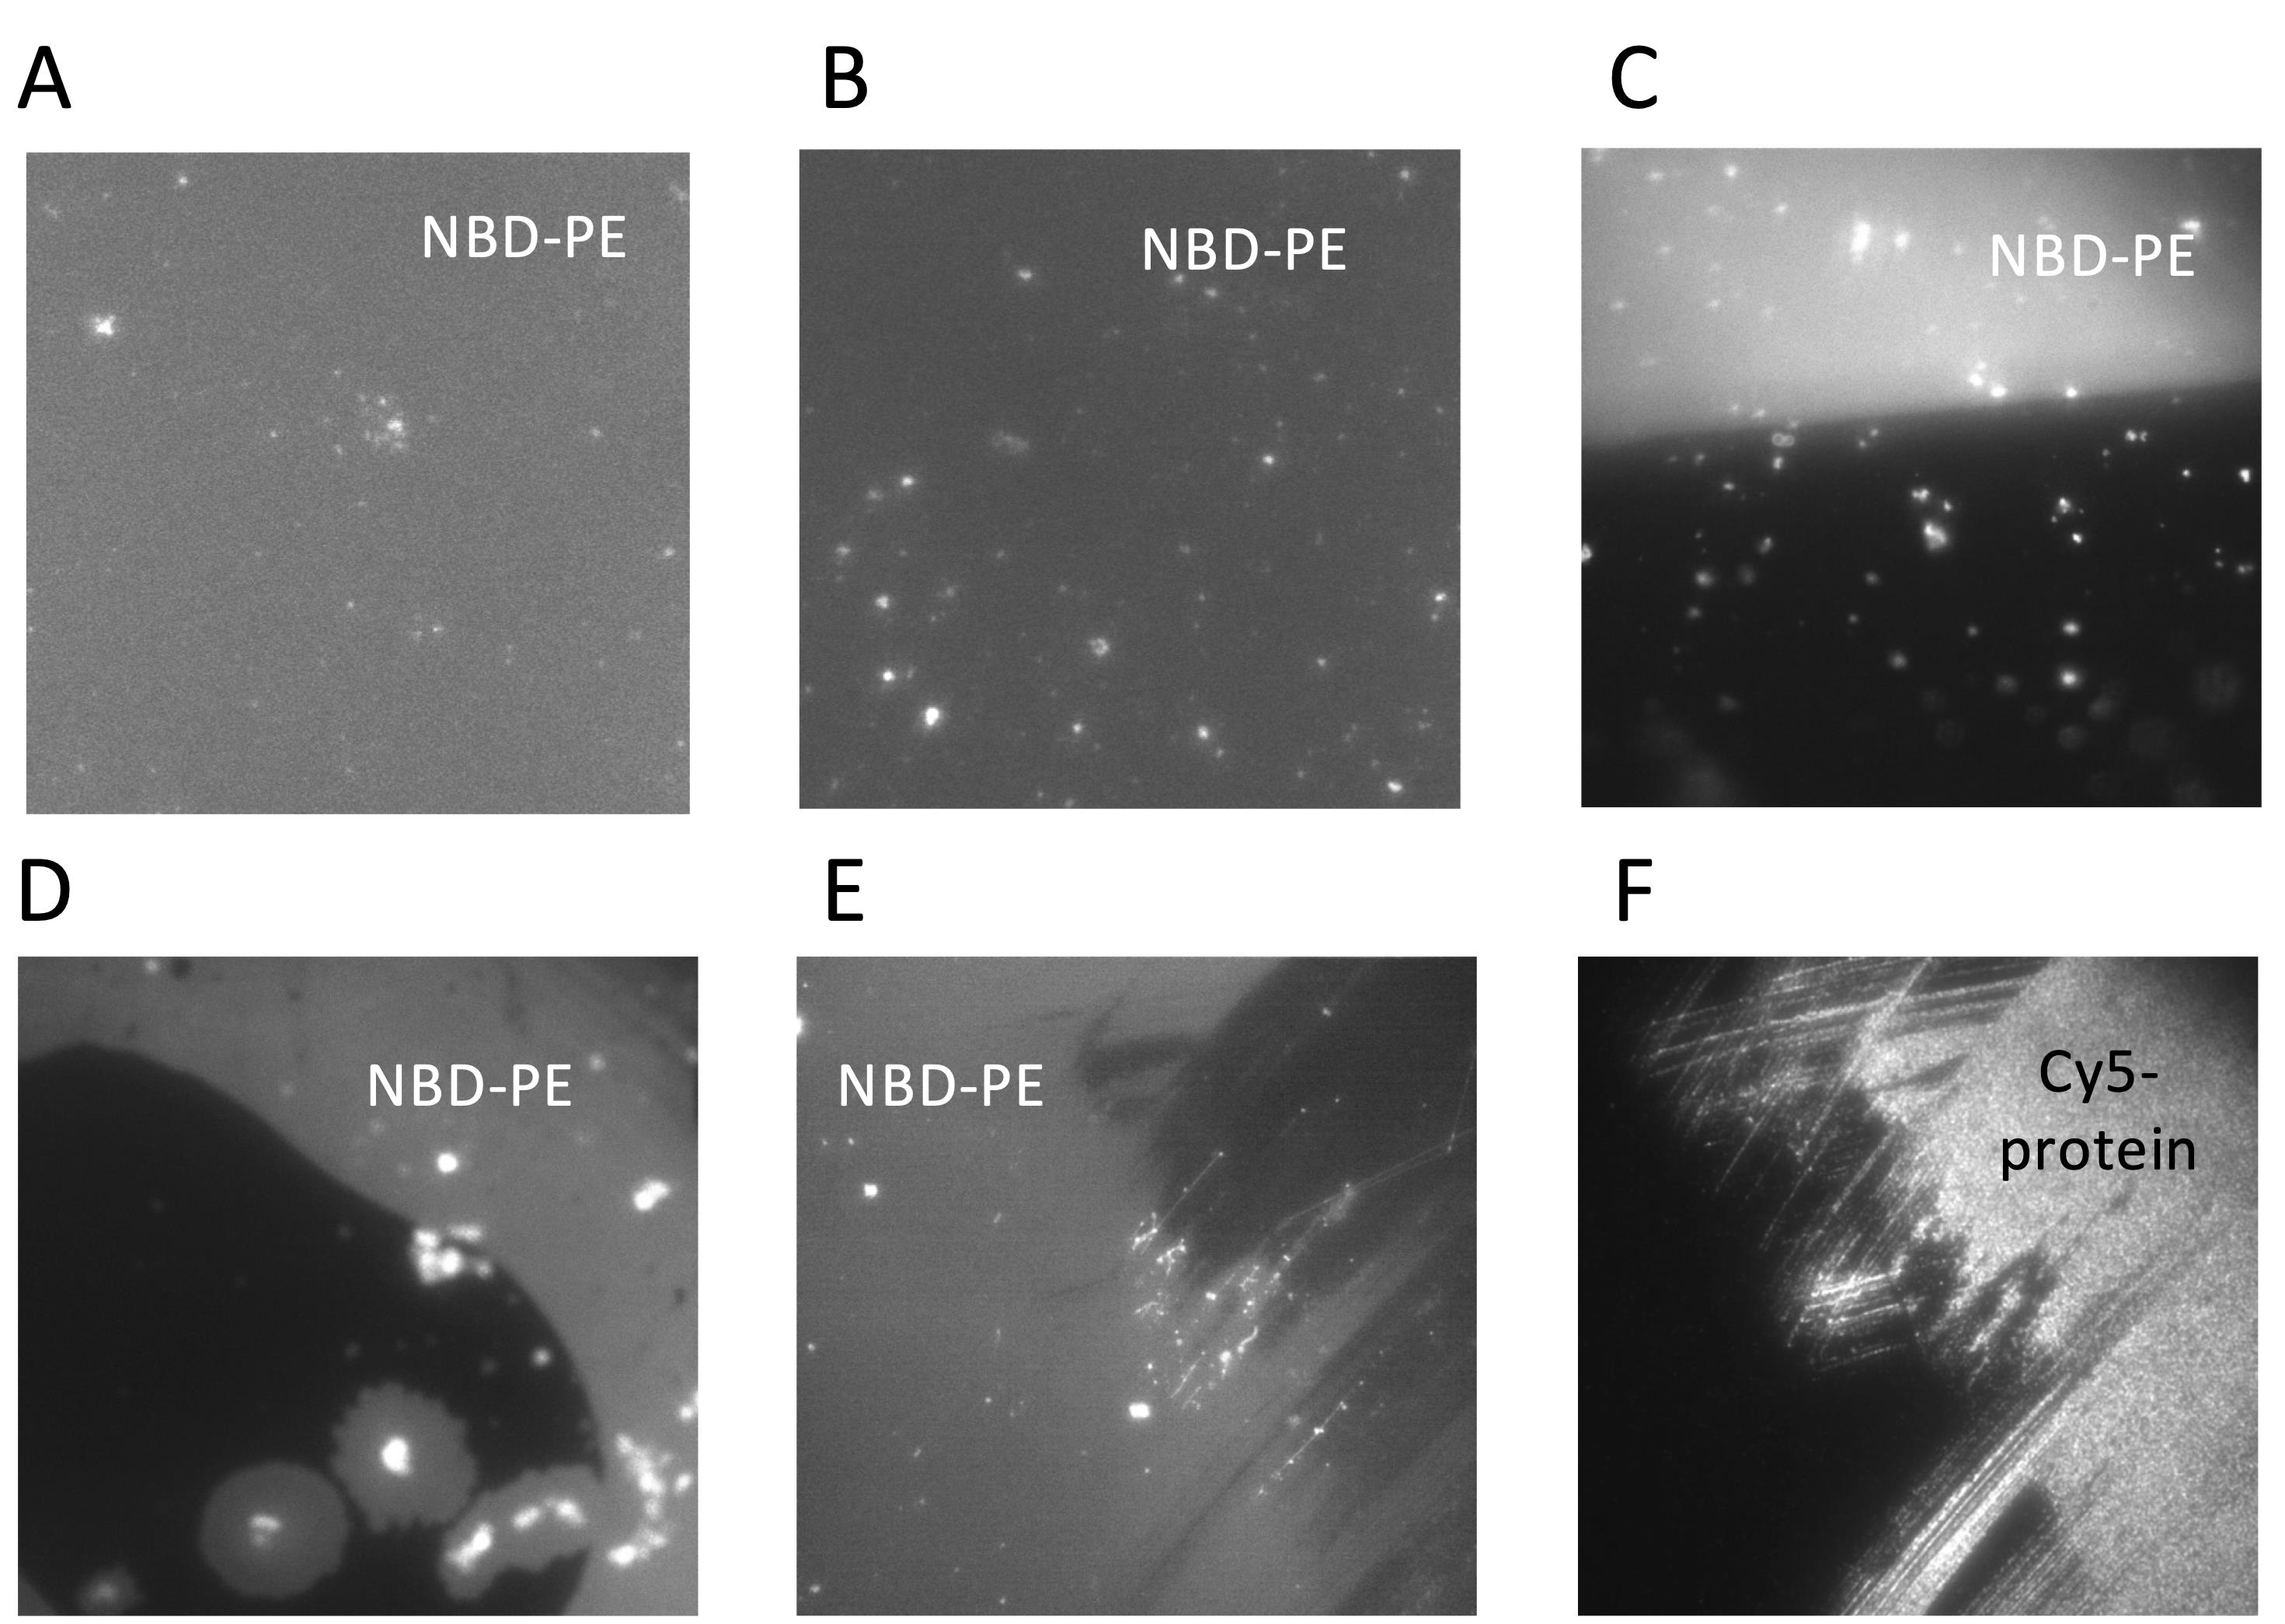
Figure 2. Visual assessment by total internal reflection fluorescence (TIRF) of supported lipid bilayer quality. (A) Representative image of a homogeneous, defect-free supported lipid bilayer (SLB) visualized by NBD-PE fluorescence (excitation with laser 488 nm). SLB displays a homogeneous, diffuse fluorescence; the occasional bright foci correspond to attached liposomes and/or dust particles on the surface. (B) SLB containing minor defects but still suitable for imaging experiments. (C) Image of the edge of an SLB (localized on the upper part). (D) Example of a poorly formed SLB with extensive defects. (E) Scratched SLB caused by improper handling during the washing step. (F) Representative image showing preferential binding of a Cy5-labeled protein (excitation with laser 640 nm) to exposed glass rather than to the supported lipid bilayer, as a result of an incomplete bilayer coverage.
E. (Step 4) TIRF imaging
1. TIRF imaging
Note: Prepare fluorescently labeled proteins or biosensors according to their specific experimental design. In this protocol, we show examples of proteins directly labeled with Cy5-SE (Cy5 NHS Ester) prepared following the manufacturer's protocol. All experiments are performed at room temperature (20–25 °C).
a. Turn on the TIRF microscope.
b. Apply to the objective an immersion oil suitable for high numerical aperture TIRF imaging.
c. Mount the supported lipid bilayer chamber onto the microscope stage and secure it to minimize drift during acquisition.
d. Use brightfield illumination to confirm that the objective is in contact with the coverslip. Then, activate the Perfect Focus module and slowly approach the coverslip until the module automatically locks focus.
e. In order to verify that the focus is locked on the lipid bilayer, excite the NBD-PE lipid incorporated into the membrane using the 488 nm laser line at low power (typically 7%–10% laser intensity). Identify the supported lipid bilayer as a homogeneous fluorescent layer located directly at the glass surface. The absence of bright aggregates or dark defects indicates proper bilayer formation (Figure 2).
f. Using Modular (iLAS2 TIRF control software), progressively increase the laser incidence angle until total internal reflection is achieved. With our system, the TIRF penetration depth is typically adjusted to approximately 80–112 nm. Proper TIRF illumination is characterized by a sharp reduction of background fluorescence in solution, selective excitation of fluorophores at the membrane surface, and visualization of an evanescent field penetrating approximately 80–120 nm into the sample.
g. (Critical) Perform a preliminary concentration series to identify a protein concentration that reaches steady-state membrane occupancy without saturating the detector. In our experiments, 50 nM was typically sufficient.
h. Allow the sample to equilibrate for 5–10 min before image acquisition, depending on the kinetics of membrane recruitment.
i. While achieving membrane saturation, adjust acquisition parameters to minimize photobleaching while maintaining a sufficient signal-to-noise ratio. Typical parameters are: 488 nm laser at 7%–10% power for membrane visualization, 640 nm laser at 7%–10% power for Cy5-labeled proteins, exposure times ranging from 50 to 300 ms, and camera EM gain adjusted according to fluorescence intensity.
j. Mount a new supported lipid bilayer chamber.
k. To measure association rates, on the newly formed SLB, add the protein sample at the desired concentration by gently removing half of the buffer volume from the well (50 μL from 100 μL) and slowly replacing it with an equal volume of imaging buffer containing the fluorescently labeled protein at 2× the desired final concentration. Avoid touching the membrane surface with the pipette tip.
l. Test several concentrations ranging from 1 to 50 nM and acquire time-lapse sequences using sequential or simultaneous, if possible, multi-channel acquisition, depending on the experimental setup. Typical acquisition frequencies range from one frame every 0.1–10 s for membrane recruitment assays.
m. To measure dissociation, once membrane fluorescence has reached a plateau, gently remove half of the sample volume from the well and replace it with protein-free imaging buffer. Immediately acquire a time-lapse sequence.
n. Save all acquisitions in a non-compressed format (.tiff) for subsequent quantitative analysis.
Notes:
1. The NBD-PE lipid included in the membrane composition facilitates visual assessment of SLB quality. In addition, NBD fluorescence can be used to perform FRAP (fluorescence recovery after photobleaching) experiments to assess membrane fluidity and validate the quality and homogeneity of the supported lipid bilayer (not detailed in this protocol).
2. TIRF microscopy selectively excites fluorophores located within ~80–120 nm of the glass surface, minimizing background fluorescence from proteins remaining in solution.
3. The addition of proteins to the supported lipid bilayer should be performed carefully to avoid disturbing or damaging the membrane.
4. Acquire a pre-protein image of each field/chamber immediately before protein addition. This image is used to quantify baseline fluorescence and, where applicable, bleed-through/background for subsequent analysis.
2. Quantification of membrane recruitment
a. Time-lapse image sequences are imported into Fiji (ImageJ) using File → Import → Image Sequence or by opening the image stack directly [19].
b. A region of interest (ROI) encompassing the entire imaged membrane surface is manually defined on the first frame using the Freehand Selection tool and added to the ROI Manager (Analyze → Tools → ROI Manager → Add).
c. The ROI is applied to all frames of the timelapse using the ROI Manager.
d. Mean fluorescence intensity within the ROI is then quantified over time using Image → Stacks → Plot Z-axis Profile.
e. Background fluorescence (in the absence of protein) is subtracted from the membrane fluorescence at each time point:
f. Normalize fluorescence values to the maximal fluorescence signal:
g. Plot normalized fluorescence intensity as a function of time to generate recruitment kinetics.
3. Determination of recruitment kinetics
a. Fit recruitment traces using a mono-exponential association model:
where:
F(t) is the fluorescence intensity at time t,
Fmin is the minimal membrane-associated fluorescence,
Fmax is the maximal membrane-associated fluorescence,
kobs is the first-order apparent recruitment rate constant.
b. For dissociation experiments, fit fluorescence decay resulting from the protein dilution in the chamber once the plateau is reached, using:
where koff corresponds to the apparent dissociation rate constant.
c. Curve fitting can be performed using GraphPad Prism (alternatively, Origin, MATLAB, R, or equivalent software).
4. Statistical analysis
a. Perform at least three independent experiments using independently prepared liposome batches and protein preparations.
b. Report data as mean ± SD.
c. Statistical significance may be assessed using an unpaired two-tailed Student's t-test for two conditions or one-way ANOVA followed by appropriate post hoc tests for multiple conditions.
Validation of protocol
We validated the protocol by quantifying the membrane recruitment of the truncated BCR composed of DH–PH tandem (residues 498-866) to supported lipid bilayers mimicking the cytosolic leaflet of the plasma membrane [31% PC, 20% PE, 20% cholesterol, 20% PS, 4% PI(3,4)P2, 4% DGS-NiNTA, and 1% NBD-PE]. Purified BCR DH–PH was labeled with Cy5.5 and analyzed either alone (Video S1) or in the presence of membrane-bound GDP-loaded Rac1-His6 (Video S2, Figure 3A). Representative fluorescence images (Figure 3B, C), kinetic traces (Figure 3D, E), and quantitative analyses obtained with this workflow (Figure 3F, G) are shown.
The assay provides high temporal resolution measurements of both membrane association and dissociation, allowing independent determination of the apparent recruitment (kobs) and dissociation (koff) rate constants. In this example, membrane-bound Rac1 decreased the apparent recruitment rate of BCR by approximately five-fold from kobs = 0.193 ± 0.035 s-1 for BCR alone to kobs = 0.039 ± 0.003 s-1 in the presence of Rac1, without significantly affecting its dissociation from the membrane (BCR alone koff = 0.032 ± 0.005 s-1, with Rac1 koff = 0.024 ± 0.009 s-1). These results are consistent with membrane-bound Rac1 reducing the effective recruitment of BCR DH–PH, most likely through competition for negatively charged membrane surfaces.
The same workflow was successfully applied to multiple proteins exhibiting distinct membrane affinities, including Tiam1 DH-PH, PAK1 (unpublished data). This result illustrates the sensitivity of the assay to detect changes in membrane binding kinetics arising from membrane-associated partners. These experiments demonstrate that the assay enables sensitive and quantitative monitoring of lipid bilayer association dynamics. The protocol, therefore, provides a robust platform for investigating membrane-dependent signaling mechanisms using purified proteins and defined lipid compositions.
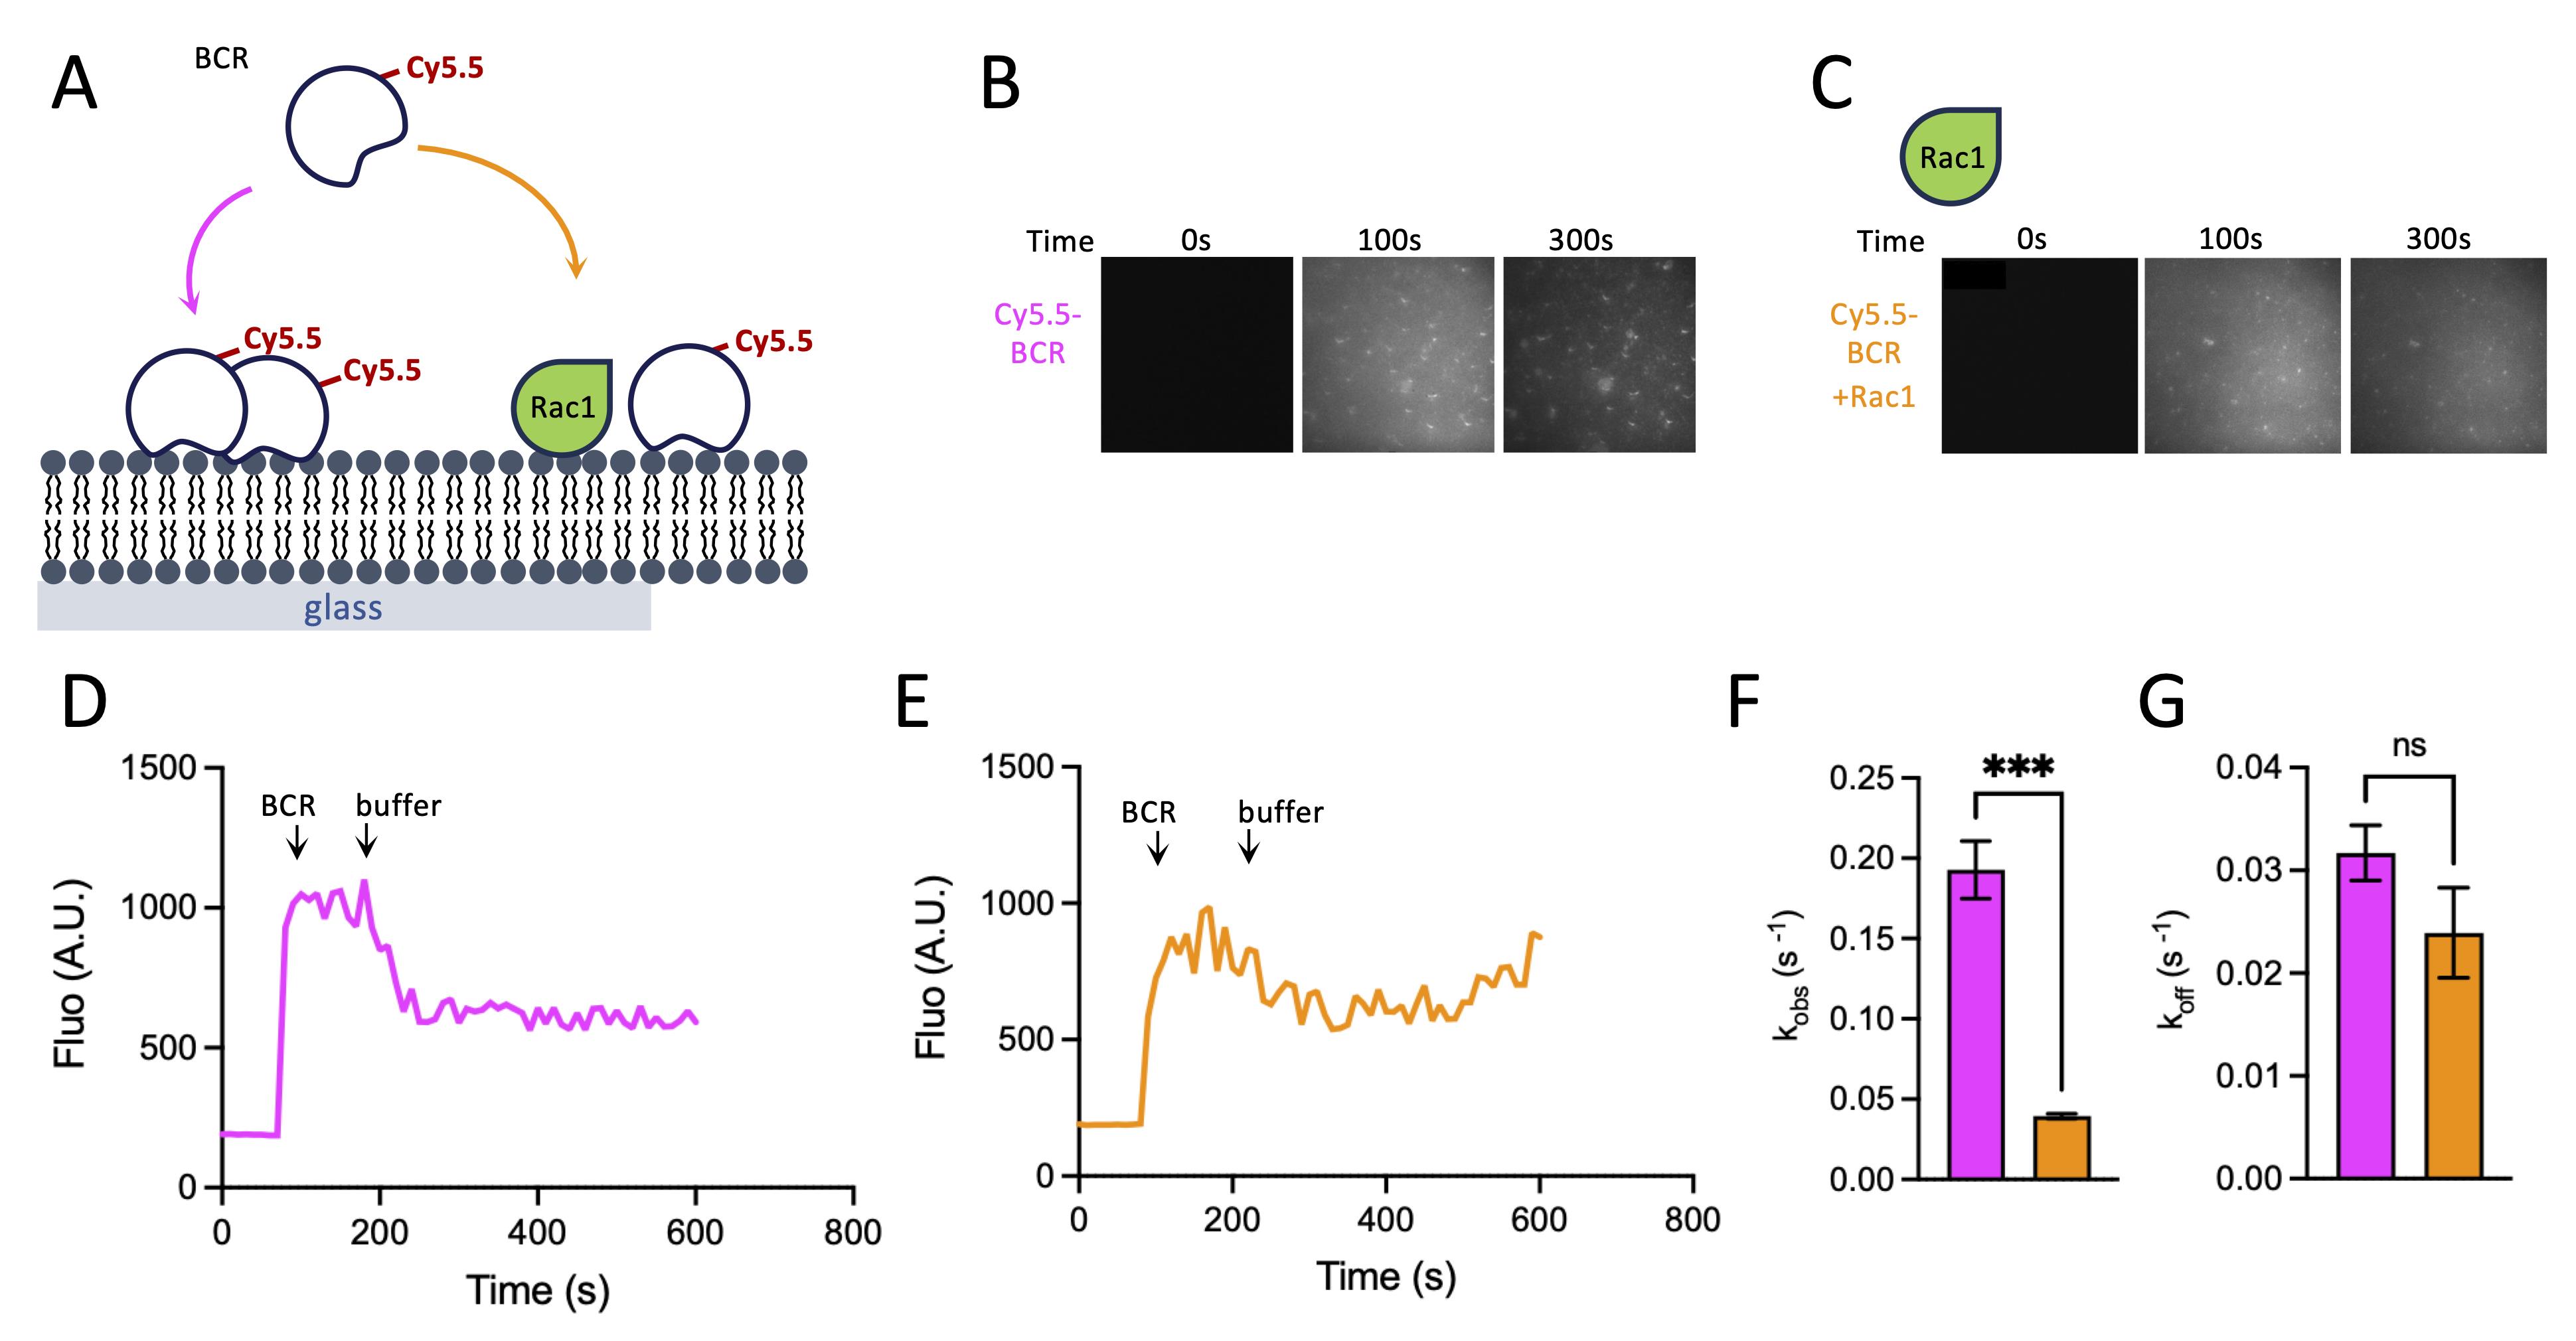
Figure 3. Example of protocol validation. (A) Schematic of the experimental setup used to quantify recruitment of the BCR protein to the membrane surface. (B) Representative fluorescence images of Cy5.5-labeled BCR DH–PH recruited to supported lipid bilayers in the absence of membrane-bound Rac1. (C) The same experiment, performed in the presence of membrane-bound GDP-loaded Rac1-His6. (D) Fluorescence intensity at the membrane surface as a function of time, quantified from the image sequences, showing the recruitment and dissociation kinetics of BCR in the absence of Rac1 or presence (E) of membrane-bound Rac1. (F) Apparent membrane recruitment rate constants (kobs) obtained by fitting the association phase with a mono-exponential model (purple: in the absence of Rac1; orange: in the presence of Rac1). (G) The membrane dissociation rate constants (koff) were obtained by fitting fluorescence decay curves with a mono-exponential dissociation model. Bars represent the mean from four experiments with two different liposome preparations, with error bars indicating the standard deviation. Statistical analysis was performed using Student's t-test; ***p = 0.0001; ns, p > 0.05.
General notes and troubleshooting
General notes
1. The quality of the SLB strongly depends on the cleanliness of the glass surface and lipid preparation. Dust particles, detergent residues, or incomplete solvent evaporation can impair bilayer formation and generate membrane defects.
2. The lipid composition can substantially influence membrane fluidity, protein recruitment, and bilayer stability. In particular, high cholesterol concentrations or elevated proportions of negatively charged lipids may reduce membrane homogeneity and complicate bilayer formation.
3. This protocol is compatible with a wide range of membrane-binding proteins, including small GTPases, GEFs, GAPs, effector domains, and peripheral membrane proteins. Protein concentrations and incubation times may require optimization depending on the avidity and kinetics of the interaction studied.
4. The use of fluorescently labeled proteins or fluorescent biosensors should be optimized to minimize perturbation of protein activity. Whenever possible, labeling efficiency and protein functionality should be validated prior to TIRF experiments.
5. NBD-PE fluorescence provides a convenient quality control for supported lipid bilayer formation and can additionally be used for FRAP experiments to assess membrane fluidity and continuity. Incomplete fluorescence recovery after photobleaching generally indicates defective or partially immobilized membranes.
6. TIRF illumination selectively excites fluorophores within ~80–120 nm of the glass surface, thereby strongly reducing background fluorescence from proteins remaining in solution.
7. Supported lipid bilayers are mechanically fragile. Rapid pipetting, excessive liquid mixing, or direct dispensing onto the membrane surface can disrupt the bilayer and generate imaging artifacts. Protein addition should therefore be performed carefully to preserve membrane integrity (see General note 8).
8. To minimize shear stress during protein addition, gently remove part of the buffer from the imaging chamber and slowly replace it with an equal volume of protein-containing solution. This approach limits turbulence and preserves the integrity of the supported lipid bilayer.
9. The optimal TIRF angle and acquisition parameters may vary between microscope systems, objectives, fluorophores, and membrane compositions. These parameters should be empirically optimized for each experimental setup.
10. For quantitative recruitment assays, it is required to maintain identical acquisition parameters between experiments, including laser power, exposure time, camera gain, and protein concentration, to facilitate direct comparison between conditions.
Troubleshooting
Problem 1: The SLB is not continuous or contains dark patches and defects.
Possible causes: Presence of dust particles, insufficient cleaning of the glass surface, contaminated buffers, or incomplete lipid fusion on the surface.
Solutions: Thoroughly clean all glass surfaces, chambers, and pipettes before use. Filter buffers when possible and work in a dust-free environment. Ensure complete bilayer formation before imaging and avoid drying of the membrane during preparation.
Problem 2: Presence of bright fluorescent spots on the supported lipid bilayer surface.
Possible cause: Incomplete removal of unfused liposomes, leading to liposome adsorption or accumulation on the SLB surface.
Solutions: Perform additional gentle washing steps with buffer after bilayer formation to remove excess liposomes. Avoid strong pipetting that could disrupt the membrane while ensuring sufficient buffer exchange to eliminate non-fused vesicles.
Problem 3: High background fluorescence in solution.
Possible causes: Excess fluorescent protein, insufficient washing, or nonspecific adsorption to glass/PDMS.
Solutions: Reduce protein concentration, include appropriate blocking/passivation if compatible, verify complete SLB coverage, and optimize TIRF angle.
Problem 4: Rapid photobleaching during acquisition.
Possible causes: Excessive laser power or long exposure time.
Solution: Reduce laser power, shorten exposure time, increase interval between frames, or use an oxygen-scavenging system if compatible.
Supplementary information
The following supporting information can be downloaded here:
1. Video S1. Movie example from the BCR recruitment experiment
2. Video S2. Movie example from the BCR recruitment experiment with the presence of Rac1-GDP at the surface
Acknowledgments
This study was supported by grants to A.N. from the French National Research Agency (ANR-22-CE1-0004). We thank Mahel Zeghouf for valuable discussions. We thank Mathieu Coppey and Maud Bongaerts (Institut Curie) for their valuable help during the implementation of the TIRF microscopy experiments. We are also grateful to Martin Loose (Institute of Science and Technology Austria) for insightful discussions and for sharing his expertise in supported lipid bilayer reconstitution, which greatly facilitated the development of this assay. The protocol was inspired in part by methodologies developed in his laboratory [20].
Author contributions
Conceptualization, A.N.; Investigation, C.P., T.C., M.Z., A.N.; Writing—Original Draft, C.P., M.Z., A.N., G.P.; Writing—Review & Editing, A.N., G.P.; Funding acquisition, A.N.; Supervision, A.N., G.P.
Competing interests
The authors declare no conflicts of interest.
References
- Cherfils, J. and Zeghouf, M. (2011). Chronicles of the GTPase switch. Nat Chem Biol. 7(8): 493–495. https://doi.org/10.1038/nchembio.608
- Groves, J. T. and Kuriyan, J. (2010). Molecular mechanisms in signal transduction at the membrane. Nat Struct Mol Biol. 17(6): 659–665. https://doi.org/10.1038/nsmb.1844
- Nawrotek, A., Zeghouf, M. and Cherfils, J. (2016). Allosteric regulation of Arf GTPases and their GEFs at the membrane interface. Small GTPases. 7(4): 283–296. https://doi.org/10.1080/21541248.2016.1215778
- Nawrotek, A., Dubois, P., Zeghouf, M. and Cherfils, J. (2023). Molecular principles of bidirectional signalling between membranes and small GTPases. FEBS Lett. 597(6): 778–793. https://doi.org/10.1002/1873-3468.14585
- Zhou, Y. and Hancock, J. F. (2023). RAS nanoclusters are cell surface transducers that convert extracellular stimuli to intracellular signalling. FEBS Lett. 597(6): 892–908. https://doi.org/10.1002/1873-3468.14569
- Remorino, A., De Beco, S., Cayrac, F., Di Federico, F., Cornilleau, G., Gautreau, A., Parrini, M. C., Masson, J. B., Dahan, M., Coppey, M., et al. (2017). Gradients of Rac1 Nanoclusters Support Spatial Patterns of Rac1 Signaling. Cell Rep. 21(7): 1922–1935. https://doi.org/10.1016/j.celrep.2017.10.069
- de Seze, J., Gatin, J. and Coppey, M. (2023). RhoA regulation in space and time. FEBS Lett. 597(6): 836–849. https://doi.org/10.1002/1873-3468.14578
- Céspedes, P. F., Beckers, D., Dustin, M. L. and Sezgin, E. (2020). Model membrane systems to reconstitute immune cell signaling. FEBS J. 288(4): 1070–1090. https://doi.org/10.1111/febs.15488
- Ganzinger, K. A. and Schwille, P. (2019). More from less – bottom-up reconstitution of cell biology. J Cell Sci. 132(4): e227488. https://doi.org/10.1242/jcs.227488
- Sarkis, J. and Vié, V. (2020). Biomimetic Models to Investigate Membrane Biophysics Affecting Lipid–Protein Interaction. Front Bioeng Biotechnol. 8: e00270. https://doi.org/10.3389/fbioe.2020.00270
- Peurois, F., Veyron, S., Ferrandez, Y., Ladid, I., Benabdi, S., Zeghouf, M., Peyroche, G. and Cherfils, J. (2017). Characterization of the activation of small GTPases by their GEFs on membranes using artificial membrane tethering. Biochem J. 474(7): 1259–1272. https://doi.org/10.1042/bcj20170015
- Dubois, P., Ferrandez, Y., Rey, C., Pages, C., Nawrotek, A. and Cherfils, J. (2026). The cytokinesis regulator RacGAP1 is a Rac1-specific GAP on membranes. Protein Sci. 35(3): e70488. https://doi.org/10.1002/pro.70488
- Huang, W. Y. C., Alvarez, S., Kondo, Y., Kuriyan, J. and Groves, J. T. (2021). Relating cellular signaling timescales to single-molecule kinetics: A first-passage time analysis of Ras activation by SOS. Proc Natl Acad Sci USA. 118(45): e2103598118. https://doi.org/10.1073/pnas.2103598118
- Huang, W. Y. C., Alvarez, S., Kondo, Y., Lee, Y. K., Chung, J. K., Lam, H. Y. M., Biswas, K. H., Kuriyan, J. and Groves, J. T. (2019). A molecular assembly phase transition and kinetic proofreading modulate Ras activation by SOS. Science. 363(6431): 1098–1103. https://doi.org/10.1126/science.aau5721
- Nawrotek, A., Benabdi, S., Niyomchon, S., Kryszke, M. H., Ginestier, C., Cañeque, T., Tepshi, L., Mariani, A., St.Onge, R. P., Giaever, G., et al. (2019). PH-domain-binding inhibitors of nucleotide exchange factor BRAG2 disrupt Arf GTPase signaling. Nat Chem Biol. 15(4): 358–366. https://doi.org/10.1038/s41589-019-0228-3
- Loose, M., Auer, A., Brognara, G., Budiman, H. R., Kowalski, L. and Matijević, I. (2022). In vitro reconstitution of small GTPase regulation. FEBS Lett. 597(6): 762–777. https://doi.org/10.1002/1873-3468.14540
- Jimenez Salinas, A., Tevdorashvili, K., Grim, J., Morales, A., Chakhrakia, A. and Kwang Lee, Y. (2026). Positive cooperativity between RAS-binding and cysteine-rich domains regulates RAF membrane binding kinetics via lateral rebinding. Nat Commun. 17(1): 2593. https://doi.org/10.1038/s41467-026-69437-6
- Armstrong, M. C., Weiß, Y. R., Hoachlander-Hobby, L. E., Roy, A. A., Visco, I., Moe, A., Golding, A. E., Hansen, S. D., Bement, W. M., Bieling, P., et al. (2025). The biochemical mechanism of Rho GTPase membrane binding, activation and retention in activity patterning. EMBO J. 44(9): 2620–2657. https://doi.org/10.1038/s44318-025-00418-z
- Schindelin, J., Arganda-Carreras, I., Frise, E., Kaynig, V., Longair, M., Pietzsch, T., Preibisch, S., Rueden, C., Saalfeld, S., Schmid, B., et al. (2012). Fiji: an open-source platform for biological-image analysis. Nat Methods. 9(7): 676–682. https://doi.org/10.1038/nmeth.2019
- Bezeljak, U., Loya, H., Kaczmarek, B., Saunders, T. E. and Loose, M. (2020). Stochastic activation and bistability in a Rab GTPase regulatory network. Proc Natl Acad Sci USA. 117(12): 6540–6549. https://doi.org/10.1073/pnas.1921027117
Article Information
Publication history
Received: Jul 5, 2026
Accepted: Aug 27, 2026
Available online: Oct 8, 2026
Published: Oct 20, 2026
Copyright
© 2026 The Author(s); This is an open access article under the CC BY-NC license (https://creativecommons.org/licenses/by-nc/4.0/).
How to cite
Pagès, C., Ghasemi, R., Zuber, M., Coelho, T., Peyroche, G. and Nawrotek, A. (2026). Preparation of Phosphoinositide-Containing Supported Lipid Bilayers and Quantitative Assessment of Protein Recruitment to Membrane Surfaces. Bio-protocol 16(20): e5853. DOI: 10.21769/BioProtoc.5853.

 Download Citation in RIS Format
Do you have any questions about this protocol?
Post your question to gather feedback from the community. We will also invite the authors of this article to respond.
 Post a Question


