


- Protocols

- Articles and Issues
- For Authors
- About
- Become a Reviewer


An Optimized Protocol for TurboID-Based Proximity Labeling and Sample Preparation for Mass Spectrometry in Arabidopsis thaliana


(*contributed equally to this work) Published: Vol 16, Iss 21, Nov 5, 2026 DOI: 10.21769/BioProtoc.5852 Views: 23
Reviewed by: Deepti M NambiarTasleem JavaidAnonymous reviewer(s)
 PDF
PDF  Ask a question
Original research article
The authors used this protocol in:
May 2023

Protocol Collections
Comprehensive collections of detailed, peer-reviewed protocols focusing on specific topics




Abstract
Plant proximity labeling proteomics enables the identification of transient and weak intracellular protein interactions that are undetectable via traditional biochemical assays. Conventional enrichment pipelines suffer severe quantitative bias caused by urea-derived chemical artifacts and high mass spectrometry background signals from sample- and carrier-derived impurities. This protocol describes a complete standardized workflow for biotinylated protein extraction, enrichment, and LC-MS/MS sample preparation optimized for Arabidopsis seedlings. The procedure integrates controlled urea dilution and pre-desalting to suppress non-enzymatic protein modifications, introduces acetylation blocking of streptavidin magnetic beads to mitigate streptavidin degradation during on-bead digestion, and applies two-step on-bead trypsin digestion to improve peptide coverage. Multi-point sample retention and dual protein quantification are implemented throughout all experimental stages to ensure full-process quality control. Subsequent data processing pipelines using Spectronaut for data-independent acquisition (DIA) data and MaxQuant for data-dependent acquisition (DDA) data are also detailed for consistent proteome quantification. This workflow delivers higher protein recovery and better signal-to-noise ratios than standard protocols while offering flexible adaptation for various crop proximity labeling and affinity enrichment proteomic research.
Key features
• Complete standardized preprocessing pipeline specially optimized for Arabidopsis seedlings undergoing TurboID-based proximity labeling proteomics.
• Urea dilution and pre-desalting to suppress artificial protein carbamylation.
• Magnetic bead acetylation blocking to mitigate streptavidin degradation during on-bead digestion, coupled with two-step tryptic digestion for higher peptide coverage.
• Full-process multi-point quality control, compatible with DIA (Spectronaut) and DDA (MaxQuant) mass spectrometry analysis.
Keywords: Arabidopsis Proximity labeling
TurboID
Streptavidin magnetic bead
Biotinylated protein
Quantitative proteomics
On-bead digestion
Proximity labeling
TurboID
Streptavidin magnetic bead
Biotinylated protein
Quantitative proteomics
On-bead digestion
Graphical overview
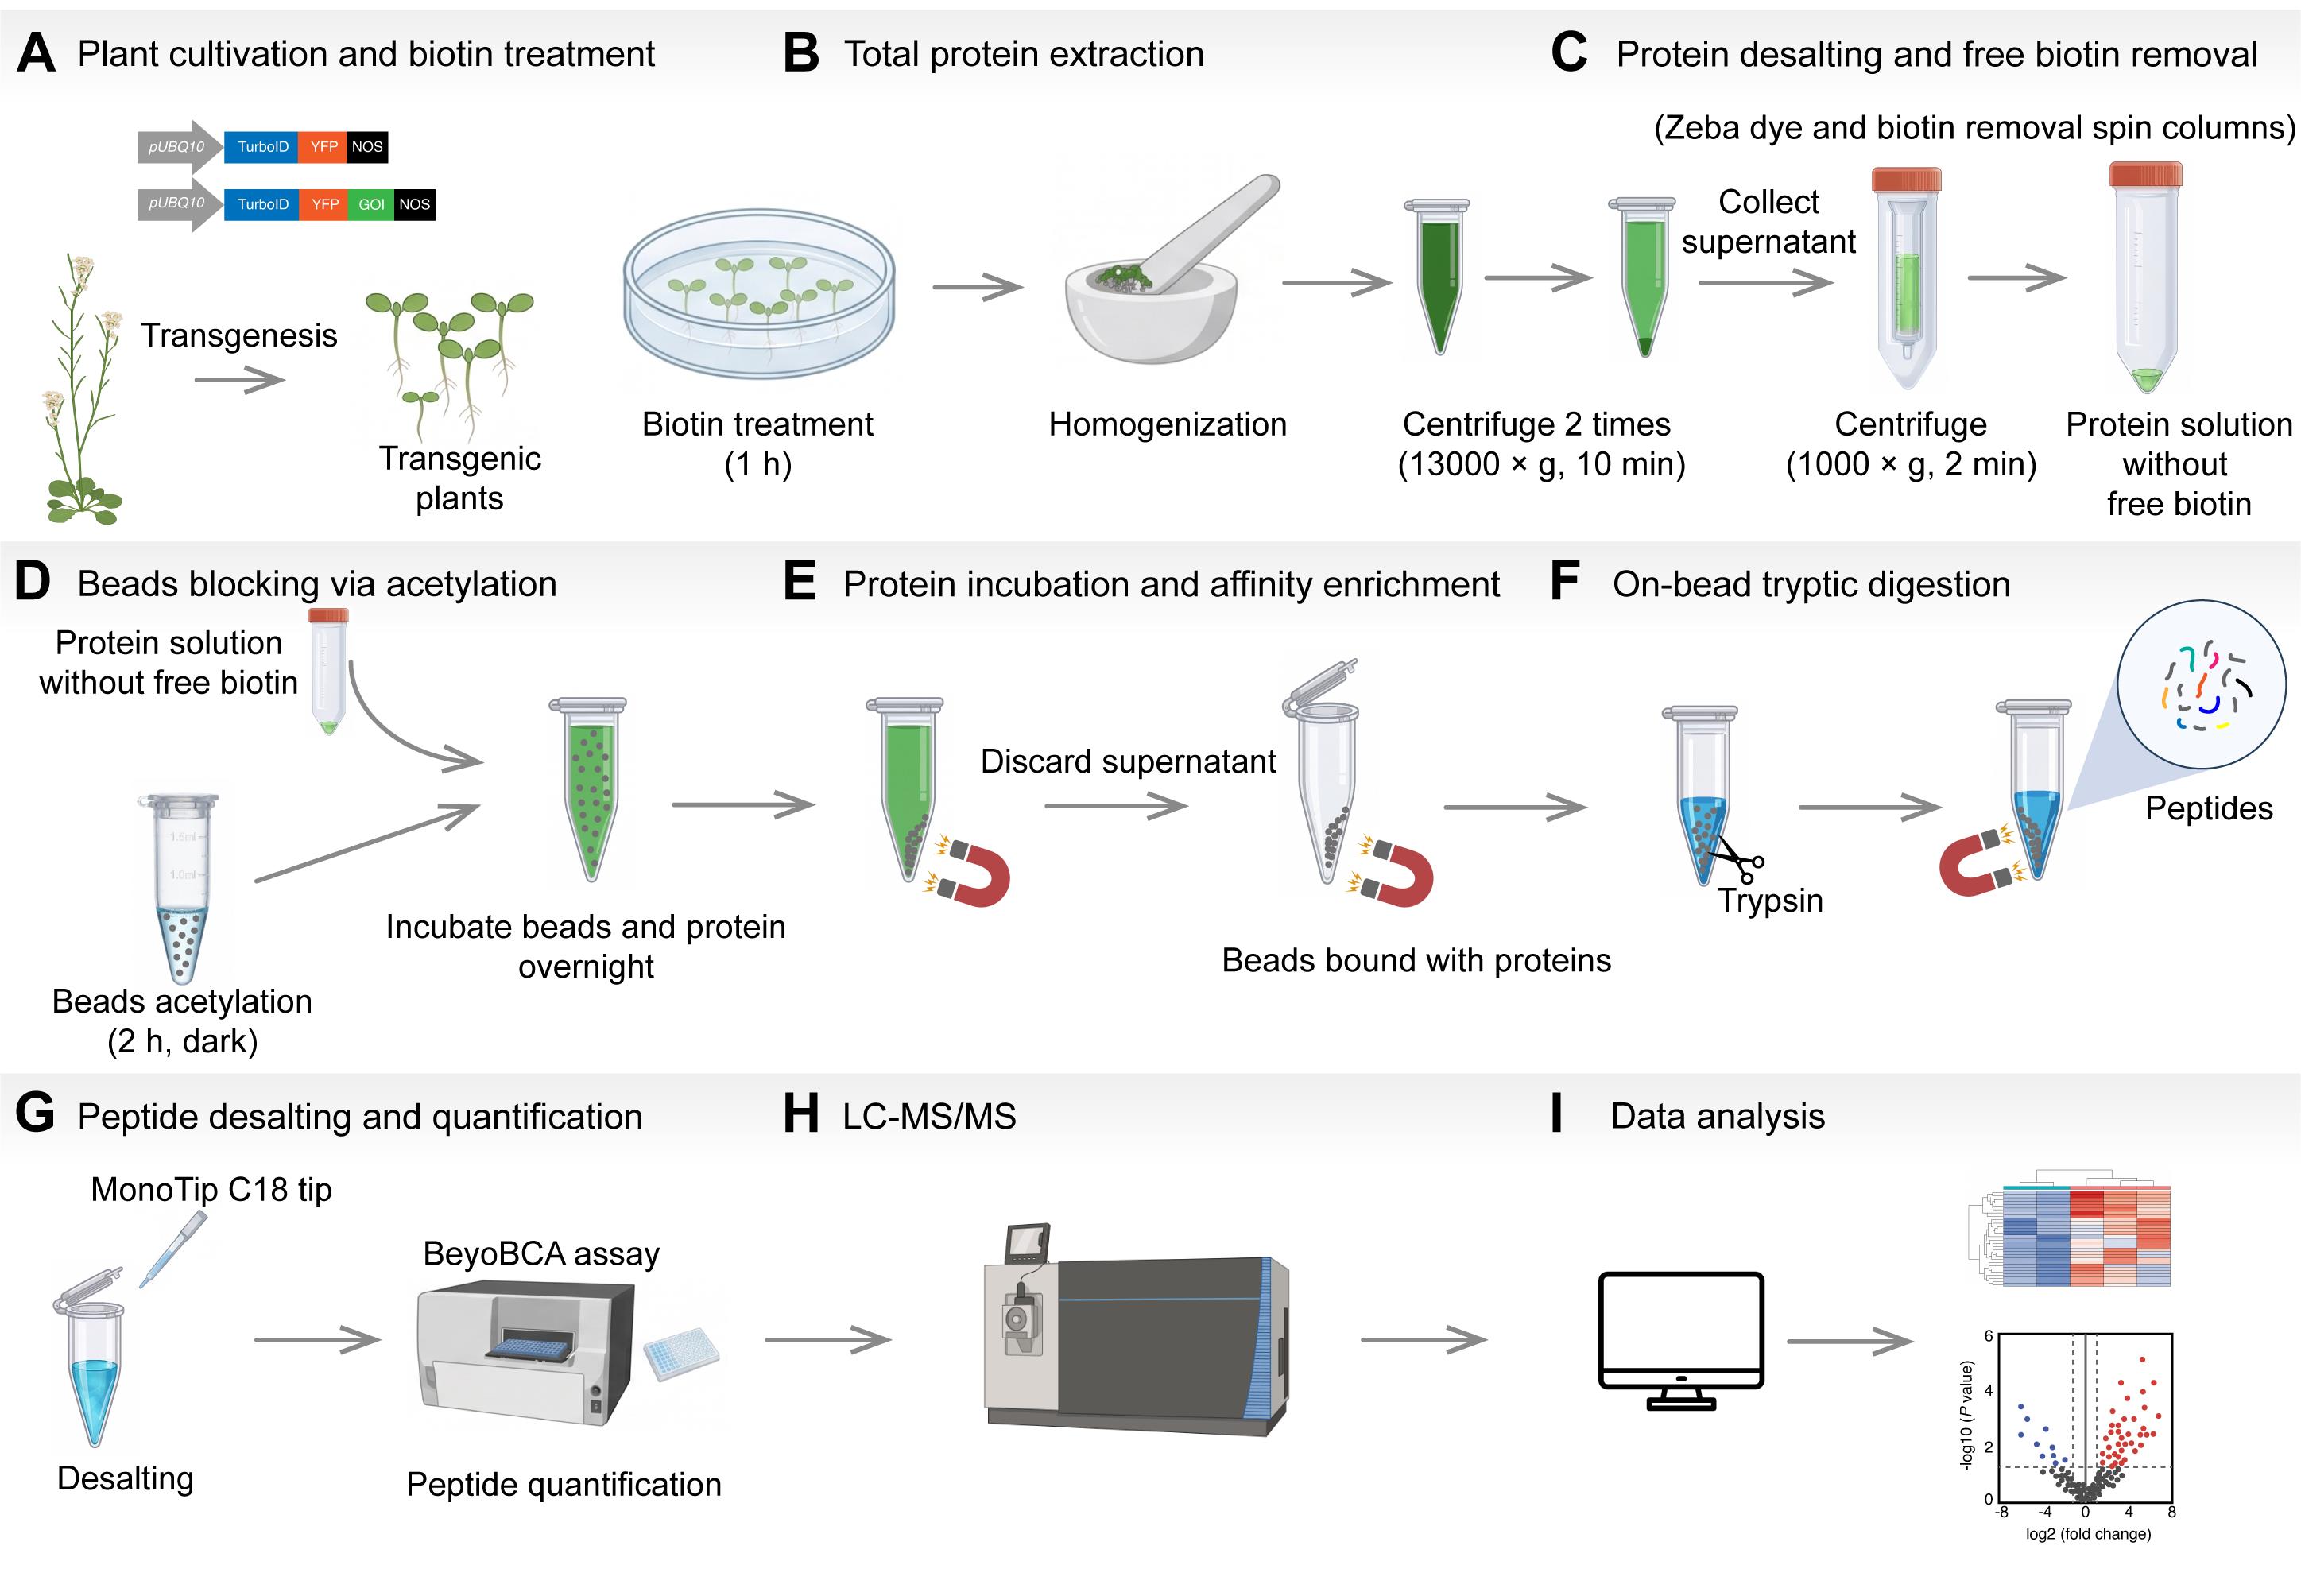
Workflow of TurboID biotinylated protein enrichment and mass spectrometry (MS) preprocessing in Arabidopsis thaliana. Complete experimental workflow for enrichment and MS preprocessing of biotinylated proteins via TurboID proximity labeling in Arabidopsis thaliana. The workflow consists of nine core steps: (A) plant cultivation and biotin treatment, (B) total protein extraction, (C) protein desalting and free biotin removal, (D) beads blocking via acetylation, (E) protein incubation and affinity enrichment of biotinylated proteins, (F) on-bead tryptic digestion, (G) peptide desalting and quantification, (H) mass spectrometry, and (I) proteomic data analysis. Parallel protein aliquots are reserved at each critical stage to perform quality control for protein loss throughout the entire pipeline.
Background
Protein–protein interactions (PPIs) govern most cellular biological processes. Nevertheless, conventional biochemical approaches such as co-immunoprecipitation show clear limitations in capturing weak and transient protein interactions. As a technique developed to address these drawbacks, proximity labeling (PL) works by fusing a labeling enzyme to a protein of interest to covalently tag its spatially neighboring proteins in living cells [1]. Two major classes of this technique are available: biotin-ligase-based systems represented by BioID, and peroxidase-based systems represented by APEX. Owing to the low signal-to-noise ratio (SNR) stemming from the high background activity of endogenous plant peroxidases, as well as cytotoxicity and stress effects caused by the substrate H2O2 in peroxidase-dependent approaches, BioID-based PL is therefore preferred for plant research [2]. Engineered from BioID, TurboID has been widely adopted in plant studies for its high catalytic activity, low cytotoxicity, and tolerance to a broad range of working temperatures [3]. Upon exogenous biotin supplementation, engineered TurboID produces short-lived, diffusible biotin-AMP intermediates that covalently modify the ε-amino groups of exposed lysine residues on proteins within an approximate 10 nm labeling radius. The biotin-tagged protein complexes or organellar components are affinity-enriched using streptavidin-coated magnetic beads and subsequently identified by mass spectrometry (MS)-based analysis [2].
Combined with quantitative proteomics, proximity-dependent biotinylation provides a powerful route to dissect plant subcellular protein interaction networks and identify key regulatory molecules within signaling pathways [4]. Capitalizing on its distinctive in vivo labeling capability, it broadens the scope of conventional interaction assays and supports mechanistic studies covering plant membrane trafficking, immune responses, and stress physiology [1,5–10].
Conventional preprocessing workflows for enriching biotinylated proteins from plant tissues suffer from multiple inherent technical limitations. The TurboID technique was originally developed using mammalian cell models. In animal systems, repeated PBS washing alone suffices to remove free biotin, yet this approach is entirely incompatible with plant tissues due to their complex endogenous biotin background. To address the technical bottleneck of high endogenous free biotin levels in plant tissues that cannot be eliminated via simple aqueous washing, Mair et al. (2019) standardized a PD-10 gel filtration desalting column procedure tailored for plant TurboID assays, which has been widely adopted as a core desalting step in subsequent plant TurboID experimental protocols [5].
Plant TurboID assays commonly employ lysis buffers containing high-concentration urea. When stored at low temperatures for extended periods, urea undergoes spontaneous decomposition to produce isocyanate, which induces artificial carbamylation modifications at the N-termini and lysine residues of proteins. Such modifications block tryptic cleavage sites, resulting in incomplete digestion and missed peptides; they additionally alter peptide physicochemical properties to reduce the number of proteins identified by MS. Furthermore, carbamylation interferes with tandem mass tags (TMT) and label-free quantification, amplifying quantitative errors and weakening experimental reproducibility [11]. Most published protocols omit acetylation blocking of streptavidin magnetic beads. Unblocked exposed lysine residues on streptavidin are simultaneously degraded by Lys-C and trypsin during digestion, generating abundant carrier-derived contaminant peptides that suppress signals from low-abundance interacting peptides. This limits the maximum loading volume for MS, impairs the efficiency of two-stage protease digestion, distorts quantitative results, and ultimately leads to the loss of low-abundance target proteins and poor experimental repeatability [12,13]. Moreover, nearly all universal workflows adopt a fixed bead dosage regardless of the gradient abundance of biotinylated proteins within samples. Fixed bead quantities easily saturate binding sites and fail to fully recover all biotin-labeled target proteins [14]. In addition, the vast majority of published protocols lack quality control (QC) designs involving parallel sample preservation at multiple experimental stages, making it impossible to track protein loss across the full workflow of lysis, desalting, bead enrichment, and protease digestion, which further compromises the reproducibility of experimental outcomes.
To address the above series of technical defects, this study establishes a standardized, complete preprocessing workflow tailored for Arabidopsis seedlings, covering the full pipeline from biotinylated protein enrichment to MS sample preparation. In this protocol, high-concentration 8 M urea lysis buffer is diluted to a final concentration of 2 M prior to desalting, which reduces urea content upfront and minimizes the risk of artificial carbamylation modifications originating from urea decomposition [15]. Meanwhile, Sulfo-NHS-acetate is introduced for magnetic bead acetylation blocking to shield free amino groups on bead surfaces and eliminate MS background interference caused by co-digestion of bead carriers [13,16]. Sequencing-grade modified trypsin is utilized for on-bead digestion with an optimized protein-to-protease mass ratio of 50:1, which is adjusted in accordance with commercial protease specifications to alleviate steric hindrance arising from protein immobilization on beads [7]. To mitigate incomplete digestion and peptide loss caused by bead-immobilized proteins, a two-step supplementary digestion strategy is implemented: primary overnight incubation with trypsin is followed by supplementation with half of the initial trypsin dosage for an additional 4 h, which markedly improves peptide coverage of target proteins [3,12,17]. At critical steps, including protein lysis, desalting purification, flowthrough fraction collection, and multiple rounds of bead washing, parallel protein aliquots are reserved separately for each sample. A dual quantitative system combining Coomassie Brilliant Blue semi-quantification and BeyoBCA peptide colorimetric quantification is integrated to enable comprehensive quality control over protein loss throughout all preprocessing and digestion steps. Notably, this full-process quality control framework has been robustly validated and successfully applied in our laboratory's published plant signaling pathway studies [9,10].
Compared with previously reported conventional preprocessing methods, this optimized workflow effectively elevates the total recovery rate of biotinylated proteins and SNR in quantitative MS analysis. Nevertheless, certain limitations remain. The bead acetylation blocking step requires a 2 h incubation in darkness, which prolongs the storage duration of desalted protein samples at 4 °C. Diluted low-concentration urea buffers exhibit poor stability; prolonged static storage at 4 °C accelerates urea decomposition and the continuous generation of isocyanate, introducing persistent artificial carbamylation. Therefore, clarified protein supernatants obtained after dilution and desalting must be subjected to magnetic bead enrichment and protease digestion as promptly as possible [11,18].
All buffer formulations and magnetic bead operating parameters of this workflow are optimized specifically for Arabidopsis leaf tissues. When applied to mammalian cells, fungi, or other heterologous biological materials, the full lysis and enrichment procedures require re-optimization. Beyond in vivo BioID/TurboID quantitative interactome analysis in Arabidopsis, this standardized preprocessing pipeline can be adapted for in vivo proximity labeling interactome profiling, plasma membrane surface biotinylated membrane proteome identification, and affinity enrichment experiments for diverse post-translational modifications such as ubiquitination via appropriate buffer optimization, replacement of affinity enrichment media, and supplementation with modification-specific inhibitors. This standardized protocol reduces systematic experimental bias and improves reproducibility, thereby providing stable and reliable preprocessing technical support for diverse plant interactome and post-translational proteomics research.
Materials and reagents
Biological materials
1. Arabidopsis thaliana Columbia-0 (Col-0)
2. Agrobacterium tumefaciens strain GV3101
3. Plasmid: pCAMBIA1300-pUBQ10::TurboID-EYFP
4. Plasmid: pCAMBIA1300-pUBQ10::TurboID-EYFP-ATG8a
5. Arabidopsis thaliana transgenic line pUBQ10::TurboID-EYFP
6. Arabidopsis thaliana transgenic line pUBQ10::TurboID-EYFP-ATG8a
Reagents
1. Sodium chloride (NaCl) (VETEC, catalog number: V900058)
2. Tris (hydroxymethyl) aminomethane (Tris base) (Sigma-Aldrich, catalog number: T1503-1KG)
3. Sodium deoxycholate (Sangon Biotech, catalog number: A600150-0050)
4. Urea (Sigma-Aldrich, catalog number: U1250-1KG)
5. Ammonium bicarbonate (Sangon Biotech, catalog number: A610032-0500)
6. Sodium dodecyl sulfate (SDS) (Sangon Biotech, catalog number: A600485-0500)
7. Bromophenol Blue (BPB) (Sangon Biotech, catalog number: A500922-0025)
8. Glycine (Sangon Biotech, catalog number: A610235-0005)
9. Sodium dihydrogen phosphate dihydrate (NaH2PO4·2H2O) (Guangzhou Chemical Reagent Factory, catalog number: BE13-AR-500G)
10. Disodium hydrogen phosphate dodecahydrate (Na2HPO4·12H2O) (Sangon Biotech, catalog number: A607793-0500)
11. Potassium chloride (KCl) (Sigma-Aldrich, catalog number: V900068-500G)
12. Sodium carbonate (Na2CO3) (VETEC, catalog number: V900801-500G)
13. Sodium bicarbonate (NaHCO3) (Sigma-Aldrich, catalog number: V900182)
14. Concentrated hydrochloric acid (HCl) (Tianjin Chemical Reagent Factory No.1, catalog number: SXH005)
15. Sodium hydroxide (NaOH) (Guangzhou Chemical Reagent Factory, catalog number: DS018-1)
16. Ammonium persulfate (APS) (Sangon Biotech, catalog number: A100486-0025)
17. Tween-20 (VETEC, catalog number: V900548)
18. HEPES (VETEC, catalog number: V900477-100G)
19. Sulfo-NHS-acetate (Aladdin, catalog number: S333917)
20. Dithiothreitol (DTT) (Sangon Biotech, catalog number: A620058-0005)
21. Iodoacetamide (IAM) (Sangon Biotech, catalog number: A600539-0005)
22. Formic acid (FA) [Guangzhou Chemical Reagent Factory (GCRF), catalog number: CB05]
23. Acetonitrile (ACN) (Sigma-Aldrich, catalog number: 34851-1L)
24. β-Mercaptoethanol (BME) (Sigma-Aldrich, catalog number: M3148-100ML)
25. Glycerol (Sangon Biotech, catalog number: A501745-0500)
26. 30% acrylamide-bisacrylamide mixed solution (Acry-bis) (Sangon Biotech, catalog number: B546017-0500)
27. Tetramethylethylenediamine (TEMED) (Sangon Biotech, catalog number: A610508-0100)
28. Dimethyl sulfoxide (DMSO) (VETEC, catalog number: V900090-500ML)
29. Protease inhibitor cocktail (PI) (GlpBio, catalog number: GK10014)
30. Sequencing-grade modified trypsin, porcine (Promega, catalog number: V511A)
31. BeyoBCA Peptide Quantitation Assay kit (colorimetric) (Beyotime Biotechnology, catalog number: P0397S)
32. BSA standard protein solution (2 mg/mL) (Sangon Biotech, catalog number: C900172-0010)
33. Coomassie Blue Fast Staining Solution (Zylome, catalog number: CS021-500 mL)
34. MS modified base salts with vitamins (Coolaber, catalog number: PM10111-100L)
35. Sucrose (Sigma-Aldrich VETEC, catalog number: V900116-500G)
36. Biotin (Sigma-Aldrich, catalog number: B4501-100MG)
37. Agar (Coolaber, catalog number: CA1331-1kg)
38. 1 mg/mL peptide standard (see Beyotime Biotechnology’s official website instructions)
39. BeyoBCA reagent A (see Beyotime Biotechnology’s official website instructions)
40. BeyoBCA reagent B (see Beyotime Biotechnology’s official website instructions)
41. BeyoBCA reagent C (see Beyotime Biotechnology’s official website instructions)
42. Clorox™ disinfecting bleach (Clorox, catalog number: CLO32251)
Solutions
1. 0 M urea dilution buffer (see Recipes)
2. 2 M urea washing buffer (see Recipes)
3. 4 M urea ammonium bicarbonate resuspension buffer (see Recipes)
4. 8 M urea denaturation buffer (see Recipes)
5. 20% Tween-20 stock solution (see Recipes)
6. HEPES-tween washing buffer 1 (buffer 1) (see Recipes)
7. 100 mM Sulfo-NHS-acetate stock solution (see Recipes)
8. Acetylation reaction mix (see Recipes)
9. Ammonium bicarbonate-tween washing buffer 2 (buffer 2) (see Recipes)
10. 100 mM DTT (see Recipes)
11. 400 mM IAM (see Recipes)
12. 25 mM ammonium bicarbonate stock solution (see Recipes)
13. 0.1 μg/μL sequencing-grade trypsin stock solution (see Recipes)
14. 20% formic acid (FA) (see Recipes)
15. 50% acetonitrile with 0.1% FA (see Recipes)
16. 0.1% FA (see Recipes)
17. 5× SDS-PAGE protein loading buffer (5× SDS) (see Recipes)
18. 5× SDS-PAGE electrophoresis buffer (see Recipes)
19. 3× separating buffer (see Recipes)
20. 5× stacking gel buffer (see Recipes)
21. Stacking gel mixture (see Recipes)
22. Separating gel mixture (see Recipes)
23. 1/2 MS culture medium formula (see Recipes)
24. 50 mM biotin stock solution (see Recipes)
25. 50 μM biotin stock solution (see Recipes)
Recipes
1. 0 M urea dilution buffer
| Reagent | Final concentration | Quantity or volume |
|---|---|---|
| NaCl | 150 mM | 0.1753 g |
| Tris base (MW = 121.14 g/mol) | 50 mM | 0.1211 g |
| Sodium deoxycholate | 0.5% (w/v) | 0.1 g |
| PI cocktail (add fresh right before use) | n/a | 200 μL |
| Milli-Q water | n/a | Add to a final volume of 20 mL after adjusting pH to 8.0 with HCl |
| Total | n/a | 20 mL |
2. 2 M urea washing buffer
| Reagent | Final concentration | Quantity or volume |
|---|---|---|
| Urea | 2 M | 12.012 g |
| NaCl | 150 mM | 0.8766 g |
| Tris base (MW = 121.14 g/mol) | 50 mM | 0.6057 g |
| Sodium deoxycholate | 0.5% (w/v) | 0.5 g |
| PI cocktail (add fresh right before use) | n/a | 1 mL |
| Milli-Q water | n/a | Add to a final volume of 100 mL after adjusting pH to 8.0 with HCl |
| Total | n/a | 100 mL |
3. 4 M urea ammonium bicarbonate resuspension buffer
| Reagent | Final concentration | Quantity or volume |
|---|---|---|
| Urea | 4 M | 1.2012 g |
| Ammonium bicarbonate | 25 mM | 0.0099 g |
| Milli-Q water | n/a | Add to final volume 5 mL |
| Total | n/a | 5 mL |
4. 8 M urea denaturation buffer
| Reagent | Final concentration | Quantity or volume |
|---|---|---|
| Urea | 8 M | 4.8048 g |
| NaCl | 150 mM | 0.0877 g |
| Tris base (MW = 121.14 g/mol) | 50 mM | 0.0606 g |
| Sodium deoxycholate | 0.5% (w/v) | 0.05 g |
| PI cocktail (add fresh right before use) | n/a | 100 μL |
| Milli-Q water | n/a | Add to a final volume of 10 mL after adjusting pH to 8.0 with HCl |
| Total | n/a | 10 mL |
5. 20% Tween-20 stock solution
| Reagent | Final concentration | Quantity or volume |
|---|---|---|
| 100% Tween-20 | 20% (v/v) | 10 mL |
| Milli-Q water | n/a | Add to a final volume of 50 mL |
| Total | n/a | 50 mL |
6. Buffer 1
| Reagent | Final concentration | Quantity or volume |
|---|---|---|
| HEPES | 50 mM | 0.1192 g |
| 20% (v/v) Tween-20 stock | 0.2% (v/v) | 100 μL (equivalent to 20 μL of pure undiluted 100% Tween-20) |
| Milli-Q water | n/a | Add to a final volume of 10 mL after adjusting pH to 7.8 with NaOH |
| Total | n/a | 10 mL |
7. 100 mM Sulfo-NHS-acetate stock solution
| Reagent | Final concentration | Quantity or volume |
|---|---|---|
| Sulfo-NHS-acetate | 100 mM | 0.00259 g |
| DMSO | n/a | Add to final volume 100 μL |
| Total | n/a | 100 μL |
8. Acetylation reaction mix
| Reagent | Final concentration | Quantity or volume |
|---|---|---|
| Buffer 1 | n/a | 380 μL |
| 100 mM Sulfo-NHS-acetate stock solution | 5 mM | 20 μL |
| Total | n/a | 400 μL |
9. Buffer 2
| Reagent | Final concentration | Quantity or volume |
|---|---|---|
| Ammonium bicarbonate | 50 mM | 0.04 g |
| 20% (v/v) Tween-20 stock | 0.2% (v/v) | 100 μL |
| Milli-Q water | n/a | Add to a final volume of 10 mL |
| Total | n/a | 10 mL |
10. 100 mM DTT
| Reagent | Final concentration | Quantity or volume |
|---|---|---|
| Dithiothreitol (DTT, MW = 154.25 g/mol) | 100 mM | 0.0154 g |
| Milli-Q water | n/a | Add to final volume 1 mL |
| Total | n/a | 1 mL |
11. 400 mM IAM
| Reagent | Final concentration | Quantity or volume |
|---|---|---|
| IAM, MW = 185.0 g/mol | 400 mM | 0.074 g |
| Milli-Q water | n/a | Add to final volume 1 mL |
| Total | n/a | 1 mL |
12. 25 mM ammonium bicarbonate stock solution
| Reagent | Final concentration | Quantity or volume |
|---|---|---|
| Ammonium bicarbonate | 25 mM | 0.0198 g |
| Milli-Q water | n/a | Add to final volume 10 mL |
| Total | n/a | 10 mL |
13. 0.1 μg/μL sequencing-grade trypsin stock solution
| Reagent | Final concentration | Quantity or volume |
|---|---|---|
| Sequencing-grade trypsin dry powder | 0.1 μg/μL | Appropriate amount of trypsin powder |
| Manufacturer-supplied reconstitution buffer | n/a | Add to fix the final volume to reach 0.1 μg/μL |
Dissolve trypsin dry powder exclusively with the reconstitution buffer provided by the manufacturer; do not use other solvents.
14. 20% FA
| Reagent | Final concentration | Quantity or volume |
|---|---|---|
| Pure FA | 20% (v/v) | 20 μL |
| Milli-Q water | n/a | 80 μL |
| Total | n/a | 100 μL |
15. 50% acetonitrile with 0.1% FA
| Reagent | Final concentration | Quantity or volume |
|---|---|---|
| Pure ACN | 50% (v/v) | 5 mL |
| Pure FA | 0.1% (v/v) | 10 μL |
| Milli-Q water | n/a | Add to a final volume of 10 mL |
| Total | n/a | 10 mL |
16. 0.1% FA
| Reagent | Final concentration | Quantity or volume |
|---|---|---|
| Pure FA | 0.1% (v/v) | 10 μL |
| Milli-Q water | n/a | Add to a final volume of 10 mL |
| Total | n/a | 10 mL |
17. 5× SDS-PAGE protein loading buffer (5× SDS)
| Reagent | Final concentration | Quantity or volume |
|---|---|---|
| Tris base (MW = 121.14 g/mol) | 50 mM | 0.3029 g |
| SDS | 2% (w/v) | 1 g |
| BPB | 0.1% (w/v) | 50 mg |
| Glycerol | 10% (v/v) | 5 mL |
| BME | 1% (v/v) | 500 μL |
| Milli-Q water | n/a | Add to a final volume of 50 mL after adjusting pH to 6.8 with HCl |
| Total | n/a | 50 mL |
Mix thoroughly, aliquot into 0.5 mL per tube, and store at 4 °C.
18. 5× SDS-PAGE electrophoresis buffer
| Reagent | Final concentration | Quantity or volume |
|---|---|---|
| Tris base (MW = 121.14 g/mol) | 125 mM | 15.14 g |
| Glycine | 960 mM | 72.05 g |
| SDS | 0.5% (w/v) | 5 g |
| Milli-Q water | n/a | Add to a final volume of 1 L after adjusting pH to 8.3 with HCl |
| Total | n/a | 1 L |
Note: Dilute the 5× stock buffer to 1× working concentration with Milli-Q water prior to each electrophoresis run.
19. 3× separating buffer
| Reagent | Final concentration | Quantity or volume |
|---|---|---|
| Tris base (MW = 121.14 g/mol) | 1.125 M | 27.24 g |
| SDS | 0.3% (w/v) | 0.6 g |
| Milli-Q water | n/a | Adjust volume to 200 mL after adjusting pH to 8.8 with HCl |
| Total | n/a | 200 mL |
20. 5× stacking gel buffer
| Reagent | Final concentration | Quantity or volume |
|---|---|---|
| Tris base (MW = 121.14 g/mol) | 0.5 M | 12.11 g |
| SDS | 0.4% (w/v) | 0.8 g |
| Milli-Q water | n/a | Adjust volume to 200 mL after adjusting pH to 6.8 with HCl |
| Total | n/a | 200 mL |
21. Stacking gel mixture
| Reagent | Final concentration | Quantity or volume |
|---|---|---|
| 30% Acry-bis | 5% | 833 μL |
| 5× stacking gel buffer | 1× | 1 mL |
| Milli-Q water | n/a | 3.167 mL |
| 30% APS | 0.12% (w/v) | 20 μL |
| TEMED | 0.1% (v/v) | 5 μL |
| Total | n/a | 5 mL |
22. Separating gel mixture
| Reagent | Final concentration | Quantity or volume |
|---|---|---|
| 30% Acry-bis | 10% | 3.33 mL |
| 3× separating gel buffer | 1× | 3.33 mL |
| Milli-Q water | n/a | 3.33 mL |
| 30% APS | 0.075% (w/v) | 25 μL |
| TEMED | 0.0625% (v/v) | 6.25 μL |
| Total | n/a | 10 mL |
23. 1/2 MS culture medium formula
| Reagent | Final concentration | Quantity or volume |
|---|---|---|
| MS modified base salts with vitamins | 0.5× | 2.2 g |
| Sucrose | 30 mM | 10 g |
| Milli-Q water | n/a | Adjust volume to 1 L after adjusting pH to 5.7 with HCl |
| Total | n/a | 1 L |
For solid 1/2 MS medium, add 7.5 g of agar per liter of liquid 1/2 MS medium.
24. 50 mM biotin stock solution
| Reagent | Final concentration | Quantity or volume |
|---|---|---|
| Biotin | 50 mM | 0.0122 g |
| DMSO | n/a | Adjust volume to 1 mL |
| Total | n/a | 1 mL |
25. 50 μM biotin stock solution
| Reagent | Final concentration | Quantity or volume |
|---|---|---|
| 50 mM biotin stock solution | 50 μM | 50 μL |
| 1/2 MS liquid medium | n/a | Adjust volume to 50 mL |
| Total | n/a | 50 mL |
Laboratory supplies
1. 1.5 mL polypropylene microcentrifuge tubes (Biosharp, catalog number: BS-15-M)
2. 2.0 mL polypropylene microcentrifuge tubes (Biosharp, catalog number: BS-20-M)
3. Low protein binding 1.5 mL microcentrifuge tubes (Thermo Scientific, catalog number: 90410)
4. 1,000 μL blue pipette tips (Biosharp, catalog number: BS-1000-T)
5. 200 μL yellow pipette tips (Biosharp, catalog number: BS-200-T)
6. 10 μL clear pipette tips (Biosharp, catalog number: BS-10-T)
7. 50 mL polypropylene centrifuge tubes (Corning, catalog number: 430829)
8. 15 mL polypropylene centrifuge tubes (Corning, catalog number: 430791)
9. 0.5–10 μL filter pipette tips, racked (Axygen, catalog number: TF-300-L-R-S)
10. 1–200 μL filter pipette tips, racked (Axygen, catalog number: TF-200-L-R-S)
11. 100–1,000 μL filter pipette tips, racked (Axygen, catalog number: TF-1000-L-R-S)
12. MonoTip C18 extraction tips, 200 μL (GL Sciences Inc., catalog number: 5010-21000)
13. ZebaTM dye and biotin removal columns, 5 mL (Thermo Scientific, catalog number: A44301)
14. Streptavidin magnetic beads, 5 mL (Smart-Lifesciences, catalog number: SM007005)
15. Sterile cell culture plates, 96-well flat bottom (Corning, catalog number: 3599)
16. Petri dish BS-90-D (Lablogic Technology, catalog number: BS-90-D)
17. 6-well cell culture plate (NEST, catalog number: 723321)
Equipment
1. Heraeus Pico 17 microcentrifuge (Thermo Fisher Scientific, catalog number: 75002410)
2. Bio-Rad Protein Electrophoresis System (Bio-Rad Laboratories, Inc.)
3. Dry bath incubator (Shanghai Baba Industrial Co., Ltd., model: GDC-100)
4. Rotational incubator (Haimen Kylin-Bell Instrument Manufacturing Co., Ltd., model: QB-128)
5. Reciprocating decolorizing shaker (Hangzhou Miulab Instrument Co., Ltd., model: TS-300S)
6. Water-jacketed incubator (Shanghai Xinmiao Medical Device Manufacturing Co., Ltd., model: GNP-9050BS-III)
7. Model 4-5 benchtop low-speed centrifuge (TOMOS Scientific Instruments, model: 4-5)
8. Heraeus Fresco 17 refrigerated microcentrifuge (Thermo Fisher Scientific, catalog number: 75002420)
9. Micro-Volume UV-Vis Spectrophotometer (Wuxi Bioteke Biotechnology Co., Ltd., model: ND5000)
10. Vacuum Concentrator Plus (Eppendorf, model: 5305)
11. EnSpire Multimode Plate Reader (PerkinElmer, model: 2300)
12. Orbitrap Astral Mass Spectrometer (Thermo Fisher Scientific)
13. Tissue culture incubator (Ruihua, model: TCC-15)
Software and datasets
1. Spectronaut (DIA proteomic data analysis); Spectronaut, Biognosys AG, Version 20.0; Source: https://biognosys.com/software/spectronaut/, accessed 04/27/2026
2. MaxQuant (DDA proteomic data analysis); MaxQuant, Version v2.8.1.0; Source: https://maxquant.org, accessed 07/19/2026
3. Reference Protein Databases for Arabidopsis thaliana: Dataset: Araport11_pep_20250411.fasta (48,354 protein entries); Source: https://www.arabidopsis.org/download/list?dir=Proteins%2FAraport11_protein_lists, accessed 04/27/2026; license: free public academic use
Procedure
Note: The following procedures are carried out at 4 °C unless specified.
A. Arabidopsis cultivation and biotin treatment
1. Construct generation: For proximity labeling experiments, first select the bait protein(s) based on their specific research goals. This protocol takes ATG8a as an example. The coding sequence (CDS) of ATG8a (TAIR ID: AT4G21980) was amplified and cloned into a custom-built binary vector based on the pCAMBIA1300 backbone under the control of the ubiquitin promoter (pUBQ10). Two main expression constructs were generated in-house via recombination-based cloning. Bait construct: pCAMBIA1300-pUBQ10::TurboID-EYFP-ATG8a (Figure 1); control construct: pCAMBIA1300-pUBQ10::TurboID-EYFP.
Note: The fusion of TurboID to either the N- or C-terminus of the target protein depends on the specific protein of interest. For cytosolic proteins, fusion at either terminus is generally acceptable, provided that the tag does not impair protein function. However, for membrane-bound proteins, the membrane topology must be determined prior to deciding the optimal terminus for TurboID fusion.
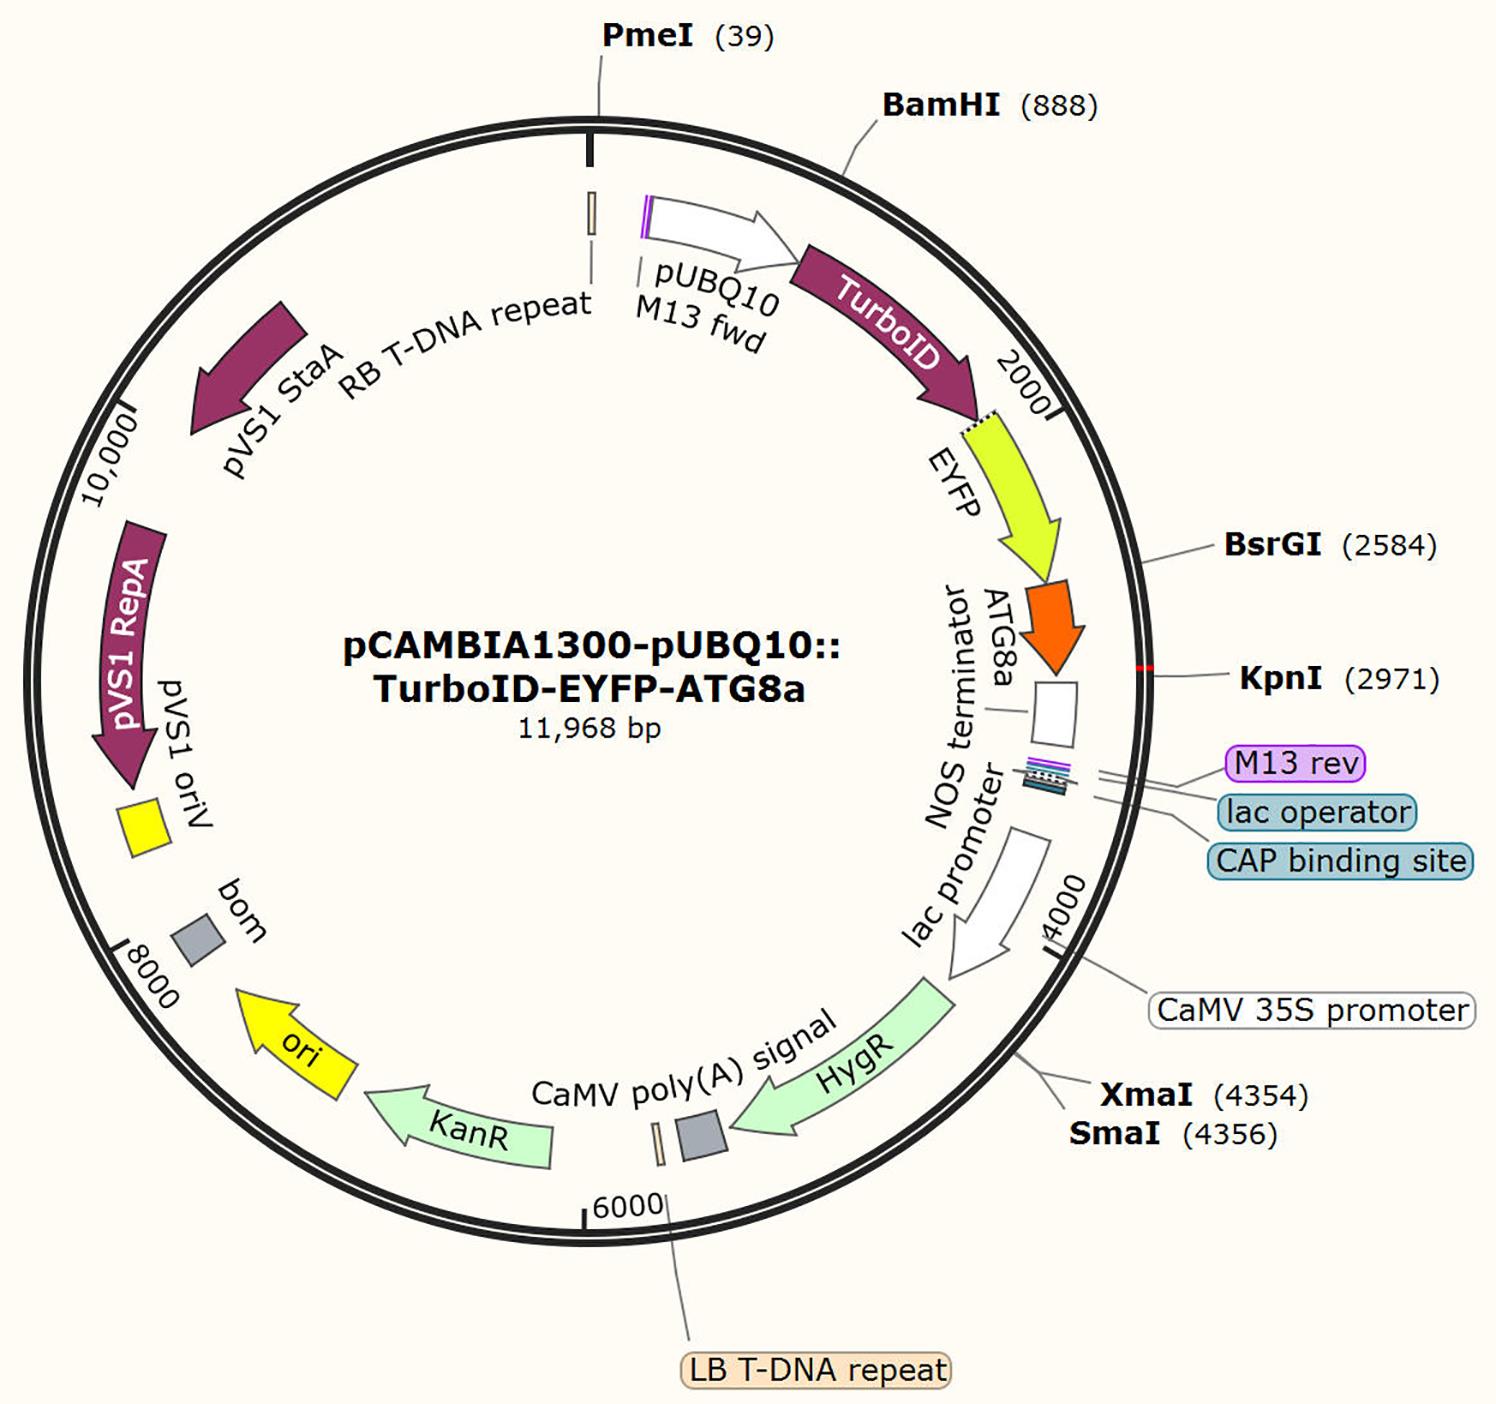
Figure 1. Plasmid map of pCAMBIA1300-pUBQ10::TurboID-EYFP-ATG8a
2. Plant transformation: Sequence-verified binary plasmids were transformed into Agrobacterium tumefaciens strain GV3101 via electroporation. The Agrobacterium harboring the corresponding construct was subsequently used to infect wild-type Arabidopsis thaliana (Col-0) via the floral dip method. Transgenic plants were selected using hygromycin resistance screening. Stable transgenic lines expressing the fusion proteins were further confirmed by immunoblotting with anti-GFP/EYFP antibodies prior to proximity labeling assays.
3. Surface-sterilize an appropriate amount of Arabidopsis seeds with 30% (v/v) Clorox bleach solution for 10 min, followed by washing at least five times with sterile Milli-Q water. Sow the seeds onto 1/2 MS solid medium and stratify them at 4 °C in darkness for two days. Place the plates vertically in a long-day growth chamber (16/8 h light/dark, 22 °C) and cultivate for 7 days.
4. Prepare 50 mM biotin solution using DMSO as the solvent (see Recipe 24), then dilute this stock solution to a final concentration of 50 μM using 1/2 MS liquid medium (see Recipe 25). Pipette 5 mL of biotin solution into each well of a clean 6-well plate and mark each well clearly.
5. Select Arabidopsis seedlings with consistent growth status. Three biological replicates are recommended (0.2 g of fresh weight each, yielding 15–25 μg of peptides per replicate), with each replicate processed independently throughout all downstream steps. Submerge the seedlings in Milli-Q water and shake gently to remove residual medium on the surface, then blot up excess water with clean filter paper. Fully immerse the seedlings in the biotin solution and incubate in a plant growth chamber for 1 h to complete biotin labeling.
6. Once the incubation finishes, rapidly transfer seedlings into pre-cooled Milli-Q water and rinse 2–3 times to terminate the biotin labeling reaction. Blot surface moisture of seedlings with filter paper, transfer them into centrifuge tubes, snap-freeze the tubes in liquid nitrogen, and store samples at -80 °C for subsequent experiments.
Note: The biotin treatment duration depends on the activity of the biotin ligase in different transgenic lines expressing target protein-ligase fusions. Therefore, for transgenic lines with unknown activity, it is recommended to evaluate biotin ligase activity in advance to determine the optimal treatment time.
B. Total protein extraction
1. Extract total Arabidopsis protein. Retrieve Arabidopsis tissue samples from liquid nitrogen and rapidly grind the samples into fine powder in a pre-cooled mortar. Add 8 M urea denaturation buffer supplemented with protease inhibitor cocktail (PI) and grind thoroughly. Use 1 mL of buffer per 0.7 g of plant tissue, and supplement 10 μL of PI per 1 mL of buffer (see Recipes for detailed formulations).
Caution: Wear gloves to avoid cryogenic burns from liquid nitrogen.
2. Lyse tissue and perform the first centrifugation. Transfer the homogenate into 1.5 or 2 mL polypropylene microcentrifuge tubes, incubate at 4 °C for 10 min to achieve complete lysis, then centrifuge at 13,000× g for 10 min at 4 °C.
3. Clarify the lysate via secondary centrifugation. Transfer the supernatant to new microcentrifuge tubes on ice and centrifuge again at 13,000× g for 10 min at 4 °C to remove residual insoluble debris.
4. Dilute lysate to reduce urea concentration. For each sample in its 1.5 or 2 mL microcentrifuge tube on ice, add 0 M urea dilution buffer at three times the volume of the initial 8 M urea denaturation buffer to reduce the urea concentration to 2 M. Retain the diluted protein supernatant for subsequent desalting.
5. Reserve an aliquot of protein lysate. Mix 40 μL of diluted protein supernatant with 10 μL of 5× SDS-PAGE protein loading buffer, heat the mixture at 95 °C for 10 min for denaturation, and store the denatured sample at -80 °C for further validation.
Note: After total protein extraction, western blot analysis is recommended to verify the presence of biotinylated proteins.
C. Protein desalting and free biotin removal
1. Pre-equilibrate desalting columns. Cut off the bottom tip of the desalting column, place the column inside a 15 mL centrifuge tube, loosen the column cap, and centrifuge at 1,000× g for 2 min at room temperature. Discard all flowthrough waste liquid.
2. Wash and equilibrate the column matrix. Load 2 M urea washing buffer onto the column, centrifuge at 1,000× g for 2 min, and discard the flowthrough. Repeat this washing procedure three times in total.
3. Load protein sample and perform desalting. Transfer the washed column to a new 15 mL centrifuge tube. Slowly load the diluted protein supernatant obtained from step B4 onto the column matrix. After full liquid absorption, centrifuge at 1,000× g for 2 min and collect the desalted protein eluate. Transfer equal volumes of the eluted protein from each sample into new 1.5 or 2 mL microcentrifuge tubes.
4. Reserve desalted protein aliquot for storage. Mix 40 μL of desalted protein eluate from each tube with 10 μL of 5× SDS-PAGE protein loading buffer, heat at 95 °C in a metal bath for 10 min, and store at -80 °C. Retain the remaining desalted protein for incubation with streptavidin magnetic beads.
5. Quantify protein concentration and temporarily store samples. For colorless protein samples such as Arabidopsis root extracts, total protein concentration can be determined with an ultra-micro UV spectrophotometer by measuring the intrinsic A280 absorbance originating from tryptophan and tyrosine residues in proteins. Pigmented samples like Arabidopsis leaf lysates will interfere with quantification via UV spectrophotometry. To circumvent this limitation, use Coomassie Blue Fast Staining Solution for semi-quantification of total plant protein to calculate protein mass. If the total protein yield from sample harvesting is relatively high, pre-dilute the reserved samples from step C4 according to protein content. Dilution ratios of 1:5 or 1:10 are recommended. Prepare a concentration gradient of 0.25, 0.5, 1, 2, and 3 μg of BSA standards. Prepare an SDS-PAGE gel consisting of a separating and a stacking gel (see Recipes) and dilute the 5× SDS-PAGE electrophoresis buffer to 1×. Load the serially diluted BSA standards alongside the denatured protein samples from step C4 onto the gel. Perform electrophoresis according to standard procedures (or manufacturer's instructions) until the dye front reaches the gel bottom. Finally, stain the gel with Coomassie Blue and estimate the total protein yield of your samples by comparing their overall lane intensity (gray values) against the BSA standard curve (Figure 2).
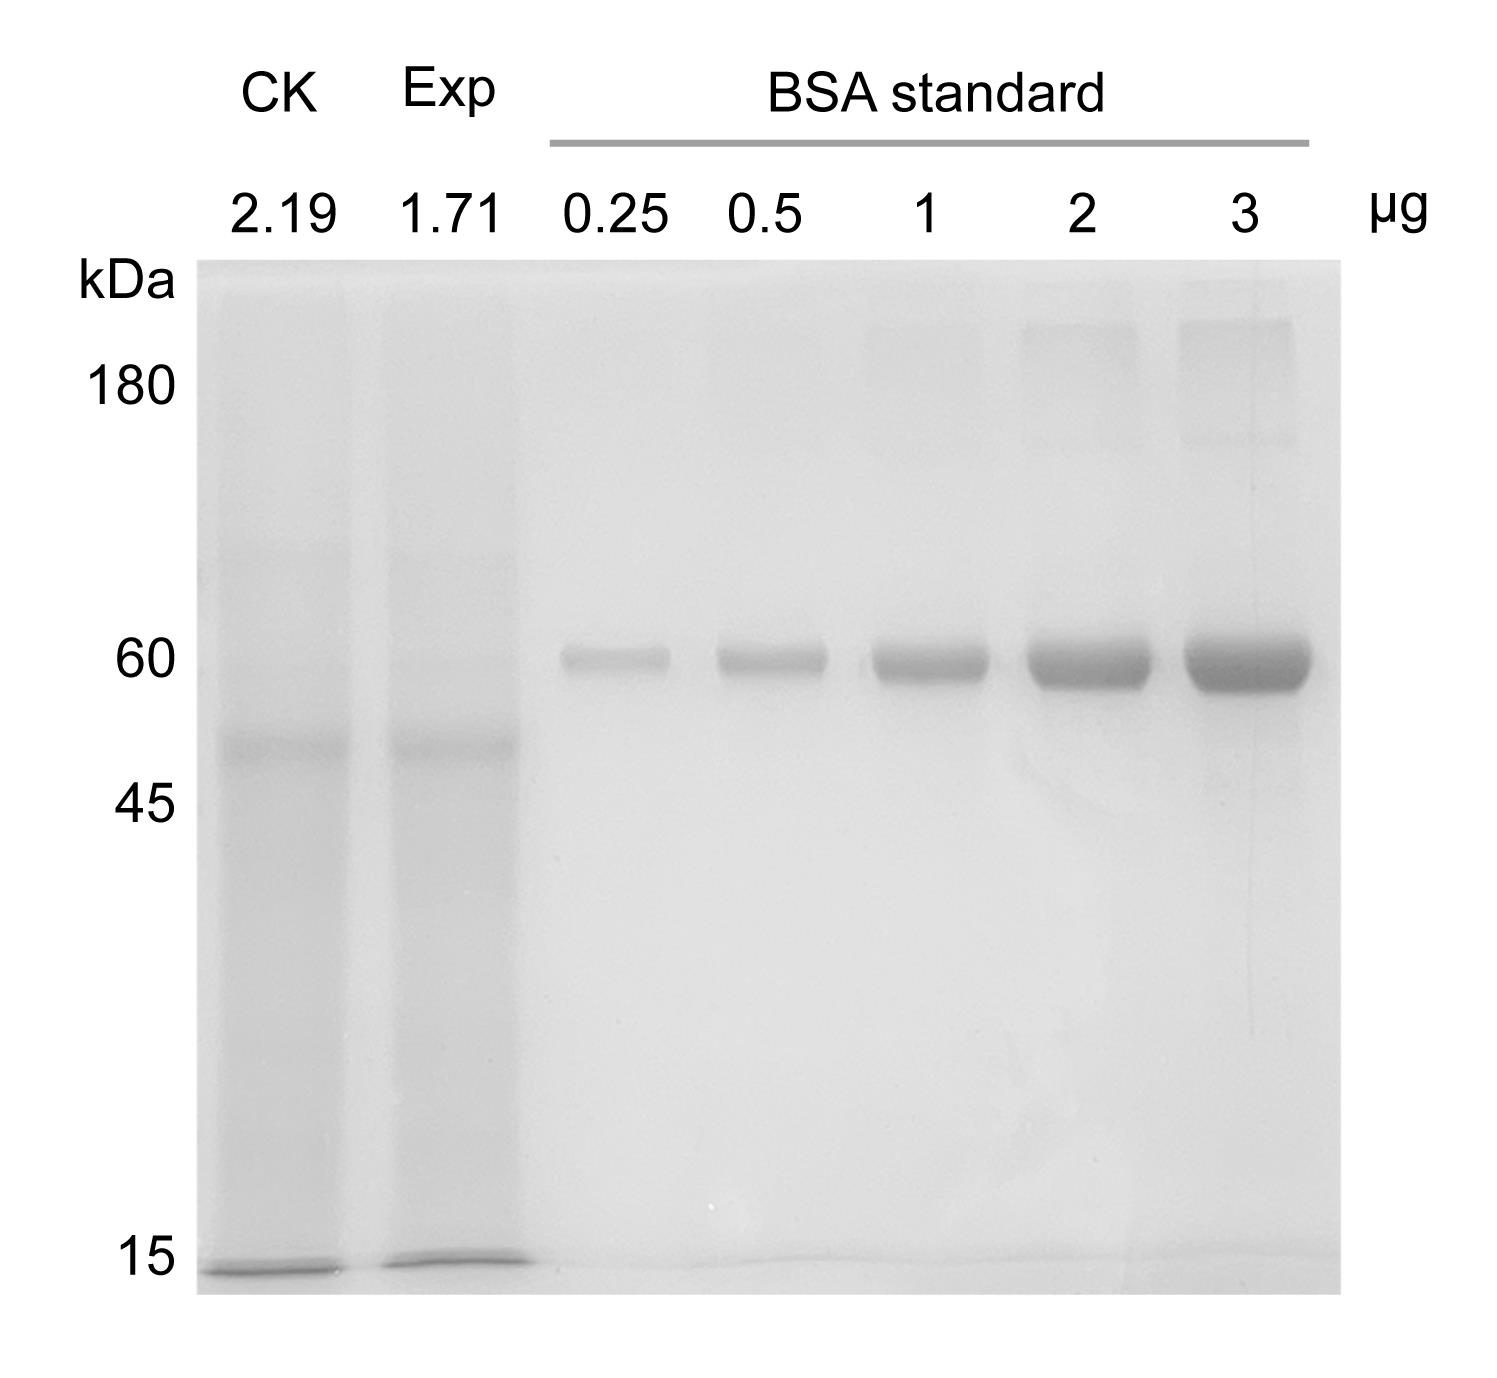
Figure 2. Semi-quantification of total input plant protein by Coomassie blue–stained SDS-PAGE. Serially diluted BSA standard protein solution was included for gray-intensity calibration. Band intensities of control (CK) and experimental samples were compared against the 0.25, 0.5, 1, 2, and 3 μg BSA standards to calculate the total protein yield. Samples with high protein concentration were pre-diluted at a ratio of 1:5 or 1:10 prior to electrophoresis. Gray analysis was performed on regions corresponding to BSA standard bands (~60 kDa). A standard curve was fitted using the loaded BSA mass as the independent variable and the integrated band intensity as the dependent variable, with the regression equation Y = 23846X + 2168.1 and coefficient of determination R2 = 0.9987. Regions of interest (ROIs) identical to those used for BSA quantification were applied to bands from the CK and experimental groups. The band intensity values were substituted into the regression equation to calculate the protein mass of samples, and the total protein content of each replicate was computed according to the dilution factor.
Critical: Do not store samples at 4 °C longer than 12 h. Extended storage triggers non-enzymatic methionine oxidation and lysine carbamylation artifacts, which introduce severe bias to quantitative proteomics data.
Pause point: Desalted protein supernatant containing PI and diluted to 2 M urea can be stored at 4 °C for a maximum of 12 h prior to streptavidin bead enrichment for quantitative mass spectrometry.
D. Beads blocking via acetylation
1. Aliquot and pre-wash streptavidin magnetic beads. Prepare 1.5 mL microcentrifuge tubes in triplicate for technical replicates. Fully resuspend the streptavidin magnetic bead slurry, then dispense 150 μL of bead slurry into each tube (adjust bead volume according to quantified total protein; 160 μL of bead slurry per 20 mg of total protein). Supplement each tube with 1 mL of buffer 1, incubate with rotary agitation at 4 °C for 5 min, separate beads with a magnetic rack, and discard supernatant. Repeat the buffer 1 washing cycle three times in total.
2. Block streptavidin magnetic beads by acetylation. Discard the final wash supernatant and resuspend bead pellets in acetylation reaction mix (380 μL of buffer 1 plus 20 μL of 100 mM Sulfo-NHS-acetate stock solution per sample). Wrap tubes in aluminum foil to avoid light exposure, incubate with continuous rotary mixing at 4 °C for 2 h, and invert tubes intermittently during incubation.
3. Wash beads post-acetylation. Separate beads on a magnetic rack and discard the acetylation reaction mix. Add 1 mL of buffer 2 to each tube, incubate with rotary mixing, remove supernatant, and repeat this washing procedure three times.
4. Store blocked beads on ice for subsequent protein binding.
E. Protein incubation and affinity enrichment of biotinylated proteins
1. Equilibrate blocked magnetic beads. Wash blocked streptavidin beads three times with 1 mL of 2 M urea washing buffer on ice.
2. Incubate beads with desalted protein for target binding. Discard the final equilibration buffer, add desalted protein supernatant to bead pellets, and mix gently by pipetting. Wrap tubes with aluminum foil for light protection and incubate with continuous rotary agitation at 4 °C overnight (12–16 h).
3. Reserve a flowthrough aliquot. After incubation, perform brief pulse centrifugation and separate beads with a magnetic rack. Collect 40 μL of flowthrough supernatant, mix with 10 μL of 5× SDS-PAGE protein loading buffer, heat at 95 °C for 10 min, and store at -80 °C.
4. Wash beads and reserve a wash fraction aliquot. Discard the flowthrough liquid via magnetic separation, add 1 mL of 2 M urea washing buffer supplemented with protease inhibitor to each tube, and incubate with rotary shaking at 4 °C for 5 min per wash cycle. Complete eight independent wash cycles. After the eighth wash, fully remove the final wash buffer using a magnetic rack. Resuspend the bead pellet in 200 μL of 2 M urea washing buffer and homogenize by repeated vigorous pipetting. Immediately transfer 20 μL of the well-mixed bead slurry (10% of total beads) to a new microcentrifuge tube, add 5 μL of 5× SDS-PAGE protein loading buffer, and heat at 95 °C for 10 min. Following heating, pellet beads on a magnetic rack. From the resulting 25 μL cleared supernatant, take 12.5 μL for Coomassie semi-quantification (protein from 5% of total beads). If additional protein assays are required, take 2.5 μL of the same supernatant and adjust the volume with SDS-PAGE loading mixture for gel electrophoresis (protein from 1% of total beads). Store all aliquots at -80 °C.
5. Semi-quantify captured biotinylated protein via Coomassie staining. Use Coomassie Blue Fast Staining Solution to semi-quantify biotinylated protein bound to magnetic beads and determine the required volume of sequencing-grade modified trypsin. Prepare a concentration gradient of 0.1, 0.25, 0.5, 1, and 1.5 μg of BSA standard protein solution; load the denatured reserved samples from step E4 alongside. Estimate total bead-bound protein mass by comparing band gray intensities.
6. Remove all residual wash buffer completely and retain bead pellets for on-bead proteolytic digestion.
F. On-bead digestion of biotin-enriched proteins
1. Resuspend washed bead pellets on ice in 100 μL of 4 M urea ammonium bicarbonate resuspension buffer.
2. Reduce disulfide bonds. Add 5 μL of 100 mM DTT stock solution, mix thoroughly by pipetting, incubate at 25 °C in a light-protected metal bath for 30 min, then perform brief pulse centrifugation.
3. Block free thiol groups. Add 5 μL of 400 mM IAM stock solution, mix completely by pipetting, incubate at 25 °C with light protection for 30 min, then pulse-centrifuge briefly.
4. Exchange buffer via bead washing. Add 1 mL of 25 mM ammonium bicarbonate stock solution to resuspend beads, separate beads magnetically, and discard supernatant.
5. Perform two-step on-bead tryptic digestion. Add sequencing-grade modified trypsin at 0.5 μg (protein:trypsin mass ratio of 50:1), and adjust total reaction volume to 100 μL with 25 mM ammonium bicarbonate stock solution. Incubate samples in a metal bath with intermittent shaking overnight at 37 °C in the dark. Supplement with an additional 0.25 μg of sequencing-grade modified trypsin (50% of the initial trypsin dosage) and continue digestion at 37 °C with intermittent shaking for another 4 h.
6. Prepare peptide lysate for C18 desalting. Capture beads with a magnetic rack and transfer the digested peptide supernatant to a new microcentrifuge tube. Add 20% (v/v) FA to a final concentration of 1% (v/v), centrifuge the mixture at 16,000× g for 10 min at 4 °C, and retain the clarified supernatant for MonoTip C18 desalting.
Caution: FA is highly corrosive and causes skin burns upon contact. Wear nitrile gloves throughout all handling steps and collect all FA-containing waste separately for neutralization treatment before disposal.
G. Desalting of peptides and quantification
G1. Desalting of peptides
1. Activate and equilibrate the C18 matrix. Draw and eject 50% acetonitrile with 0.1% FA elution solution through the C18 tip repeatedly five times using a 100 μL pipette to fully wet the solid-phase extraction matrix.
2. Re-equilibrate the matrix with aqueous mobile phase. Replace the solvent with 0.1% FA solution and repeat the draw-and-eject washing cycle five times to remove residual organic solvent.
3. Load peptide sample onto C18 resin. Aspirate and dispense digested peptide supernatant through the C18 tip repeatedly 10 times to ensure full adsorption of target peptides onto the silica matrix.
4. Wash away salts and polar contaminants. Draw and eject 0.1% FA solution through the tip five times and discard all flowthrough waste to eliminate inorganic salts and highly polar impurities.
5. Elute bound peptides. Dispense 50 μL of 50% acetonitrile with 0.1% FA elution solution into a new 1.5 mL microcentrifuge tube. Aspirate and eject elution solvent through the C18 tip repeatedly 10 times and collect the organic eluate containing target peptides.
6. Retain the desalted sample. Determine peptide concentration using the BeyoBCA Peptide Quantification kit (colorimetric assay).
G2. BeyoBCA colorimetric quantification of sample concentration
1. Prepare peptide standard gradient solutions at concentrations of 0, 15.625, 31.25, 62.5, 125, 250, 500, and 1,000 μg/mL using the BeyoBCA Peptide Quantitation Assay kit, as detailed in Table 1. Standards are freshly prepared using 50% acetonitrile with 0.1% FA as the dilution solvent for matrix-matching with peptide eluates. Mix all dilutions thoroughly after each transfer.
Table 1. Preparation of standard solutions
| Vial number | 50% acetonitrile with 0.1% FA elution solution | Volume of peptide standard | Final concentration |
|---|---|---|---|
| A | 0 μL | 50 μL peptide standard (1 mg/mL) | 1,000 μg/mL |
| B | 25 μL | 25 μL of vial A | 500 μg/mL |
| C | 25 μL | 25 μL of vial B | 250 μg/mL |
| D | 25 μL | 25 μL of vial C | 125 μg/mL |
| E | 25 μL | 25 μL of vial D | 62.5 μg/mL |
| F | 25 μL | 25 μL of vial E | 31.25 μg/mL |
| G | 25 μL | 25 μL of vial F | 15.625 μg/mL |
| H | 25 μL | 0 μL | 0 μg/mL |
2. Prepare the BeyoBCA working solution fresh before use; the required volumes for different numbers of samples are summarized in Table 2. Mix reagent A, reagent B, and reagent C at a volume ratio of 50:48:2. Prepare sufficient working solution to supply 180 μL per standard or sample well. The working solution remains stable for 30 min at room temperature after mixing.
Table 2. Preparation volume of BeyoBCA working solution
| Samples | 1 | 10 | 20 | 50 |
|---|---|---|---|---|
| BeyoBCA reagent A (μL) | 90 | 900 | 1,800 | 4,500 |
| BeyoBCA reagent B (μL) | 86.4 | 864 | 1,728 | 4,320 |
| BeyoBCA reagent C (μL) | 3.6 | 36 | 72 | 180 |
| Working solution (μL) | 180 | 1,800 | 3,600 | 9,000 |
Note: This table is adapted from the instruction manual of the BeyoBCA Peptide Quantitation Assay Kit.
3. Add 180 μL of BeyoBCA working solution into each well first. Transfer 20 μL of peptide standards with serial concentrations into standard wells of a 96-well plate. Add an appropriate volume of samples to the sample wells of the 96-well plate. If the sample volume is less than 20 μL, make up the volume to 20 μL with 50% acetonitrile with 0.1% FA elution solution and record the original sample volume as V μL. Mix thoroughly by pipetting up and down, and incubate at 37 °C for 15 min.
4. Measure absorbance at A480 using a microplate reader. Subtract the absorbance value of the 0 μg/mL blank standard from the measured absorbance values of all standards and samples to obtain blank-corrected absorbance readings, which are used for generating the standard curve (Figure 3) and calculating sample peptide concentrations.
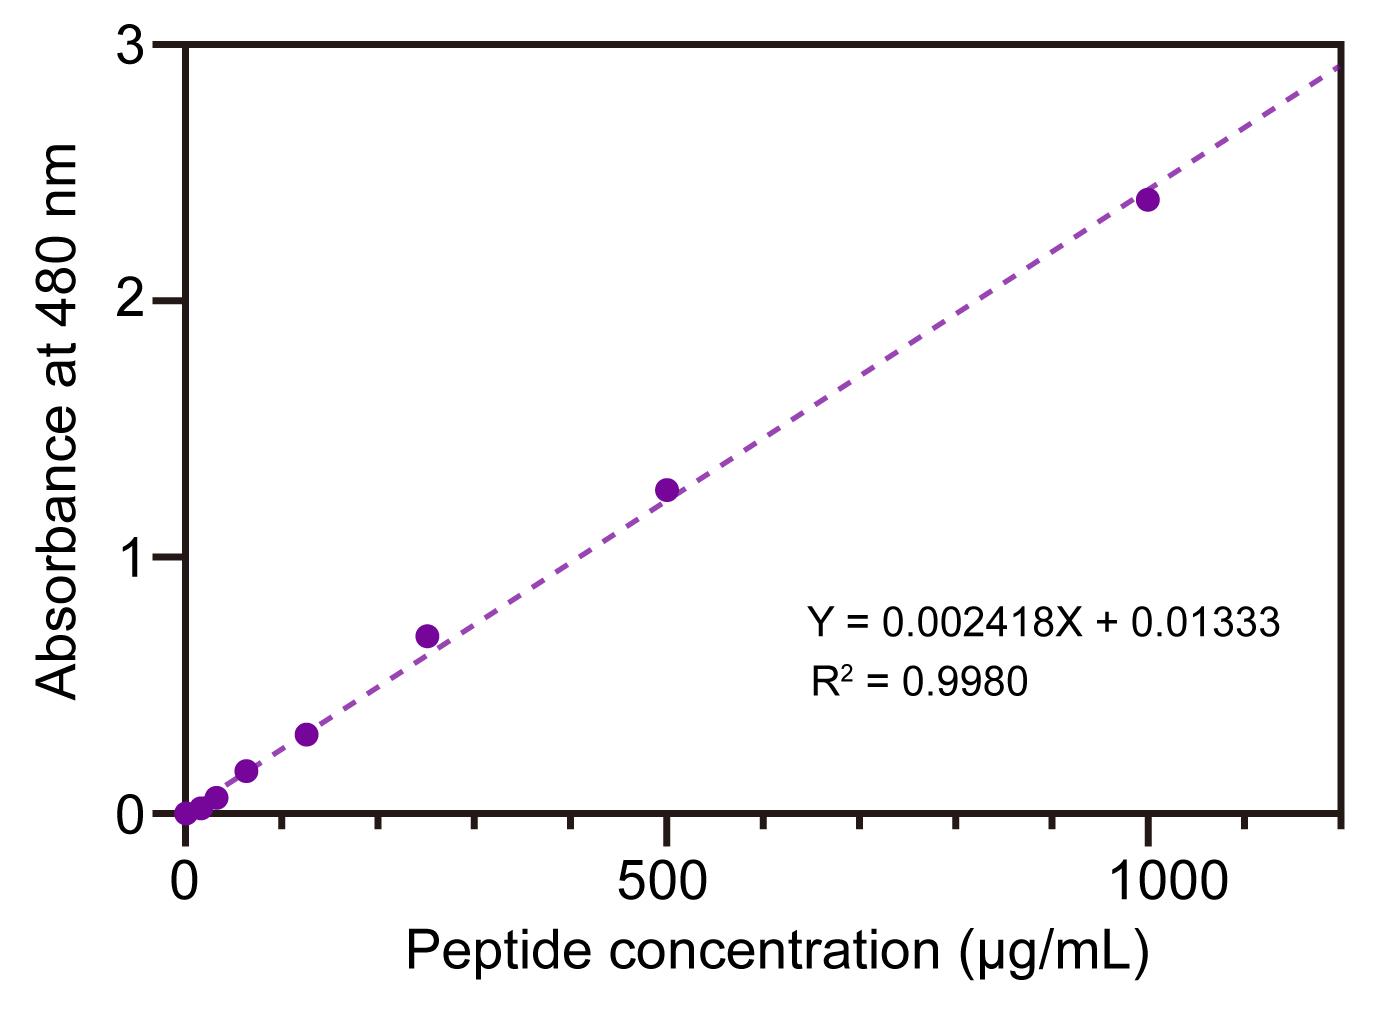
Figure 3. Standard curve of BeyoBCA peptide quantification assay. Peptide standards (0–1,000 μg/mL) were serially diluted in 50% acetonitrile with 0.1% formic acid for matrix matching with peptide eluates from C18 tip desalting. Standards were freshly prepared before the assay. A480 absorbance was recorded and blank-corrected to generate the calibration curve for peptide concentration calculation. The dashed line represents a linear regression: Y = 0.002418X + 0.01333, R2 = 0.9980.
5. Calculate the peptide concentration B (μg/mL) of each sample well from the standard curve: Corrected absorbance of the sample = measured absorbance of the sample – measured absorbance of the 0 μg/mL blank standard. If 20 μL of the undiluted sample was loaded directly, concentration B equals the original sample concentration. When the initial sample volume is less than 20 μL, or a portion of the sample was reserved for separate BCA quantification, denote the original sample volume as V (μL). The formula for the actual sample concentration is C (μg/mL) = B × 20/V.
Calculation example: Suppose the measured absorbance of the sample is 0.751, and the measured absorbance of the blank standard is 0.665; the corrected sample absorbance is 0.751 - 0.665 = 0.086. The corrected sample absorbance is then substituted as the Y-value into the standard curve to solve for X, namely the peptide concentration B of the sample well (μg/mL), which is approximately 30.05 μg/mL. If the original sample volume V = 5 μL, and 15 μL of diluent is added into the sample well to bring the total volume to 20 μL, the peptide concentration in the original sample C (μg/mL) = 30.05 × 20/5 = 120.2 μg/mL.
H. LC-MS/MS
Based on peptide concentrations determined via BeyoBCA quantification, transfer an aliquot equivalent to 2 μg of total peptide mass into a separate microcentrifuge tube; retain all remaining peptide eluate. Concentrate all peptide samples to complete dryness under vacuum centrifugation. Store dried peptide pellets at -80 °C until LC-MS/MS detection.
Data analysis
Raw data-independent acquisition mass spectrometry (DIA-MS) data in this study were processed with Spectronaut 20.0 via the library-free directDIA workflow, which eliminates the requirement for pre-acquired data-dependent acquisition (DDA) datasets to generate project-specific spectral libraries. The built-in Pulsar search engine was applied for database searching against the Araport11_pep Arabidopsis thaliana reference protein FASTA database with reversed decoy sequences automatically generated in the software. Standard search parameters were configured as follows: trypsin/P was selected as the digestion protease with a maximum of two missed cleavage sites. Cysteine carbamidomethylation (57.0215 Da) was defined as a fixed modification, while methionine oxidation (15.9949 Da) and protein N-terminal acetylation (42.0106 Da) were specified as variable modifications. Peptide length was restricted to 7–52 amino acids, and precursor ion charge states were limited to 2–6. A unified FDR threshold of 1% was applied at both peptide and protein levels to filter identifications and control false discovery rates. For quantification, the embedded MaxLFQ label-free quantification algorithm in Spectronaut was implemented to normalize protein intensities across all samples. The ion interference correction module was activated to remove background noise derived from co-eluting fragment ions during peak integration, thereby improving quantification reliability.
Raw MS/MS data acquired in DDA mode were processed and analyzed using MaxQuant [19]. Database searching was performed against the Arabidopsis thaliana reference proteome dataset according to our previous publications [20,21]. The false discovery rate (FDR) thresholds for both peptide-to-spectrum matches (PSMs) and protein identification were strictly controlled at 0.01. Trypsin was specified for enzymatic digestion, with the minimum peptide length set to 7 amino acids. Carbamidomethylation of cysteine was configured as a fixed modification, while oxidation of methionine and acetylation of protein N-termini were allowed as variable modifications. Other search parameters were kept at their default values.
Validation of protocol
This protocol (or parts of it) has been used and validated in the following research article(s):
Application of the complete protocol:
• Zhou et al. [9]. A non-canonical role of ATG8 in Golgi recovery from heat stress in plants. Nature Plants, 9, 749–765. https://doi.org/10.1038/s41477-023-01398-w
• Liao et al. [10]. The plant retromer components SNXs bind to ATG8 and CLASP to mediate autophagosome movement along microtubules. Molecular Plant, 18(3), 416–436. https://doi.org/10.1016/j.molp.2024.12.013
Protein desalting and free biotin removal:
• Karunadasa et al. [17]. Detection and quantification of biotinylated proteins for TurboID-based proximity labeling mass spectrometry in Arabidopsis. Methods in Molecular Biology, 2953, 115–126. https://doi.org/10.1007/978-1-0716-4694-6_8
• Mair et al. [5]. Proximity labeling of protein complexes and cell-type-specific organellar proteomes in Arabidopsis enabled by TurboID. eLife, 8. https://doi.org/10.7554/eLife.47864
Magnetic beads blocking via acetylation:
• Hollenstein et al. [16]. Acetylation of lysines on affinity-purification matrices to reduce co-digestion of bead-bound ligands. protocols.io. https://doi.org/10.17504/protocols.io.kxygxzexkv8j/v3
• Artan et al. [13]. Proteomic analysis of C. elegans neurons using TurboID-based proximity labeling. In Behavioral Neurogenetics (pp. 277–294). Springer. https://doi.org/10.1007/978-1-0716-2321-3_15
• Hollenstein et al. [12]. Chemical Acetylation of Ligands and Two-Step Digestion Protocol for Reducing Codigestion in Affinity Purification–Mass Spectrometry. Journal of Proteome Research 22(10): 3383–3391. https://doi.org/10.1021/acs.jproteome.3c00424
Controlled urea dilution prior to desalting:
• Artan et al. [13]. Proteomic analysis of C. elegans neurons using TurboID-based proximity labeling. In Behavioral Neurogenetics (pp. 277–294). Springer. https://doi.org/10.1007/978-1-0716-2321-3_15
• Kollipara and Zahedi. [11]. Protein carbamylation: in vivo modification or in vitro artefact? Proteomics, 13(6), 941–944. https://doi.org/10.1002/pmic.201200452
• Schär et al. [15]. A Flexible End-to-End Automated Sample Preparation Workflow Enables Standardized and Scalable Bottom-up Proteomics. Analytical Chemistry, 97(40), 22116–22131. https://doi.org/10.1021/acs.analchem.5c03829
General notes and troubleshooting
General notes
1. After biotin labeling, wash Arabidopsis seedlings three times with ice-cold sterile water or PBS to completely remove residual surface-free biotin.
2. All sample handling and preprocessing operations must be performed on ice or at 4 °C unless specified otherwise in individual steps.
3. One gram of dense Arabidopsis tissue generally yields sufficient total protein for high-depth downstream LC-MS/MS quantification.
4. Protease inhibitor (PI) cocktail should be freshly supplemented into all lysis and dilution solutions immediately prior to use.
5. All incubation steps involving IAM stock solutions and reaction mixtures must be strictly protected from light using aluminum foil or light-blocking amber tubes.
6. A fresh peptide standard curve must be generated concurrently with each unique batch of peptide colorimetric quantification via the BeyoBCA assay; historical standard curves should not be reused.
Troubleshooting
Problem 1: Low recovery of biotinylated proteins.
Possible causes: Weak biotin ligase activity; insufficient in vivo biotinylation time; protein degradation during tissue extraction; limited starting transgenic plant material; poor binding between biotinylated proteins and streptavidin beads. Solutions: Optimize biotin incubation time and stabilize ligase fusion protein expression; add sufficient protease inhibitors and perform extraction at low temperature; increase the input of transgenic plant tissue; prolong incubation with an adequate amount of streptavidin beads.
Problem 2: High nonspecific background contamination.
Possible causes: Incomplete bead blocking; insufficient washing after enrichment; endogenous biotinylated proteins in plant samples; nonspecific protein adsorption to tubes or beads.
Solutions: Extend bead blocking time with high-quality blocking buffer; increase wash cycles with defined volume and duration; set proper controls (e.g., pCAMBIA1300-pUBQ10::TurboID-EYFP free ligase control); adopt low-binding tubes and fully resuspend beads in each wash.
Problem 3: Faint and variable MS peptide signals.
Possible causes: Residual free biotin after desalting; peptide loss during elution; inconsistent operations among replicates. Solutions: Complete desalting to eliminate free biotin; optimize elution conditions to prevent over-dilution; standardize pipetting and incubation steps to reduce technical variation.
Supplementary information
No supplementary data is associated with this protocol. The mass spectrometry proteomics data have been deposited to the ProteomeXchange Consortium via the PRIDE partner repository with the dataset identifiers PXD036880 and PXD081321. All essential experimental layouts, reagent formulations, parameter templates, and workflow schemes are fully integrated into the main text and figures of this manuscript.
Acknowledgments
This work was supported by the Natural Science Foundation of Guangdong Province (2025A1515012500), National Natural Science Foundation of China (32470353), China Postdoctoral Science Foundation (2023M741234), and direct grants from South China Normal University (23KJ04) to L.F. We thank Dr. Wenyang Zhang (Agricultural Biological Gene Research Center, Guangdong Academy of Agricultural Sciences) for technical guidance to the plant biotin enrichment proteomics protocol described herein.
This protocol was used in [9,10].
Author contributions
Protocol Development, L.-D.Z., Y.-Q.Y., D.-T.Z.; Protocol Optimization or Validation, L.-D.Z., Y.-Q.Y., D.-T.Z.; Writing—Original Draft, L.-D.Z., Y.-Q.Y., D.-T.Z., L.F.; Writing—Review & Editing, Q.-P.Y., Y.-L.Y., H.L., C.G., L.F.; Funding acquisition, C.G., L.F.; Supervision, C.G., L.F.
Competing interests
The authors declare no conflicts of interest.
Ethical considerations
This study exclusively utilizes the model plant Arabidopsis thaliana (Columbia-0). The experimental procedures do not involve human subjects, vertebrate animals, or regulated biological agents, and therefore do not require specific institutional ethical approval or animal welfare clearances.
References
- Zhang, Y., Li, Y., Yang, X., Wen, Z., Nagalakshmi, U. and Dinesh-Kumar, S. P. (2020). TurboID-Based Proximity Labeling for In Planta Identification of Protein-Protein Interaction Networks. J Visualized Exp.: e3791/60728. https://doi.org/10.3791/60728
- Xu, S. L., Shrestha, R., Karunadasa, S. S. and Xie, P. Q. (2023). Proximity Labeling in Plants. Annu Rev Plant Biol. 74(1): 285–312. https://doi.org/10.1146/annurev-arplant-070522-052132
- Branon, T. C., Bosch, J. A., Sanchez, A. D., Udeshi, N. D., Svinkina, T., Carr, S. A., Feldman, J. L., Perrimon, N. and Ting, A. Y. (2018). Efficient proximity labeling in living cells and organisms with TurboID. Nat Biotechnol. 36(9): 880–887. https://doi.org/10.1038/nbt.4201
- Feng, L., Zhou, J., Zhu, D. and Gao, C. (2024). TurboID-based proximity labeling accelerates discovery of neighboring proteins in plants. Trends Plant Sci. 29(3): 383–384. https://doi.org/10.1016/j.tplants.2023.10.011
- Mair, A., Xu, S. L., Branon, T. C., Ting, A. Y. and Bergmann, D. C. (2019). Proximity labeling of protein complexes and cell-type-specific organellar proteomes in Arabidopsis enabled by TurboID. eLife. 8: e47864. https://doi.org/10.7554/elife.47864
- Zhang, Y., Song, G., Lal, N. K., Nagalakshmi, U., Li, Y., Zheng, W., Huang, P. j., Branon, T. C., Ting, A. Y., Walley, J. W., et al. (2019). TurboID-based proximity labeling reveals that UBR7 is a regulator of N NLR immune receptor-mediated immunity. Nat Commun. 10(1): 3252. https://doi.org/10.1038/s41467-019-11202-z
- Jiao, Y., Dou, Y., Wang, L., Zhu, X. G. and Zheng, H. (2026). Identification of PsbS binding proteins in Arabidopsis thaliana leaf chloroplasts under high light using TurboID-based proximity labeling. Front Plant Sci. 16: e1705804. https://doi.org/10.3389/fpls.2025.1705804
- Yang, C., Li, X., Chen, S., Liu, C., Yang, L., Li, K., Liao, J., Zheng, X., Li, H., Li, Y., et al. (2023). ABI5–FLZ13 module transcriptionally represses growth-related genes to delay seed germination in response to ABA. Plant Commun. 4(6): 100636. https://doi.org/10.1016/j.xplc.2023.100636
- Zhou, J., Ma, J., Yang, C., Zhu, X., Li, J., Zheng, X., Li, X., Chen, S., Feng, L., Wang, P., et al. (2023). A non-canonical role of ATG8 in Golgi recovery from heat stress in plants. Nat Plants. 9(5): 749–765. https://doi.org/10.1038/s41477-023-01398-w
- Liao, Y., Li, X., Ma, W., Lin, X., Kuang, J., Zheng, X., Li, Z., Qiao, F., Liu, C., Zhou, J., et al. (2025). The plant retromer components SNXs bind to ATG8 and CLASP to mediate autophagosome movement along microtubules. Mol Plant. 18(3): 416–436. https://doi.org/10.1016/j.molp.2024.12.013
- Kollipara, L. and Zahedi, R. P. (2013). Protein carbamylation: In vivo modification or in vitro artefact? Proteomics. 13(6): 941–944. https://doi.org/10.1002/pmic.201200452
- Hollenstein, D. M., Maurer-Granofszky, M., Reiter, W., Anrather, D., Gossenreiter, T., Babic, R., Hartl, N., Kraft, C. and Hartl, M. (2023). Chemical Acetylation of Ligands and Two-Step Digestion Protocol for Reducing Codigestion in Affinity Purification–Mass Spectrometry. J Proteome Res. 22(10): 3383–3391. https://doi.org/10.1021/acs.jproteome.3c00424
- Artan, M. and de Bono, M. (2022). Proteomic Analysis of C. Elegans Neurons Using TurboID-Based Proximity Labeling. Neuromethods.: 277–294. https://doi.org/10.1007/978-1-0716-2321-3_15
- Arora, D., Abel, N. B., Liu, C., Van Damme, P., Yperman, K., Eeckhout, D., Vu, L. D., Wang, J., Tornkvist, A., Impens, F., et al. (2020). Establishment of Proximity-Dependent Biotinylation Approaches in Different Plant Model Systems. Plant Cell. 32(11): 3388–3407. https://doi.org/10.1105/tpc.20.00235
- Schär, S., Räss, L., Malinovska, L., Savickas, S., Cavallo, F., Below, C., Tognetti, M., Shichkova, P., Gourdet, B., Robles, G., et al. (2025). A Flexible End-to-End Automated Sample Preparation Workflow Enables Standardized and Scalable Bottom-up Proteomics. Anal Chem. 97(40): 22116–22131. https://doi.org/10.1021/acs.analchem.5c03829
- Hollenstein, D., Maurer-Granofszky, M., Anrather, D., Gossenreiter, T., Hartl, N. and Hartl, M. (2023). Acetylation of lysines on affinity-purification matrices to reduce co-digestion of bead-bound ligands. protocolsio: ekxygxzexkv8j/v3. https://doi.org/10.17504/protocols.io.kxygxzexkv8j/v3
- Karunadasa, S. S., Grismer, T. S., Zhai, W., Reyes, A. V. and Xu, S. L. (2025). Detection and Quantification of Biotinylated Proteins for TurboID-Based Proximity Labeling Mass Spectrometry in Arabidopsis. Methods Mol Biol. 2953: 115–126. https://doi.org/10.1007/978-1-0716-4694-6_8
- Wiśniewski, J. R., Zougman, A., Nagaraj, N. and Mann, M. (2009). Universal sample preparation method for proteome analysis. Nat Methods. 6(5): 359–362. https://doi.org/10.1038/nmeth.1322
- Tyanova, S., Temu, T. and Cox, J. (2016). The MaxQuant computational platform for mass spectrometry-based shotgun proteomics. Nat Protoc. 11(12): 2301–2319. https://doi.org/10.1038/nprot.2016.136
- Feng, L., Li, Y., Zhou, Y. L., Meng, G. H., Ji, Z. L., Lin, W. H. and He, J. X. (2023). Integrative transcriptomic and proteomic analyses reveal a positive role of BES1 in salt tolerance in Arabidopsis. Front Plant Sci. 14: e1034393. https://doi.org/10.3389/fpls.2023.1034393
- Zeng, Y., Li, B., Huang, S., Li, H., Cao, W., Chen, Y., Liu, G., Li, Z., Yang, C., Feng, L., et al. (2023). The plant unique ESCRT component FREE1 regulates autophagosome closure. Nat Commun. 14(1): 1768. https://doi.org/10.1038/s41467-023-37185-6
Article Information
Publication history
Received: Jul 19, 2026
Accepted: Sep 19, 2026
Available online: Oct 1, 2026
Published: Nov 5, 2026
Copyright
© 2026 The Author(s); This is an open access article under the CC BY-NC license (https://creativecommons.org/licenses/by-nc/4.0/).
How to cite
Zhang, L., Ye, Y., Zhuo, D., Yan, Q., Ye, Y., Li, H., Gao, C. and Feng, L. (2026). An Optimized Protocol for TurboID-Based Proximity Labeling and Sample Preparation for Mass Spectrometry in Arabidopsis thaliana. Bio-protocol 16(21): e5852. DOI: 10.21769/BioProtoc.5852.

 Download Citation in RIS Format
Do you have any questions about this protocol?
Post your question to gather feedback from the community. We will also invite the authors of this article to respond.
 Post a Question


