


- Protocols

- Articles and Issues
- For Authors
- About
- Become a Reviewer


A Dissociation-Based Seahorse XF Workflow for Quantifying Averaged Bioenergetics in Anchorage-Independent Cancer Cell Clusters

Published: Vol 16, Iss 20, Oct 20, 2026 DOI: 10.21769/BioProtoc.5849 Views: 37
Reviewed by: Elena A. OstrakhovitchSomia ShehzadiShrabastee Chakraborty
 PDF
PDF  Ask a question
Original research article
The authors used this protocol in:

Oct 2019

Protocol Collections
Comprehensive collections of detailed, peer-reviewed protocols focusing on specific topics




Abstract
Cell clustering during anchorage-independent growth (AIG) is a key hallmark of malignant progression, supporting survival under detachment during metastatic dissemination. However, bioenergetic profiling of cell clusters grown under AIG conditions remains technically challenging, in part because of steep nutrient and oxygen gradients and irregular cell cluster shapes that complicate Seahorse XF assay normalization. Here, we present a dissociation-based Seahorse XF96/XF Pro method that enables high-throughput quantification of the average bioenergetic state of anchorage-independent cancer cell clusters. In this workflow, clusters generated in ultra-low adherent plates are enzymatically and mechanically dissociated into a single-cell suspension immediately prior to Seahorse XF Mito Stress Test analysis on poly-D-lysine-coated 2D microplates. This approach ensures that all viable cells throughout each cluster contribute equally to oxygen consumption rate (OCR) measurements and reduces the need for complex post hoc normalization. We further apply this workflow to an in vitro metastasis model in which A549 lung cancer cells are studied as attached, detached (anchorageindependent), and reattached populations, mimicking primary tumor cells, circulating/clustered cells, and secondary lesions, respectively. Detached cells exhibit reduced mitochondrial membrane potential and diminished basal and maximal OCR, whereas reattached cells largely restore membrane potential and respiratory capacity to levels comparable to attached cells, demonstrating that detachment-induced mitochondrial dysfunction is reversible upon reattachment. These findings align with previous work showing that anchorage-independent and clustered cancer cells undergo reversible metabolic reprogramming, including suppression of oxidative metabolism, engagement of reductive pathways to support redox homeostasis, and altered ROS handling to facilitate metastatic colonization. Collectively, this dissociation-based Seahorse workflow provides a practical and accessible platform to interrogate metabolic adaptations to anchorage-independent growth and cell clustering and identify bioenergetic vulnerabilities of metastasis-relevant cancer cell states.
Key features
• Dissociation-based Seahorse XF Mito Stress Test enabling per-cell bioenergetic profiling of anchorage-independent cancer cell clusters grown in ultra-low adherent plates.
• Overcomes structural heterogeneity by enzymatically dissociating clusters into single-cell suspensions immediately before analysis, ensuring each viable cell contributes equally to OCR measurements.
• Compatible with adherent monolayer, anchorage-independent, and reattached cell populations, enabling direct bioenergetic comparison across conditions that model primary tumor, circulating, and metastatic colonization states.
• Validated in the A549 lung adenocarcinoma cell line; includes PDL coating, in-house DMEM preparation, and BAM15 concentration optimization steps adaptable to other cancer cell lines.
Keywords: Anchorage-independent growth Seahorse XF Mito Stress Test
Mitochondrial respiration
Cancer cell clusters
Oxygen consumption rate (OCR)
Seahorse XF Mito Stress Test
Mitochondrial respiration
Cancer cell clusters
Oxygen consumption rate (OCR)
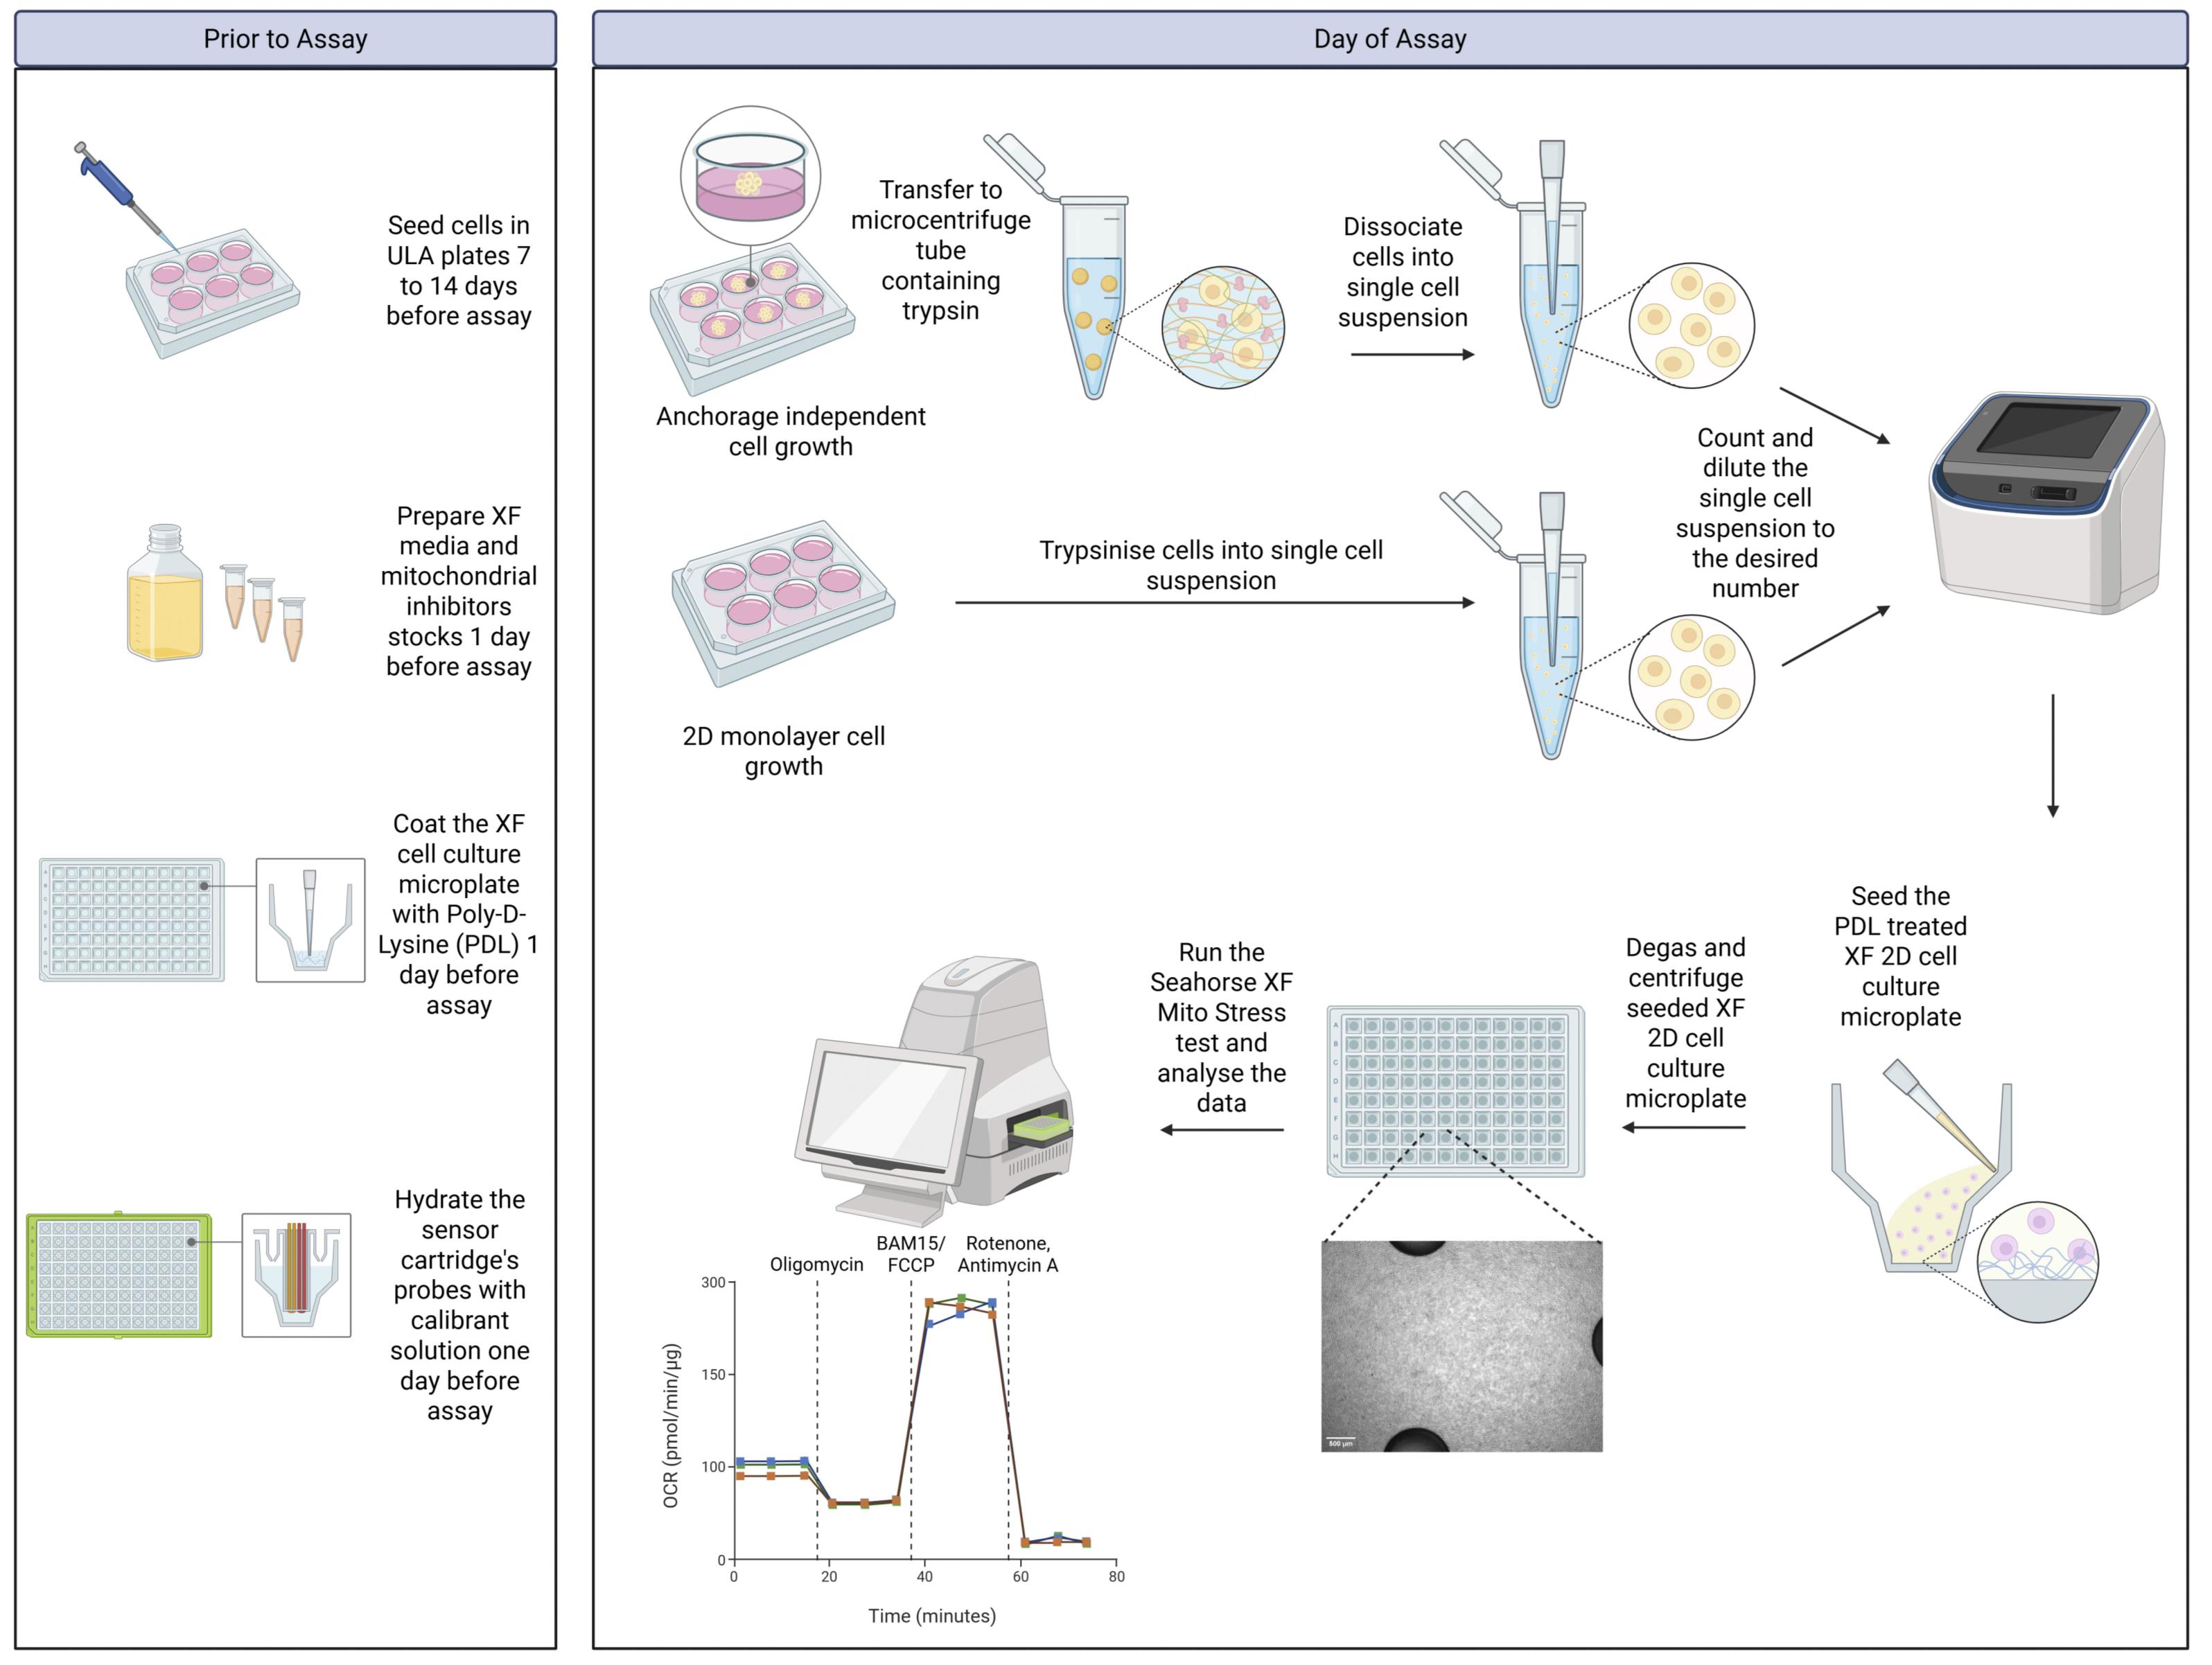
Graphical overview
Background
Anchorage-independent growth is a defining feature of malignant transformation and a prerequisite for cancer cell survival during dissemination [1]. Cancer cells that detach from the extracellular matrix encounter profound metabolic and redox stress, including mitochondrial dysfunction and elevated reactive oxygen species (ROS), and must accordingly rewire central carbon metabolism to persist in circulation and successfully colonize distant organs [2,3]. Detachment is frequently accompanied by cell clustering, which further shapes metabolic demands and constraints [4]. In particular, clustered cancer cells experience localized hypoxia that can drive hypoxia-inducible factor 1-alpha (HIF1α)-dependent mitophagy, reduce mitochondrial oxidative capacity, and increase reliance on glycolysis and cytosolic reductive pathways to sustain ATP levels and limit ROS accumulation, thereby enhancing metastatic fitness [3]. Furthermore, under detachment, oxidative metabolism of glucose and glutamine is suppressed, while reductive carboxylation of glutamine-derived α-ketoglutarate through cytosolic isocitrate dehydrogenase 1 (IDH1) increases, supporting mitochondrial reduced nicotinamide adenine dinucleotide phosphate (NADPH) production and buffering oxidative stress [2]. This metabolic adaptation maintains redox homeostasis and enables continued proliferation despite the absence of matrix-derived survival signals.
Despite this conceptual framework, experimental access to the bioenergetics of anchorage-independent cells and clusters remains limited. Conventional Seahorse XF assays typically profile adherent monolayers, while 3D models often rely on intact spheroids plated in specialized microplates and analyzed as functional units [5]. These intact 3D measurements are powerful when the research question centers on whole-structure behavior, but they can be less informative when the goal is to quantify the average bioenergetic state of individual cells within heterogeneous clusters. Anchorage-independent clusters inherently develop steep oxygen and nutrient gradients, with proliferative, well-oxygenated cells at the periphery and more quiescent, stressed, or necrotic cells in inner regions [6,7]. This structural heterogeneity can bias respiratory readouts toward outer layers and complicate normalization based on cluster size or morphology, particularly when aggregates are irregular rather than spherical.
Here, we describe a dissociation-based Seahorse XF96/XF Pro workflow designed to overcome these limitations and enable robust quantification of the average bioenergetic state of anchorage-independent cancer cell clusters. In this approach, clusters generated in ultra-low adherent plates are enzymatically and mechanically dissociated into a single-cell suspension immediately before analysis, then seeded onto poly-D-lysine-coated 2D Seahorse microplates and profiled using the Mito Stress Test. By ensuring that each viable cell contributes equally to oxygen consumption rate (OCR) measurements under uniform acute conditions, the method reduces dependence on complex cluster-level normalization and directly reports per-cell respiratory capacity after growth in anchorage-independent conditions. This approach can also be applied to cells grown in 2D monolayers for direct comparison of bioenergetic profiles.
To demonstrate the utility of this workflow in a metastasis-relevant context, we applied it to an in vitro model in which A549 lung adenocarcinoma cells are examined as attached, detached, and reattached populations, modeling primary tumor cells (in terms of cell–extracellular matrix interactions), anchorage-independent circulating or clustered cells, and colonized secondary lesions, respectively. Using this dissociation-based Seahorse assay, we show that detachment induces a reversible state characterized by decreased oxidative capacity and that these features are largely restored upon reattachment. These proof-of-concept data illustrate how the workflow can capture dynamic, reversible bioenergetic remodeling associated with anchorage independence and reattachment.
Taken together, this work provides a practical and accessible platform to interrogate metabolic adaptations to anchorage-independent growth and cell clustering, complementing intact 3D assays and opening new opportunities to systematically explore bioenergetic vulnerabilities of metastasis-relevant cancer cell states. By enabling average per-cell bioenergetic profiling of cluster-derived cells with straightforward normalization, the described method supports more mechanistic studies of redox homeostasis, substrate usage, and mitochondrial function in models that better reflect the detachment and clustering events central to metastatic progression.
Materials and reagents
Biological materials
1. A549 lung adenocarcinoma cell line (Cellonex, catalog number: CA54-C)
Reagents
1. Dulbecco’s modified Eagle’s medium (DMEM), high glucose + L-glutamine (Thermo Fisher Scientific, catalog number: 11965092)
2. DMEM powder (Sigma-Aldrich, catalog number: D5030)
3. Fetal bovine serum (FBS) (Gibco, catalog number: A5256701)
4. Glucose, 200 g/L (Thermo Fisher Scientific, catalog number: A2494001)
5. L-Glutamine, 200 mM (Thermo Fisher Scientific, catalog number: 25030081)
6. Sodium pyruvate, 100 mM (Thermo Fisher Scientific, catalog number: 11360070)
7. Trypsin-EDTA, 0.5% (Thermo Fisher Scientific, catalog number: 15400054)
8. Cell-culture-grade water (Thermo Fisher Scientific, catalog number: A1287301)
9. Dimethyl sulfoxide (DMSO) (Sigma-Aldrich, catalog number: D2650)
10. Antimycin A (Sigma-Aldrich, catalog number: A8674)
11. BAM15 (5-N,6-N-bis(2-fluorophenyl)-1,2,5-oxadiazolo[3,4-b]pyrazine-5,6-diamine) (Sigma-Aldrich, catalog number: SML1760)
12. FCCP (Carbonyl cyanide-4-(trifluoromethoxy) phenylhydrazone) (Sigma-Aldrich, catalog number: C2920)
13. Oligomycin (Sigma-Aldrich, catalog number: O4876)
14. Rotenone (Sigma-Aldrich, catalog number: R8875)
15. HEPES (2-[4-(2-hydroxyethyl)piperazin-1-yl]ethanesulfonic acid) (Sigma-Aldrich, catalog number: H7523)
16. Phosphate-buffered saline (PBS) (Thermo Fisher Scientific, catalog number: 10010023)
17. Poly-D-Lysine (PDL), 0.1 mg/mL (Thermo Fisher Scientific, catalog number: A3890401)
18. Trypan Blue, 0.4% (Thermo Fisher Scientific, catalog number: T10282)
19. Sodium chloride (NaCl) (Sigma-Aldrich, catalog number: S9888)
Solutions
1. DMEM complete cell culture medium (see Recipes)
2. DMEM base medium (see Recipes)
3. XF cell assay medium (see Recipes)
4. Oligomycin, 2.5 mM in DMSO (see Recipes)
5. FCCP, 2.5 mM in DMSO (see Recipes)
6. BAM15, 3 mM in DMSO (see Recipes)
7. Rotenone and antimycin A mixture, 2.5 mM in DMSO (see Recipes)
Recipes
1. DMEM complete cell culture medium
| Reagent | Final concentration | Quantity or volume |
|---|---|---|
| DMEM, high glucose + L-glutamine | 90% | 500 mL |
| FBS | 10% | 50 mL |
| Total | 100% | 550 mL |
2. DMEM base medium
| Reagent | Final concentration | Quantity or volume |
|---|---|---|
| DMEM powder | 8.3 g/L | 8.3 g |
| Cell-culture-grade water | 99% | 990 mL |
| NaCl (3.2 M) | 32 mM | 10 mL |
| Total | n/a | 1000 mL |
Although it is recommended by Agilent to use the XF DMEM media for the Mito Stress Test, it is possible to prepare a similar base medium in-house.
3. XF cell assay medium
| Reagent | Final concentration | Quantity or volume |
|---|---|---|
| DMEM base medium | 92% | 46.05 g |
| HEPES (100 mM stock) | 5 mM | 2.5 mL |
| Glucose (200 g/L stock) | 10 mM | 450 μL |
| Sodium pyruvate (100 mM stock) | 1 mM | 500 μL |
| L-Glutamine (200 mM stock) | 2 mM | 500 μL |
| Total | n/a | 50 mL |
Prepare a total volume of 50 mL of XF cell assay medium no more than 4 h in advance to prevent glutamine degradation. Any XF cell assay medium can be used, preferably without phenol red.
4. Oligomycin, 2.5 mM in DMSO
| Reagent | Final concentration | Quantity or volume |
|---|---|---|
| Oligomycin | 2.5 mM | 39.6 mg |
| DMSO | 100% | 20 mL |
| Total | 20 mL |
5. FCCP, 2.5 mM in DMSO
| Reagent | Final concentration | Quantity or volume |
|---|---|---|
| FCCP | 2.5 mM | 24.5 mg |
| DMSO | 100% | 40 mL |
| Total | 40 mL |
6. BAM15, 3 mM in DMSO
| Reagent | Final concentration | Quantity or volume |
|---|---|---|
| BAM15 | 3 mM | 34 mg |
| DMSO | 100% | 40 mL |
| Total | 40 mL |
7. Rotenone and antimycin A mixture, 2.5 mM in DMSO
| Reagent | Final concentration | Quantity or volume |
|---|---|---|
| Rotenone | 2.5 mM | 39.4 mg |
| Antimycin A | 2.5 mM | 54.9 mg |
| DMSO | 100% | 40 mL |
| Total | 40 mL |
Note: Oligomycin, FCCP, BAM15, Rotenone, and Antimycin A are light-sensitive and should be stored appropriately. Stock solutions in DMSO should not be stored for longer than 1 month at -20 or -80 °C.
Laboratory supplies
1. T-75 tissue culture flask, vent cap, sterile (Celltreat, catalog number: 229341)
2. Ultra-low adherent plates, 6-well (Corning, catalog number: CLS3471)
3. Seahorse XFe96/XF Pro cell culture microplate (untreated) (Agilent, catalog number: 103794-100)
4. Seahorse XFe96/XF Pro FluxPak (includes sensor cartridge and calibrant solution) (Agilent, catalog number: 103793-100)
5. Cellulose acetate (CA) syringe filter, 0.22 μm (Bio-Smart Scientific, catalog number: SF-0.2-CA)
6. Countess cell counting chamber slides (Thermo Fisher Scientific, catalog number: C10228)
7. 5 mL serological pipettes (Whitehead Scientific, catalog number: 326001)
8. 10 mL serological pipettes (Whitehead Scientific, catalog number: 327001)
9. 25 mL serological pipettes (Whitehead Scientific, catalog number: 328001)
10. 10 μL pipette tips (Whitehead Scientific, catalog number: TFLR102-10)
11. 200 μL pipette tips (Whitehead Scientific, catalog number: 312012)
12. 1,000 μL pipette tips (Whitehead Scientific, catalog number: 313012)
Equipment
1. Agilent Seahorse XF Pro Analyzer (Agilent Technologies, model: S7850A/XF Pro)
2. Countess 3 Automated Cell Counter (Thermo Fisher Scientific, model: AMQAX2000)
3. EVOS M700 fluorescent cell imaging system (Thermo Fisher Scientific, model: AMF7000)
4. pH meter (Metrohm, catalog number: 2.913.0010, model: 913)
5. HeracellTM 150i CO2 incubator, 150 L (Thermo Fisher Scientific, catalog number: 51032871)
6. FILTA-MATIX Biological Safety Cabinet (FILTA-MATIX, model: BIO SAFE 6)
Note: Any Class II, Type A2 biosafety cabinet suitable for BSL-2 cell culture work may be used as an alternative, such as the Thermo ScientificTM 1500 Series A2 Class II, Type A2 Biological Safety Cabinet (Thermo Scientific, catalog number: 1598A2).
7. MyTempTM mini digital incubator (non-CO2) (Merck, catalog number: Z763330)
8. Eppendorf® Centrifuge 5810R (Merck, model: Eppendorf® Centrifuge 5810)
9. Water bath (Grant Instruments, catalog number: NC1808978)
10. Corning® StripettorTM Ultra Pipet Controller (Merck, catalog number: CLS4099)
11. FinnpipetteTM F2 GLP Kit (Thermo Fisher Scientific, catalog number, 4700870)
12. FinnpipetteTM F2 Multichannel Pipette (Thermo Fisher Scientific, catalog number: 4662020)
Software and datasets
1. Seahorse Pro Controller (Agilent, Version 10.2.1)
2. Seahorse Wave Pro (Agilent, Version 10.4.1)
3. Excel (Microsoft Office 2024)
4. GraphPad Prism 11
Procedure
Note: Before beginning, refer to Table 1 for a summary of the timing associated with each step of the protocol, noting that the anchorage-independent growth (section A) and cartridge hydration (section C) must be planned in advance.
Table 1. Protocol timeline overview
| Section | Step | Description | Time required |
| A | Preparation of cells for AIG | Culturing cell stocks, seeding into ULA plates, allowing cluster formation over multiple medium exchanges | 2 weeks |
| B | Preparation of Seahorse plates (PDL coating) | PDL addition (30 min), washing, air-drying (30 min to 1 h), plus 1 h warming before use | 2 h |
| C | Hydrating the XF cartridge | Overnight sensor hydration in a non-CO2 incubator (performed the day before the assay) | 8–24 h |
| D | Loading injection ports and instrument calibration | Preparing working solutions, loading ports A/B/C, calibrating sensor cartridge | 30 min |
| E | Preparing single-cell suspensions (clusters + 2D monolayers) | Enzymatic/mechanical dissociation, trypsin neutralization, counting, and working suspension prep | 20 min |
| F | Seeding the XF cell microplate | Cell seeding, centrifugation (2 min), adherence incubation (15–20 min), medium addition, degassing (15–25 min) | 30–40 min |
| G | Running the assay | Automated Seahorse run: basal measurements + 3 sequential injections (oligomycin, FCCP/BAM15, Rot/AA) | 1.5 h |
A. Preparation of cells for anchorage-independent growth (AIG) (timing: 2–4 weeks)
1. Maintain cell stocks in T75 flasks as adherent cells until ready to seed in ultra-low adherent plates for AIG.
2. Prepare a single-cell suspension from the stock T75 flasks:
a. Remove the depleted medium and rinse the cells with PBS.
b. Add 2 mL of 0.05% trypsin to each flask and incubate the cells for 5 min at 37 °C.
c. Add 5 mL of complete cell culture medium and pipette the cells up and down until a single cell suspension is formed.
3. Seed 1–2 × 10⁶ live cells into each well of a 6-well ultra-low adherent (ULA) plate and add 4 mL of complete cell culture media into each well.
4. Allow the cells to remain undisturbed for at least 4 days to form clusters.
5. Exchange culture medium every 2 days following the initial 4-day period until the cell clusters have grown for a total of 14 days (Figure 1).
6. Carefully aspirate the depleted cell culture medium surrounding the cell clusters with a P1000 pipette and sterile filter tips.
7. Slowly add new medium into each well with a serological pipette.
Note: Avoid applying the medium directly onto the young cell clusters as this may disrupt them.
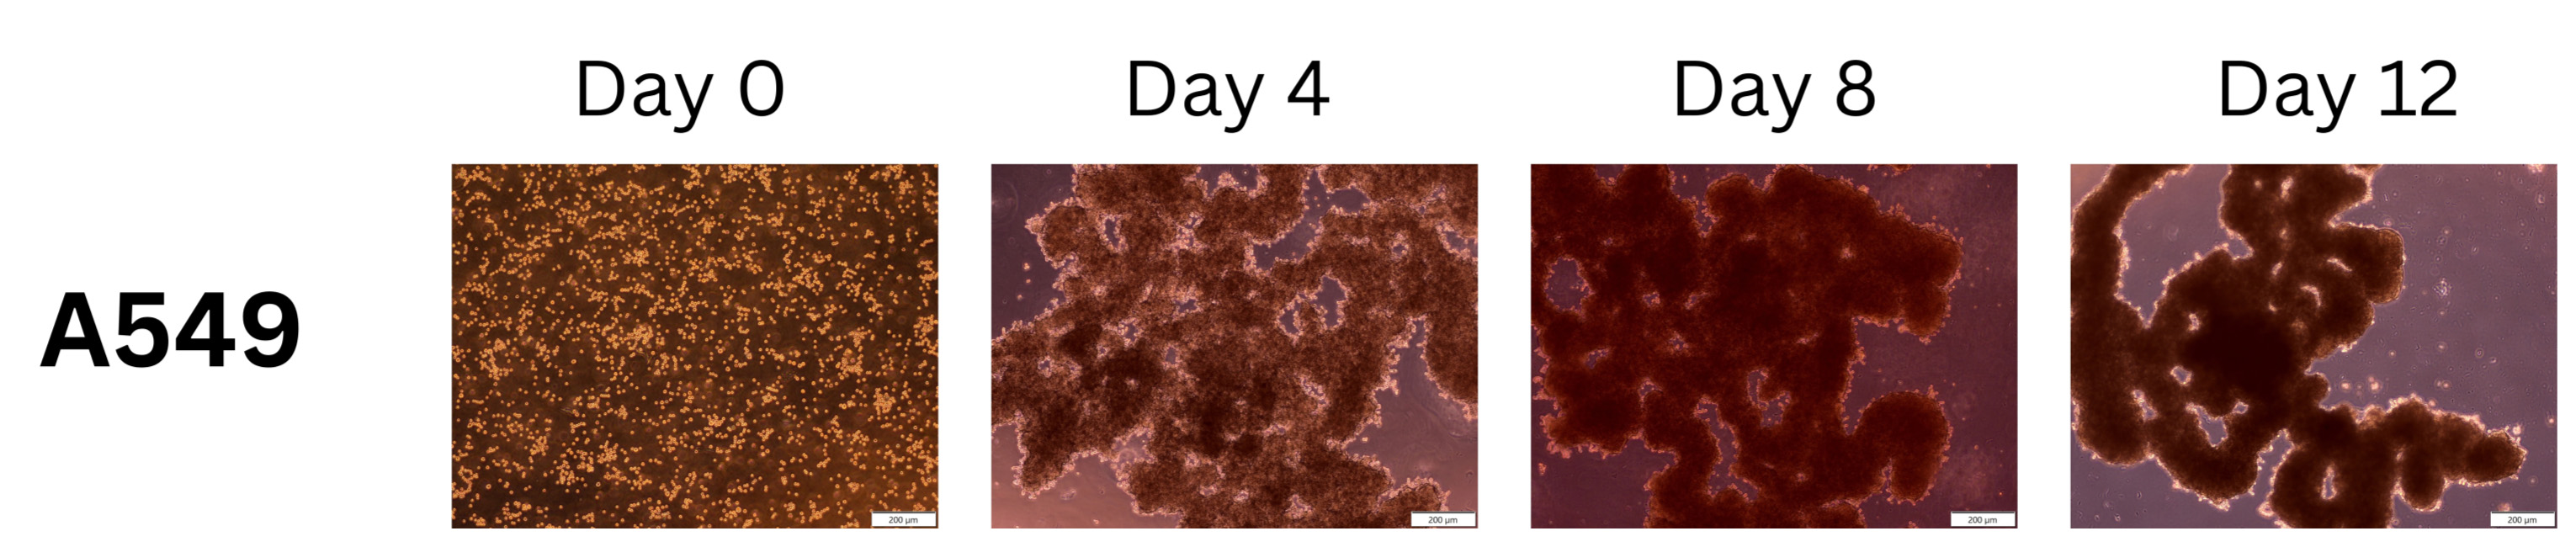
Figure 1. Cell cluster formation during anchorage-independent growth. Representative images of detached A549 cells grown on ultra-low adherent cell culturing plates. Typically, these cells were grown for 4–14 days, depending on the specific assay. Scale bars represent 200 µm.
B. Preparation of Seahorse plates (poly-D-lysine coating) (timing: 2 h)
Note: PDL-treated XF microplates can be purchased from Agilent (part number: 103799-100). However, if these pre-treated plates are not available, follow these steps to coat untreated XF microplates. The treatment should ideally be performed at least one day before the assay.
1. Add the PDL:
a. In a laminar flow cabinet, add 30 μL of sterile PDL (0.1 mg/mL) into each well of an untreated 96-well XF cell microplate.
b. Incubate the plate for 30 min at room temperature.
2. Remove the PDL:
a. Aspirate and discard the PDL from each well using a multichannel pipette.
Note: The PDL solution cannot be reused and must be discarded at this point.
b. Aspirate any residual PDL present using a multichannel pipette.
c. Wash the plate twice using 200 μL of sterile cell-culture-grade water pipetted into each well.
d. Aspirate and discard the water from each well using a multichannel pipette.
e. Air-dry the plate under a laminar flow cabinet for 30 min to 1 h until dry.
Pause point: The plate can now be used or stored at 4 °C for up to 3 months. For storage, put the lid onto the microplate and wrap the edge with Parafilm M.
3. Warm the plate in an incubator at 37 °C for at least 1 h before use.
C. Hydrating the XF cartridge (day before the assay) (timing: 8–24 h)
Note: The hydration step ensures that the solid-state sensor material on the probes of the sensor cartridge can function optimally to detect the most accurate changes in oxygen and pH in each well of the XF cell microplate.
1. Add the XF calibration fluid to the utility plate:
a. Lift the XF cartridge out of its packaging and place it on a clean surface.
b. Lift the sensor out of the utility plate and place it on its back with the cartridge sensors pointing upward.
c. Using a multichannel pipette, add 200 μL of XF calibration solution into each well of the utility plate.
Critical: Be careful not to pipette bubbles into the utility plate, as this will interfere with the hydration of the sensors.
2. Replace the sensor:
a. Place the hydration booster onto the utility plate and press down until it clicks in place.
b. Place the sensor cartridge back into the utility plate.
Critical: Be careful not to scrape or bump the sensors.
c. Check for bubbles trapped under the sensors by lifting the plate and viewing it from its sides and bottom. In case bubbles are present, carefully remove the sensor cartridge and place it back again, keeping the cartridge straight to prevent air from being trapped beneath it.
3. Hydrate the sensor overnight:
a. Humidify the non-CO2 incubator by placing a small container/reservoir with distilled water to prevent evaporation of the XF calibration solution.
b. Place the assembled sensor cartridge in the non-CO2 incubator for 8–24 h.
D. Loading injection ports and instrument calibration (timing: 30 min)
Note: The concentrations of the port injections are dependent on the cell type and density and should be optimized beforehand in an independent experiment. However, the most common final concentrations in the wells are 1.5 μM oligomycin, 0.25–2.0 μM FCCP or 0.25–3.0 μM BAM15, and 0.5 μM rotenone/antimycin A. Please note that uncoupler concentrations should be titrated for each cell line to find the optimal concentration.
1. Prepare the working solutions in labeled 15 mL centrifuge tubes (Table 2):
Table 2. Preparing the injectable compound working solutions
| Stock solution volume (μL) | XF medium volume (μL) | Final working solution volume (μL) | Volume added into port (μL) | Final concentration in well (μM) | |
| Port A (Oligomycin) | 15 | 2,485 | 2,500 | 20 | 1.5 |
| Port B (FCCP (option 1)) | 12 | 2,988 | 3,000 | 22 | 1.0 |
| Port B (BAM15 (option 2)) | 10 | 2,990 | 3,000 | 22 | 1.0 |
| Port C (Rot/AA) | 6 | 2,994 | 3,000 | 25 | 0.5 |
2. Loading injection ports:
a. Remove the hydrated cartridge from the non-CO2 incubator and remove the hydration booster:
i. Lift the sensor cartridge out of the utility plate and place it on its back, with the sensors facing upward.
ii. Remove the hydration booster from the utility plate.
iii. Replace the sensor cartridge onto the utility plate and check for any bubbles trapped beneath the sensors.
Note: Be mindful not to scrape the hydrated sensors at this stage.
b. Briefly vortex each centrifuge tube containing the injection solutions.
c. Remove the lid of the top of the sensor cartridge and place the drug loading guide on top of the sensor cartridge.
Note: For port A, align A1 on the drug loading guide with A1 on the sensor cartridge.
d. Load 20 μL of oligomycin into port A, 22 μL of BAM15 or FCCP into port B, and 25 μL of rotenone/antimycin A mixture into port C:
i. Sequentially transfer the contents of the injection solutions into their respective reservoirs, starting with oligomycin and ending with the rotenone/antimycin A mixture.
ii. Using a multichannel pipette, draw up the specified volume for each injection. We recommend reverse dispensing for this step to prevent bubble formation.
iii. Place the pipette tips into the drug loading guide vertically.
iv. Lean the multichannel pipette back 45°.
v. Dispense the contents down to the first stop.
vi. Hold the pipette at the first stop without releasing and remove the tips from the drug loading guide.
Critical: The drugs are held in the drug ports by capillary forces. It is therefore important not to blow the drugs through the port by pipetting down to the second stop. Avoid sudden movements and do not allow the cartridge to come into contact with other objects with great force.
3. Calibrate the sensor cartridge:
a. Ensure the lid is removed from the sensor cartridge.
b. Follow the on-screen instructions to load the utility plate and sensor cartridge into the machine.
E. Preparing single-cell suspensions from the anchorage-independent cell clusters and 2D monolayers (timing: 20 min)
Note: Preparing a clump-free single-cell suspension while minimizing cellular stress is essential for obtaining accurate results. The exact cell density used should be optimized for the cell line in an independent experiment.
1. Enzymatic and mechanical dissociation of the cell clusters:
a. Transfer the cell clusters into a sterile 15 mL centrifuge tube.
b. Remove any cell culture medium surrounding the cell clusters.
c. Carefully rinse the cell clusters twice with PBS:
i. Slowly add PBS into the 15 mL tube, allowing the liquid to slide down the sides of the tube onto the cell clusters.
ii. Remove the PBS around the cell clusters.
d. Add 0.5–1 mL of 0.05% trypsin to the cell clusters.
e. Place the centrifuge tube into an incubator at 37 °C for a total of 5–10 min; lightly swirl the tubes every 2–3 min.
Critical: Avoid cell clusters sticking to the side of the tube outside of the trypsin solution.
f. Remove the cells from the incubator.
g. Using a P1000 pipette, carefully and slowly pipette the solution up and down 15–20 times.
h. Add 1–2 mL of complete medium to neutralize trypsin and carefully pipette up and down 15–20 times.
2. Enzymatic dissociation of 2D monolayer cells:
a. Remove the cell culture media from the cells.
b. Carefully rinse the cells twice with PBS.
c. Add 0.5–1 mL of 0.05% trypsin to the cells.
d. Place the cells in the incubator at 37 °C for 5 min.
e. Remove the cells from the incubator.
f. Add 1–2 mL of complete medium to neutralize trypsin and carefully pipette up and down 15–20 times.
g. Transfer the dissociated 2D cell suspension into a separate 15 mL centrifuge tube.
Critical: Dissociation could be stressful to the cells. To avoid excessive stress on the cells, perform the up and down pipetting slowly to dissociate cells.
Note: Both the cell cluster suspension (step E1) and the 2D monolayer suspension (step E2) are now independently dissociated and neutralized, each in its own 15 mL tube. Both proceed identically through the remaining steps below.
3. Count the cells with Trypan Blue exclusion:
a. Remove the cells from the incubator.
b. Using a P1000 pipette, carefully pipette the solution 15–20 times.
c. Add 1–2 mL complete medium to neutralize trypsin and carefully pipette up and down 15–20 times.
d. At this point, transfer the dissociated 2D cell suspension into a 15 mL centrifuge tube (clustered cells are already in a 15 mL tube).
e. Centrifuge the 15 mL tube at 180× g for 5 min.
Note: Set a timer for 1 h at this point.
f. Remove the cell culture medium and add 0.5–2 mL of XF cell assay medium.
g. Resuspend the cells in this medium.
h. Using the Countess 3 Automated Cell Counter, count the cells using Trypan Blue exclusion.
i. Take note of the live cells per milliliter and use this number for subsequent calculations.
4. Prepare the working cell suspension:
a. Calculate the volume of XF Assay Medium needed to prepare a working suspension at the desired cell-seeding density.
b. Prepare this working solution in a new 15 mL centrifuge tube by adding the required volumes of XF assay medium and cells together.
Note: The required cell densities can be expected to be 20,000–50,000 cells/well, at 50 μL/well.
Critical: Set a timer for 1 h as soon as the cells are placed inside the centrifuge. To ensure consistent and reliable results, the cells must be in the Seahorse Analyzer at the 1-h time point.
F. Seeding the XF cell microplate (timing: 30–40 min)
Note: The seeded cells should form an even monolayer adhered to the bottom of the PDL-coated wells. No cells should be pipetted into the four corner wells, as these wells are used as reference blank wells by the instrument.
1. Seed 50 μL of cell suspension into each well of the XF cell microplate:
a. Using either a single pipette or a multichannel pipette, take up 50 μL of the cell suspension prepared in section E and seed the cells by resting the pipette tip on the inner ledge of the well (Figure 2A, left panel).
Note: Avoid pipetting bubbles as this may interfere with the assay. Pipette down to the first stop and hold the pipette tip at an angle pressed against the inner side of the well for a second to allow the remaining fluid to be drawn out of the tip with capillary forces.
2. To aid adherence of the cells to the bottom of the PDL-coated wells, centrifuge the XF cell microplate at 200× g for 2 min at ambient temperature. Zero braking is preferred. Most of the cells should be adhered after this step.
3. Transfer the plate to a non-CO2 incubator (37 °C) for 15–20 min to facilitate further adherence if needed. This incubation period can be shortened if all the cells are fully adhered to the bottom of the plate after centrifugation.
4. Visually confirm that most of the cells have adhered to the bottom of the microplate.
Critical: Take care not to agitate the plate during transport, as this may loosen the cells.
5. Using a multichannel pipette, gently add 130 μL of warm XF cell assay medium along the side of each well to obtain a final volume of 180 μL. Do this slowly and gently to avoid disturbing the cells (Figure 2A, right panel). Visually inspect the wells to ensure that the cells are in a single-cell monolayer (Figure 2B) and that there are no residual clusters (Figure 2C). Take note of any wells with a significant number of residual clusters to potentially exclude as outliers during data analysis.
6. Return the cells to the non-CO2 incubator at 37 °C for 15–25 min. This degassing step is essential to minimize dissolved CO2 in the XF assay media, which could potentially alter the media pH and be responsible for the formation of bubbles underneath the probes, leading to non-biological variation in the assay.
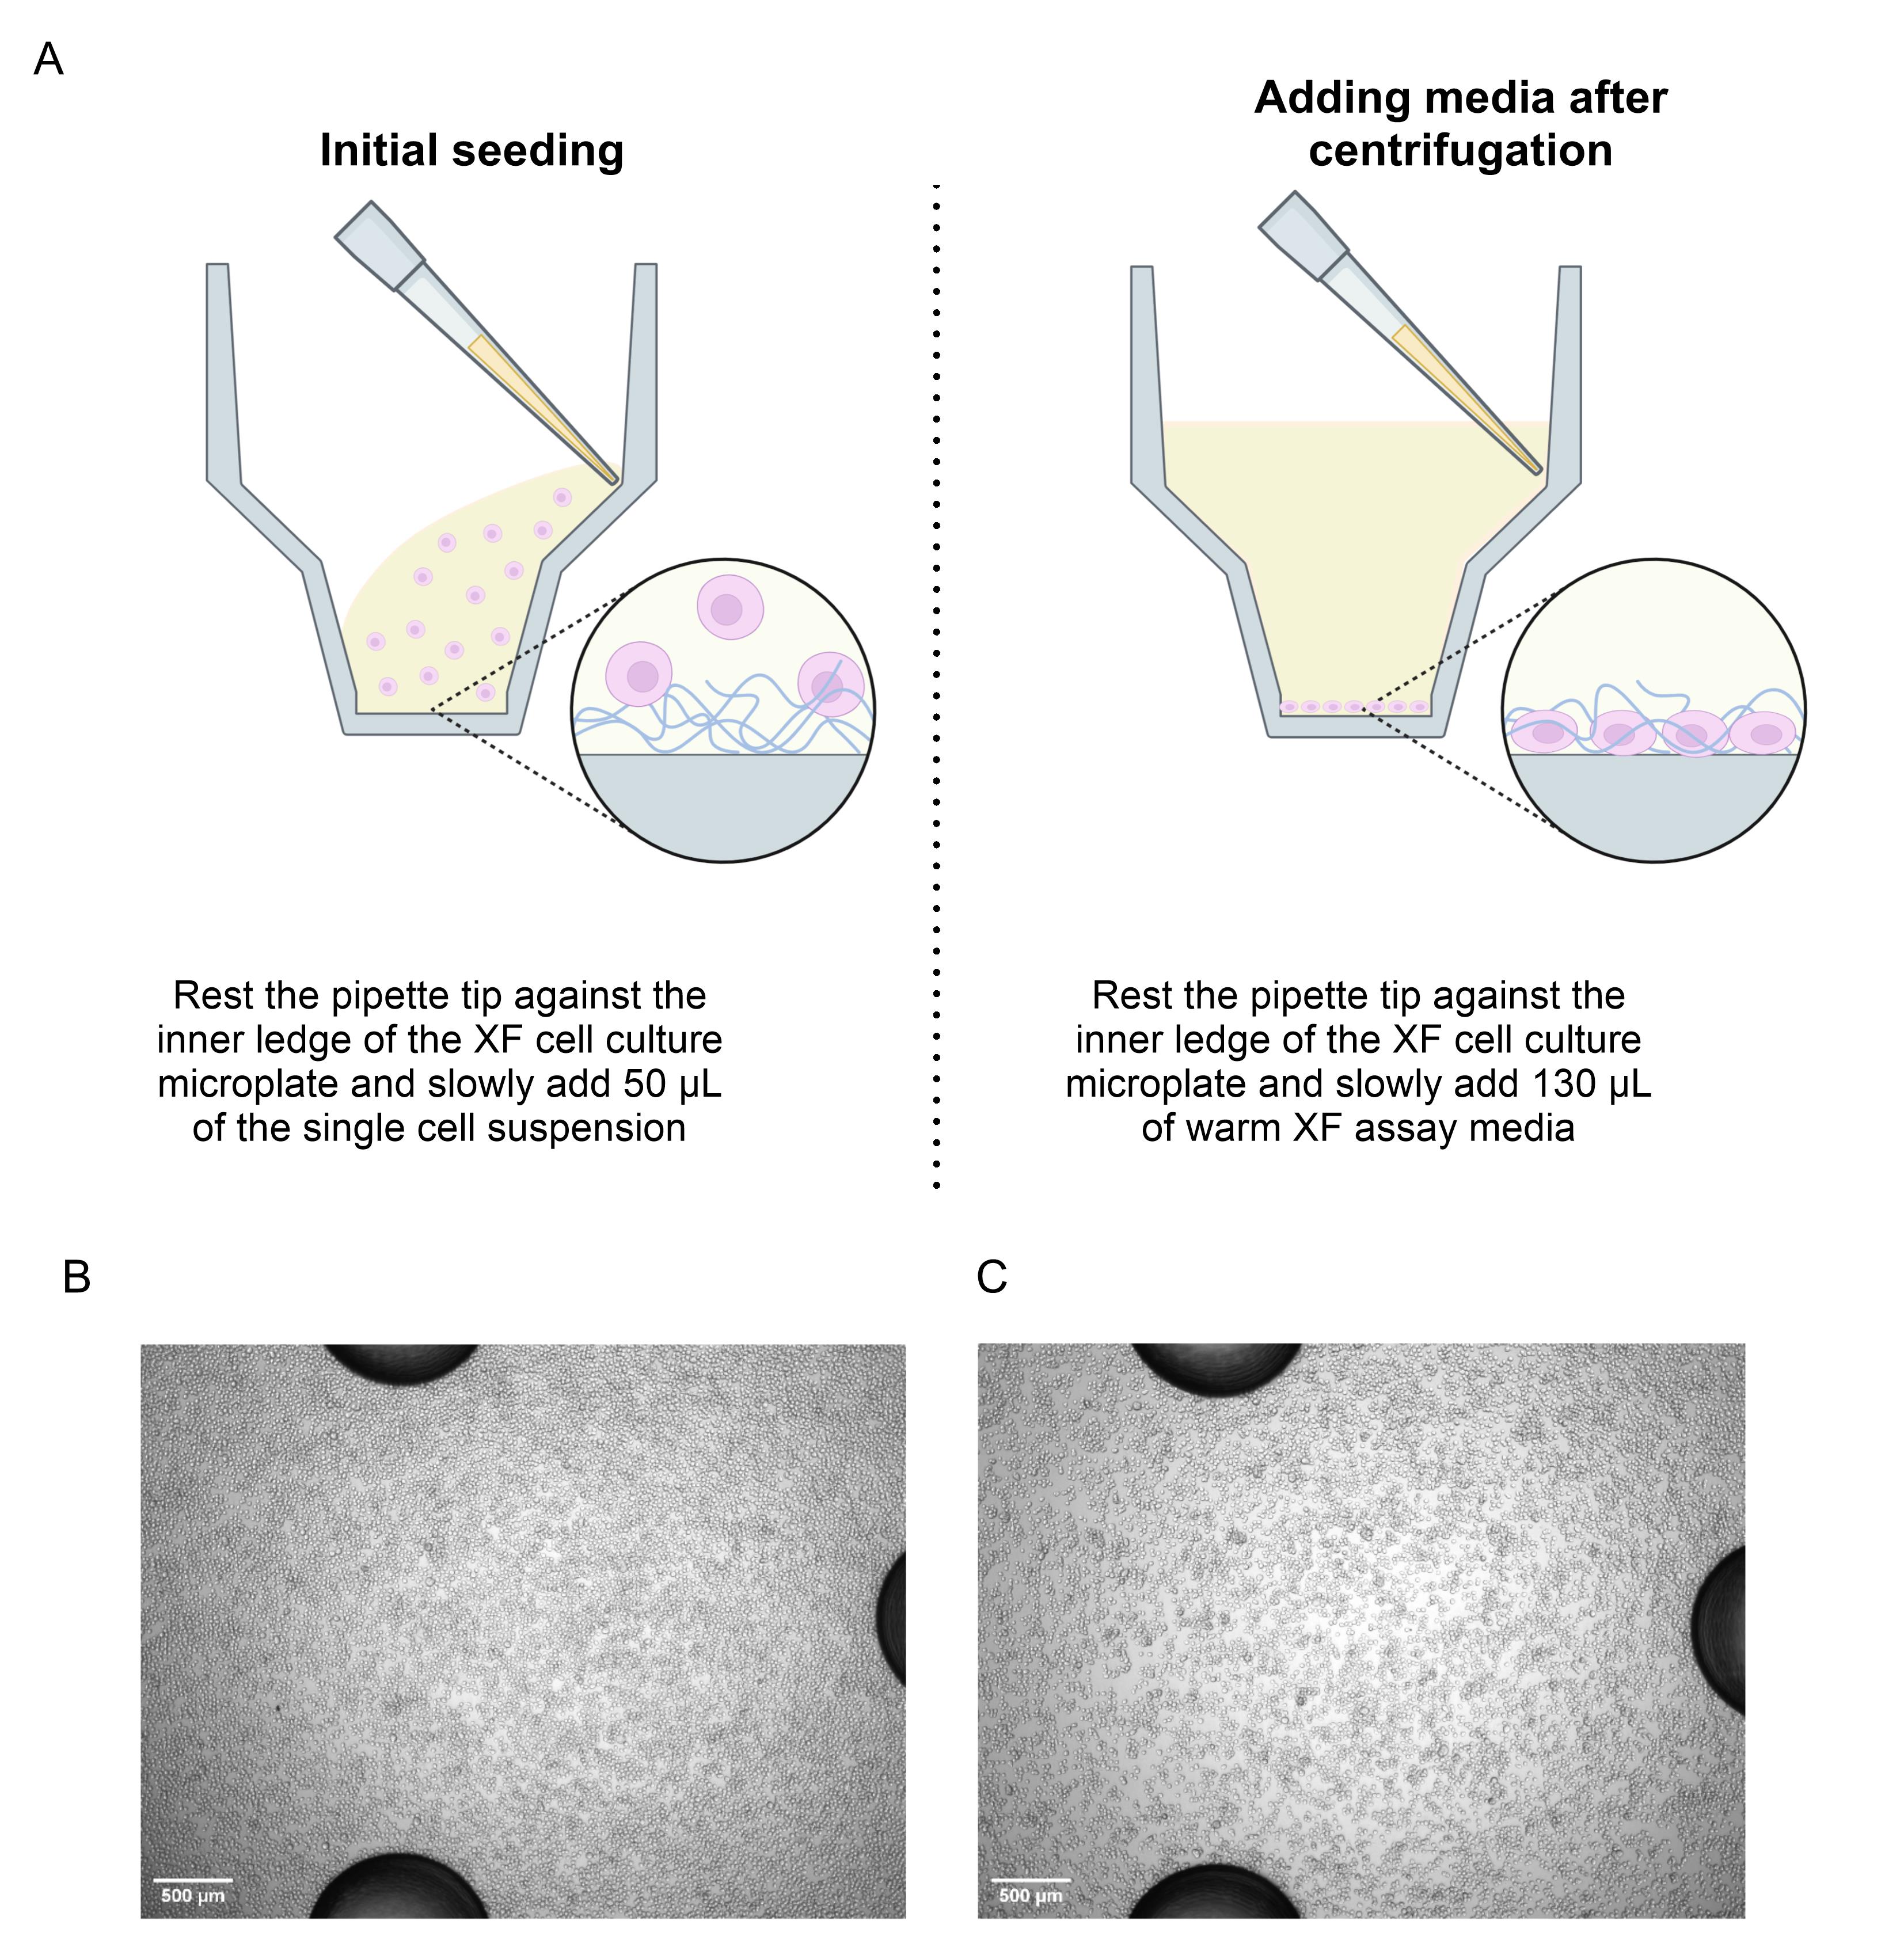
Figure 2. Seeding of XF cell microplate. (A) By resting the pipette tip against the inner ledge of the XF cell microplate, the single-cell suspension (left panel) and XF cell assay medium (right panel) are slowly added to each well to prevent the formation of air bubbles during seeding or the disturbance of the monolayer after centrifugation. (B) Well-dispersed cells with minimal clumping are essential to the quality of the assay results. (C) In cases where there are excessive clumps or the cells did not adhere properly to the XF cell microplate, the OCR readings may be inconsistent. Scale bars represent 500 µm.
G. Running the assay (timing: 1.5 h)
1. Follow the on-screen instructions to load the XF Cell microplate into the Seahorse XF Analyzer.
2. The assay will proceed automatically according to the programmed protocol, with the following injection sequence:
a. First three measurements: Basal OCR (no injections).
b. Port A injection (oligomycin): Three measurements post-injection.
c. Port B injection (FCCP or BAM15): Three measurements post-injection.
d. Port C injection (rotenone/antimycin A): Three measurements post-injection.
Data analysis
Normalization to cell number
Because cells are seeded at a known, experimentally determined density (typically 20,000–50,000 viable cells/well), all OCR values are normalized to the number of live cells seeded per well, as determined by Trypan Blue exclusion counting prior to plating. Raw OCR values (pmol O2/min) can be divided by the number of live cells seeded in the corresponding well to yield per-cell OCR values (pmol O2/min/cell). This normalization is performed in the Wave Controller software prior to data export. For experiments optimizing different seeding densities, per-cell OCR values should be compared across densities.
Raw data export and quality control
Raw oxygen consumption rate (OCR) data were exported directly from the Agilent Seahorse XF Pro Analyzer into Excel. Prior to analysis, individual wells are inspected for data quality. Wells exhibiting erratic or anomalously low OCR traces, poor cell attachment, or a visually confirmed excess of residual cell clusters (as assessed by microscopic inspection at the seeding step; see step F5a) should be flagged and excluded as outliers. The four corner wells, which serve as background reference blanks, are used by the instrument for automatic background correction and should not contain cells.
Calculation of bioenergetic parameters
The following bioenergetic parameters can be calculated from the normalized, per-cell OCR traces using the sequential injection protocol: oligomycin → FCCP or BAM15 → rotenone/antimycin A.
• Basal respiration: Mean of the three OCR measurements prior to any injection − OCR after Rot/AA injection.
• Proton leak: OCR after oligomycin injection − OCR after rotenone/antimycin A injection (mean of three post-injection measurements).
• Maximal respiratory capacity: OCR after FCCP or BAM15 injection (mean of three post-injection measurements) − OCR after Rot/AA injection.
• ATP-linked respiration (ATP production): Basal OCR − OCR after oligomycin injection (mean of three post-injection measurements).
• Spare respiratory capacity: Maximal respiratory capacity − basal OCR.
All calculations are performed in Microsoft Excel. These parameters may also be automatically calculated within the Agilent Seahorse Analytics platform using its built-in Mito Stress Test report generator; however, manual calculation in Excel is recommended to allow full control over well exclusions and normalization inputs.
Statistical analysis
Data are expressed as mean ± standard deviation (SD) across technical replicates within an experiment. For comparisons between two conditions (e.g., attached vs. anchorage-independent, or detached vs. reattached), an unpaired, two-tailed Student's t-test is performed, with a Gaussian distribution assumed. For comparisons involving more than two groups, a one-way ANOVA with an appropriate post hoc test (e.g., Tukey's or Dunnett's) should be applied. Statistical analyses and data visualization are performed in GraphPad Prism 11, with a p-value < 0.05 considered statistically significant. Each experiment should be performed across a minimum of four independent biological replicates; results from a single experiment representing technical replicates are appropriate for optimization data (e.g., seeding density and uncoupler titration).
Validation of protocol
This protocol was used in Figure 3C of Labuschagne et al. (2019) [3]. Further validation is provided below.
Application of the workflow to an in vitro metastasis model
To illustrate how this workflow can be used to interrogate metastasis-relevant metabolic adaptations, we applied it to an in vitro model in which A549 lung adenocarcinoma cells are studied as attached, detached, and reattached populations (Figure 1A), modeling primary tumor cells (in terms of cell–ECM interaction), anchorage-independent circulating tumor cells, and colonized secondary lesions, respectively. Detached cells were cultured in anchorage-independent conditions for 7–14 days, whereas reattached cells were generated by replating detached cells onto adherent substrate for an additional 3–7 days. This was achieved by transferring cell clusters from ultra-low adherent plates into standard tissue culture–treated plates, allowing the clusters to reattach to the plate surface and cells to migrate outward from the cluster periphery.
Bioenergetic profiling using the dissociation-based Seahorse XF Mito Stress Test on all three conditions revealed that detached cells had reduced basal, maximal, and ATP-linked respiration compared to attached cells, consistent with diminished oxidative phosphorylation under anchorage-independent conditions (Figure 3B–E). Interestingly, reattached cells regained much of the lost respiratory capacity, approaching OCR levels seen in attached cells, indicating that the metabolic defects induced by detachment are at least partially reversible when cells re-establish adhesion (Figure 3A–F).
Collectively, these data demonstrate that the described Seahorse workflow can capture reversible bioenergetic and mitochondrial remodeling across attached, anchorage-independent, and reattached states, supporting its utility as a platform for studying anchorage independence and metastasis-associated metabolic plasticity.
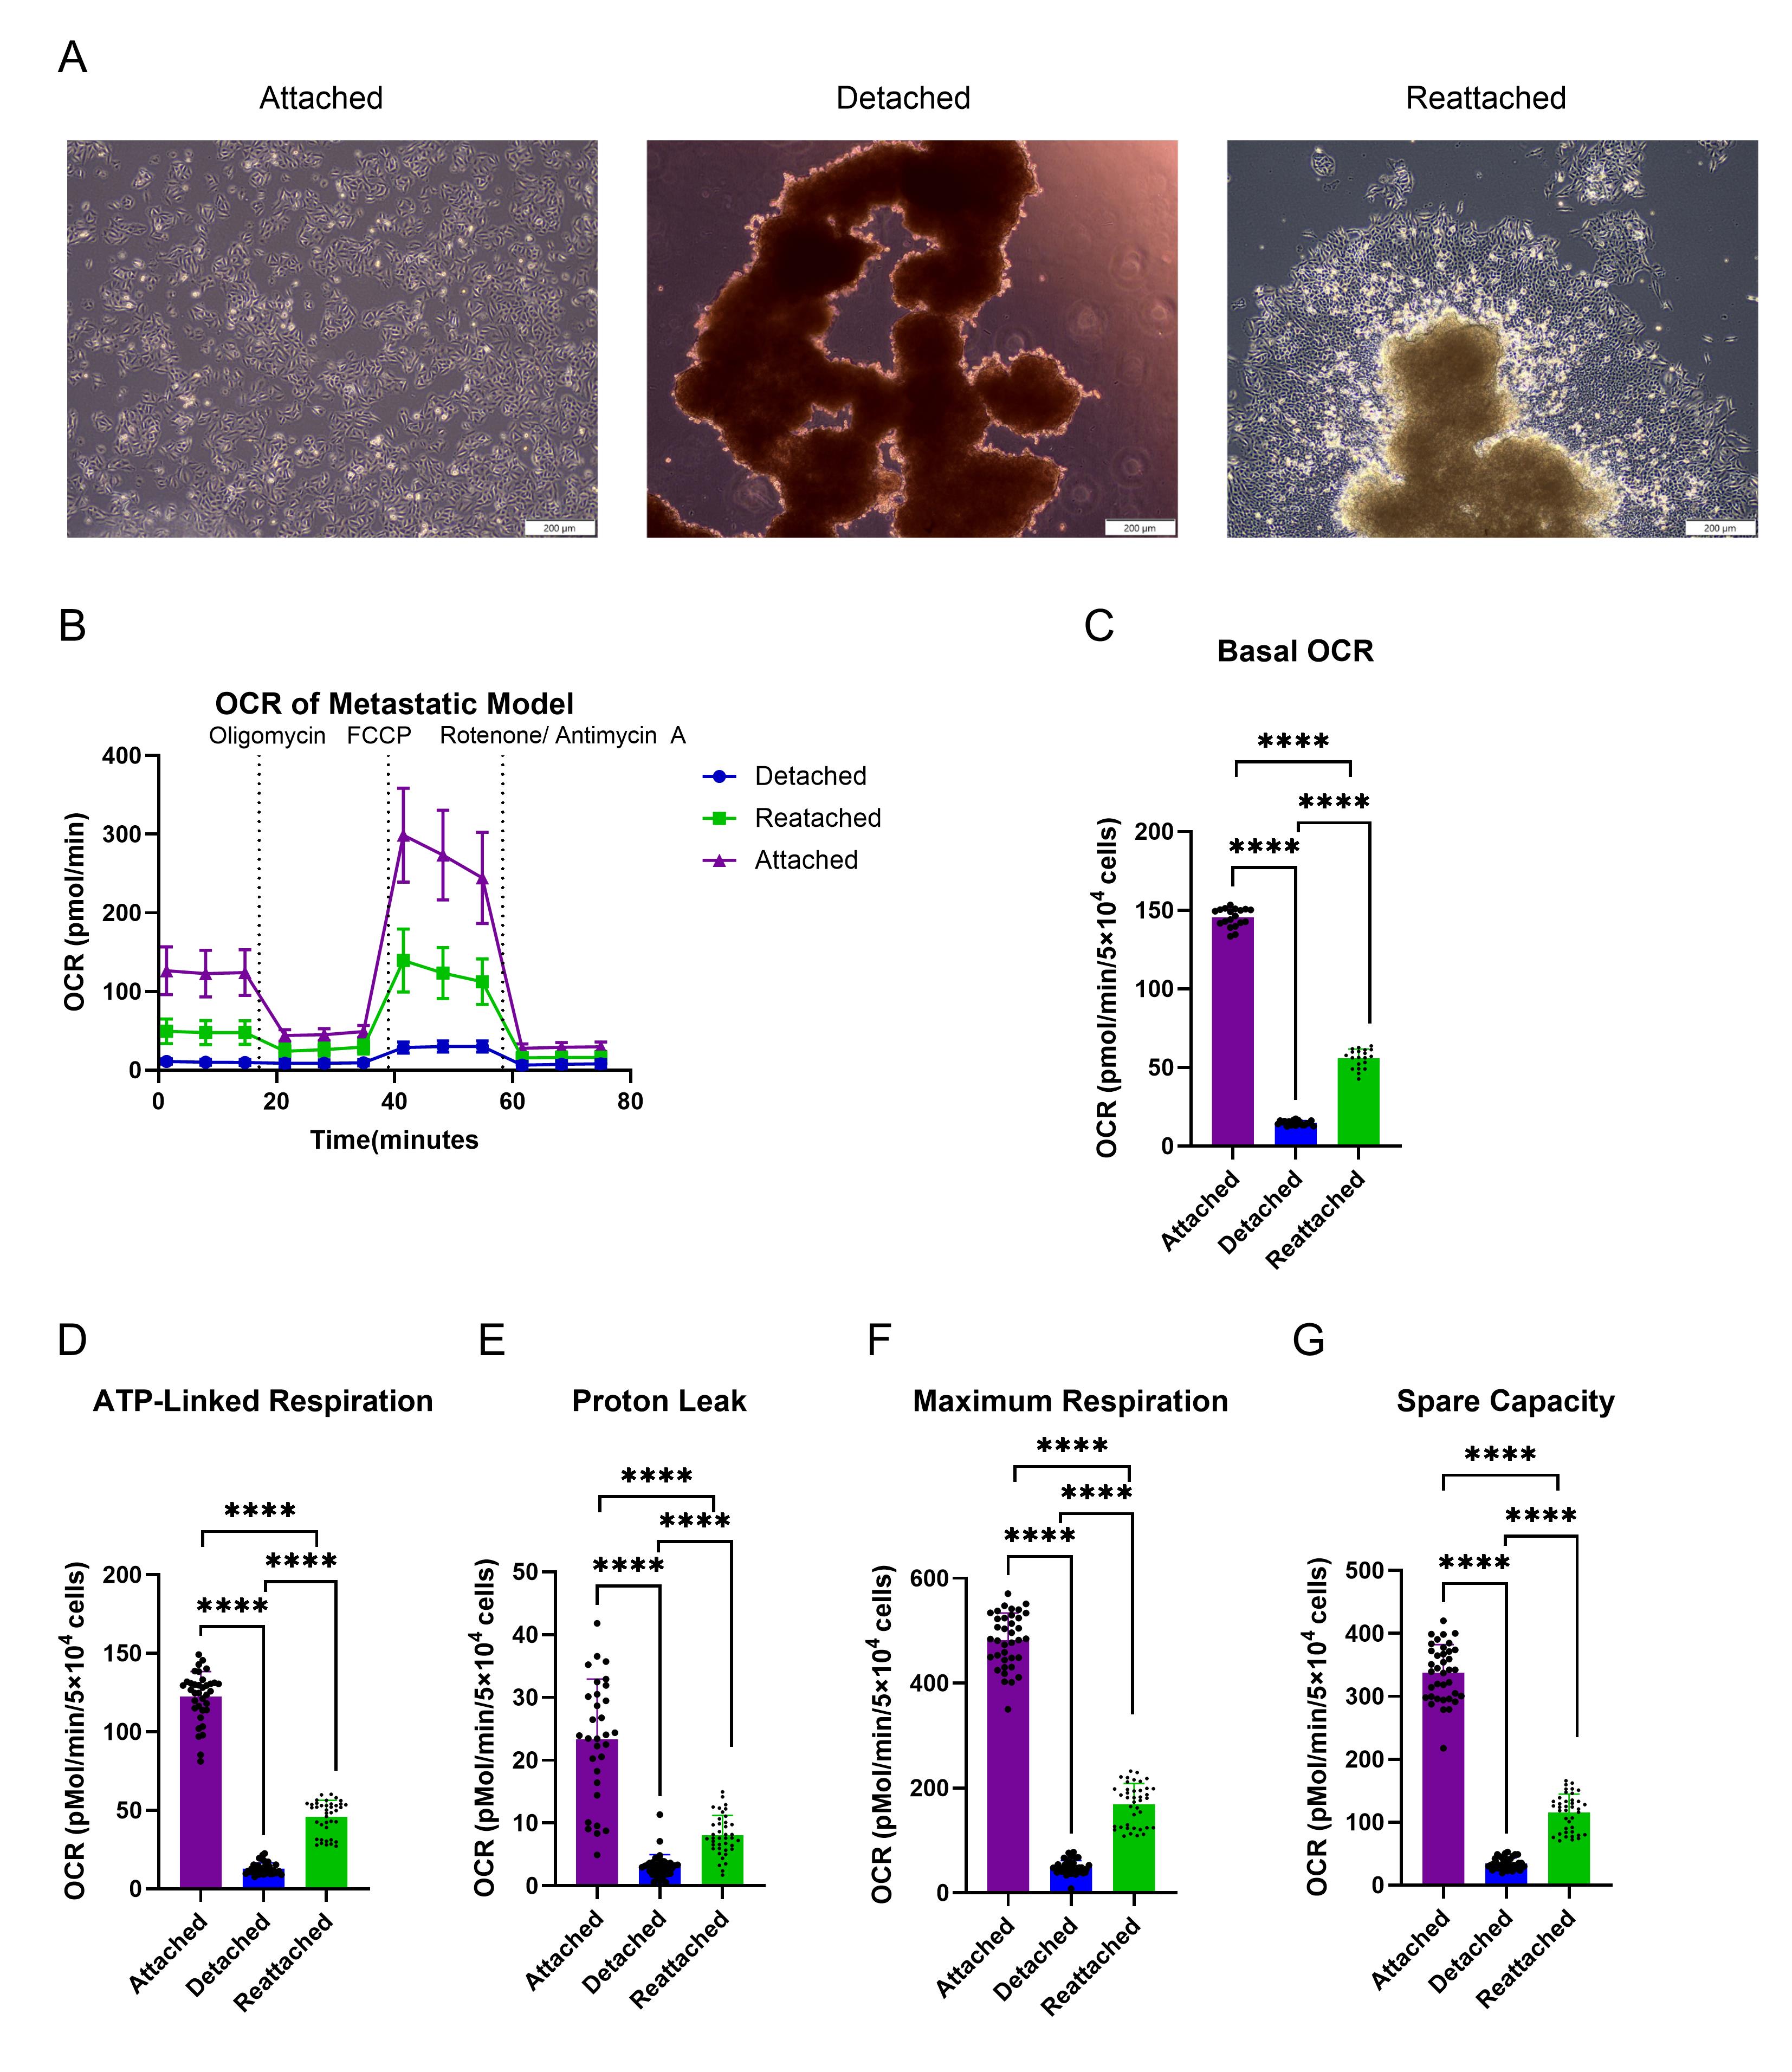
Figure 3. Bioenergetic profiles and parameters in an in vitro metastatic model. (A) Representative images of A549 cells grown as attached, detached, and reattached. Scale bars represent 200 µM. (B) Oxygen consumption rates of cells grown as 2D monolayers (attached), anchorage-independent growth (detached), and detached cells replated in attached conditions (reattached). (C) Calculated basal OCR. (D) Calculated ATP-linked respiration. (E) Calculated proton leak. (F) Calculated maximum respiration. (G) Calculated spare capacity. Data represent mean ± SD. An unpaired, two-tailed t-test was done, comparing two conditions to each other at a time, with a Gaussian distribution assumed. ****p ≤ 0.0001.
General notes and troubleshooting
General notes
When preparing the single-cell suspension, it is essential to dissociate the spheroids completely to ensure that a clump-free monolayer has been seeded into the XF cell culture microplate. A good single-cell suspension will ensure accurate cell counting, dilution, and seeding across all technical replicates, directly affecting the quality of the assay results. Overworking a cell suspension can lead to excessive cell damage and death, whereas insufficient processing will leave large cell clumps intact, both of which can compromise the reliability of the results.
Troubleshooting
Problem 1: Cells not adhering to the XF microplate after centrifugation.
Possible causes: The PDL coating is not fresh or has been reused, or braking after centrifugation may agitate the cells and cause them to detach.
Potential solutions: Ensure fresh PDL was used for each plate, as PDL solution cannot be reused. Set the centrifuge to zero or slower braking and ensure the centrifuge temperature is set between 25 and 37 °C.
Problem 2: Inconsistent maximum OCR measurements.
Possible cause: The uncoupler concentration is not optimized for the cell density or cell line used.
Potential solutions: Reduce the concentration of uncoupler, as excessive uncoupler concentrations can result in toxicity of the cells. It is best practice to optimize uncoupler concentrations against different cell densities and cell lines, since these parameters are cell line–specific. This should be done by titrating uncoupler concentrations for each cell line to find the optimum concentration. Additionally, HEPES can be added to the assay medium, as this tends to result in a straighter and more reproducible OCR curve. Lastly, instead of the traditionally used FCCP, BAM15 can be used as the uncoupler of choice. BAM15 is a new and improved uncoupler, preferred due to its specificity to the mitochondria and lack of plasma membrane depolarization, unlike FCCP, which exhibits off-target effects, inducing plasma membrane depolarization [8].
Problem 3: Flat curves on the OCR output despite sufficient cell numbers.
Possible cause: The cells may have experienced excessive stress due to harsh dissociation steps or prolonged exposure to room temperature.
Potential solution: To mitigate this, use gentler dissociation reagents and minimize the handling time of the cells at room temperature. It is essential to work with the cells as quickly as possible.
Acknowledgments
The authors would like to thank the South African National Research Foundation (NRF) (grant number: RA22121577127) and the North-West University. All figures in this manuscript were created using BioRender or GraphPad Prism 11. This method was used in Labuschagne et al. [3].
Author contributions
Method design and optimization: R.L., B.R.F.; experimental assays performed by R.L. and J.L.V.; the original manuscript was written by C.F.L. and R.L; review and editing by R.L., B.R.F., and J.L.V.
Competing interests
The authors declare no conflicts of interest.
Ethical considerations
No ethical considerations, as only commercial cell lines were used in this protocol.
References
- Deng, Z., Wang, H., Liu, J., Deng, Y. and Zhang, N. (2021). Comprehensive understanding of anchorage-independent survival and its implication in cancer metastasis. Cell Death Dis. 12(7): 629. https://doi.org/10.1038/s41419-021-03890-7
- Jiang, L., Shestov, A. A., Swain, P., Yang, C., Parker, S. J., Wang, Q. A., Terada, L. S., Adams, N. D., McCabe, M. T., Pietrak, B., et al. (2016). Reductive carboxylation supports redox homeostasis during anchorage-independent growth. Nature. 532(7598): 255–258. https://doi.org/10.1038/nature17393
- Labuschagne, C. F., Cheung, E. C., Blagih, J., Domart, M. C. and Vousden, K. H. (2019). Cell Clustering Promotes a Metabolic Switch that Supports Metastatic Colonization. Cell Metab. 30(4): 720–734.e5. https://doi.org/10.1016/j.cmet.2019.07.014
- Schuster, E., Taftaf, R., Reduzzi, C., Albert, M. K., Romero-Calvo, I. and Liu, H. (2021). Better together: circulating tumor cell clustering in metastatic cancer. Trends Cancer. 7(11): 1020–1032. https://doi.org/10.1016/j.trecan.2021.07.001
- Tidwell, T. R., Røsland, G. V., Tronstad, K. J., Søreide, K. and Hagland, H. R. (2022). Metabolic flux analysis of 3D spheroids reveals significant differences in glucose metabolism from matched 2D cultures of colorectal cancer and pancreatic ductal adenocarcinoma cell lines. Cancer Metab. 10(1): e1186/s40170–022–00285–w. https://doi.org/10.1186/s40170-022-00285-w
- Ascione, F., Ferraro, R., Dogra, P., Cristini, V., Guido, S. and Caserta, S. (2024). Gradient-induced instability in tumour spheroids unveils the impact of microenvironmental nutrient changes. Sci Rep. 14(1): 20837. https://doi.org/10.1038/s41598-024-69570-6
- Langan, L. M., Dodd, N. J. F., Owen, S. F., Purcell, W. M., Jackson, S. K. and Jha, A. N. (2016). Direct Measurements of Oxygen Gradients in Spheroid Culture System Using Electron Parametric Resonance Oximetry. PLoS One. 11(2): e0149492. https://doi.org/10.1371/journal.pone.0149492
- Kenwood, B. M., Weaver, J. L., Bajwa, A., Poon, I. K., Byrne, F. L., Murrow, B. A., Calderone, J. A., Huang, L., Divakaruni, A. S., Tomsig, J. L., et al. (2014). Identification of a novel mitochondrial uncoupler that does not depolarize the plasma membrane. Mol Metab. 3(2): 114–123. https://doi.org/10.1016/j.molmet.2013.11.005
Article Information
Publication history
Received: Aug 17, 2026
Accepted: Sep 17, 2026
Available online: Oct 11, 2026
Published: Oct 20, 2026
Copyright
© 2026 The Author(s); This is an open access article under the CC BY-NC license (https://creativecommons.org/licenses/by-nc/4.0/).
How to cite
Lindeque, R., Visagie, J. L., Fouché, B. R. and Labuschagne, C. F. (2026). A Dissociation-Based Seahorse XF Workflow for Quantifying Averaged Bioenergetics in Anchorage-Independent Cancer Cell Clusters. Bio-protocol 16(20): e5849. DOI: 10.21769/BioProtoc.5849.

 Download Citation in RIS Format
Do you have any questions about this protocol?
Post your question to gather feedback from the community. We will also invite the authors of this article to respond.
 Post a Question


