


- Protocols

- Articles and Issues
- For Authors
- About
- Become a Reviewer


Antiangiogenic Drug Testing Using Proangiogenic and Hypoxia Zebrafish Model

Published: Vol 16, Iss 20, Oct 20, 2026 DOI: 10.21769/BioProtoc.5846 Views: 42
Reviewed by: Alberto RissoneRajesh D GunageAnonymous reviewer(s)
 PDF
PDF  Ask a question
Original research article
The authors used this protocol in:
Aug 2025
Advertisement


Protocol Collections
Comprehensive collections of detailed, peer-reviewed protocols focusing on specific topics




Abstract
Zebrafish is an excellent in vivo model for high-throughput antiangiogenic drug testing, commonly known as the zebrafish angiogenesis assay. Conventional zebrafish angiogenesis assays are performed in wild-type zebrafish to evaluate the vascular changes in intersegmental and subintestinal vessel regions of the zebrafish larvae at 2 and 3 dpf stages, respectively. However, wild-type zebrafish larvae do not adequately mimic the hypoxia microenvironment and ectopic vessel branching characteristics of cancer. To overcome this limitation, we developed a genetically engineered zebrafish model with constitutive activation of the hypoxia signaling pathway by targeting the vhl, a tumor suppressor, by negative regulation of the hypoxia pathway, using CRISPR mutagenesis. This model exhibits robust ectopic blood vessel branching throughout the larval body, thereby recapitulating pathological angiogenesis. The utility of this zebrafish model system for drug screening was validated with the sorafenib treatment, a known antiangiogenic tyrosine kinase inhibitor. Overall, this proangiogenic hypoxia zebrafish model provides a physiologically relevant platform for testing antiangiogenic drugs.
Key features
• Generate a vhl mutant zebrafish line with constitutive activation of the hypoxia signaling pathway using CRISPR-CAS9 mutagenesis.
• The generated model exhibits extensive ectopic neovascular branching and abnormal vascular growth resembling pathological angiogenesis observed in solid tumors.
• Mimics the chronic hypoxic microenvironment commonly associated with cancer progression and angiogenesis.
• Provides an economical alternative to mammalian tumor models for early-stage antiangiogenic drug testing.
Keywords: Zebrafish Hypoxia signaling
Tg(fli1:EGFP)
Angiogenesis
Antiangiogenic drug testing
In vivo disease model
Hypoxia signaling
Tg(fli1:EGFP)
Angiogenesis
Antiangiogenic drug testing
In vivo disease model
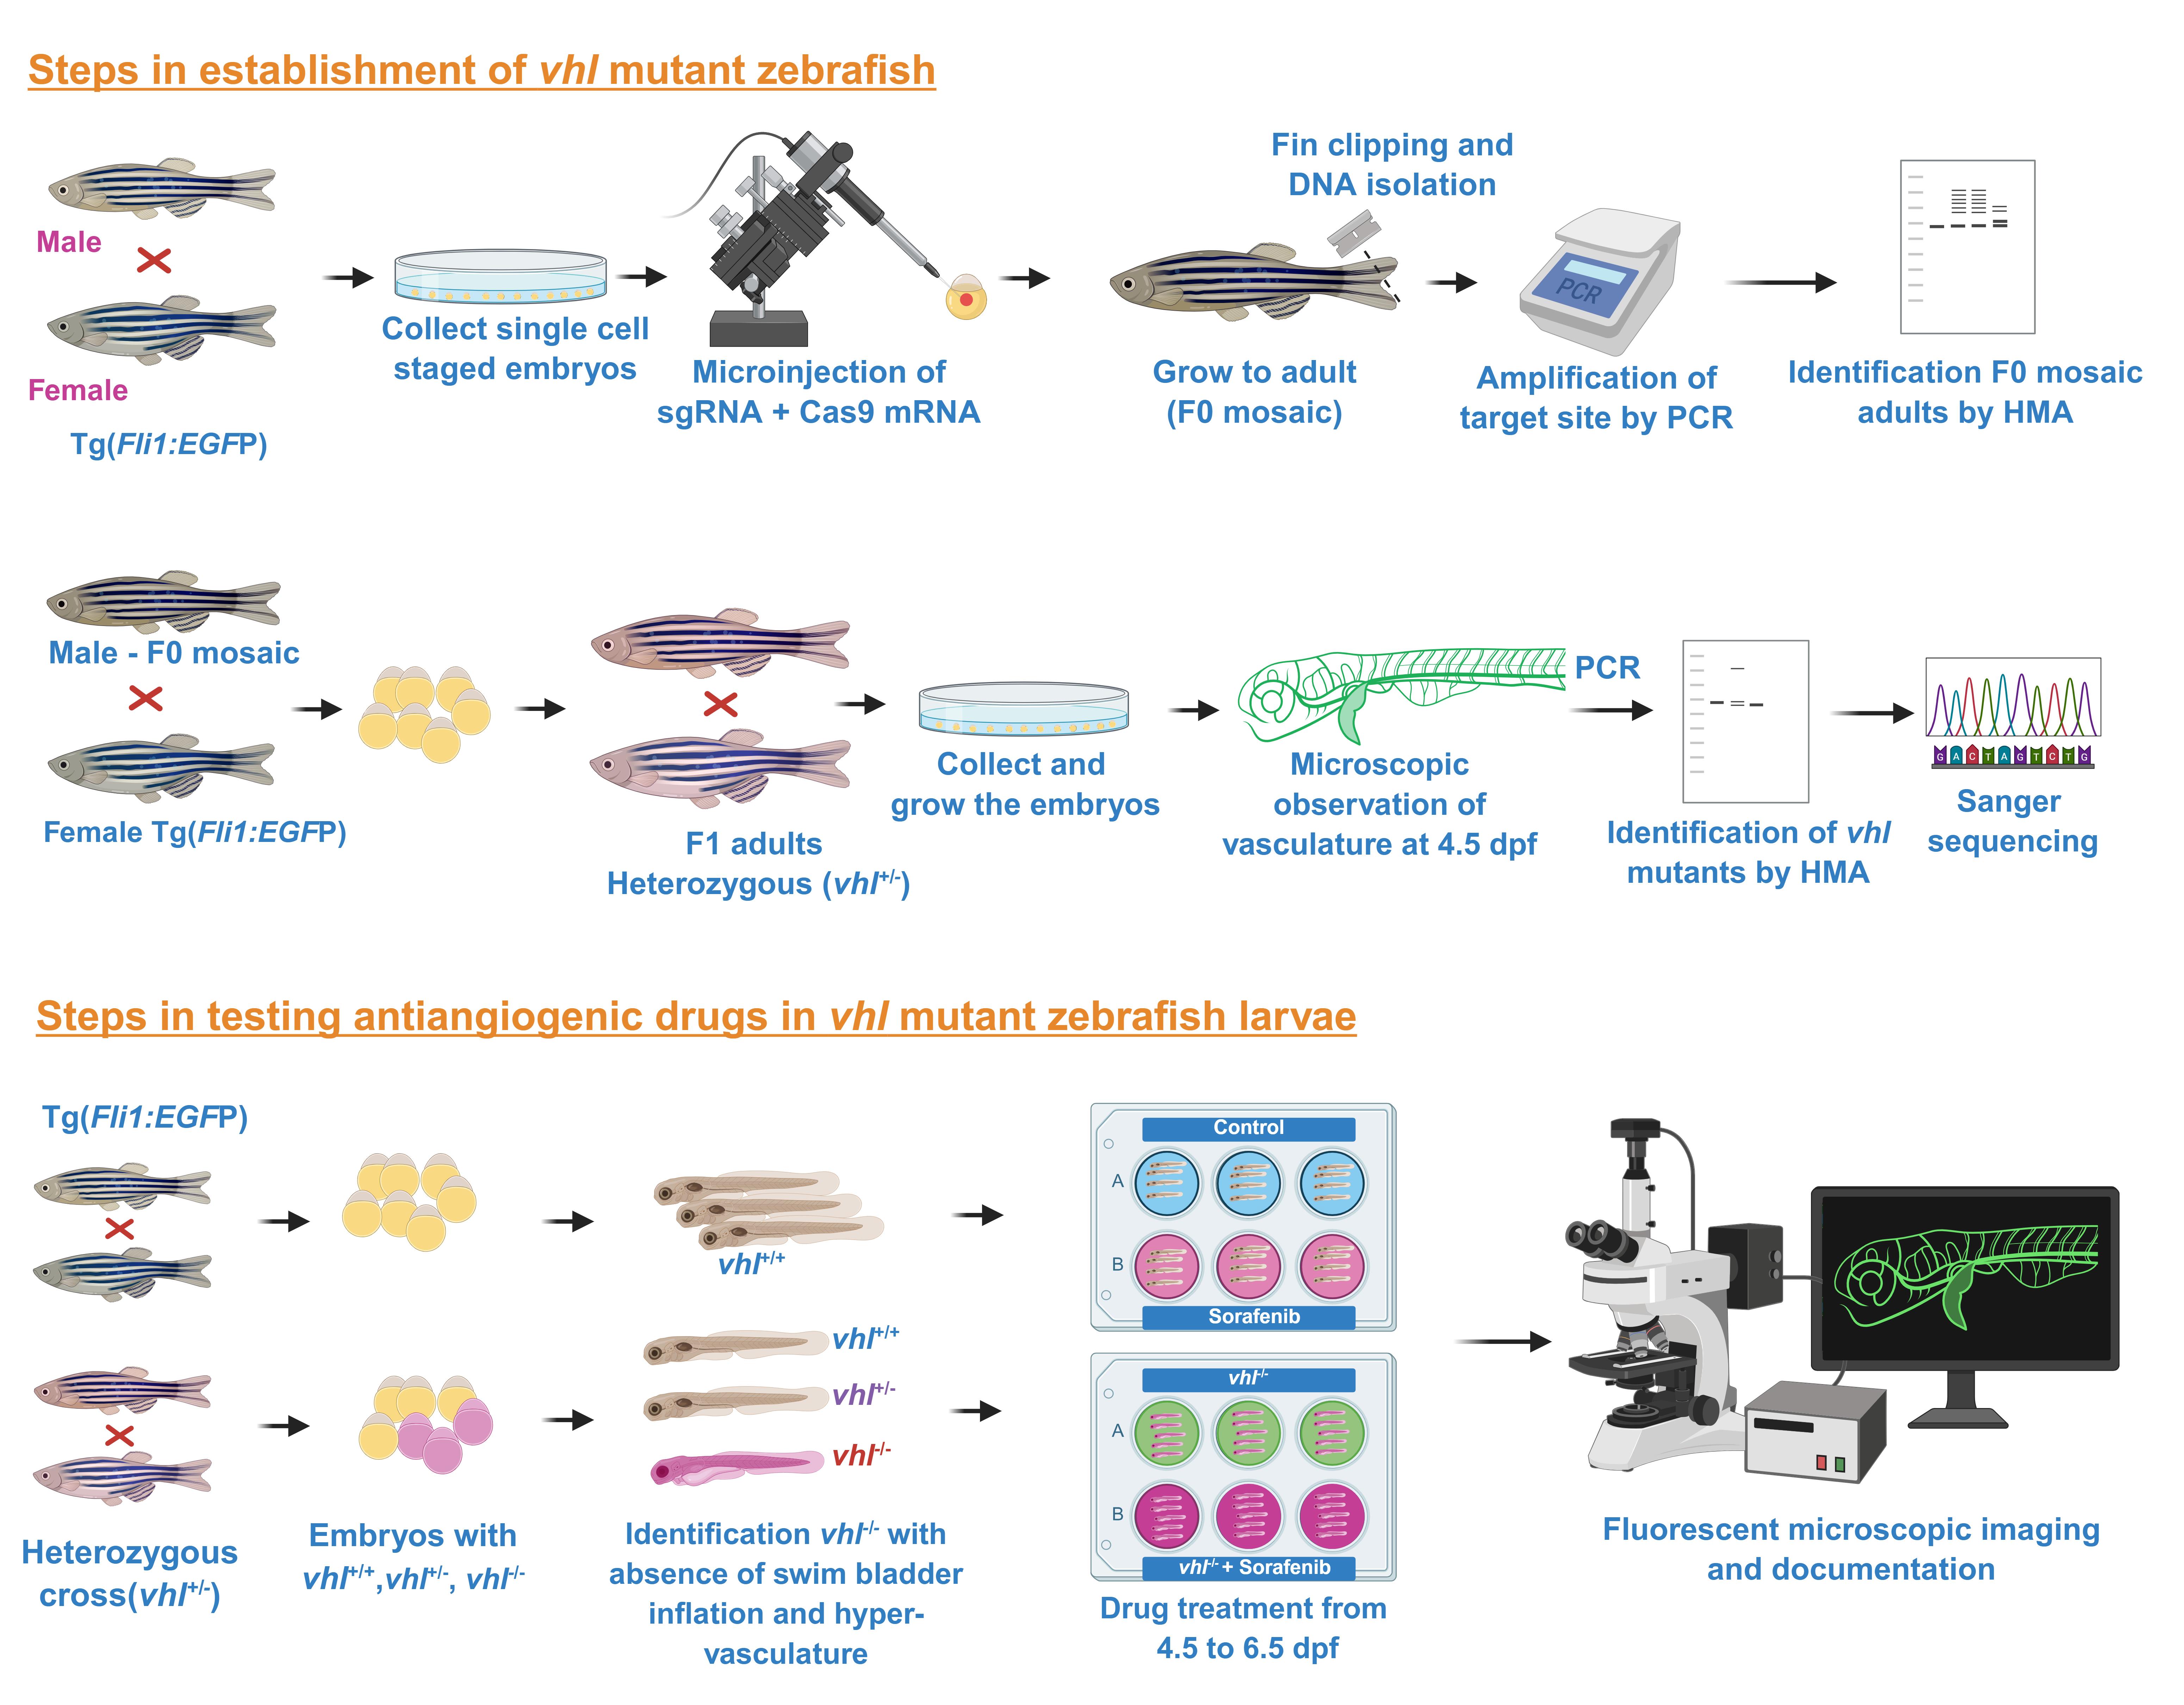
Graphical overview
Background
Cancer angiogenesis is a process of forming abnormal ectopic neovasculatures that are essential for tumor growth and metastasis [1]. Therefore, the identification of novel antiangiogenic compounds has become an important area in cancer therapeutics. Antiangiogenic drugs can be efficiently tested in the high-throughput zebrafish angiogenesis assay [2,3]. The availability of blood vessel–specific transgenic lines such as Tg(fli1:EGFP) and Tg(kdrl:EGFP), which enable real-time visualization of vascular development and angiogenesis in live embryos, and the transparency of early larval stages make zebrafish a suitable model for antiangiogenic drug testing [4]. In zebrafish, the angiogenesis assay has been conducted in wild-type larvae by exposing the embryos to test compounds at 1 dpf and analyzing the vascular changes in the intersegmental vessels (ISVs) and subintestinal vessel (SIV) regions at 2 and 3 dpf, respectively [5,6]. The ISVs are particularly suitable for angiogenesis assessment because they normally form stereotypic secondary vessels without ectopic terminal neovasculatures. Under activated hypoxia signaling, such as in the vhl mutant, abnormal vascular sprouting and ectopic neovascularization can be readily observed in the ISVs [6,7]. Although this conventional model is useful for identifying antiangiogenic compounds that may show efficacy in normal zebrafish larvae, it may not have similar efficacy in patients experiencing hypoxia, a major driver of drug resistance.
To overcome this limitation, we generated a hypoxia zebrafish model by targeting the exon 3 (the alpha domain that helps in the formation of the Vhl complex, which is involved in the negative regulation of Hifα) of the vhl through CRISPR mutagenesis, based on our previous studies in bioinformatics analysis of identifying the most pathological and conserved position of human VHL mutation [6]. The VHL is a tumor-suppressor gene that negatively regulates hypoxia-inducible factor alpha (HIFα) by promoting its proteasomal degradation under normoxic conditions [8]. Loss of Vhl function leads to the stabilization of Hifα and binds with Hifβ, which translocates and activates the transcription of genes involved in angiogenesis, erythropoiesis, and glucose metabolism, which includes genes such as vascular endothelial growth factor (vegfa), erythropoietin (epo), glucose transporter 1 (slc2a1/glut1), and prolyl hydroxylase domain protein 3 (phd3), thereby promoting vascular growth, metabolic adaptation, and cell survival [7]. This constitutive activation of hypoxia signaling induces extensive ectopic vascular branching throughout the larval body, mimicking key features of pathological angiogenesis [6,7].
The generated vhl mutant zebrafish larvae successfully recapitulated the proangiogenic phenotype and showed drug resistance by further elevating hypoxia signaling (more than 200-fold higher expression of phd3) to overcome the antiangiogenic effect of sorafenib. Activation of hypoxia signaling in the vhl mutant can be monitored using levels of phd3 gene expression, a well-established downstream marker of HIF signaling [6,7]. This pseudo-hypoxia zebrafish model clearly showed that the efficacy of antiangiogenic drugs differed under activated hypoxia signaling conditions [6]. Validation of this model using sorafenib, a clinically approved antiangiogenic tyrosine kinase inhibitor, demonstrated significant suppression of ectopic vessel growth, targeting pathological angiogenesis [6].
The vhl mutant larvae survive up to approximately only 12 dpf (due to hyperleaky neovasculatures) [6,9], but this still provides a sufficient time to study angiogenesis development and antiangiogenic drug screening. The transparent larval stages, robust and reproducible proangiogenic phenotype, small size, rapid development, and compatibility with high-throughput screening provide important advantages for drug testing applications. Thus, this model successfully addresses the limitations of previous wild-type zebrafish angiogenesis systems and provides a more physiologically relevant platform for antiangiogenic drug testing in cancer and other angiogenesis-associated diseases.
Materials and reagents
Biological material
1. Zebrafish wild type and vhl mutant in the transgenic line Tg(fli1:EGFP) background
Reagents
1. DMSO (Sigma-Aldrich, catalog number: D2650)
2. Tag DNA polymerase master mix red (Ampliqon, catalog number: A180301)
3. HiScribe T7 High Yield RNA Synthesis kit (NEW ENGLAND Biolabs, catalog number: E2040S) (store at -20 °C)
4. mMESSAGE mMACHINE SP6 kit (Invitrogen, catalog number: AM1344) (store at -20 °C)
5. DNase I (Thermo Fisher Scientific, catalog number: EN0521) (to preserve enzyme activity, it is recommended that DNase I be stored at -20 °C in single-use aliquots to minimize repeated freeze/thaw cycles)
6. Not I (NEW ENGLAND Biolabs, catalog number: R0189S) (store at -20 °C)
7. Monarch NEB RNA Purification kit (NEW ENGLAND Biolabs, catalog number: T2050S) (store at room temperature, 25 °C)
8. Phenol Red solution (Sigma-Aldrich, catalog number: P0290) (store at room temperature)
9. Methyl cellulose (HIMEDIA, catalog number: GRM2257) (store at room temperature)
10. MS222 (Sigma-Aldrich, catalog number: E10521) (store at room temperature)
11. 1 M Tris HCl (Sigma-Aldrich, catalog number: T2819) (store at room temperature)
12. Sorafenib (Sigma-Aldrich, catalog number: SRP0702) (store at -20 °C)
13. Acrylamide/Bis-acrylamide solution 40% (Himedia, catalog number: ML084) (store at 4 °C)
14. Ammonium persulfate (Himedia, catalog number: MB003) (store at 4 °C)
15. TEMED (N,N,N′,N′-Tetramethylethylenediamine) (Himedia, catalog number: MB003) (store at -4 °C)
16. DNA ladder 100 bp (Genei, catalog number: 2653070501730)
17. Tris-base (Himedia, catalog number: MB029)
18. 0.5 M EDTA pH 8.0 (Himedia, catalog number: ML014)
19. Boric acid (Himedia, catalog number: MB007)
20. NaOH (Himedia, catalog number: MB095)
21. NaCl (Himedia, catalog number: MB023)
22. KCl (Himedia, catalog number: MB043)
23. CaCl2·2H2O (Himedia, catalog number: MB034)
24. MgSO4·7H2O (Himedia, catalog number: MB171)
Solutions
1. E3 medium stock solution (see Recipes)
2. Tricaine stock solution (see Recipes)
3. Sorafenib stock (see Recipes)
4. Methyl cellulose (see Recipes)
5. APS stock (see Recipes)
6. TBE stock solution (10×) (see Recipes)
Recipes
1. E3 medium stock solution (60×)
| Components | Volume |
| NaCl | 17.2 g |
| KCl | 0.76 g |
| CaCl2·2H2O | 2.9 g |
| MgSO4·7H2O | 4.9 g |
| Double-distilled water | Up to 1 L |
Store at 4 °C.
2. Tricaine stock solution (40×)
| Components | Volume |
| MS222 | 400 mg |
| 1 M Tris HCl pH 9.0 | 2.1 mL |
| Double-distilled water | Up to 100 mL |
Store at -20 °C in 1 mL aliquots until use.
3. Sorafenib stock (10 mM)
| Components | Volume |
| Sorafenib powder | 4.65 mg |
| DMSO | 1 mL |
Store at -20 °C in 10 μL aliquots until use.
4. Methyl cellulose (3%)
| Components | Volume |
| Methyl cellulose | 3 g |
| 1× E3 medium | 100 mL |
Store at 4 °C.
5. APS stock (10%)
| Components | Volume |
| APS powder | 1 g |
| Distilled water | 10 mL |
Store at 4 °C.
6. TBE stock solution (10×)
| Components | Volume |
| Tris-base | 108 g |
| Boric acid | 55 g |
| 0.5 M EDTA pH 8.0 | 40 mL |
Make up the volume to 1 L with distilled water.
Laboratory supplies
1. Glass slides (Himedia, catalog number: BG004)
2. Pasteur pipettes (Himedia, catalog number: PW1212-1X50NO)
3. Petri dish (Sigma-Aldrich, catalog number: P5481)
4. 6-well plate (NEST, catalog number: 703001)
5. Microinjection needle (Shutter instruments, catalog number: BF100-78-10)
6. Micro loader tips (Eppendorf, catalog number: 5242956003)
Equipment
1. Fluorescent microscope (Olympus, model: BX53 upright fluorescent microscope) (GFP filter excitation ~470 nm, emission ~525 nm)
2. Microinjection unit (World Precision Instruments, catalog number: SYS-PV830)
3. PCR machine (TaKaRa PCR Thermal Cycler, catalog number: TP650)
4. Needle puller (Shutter Instruments, catalog number: P-1000)
5. Nanodrop (Thermo Fisher, catalog number: p2000)
6. BOD incubator (Thermo Scientific, catalog number: 51028132)
7. Mini-PROTEAN® Tetra Vertical Electrophoresis Cell (Bio-Rad, catalog number: 1658001)
8. PowerPacTM Basic Power Supply (Bio-Rad, catalog number: 1645050)
9. Gel DocTM XR+ Imaging System (Bio-Rad, catalog number: 1708195)
Software and datasets
1. ImageJ (https://imagej.net/ij/), CHOPCHOP version 3.0 (https://chopchop.cbu.uib.no)
Procedure
Generation of vhl mutant: The vhl mutant zebrafish line was generated using CRISPR/Cas9 mutagenesis. The detailed steps are shown in Sections A–H.
A. Embryo collection and maintenance
1. Cross adult zebrafish (Tg(fli1a:EGFP)) in a ratio of 1:2 male to female. Set up breeding tanks with divider inserts by placing male and female zebrafish in separate compartments the evening before embryo collection. Remove the divider the following morning to synchronize spawning and obtain fertilized embryos at the 1–2 cell stage for microinjection.
2. Transfer fertilized embryos to a Petri dish. Remove debris and unfertilized eggs and transfer the embryos to a Petri dish containing E3 medium.
3. Maintain embryos at 28.5 °C in a BOD incubator with fresh E3 medium until 4 days post-fertilization (4 dpf).
4. Transfer the collected embryos to fresh E3 medium every day.
B. Design and synthesis of guide RNA
1. Design the sgRNA target sequence for the vhl gene (Exon3) using the CHOPCHOP online tool; the details of the target used in this study are given in Figure 1.
Target site sequence with PAM: 5′-TCTGCAAGTTGTGAGACGGTTGG-3′; sgRNA template sequence: 5′-TAATACGACTCACTATAGGTCTGCAAGTTGTGAGACGGTGTTTTAGAGCTAGAAATAGCAAG-3′. Target site PCR primers: forward, 5′-TTTGCATGTTGTGTTTGTGTTT-3′; reverse, 5′-TTGATGTTTTCGTCTGTTTTGC-3′.
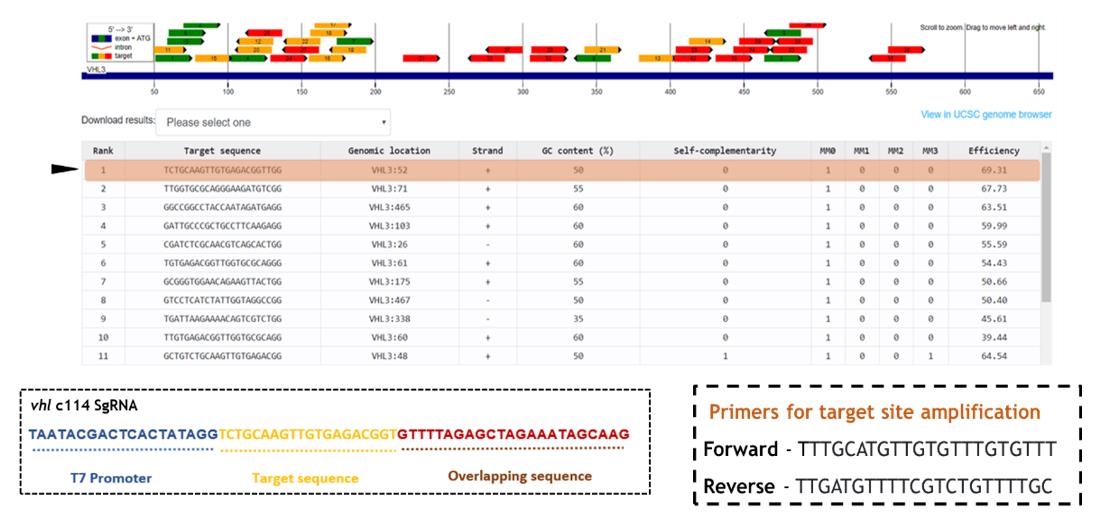
Figure 1. Details of the target site sequence and primers designed using CHOPCHOP. Adapted from [6].
2. Synthesize the target sequence and the constant oligonucleotides.
3. Anneal and amplify the synthesized oligonucleotides using PCR to synthesize the sgRNA template using the composition of the PCR reaction mixture and the PCR cycling conditions provided in Tables 1 and 2, respectively.
Table 1. Reaction mix for sgRNA template PCR
| Components | Volume |
| Target-specific oligo (100 μM) | 1 μL |
| Universal/constant oligo (100 μM) | 1 μL |
| Tag DNA polymerase master mix red | 5 μL |
| MilliQ water | 10 μL |
Table 2. Steps in PCR cycling for sgRNA template preparation
| Step | Temperature (°C) | Duration | No. of cycles |
| Initial denaturation | 95 | 1 min | 1 |
| Denaturation | 95 | 10 s | 30 |
| Annealing | 45 | 30 s | |
| Extension | 72 | 30 s | |
| Final extension | 72 | 10 min | 1 |
| Hold | 4 | ∞ | - |
4. Synthesize the sgRNA from a PCR-generated template by in vitro transcription using the HiScribe® T7 High Yield RNA Synthesis kit.
Note: For efficient T7 in vitro transcription, the +1 position of the T7 promoter should be a G nucleotide. This should be considered during sgRNA target site selection.
5. Prepare the reaction mix as described in Table 3 and incubate at 37 °C for 2 h. Following in vitro transcription, perform the DNase treatment to remove the DNA template from the reaction mixture.
Table 3. Reaction mix for in vitro synthesis of sgRNA of the target sequence
| Components | Volume |
| sgRNA template | 1 μg |
| Ribonucleotide triphosphates (rATP, rGTP, rCTP, rUTP) (10 mM) | 1.5 μL each |
| T7 RNA polymerase | 2 μL |
| Reaction buffer | 1.5 μL |
| MilliQ water | Adjust the volume to 20 μL |
6. Prepare the reaction mixture as described in Table 4 and incubate at 37 °C for 15 min to ensure the complete digestion of the DNA template. The complete DNA template removal is essential to prevent DNA contamination of the sgRNA product, which would affect downstream zebrafish development.
Table 4. Reaction mix for the DNase treatment
| Components | Volume |
| Sample from in vitro synthesis | 20 μL |
| 10× buffer | 17.5 μL |
| DNase I enzyme (1 U/μL) | 5 μL |
| MilliQ water | 132.5 μL |
C. Purification of sgRNA
1. After the DNase treatment, purify the sgRNA using the Monarch NEB RNA Purification kit according to the manufacturer’s instructions as follows:
a. Mix the DNase-treated reaction mixture (175 μL) with Monarch binding buffer (350 μL), followed by the addition of double the volume of ethanol (525 μL).
b. Transfer the mixture to the purification column.
c. Centrifuge the column at 16,000× g for 1 min at room temperature and discard the flowthrough.
d. Wash the column with 500 μL of wash buffer by centrifugation at 16,000× g for 1 min.
e. For elution, add 30 μL of MilliQ water to the column and incubate at room temperature for 1 min.
f. Transfer the column to a fresh 1.5 mL microcentrifuge tube and collect sgRNA by centrifuging the tubes at 16,000× g for 1 min.
2. Measure the sgRNA purity and concentration using a Nanodrop spectrophotometer (A260/A280 > 1.8 and concentration ≥ 500 ng/μL). Aliquot the sgRNA and preserve at -80 °C for future use.
D. Synthesis of Cas9 mRNA
1. Obtain the pCS2-nCas9n from Addgene (Addgene ID#47929) [10].
2. Linearize the plasmid by restriction digestion using NotI enzyme. Prepare the reaction mixture as described in Table 5.
Table 5. Reaction mix for the pCS2-nCas9n linearization
| Components | Volume |
| pCS2-nCas9n plasmid | 4 μg |
| Not I enzyme | 3 μL |
| NEBufferTM r3.1 | 5 μL |
| MilliQ water | Adjust the volume to 50 μL |
3. Incubate the reaction mix at 37 °C for 2.5 h to ensure complete linearization of the plasmid.
Note: Complete linearization is essential for efficient in vitro transcription of Cas9 mRNA. Confirm complete plasmid linearization by agarose gel electrophoresis (linearized plasmid size: 8,269 bp) before proceeding with in vitro transcription.
4. Synthesize the Cas9 mRNA using the InvitrogenTM mMESSAGE mMACHINETM SP6 Transcription kit. Capped mRNA synthesis is required because uncapped Cas9 mRNA will not produce functional protein in zebrafish embryos. The reaction mixture for mRNA synthesis is provided in Table 6.
Table 6. Reaction mix for nCas9n mRNA synthesis
| Components | Volume |
| Linearized pCS2-nCas9n plasmid | 1 μg |
| 2× NTP cap mix | 10 μL |
| 10× reaction buffer | 2 μL |
| 10× SP6 enzyme mix | 2 μL |
| MilliQ water | Adjust the volume to 20 μL |
5. Incubate the reaction mix at 37 °C for 4 h to facilitate in vitro transcription.
6. Following transcription, which produces capped mRNA, essential for Cas9 mRNA translation in zebrafish embryos, subject the synthesized mRNA to DNase treatment and subsequently purify, following the same procedure described for sgRNA synthesis.
E. Microinjection
1. Mix the sgRNA and Cas9 mRNA to a final concentration of 30 ng/μL for sgRNA and 100 ng/μL for Cas9 mRNA.
Note: Microinjection at the one-cell stage is essential for uniform mutagenesis throughout the F0 animal.
2. In addition to the RNA mix, add 0.5 μL of Phenol Red per 5 μL sample as a vital tracking dye during microinjection.
3. Inject approximately 2–3 nL into single-cell-staged zebrafish embryos.
4. Transfer the injected F0 embryos to 1× E3 medium and incubate in a BOD incubator at 28.5 °C.
Note: The CRISPR-Cas9 microinjection procedure was performed as previously described in CRISPR-Cas9-induced gene knockout in zebrafish [11,12].
F. Establishment of the vhl mutant line
1. Raise the F0 embryos to adults and outcross with wild-type zebrafish to generate F1 heterozygous mutants. Since the homozygous vhl-/- mutants survive only up to 12 dpf, maintain the vhl line in a heterozygous state in adult zebrafish.
G. Phenotypic characterization of homozygous vhl-/- mutants
The zebrafish larvae obtained from vhl+/- in-cross contains a mixed population of homozygous wild type (vhl+/+), heterozygous mutants (vhl+/-), and homozygous mutants (vhl-/-). At 4.5 dpf, homozygous vhl-/- mutant larvae were identified based on the following phenotypic characteristics:
1. Absence of swim bladder inflation: Homozygous vhl-/- larvae can be identified by the absence of swim bladder inflation (Figure 2B), because they fail to inflate the swim bladder under activated hypoxia signaling conditions [6,7]. In contrast, wild-type mutant larvae show normal swim bladder inflation (Figure 2A).
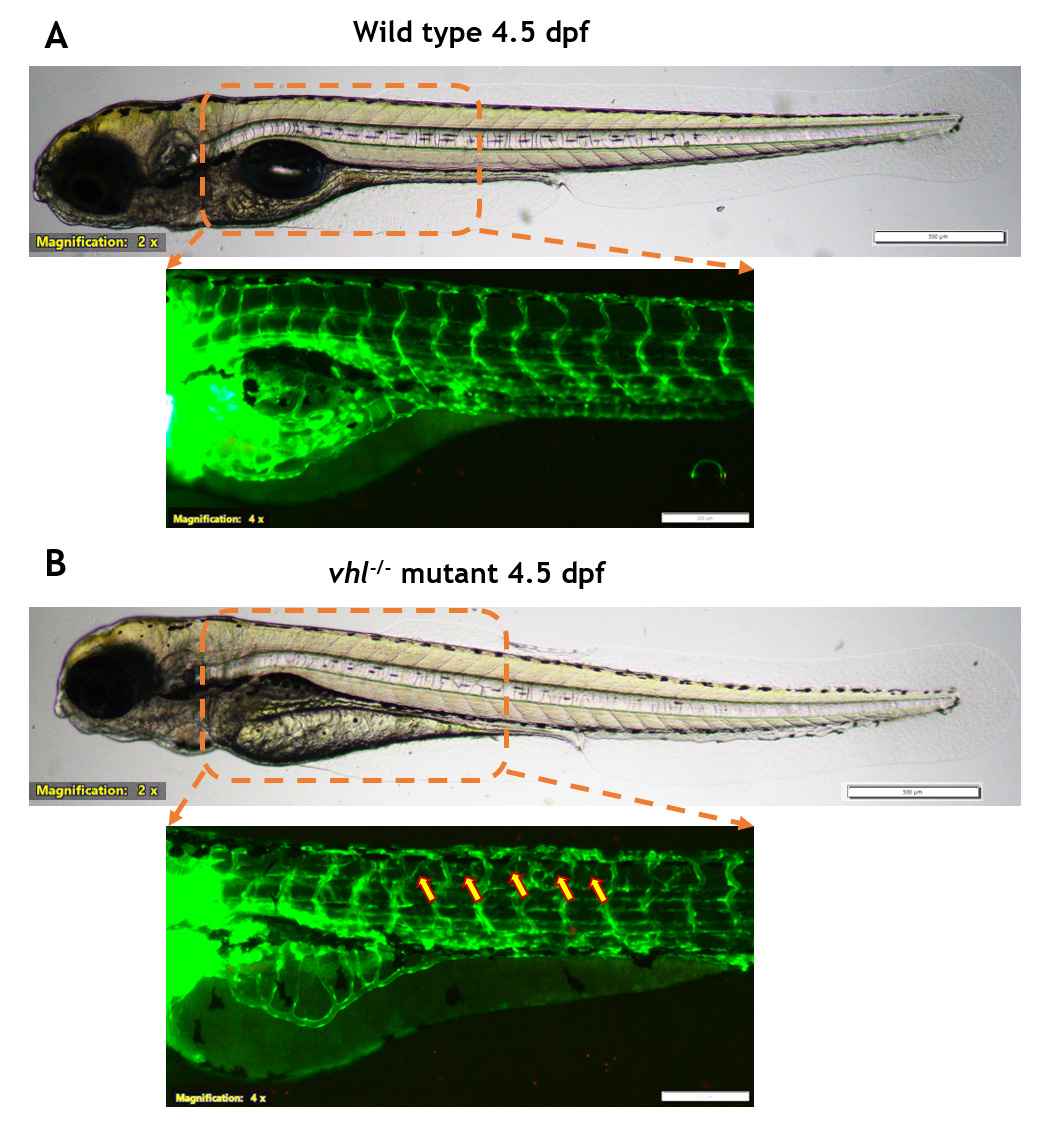
Figure 2. Comparison of swim bladder inflation and blood vessels between wild-type and vhl mutant zebrafish larvae. (A) Wild-type larvae show normal swim bladder inflation with normal vasculatures at 4.5 dpf. (B) Homozygous vhl-/- larvae display an absence of swim bladder inflation with ectopic neovasculatures (indicated by arrow marks). Brightfield images (top) were acquired at 2× magnification (scale bars: 500 μm); fluorescent blood vessel images (bottom) were acquired at 4× magnification (scale bars: 200 μm). Adapted from [6].
2. Presence of ectopic neovascularization: The homozygous vhl-/- mutants exhibit excessive proangiogenic phenotypes with ectopic neovascularization throughout the body (Figure 2B). This abnormal neovasculature serves as a clear indication of the vhl loss-of-function phenotype [6,7].
3. Based on these observations, the absence of swim bladder inflation and the presence of ectopic neovasculatures separate the vhl-/- homozygous mutant zebrafish larvae from heterozygous and wild-type siblings for further experimentation.
H. Genotyping by heteroduplex mobility assay (HMA)
1. Collect 2-dpf zebrafish larvae individually in a 0.2 mL PCR tube.
2. Add 40 μL of 50 mM NaOH to each larva.
3. Incubate in a PCR thermal cycler at 95 °C for 20 min.
4. Immediately transfer tubes to 4 °C.
5. Add 6 μL of 1 M Tris HCl to neutralize the lysate.
6. Mix thoroughly by pipetting.
7. Store genomic DNA samples at -20 °C until PCR analysis.
8. Prepare a PCR reaction to amplify the target site as provided in Table 7.
Table 7. PCR reaction mix for target site amplification
| Components | Volume |
| Genomic DNA template | 2 μL |
| Forward primer (5 μM) | 0.1 μL |
| Reverse primer (5 μM) | 0.1 μL |
| Amplicon 2× RED PCR Master Mix | 10 μL |
| MilliQ water | To 20 μL |
9. Use the following PCR cycling conditions to amplify the target site: 95 °C for 5 min; 40 cycles of 95 °C for 20 s, 60 °C for 20 s, and 72 °C for 20 s; final extension at 72 °C for 5 min; hold at 4 °C.
10. Run PCR products in a 15% acrylamide gel and visualize using a gel documentation system.
11. Differentiate the wild type, heterozygous, and homozygous mutants as shown in Figure 3.
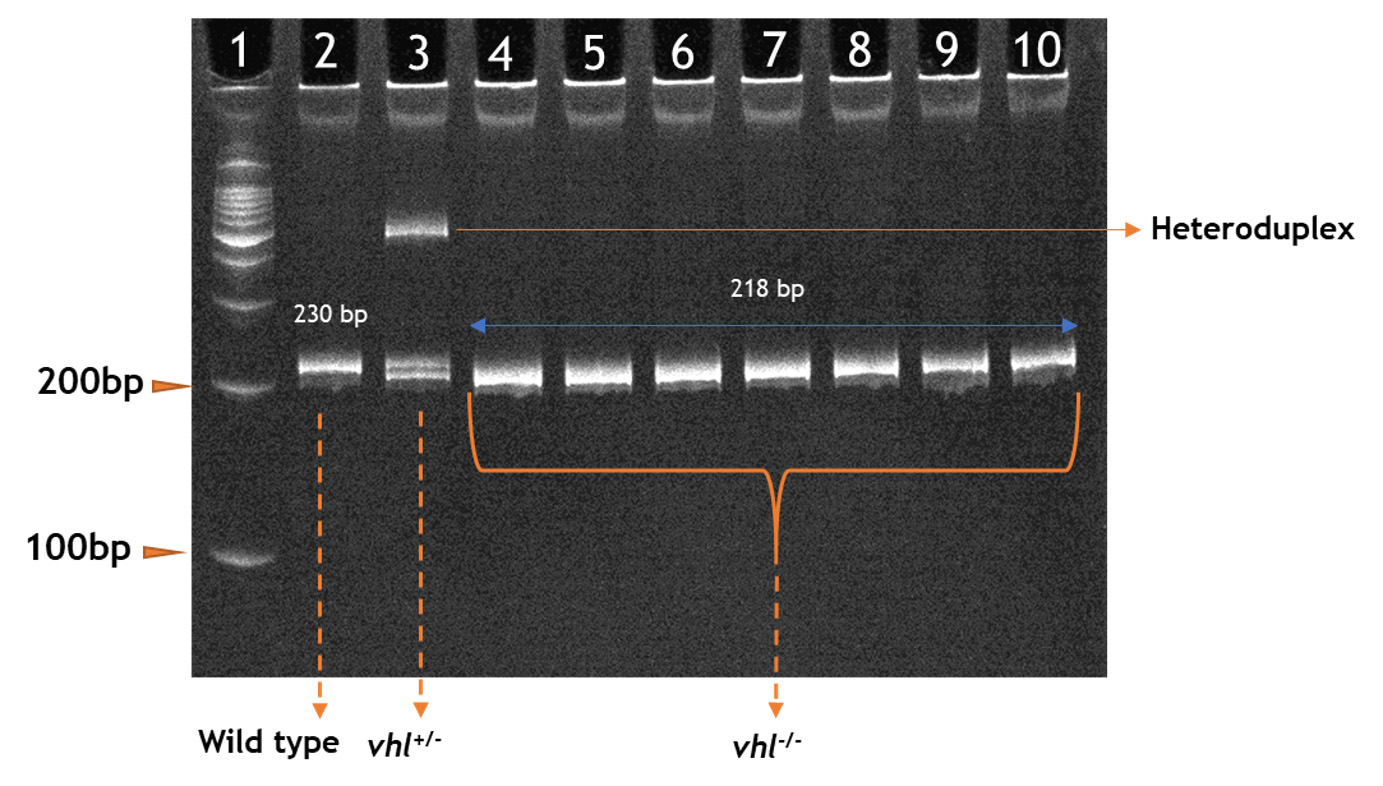
Figure 3. Differentiation of wild type (vhl+/+), heterozygous (vhl+/-), and homozygous (vhl-/-) mutants using 15% acrylamide gel by heteroduplex mobility assay. Adapted from [6].
Validation of protocol
Validation of the developed model in the angiogenesis assay: Experimental groups
The following four experimental groups were used for the antiangiogenic drug testing procedure:
a. Wild-type larvae + 0.1% DMSO
b. Wild-type larvae + 0.2 μM sorafenib
c. Vhl-/- mutant larvae + 0.1% DMSO
d. Vhl-/- mutant larvae + 0.2 μM sorafenib
Each experimental group was maintained in biological triplicates, with three independent wells in a 6-well plate.
Drug treatment procedure
1. Screen the GFP-positive embryos (Fli1a are GFP positive from 10 to 12 hpf) at 2 dpf.
2. At 4.5 dpf, transfer 25 larvae from the wild type or vhl mutant groups into each well of a 6-well plate containing 10 mL of E3 medium.
Note: Based on our personalized experimentation and standard frameworks outlined in relevant OECD guidelines, the larval density can indeed be adjusted. Specifically, the number of larvae can be increased or decreased depending on the specific objectives of the assay and the test vessel volume. 25 larvae/10 mL served as our standardized baseline; flexibility exists to scale the density according to specific experimental designs.
3. Add the sorafenib to the treatment groups at a final concentration of 0.2 μM (0.2 μL from 10 mM stock) [13] and mix gently to ensure uniform distribution of the drug.
4. The control groups receive 0.1% DMSO as the vehicle control.
5. Maintain the larvae in a BOD incubator at 28.5 ± 0.5 °C during the treatment period.
6. Perform the treatment from the 4.5 to the 6.5 dpf stage of zebrafish larvae.
7. Every 24 h, refresh the larvae (completely remove the existing medium) with fresh E3 medium containing the respective concentration of sorafenib or DMSO to maintain consistent treatment conditions.
8. At the end of the treatment period, examine the larvae under the fluorescent microscope for changes in the reduction of neovasculatures, specifically in the ISV region.
Microscopic imaging
1. At 6.5 dpf, image the zebrafish larvae using a fluorescence microscope to observe changes in angiogenesis.
2. Prior to imaging, transfer the zebrafish larvae to a Petri dish containing embryo medium supplemented with Tricaine solution (168 mg/L) (4 μL of Tricaine from 40× stock in 96 μL of E3 medium). Keep the larvae in the anesthetic solution for approximately 1–2 min until complete immobilization.
3. After anesthesia, place the individual larvae on a clean glass slide within a small drop of 3% methyl cellulose solution and carefully orient laterally using fine forceps or a needle to ensure proper visualization of the region of interest without damaging the larvae.
4. Place the mounted larvae on the microscope stage and image under 4× magnification using a fluorescence microscope.
5. Acquire the images using fluorescence microscope; we used Olympus BX53 upright fluorescence microscope using the cellSens software with identical exposure and acquisition settings for all experimental groups.
Note: Imaging should ideally be performed using a grayscale monochrome camera recorded at a 12-bit depth.
6. Capture the images and save in TIFF (.tif) format for further analysis in ImageJ.
Data analysis
Measurement of vascular fluorescence intensity and statistical analysis
1. Import the acquired fluorescence images into the Fiji/ImageJ software (Figure 4A).
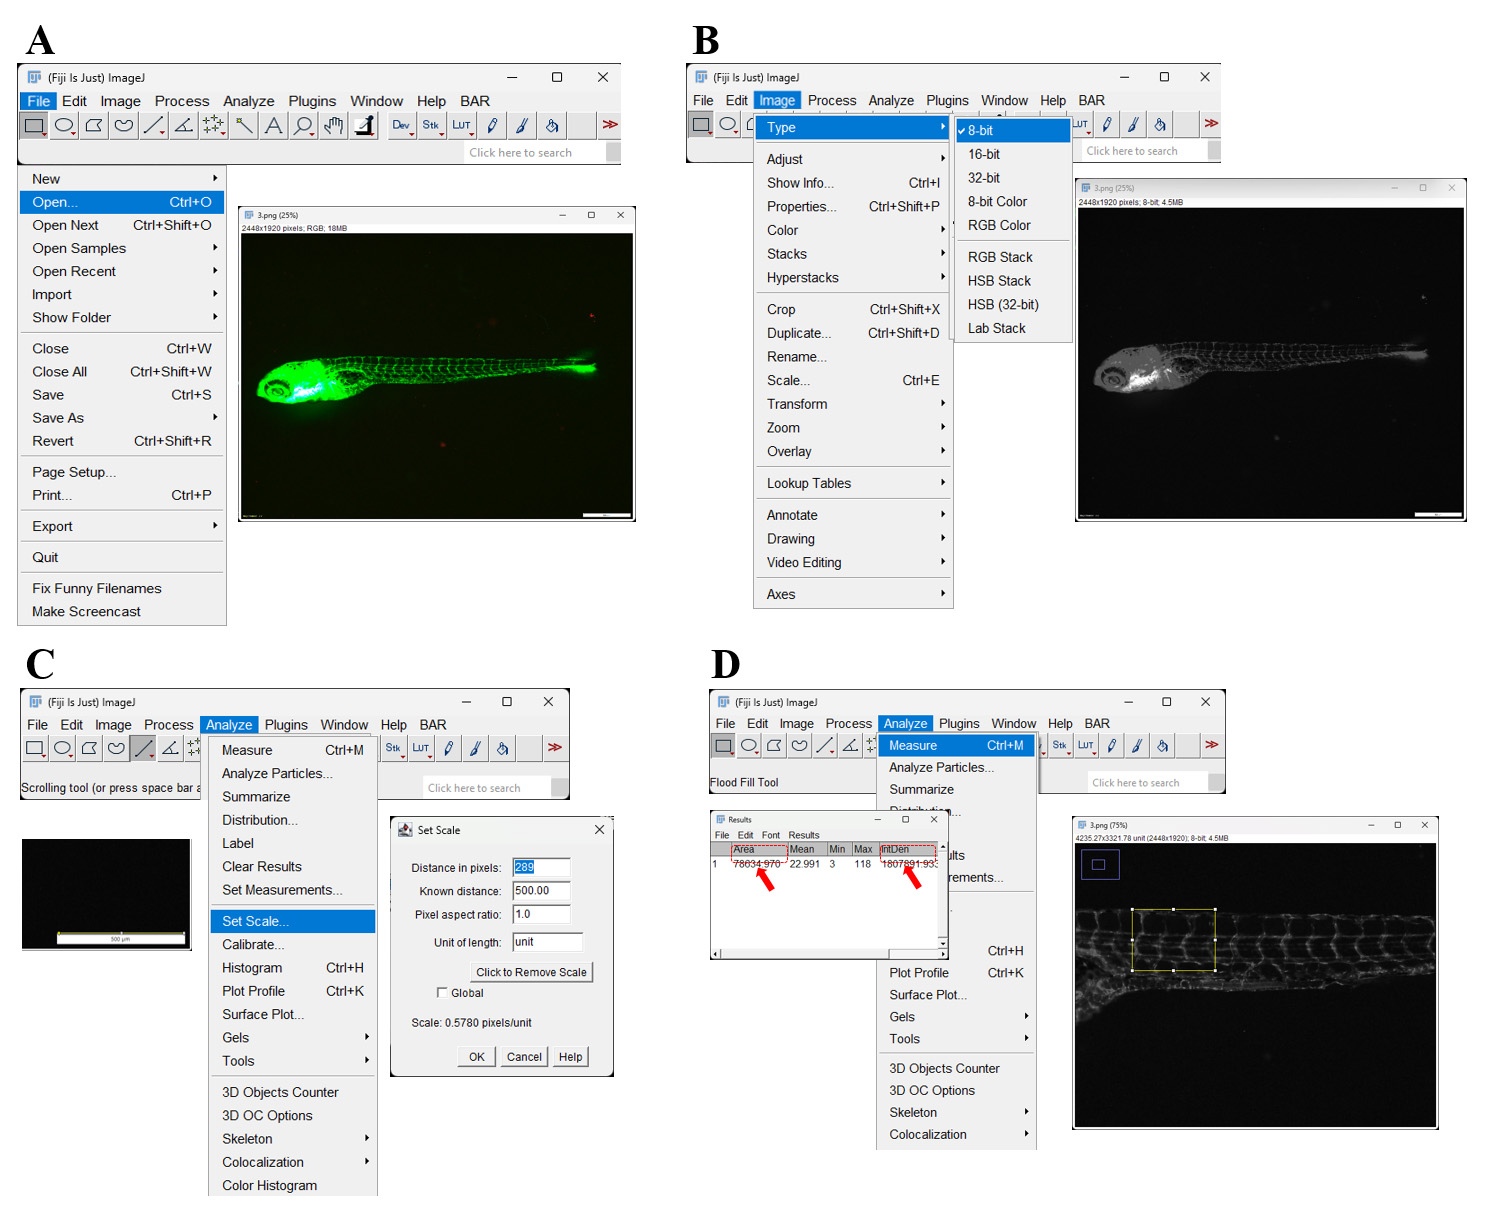
Figure 4. Workflow for quantification of vascular fluorescent intensity using ImageJ. (A) Fluorescence images were imported into the ImageJ software. (B) Images were converted from color to 8-bit grayscale format. (C) The spatial scale was calibrated using a known-distance scale bar. (D) Vascular fluorescent intensity was quantified by measuring the integrated density within the selected region of interest (ROI) (ISVs 8–11).
2. Convert the image to a grayscale 8-bit image (Figure 4B).
3. Set the measurement scale using the scale bar in each image, as shown in Figure 4C.
4. Select a defined region of interest (ROI), as indicated in Figure 4D (ISVs number 8–11), for measuring the mean gray value.
5. Quantify the angiogenesis area within the ISVs region based on fluorescence-positive pixels. Obtain the quantified value from ImageJ as integrated density (IntDen) within the selected area (μm2) (Figure 4D).
6. Select the ROI, quantify the fluorescence intensity, and represent as mean gray value (IntDen/Area) (refer to the red arrow area in Figure 4D).
7. For each experimental group, select 10 larvae randomly and quantify independently using ImageJ (Figure 4).
8. Document the quantified values for further analysis.
9. Perform the statistical analysis using one-way ANOVA to compare vascular fluorescence intensity between the experimental groups (Figure 5).
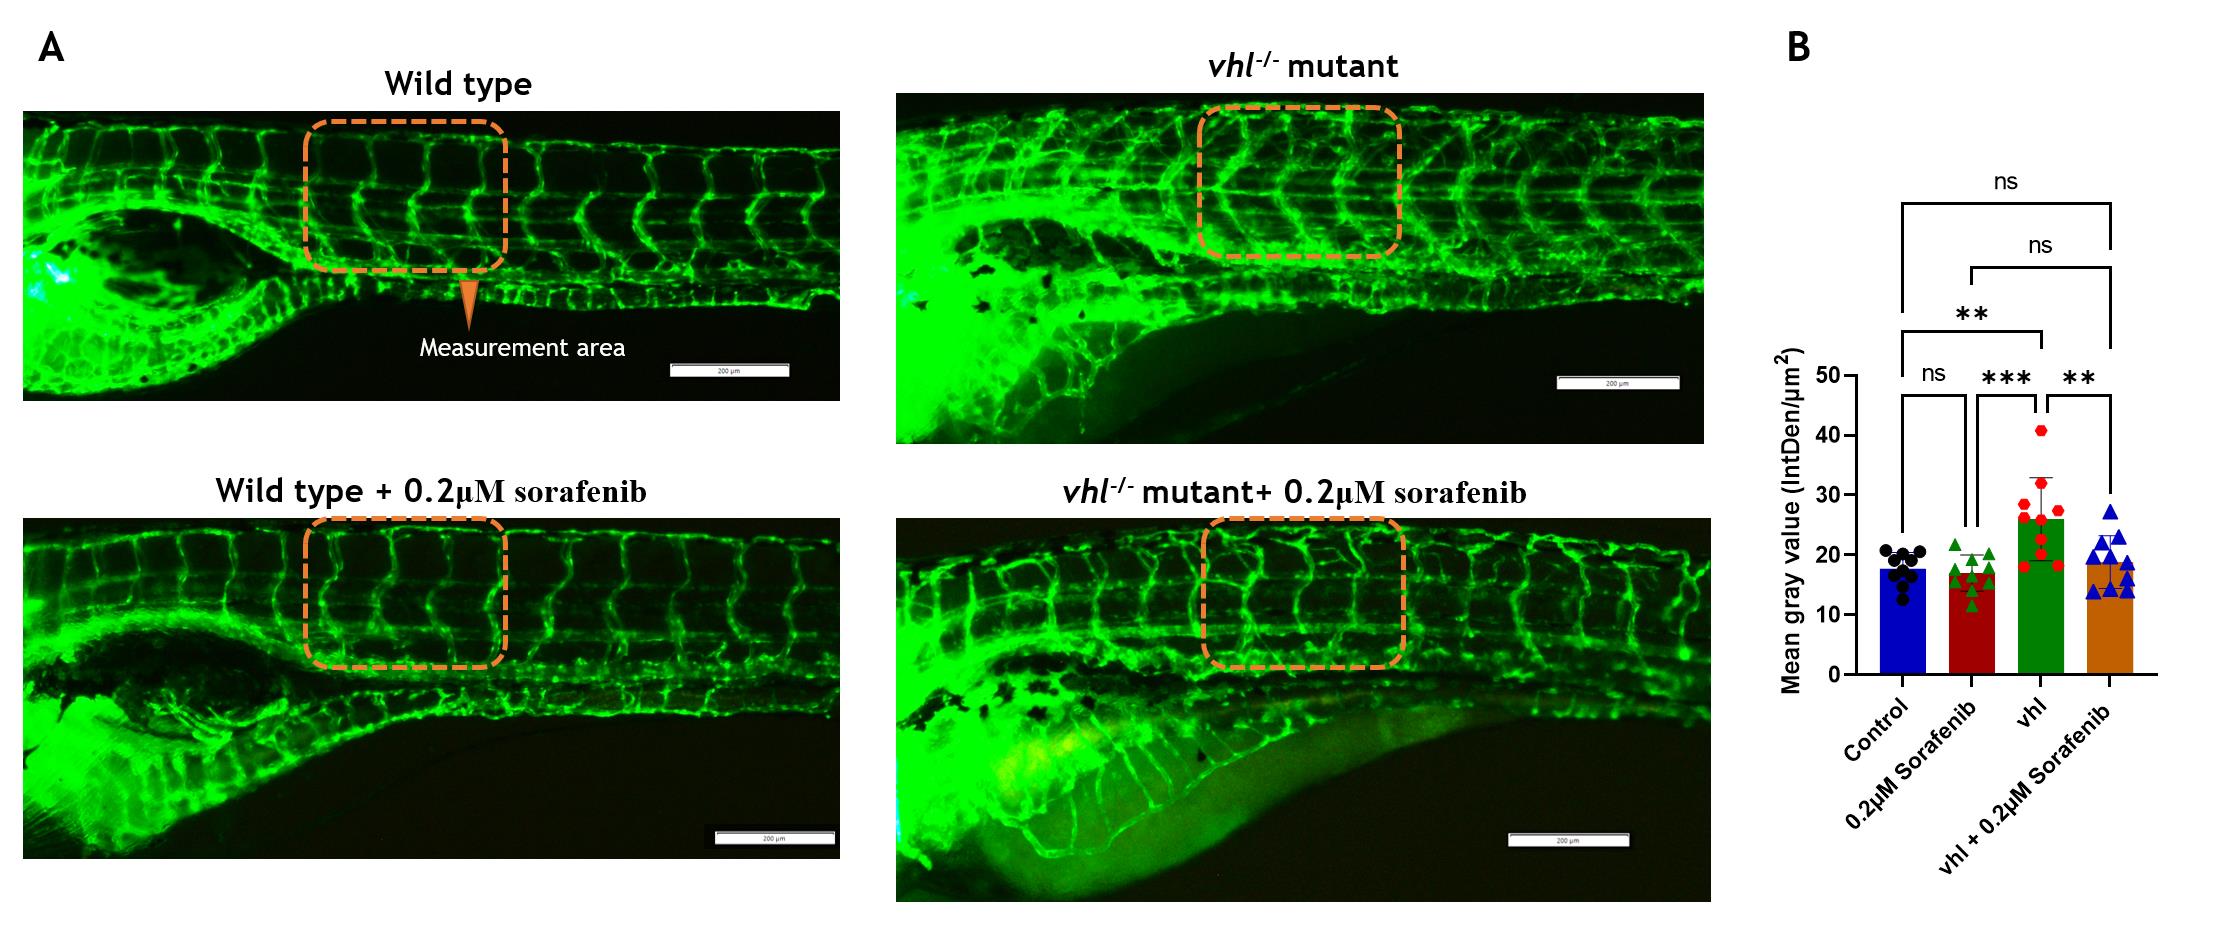
Figure 5. Effect of sorafenib in the proangiogenic zebrafish model. (A) Images showing the effect of sorafenib in the intersegmental vessel (ISV) region of wild-type and vhl-/- mutant zebrafish larvae Tg(fli1a:EGFP) at 6.5 dpf. (B) Fluorescence intensity (mean gray values) of blood vessels at the ISV region in control, control + sorafenib, vhl mutant, and vhl mutant + sorafenib groups (n = 10). One-way ANOVA, Tukey’s post hoc test. Bars: mean ± S.D.; **P ≤ 0.01, ***P ≤ 0.001; ns, non-significant; integrated density (IntDen). Adapted from [6].
10. Represent the analyzed data as mean ± standard deviation (SD) and determine statistical significance based on the obtained P values.
General notes and troubleshooting
General notes
This protocol describes the generation and application of a CRISPR/Cas9-mediated zebrafish vhl loss-of-function model for studying hypoxia-driven pathological angiogenesis and evaluating antiangiogenic responses. Disruption of the vhl gene leads to stabilization of hypoxia-inducible factors (HIFs), resulting in enhanced ectopic vascular development in zebrafish larvae. The model provides a simple, transparent, and reproducible platform for visualization and assessment of proangiogenic phenotypes in vivo. The timing and concentration of sorafenib treatment used in this assay should be determined based on prior dose–response optimization experiments. The selected treatment condition should provide a measurable reduction in ectopic vascular growth while maintaining larval viability and normal development. The CRISPR sgRNA used in this study was designed using CHOPCHOP. Other CRISPR sgRNA design tools, including CRISPOR, Benchling CRISPR Design Tool, and CRISPRscan, are also available and may be selected according to experimental requirements. Also, gene knockout does not need to rely on in vitro–synthesized SgRNA and Cas9 mRNA. There are commercially available Cas9 proteins and synthetic sgRNA approaches that can be used as alternative strategies to reduce the time and effort associated with in vitro transcription; however, these approaches were not evaluated in the present study. Also, note that vhl+/- embryos exhibit a phenotype similar to wild-type embryos and do not display the proangiogenic phenotype observed in homozygous vhl loss-of-function embryos. Heterozygosity can only be identified by genotyping. Also, for the antiangiogenic drug testing, 25 larvae per treatment group were used in triplicate. From each replicate, three larvae were randomly selected for vascular imaging and quantification (total n = 10 larvae per group), while the remaining larvae were fixed and used for gene expression analysis [6].
Troubleshooting
Problem 1: Low sgRNA/Cas9 mRNA efficiency in gene targeting.
Possible causes: Poor quality or degradation of sgRNA and Cas9 mRNA due to temperature fluctuations, repeated freeze/thaw cycles, or contamination, resulting in reduced gene-editing efficiency.
Solution: Verify the integrity and quality of sgRNA and Cas9 mRNA by agarose gel analysis to ensure the RNA is not degraded. Maintain proper storage conditions and avoid contamination during handling. Gene disruption efficiency should be confirmed by genotyping methods such as the heteroduplex mobility assay (HMA).
Problem 2: Difficulty differentiating vhl mutant larvae from wild-type siblings with swim bladder inflation phenotype.
Possible causes: Variable onset of swim bladder inflation among larvae or delayed development caused by environmental conditions.
Solution: The vhl mutant larvae failed to inflate the swim bladder, whereas the wild-type siblings showed swim bladder inflation by 4.5 dpf. When the phenotype is ambiguous, swim bladder inflation should be assessed together with the ectopic neovasculatures phenotype of vhl mutants; this is highly recommended. Further confirmation can be done by genotyping using the HMA assay.
Problem 3: Weak EGFP fluorescence signal.
Possible causes: Low transgene expression, improper imaging settings, photo bleaching, or delayed/variable reporter expression among larvae.
Solution: Optimize imaging parameters such as exposure time and gain settings. Ensure proper handling to minimize photo bleaching and image larvae at the appropriate developmental stage.
Problem 4: Difficulty in maintaining larval orientation during imaging.
Possible causes: Improper anesthetization or prolonged imaging time (more than 30 min), resulting in larval movement and loss of positioning.
Solution: Properly anesthetize larvae before imaging and maintain consistent orientation using 3% methylcellulose. Complete imaging within 30 min after giving anesthesia.
Problem 5: High background fluorescence.
Possible causes: Auto fluorescence from larvae, excessive exposure settings, nonspecific fluorescence, or accumulation of fluorescent debris.
Solution: Optimize microscope settings, reduce unnecessary exposure, and use fresh mounting solution.
Acknowledgments
The facilities provided by SRM Institute of Science and Technology are gratefully acknowledged. The authors would like to thank Dr. Chinmoy Patra, Scientist E, Agarkar Research Institute, Pune, and Dr. M.S. Ananthakrishna Tantry, Postdoctoral Researcher, Nagoya University, Japan, for their support in carrying out this work. The authors thankfully acknowledge the financial assistance received from the Department of Biotechnology, Ministry of Science and Technology, India (BT/PR26189/GET/119/226/2017) and the Science and Engineering Research Board, Department of Science and Technology, India (EMR/2017/000465). The graphical overview was created in BioRender. Appu, G. (2026) https://BioRender.com/xskxeb1. ChatGPT was used solely to improve readability and verify the grammatical content. We hereby declare that the content of this paper was written by the authors.
Author contributions
Protocol Development, Vinoth S.; Protocol Optimization or Validation, Vinoth S.; Writing—Original Draft, Vinoth S.; Writing—Review & Editing, Vinoth S. and Kirankumar Santhakumar; Funding acquisition, Kirankumar Santhakumar; Supervision, Kirankumar Santhakumar.
Competing interests
The authors declare no competing or financial interests.
Ethical considerations
Ethical approval was obtained from the Institutional Animal Ethics Committee (IAEC) of SRM Institute of Science and Technology, approval number 16099/835re-S-04/IAEC 2016.
References
- Lugano, R., Ramachandran, M. and Dimberg, A. (2019). Tumor angiogenesis: causes, consequences, challenges and opportunities. Cell Mol Life Sci. 77(9): 1745–1770. https://doi.org/10.1007/s00018-019-03351-7
- Vinoth, S., Balasubramanian, S., Perumal, E. and Santhakumar, K. (2024). Angiogenesis Assay for Live and Fixed Zebrafish Embryos/Larvae. In Teratogenicity Testing: Methods and Protocol. New York, NY: Springer. pp. 377–384. https://doi.org/10.1007/978-1-0716-3625-1_21
- Santoro, M. M. (2014). Antiangiogenic Cancer Drug Using the Zebrafish Model. Arterioscler, Thromb, Vasc Biol. 34(9): 1846–1853. https://doi.org/10.1161/atvbaha.114.303221
- Lawson, N. D. and Weinstein, B. M. (2002). In Vivo Imaging of Embryonic Vascular Development Using Transgenic Zebrafish. Dev Biol. 248(2): 307–318. https://doi.org/10.1006/dbio.2002.0711
- Vinoth, S., Selvaraj, V., Venkatasubramanian, H. and Santhakumar, K. (2022). A Simple Blood Vessel Imaging Protocol for Live Zebrafish Larva. Zebrafish. 19(5): 177–180. https://doi.org/10.1089/zeb.2022.0023
- Vinoth, S. and Santhakumar, K. (2025). A pro-angiogenic and hypoxic zebrafish model as a novel platform for anti-angiogenic drug testing. Biol Open. 14(8): e061863. https://doi.org/10.1242/bio.061863
- van Rooijen, E., Voest, E. E., Logister, I., Korving, J., Schwerte, T., Schulte-Merker, S., Giles, R. H. and van Eeden, F. J. (2009). Zebrafish mutants in the von Hippel-Lindau tumor suppressor display a hypoxic response and recapitulate key aspects of Chuvash polycythemia. Blood. 113(25): 6449–6460. https://doi.org/10.1182/blood-2008-07-167890
- Gossage, L., Eisen, T. and Maher, E. R. (2014). VHL, the story of a tumour suppressor gene. Nat Rev Cancer. 15(1): 55–64. https://doi.org/10.1038/nrc3844
- van Rooijen, E., Voest, E. E., Logister, I., Bussmann, J., Korving, J., van Eeden, F. J., Giles, R. H. and Schulte-Merker, S. (2010). von Hippel-Lindau tumor suppressor mutants faithfully model pathological hypoxia-driven angiogenesis and vascular retinopathies in zebrafish. Dis Model Mech. 3: 343–353. https://doi.org/10.1242/dmm.004036
- Jao, L. E., Wente, S. R. and Chen, W. (2013). Efficient multiplex biallelic zebrafish genome editing using a CRISPR nuclease system. Proc Natl Acad Sci USA. 110(34): 13904–13909. https://doi.org/10.1073/pnas.1308335110
- Rosen, J. N., Sweeney, M. F. and Mably, J. D. (2009). Microinjection of Zebrafish Embryos to Analyze Gene Function. J Visualized Exp.: e3791/1115. https://doi.org/10.3791/1115
- Medishetti, R., Balamurugan, K., Yadavalli, K., Rani, R., Sevilimedu, A., Challa, A. K., Parsa, K. and Chatti, K. (2022). CRISPR-Cas9-induced gene knockout in zebrafish. STAR Protoc. 3(4): 101779. https://doi.org/10.1016/j.xpro.2022.101779
- Chimote, G., Sreenivasan, J., Pawar, N., Subramanian, J., Sharma, S. and Sivaramakrishnan, H. (2014). Comparison of effects of anti-angiogenic agents in the zebrafish efficacy-toxicity model for translational anti-angiogenic drug discovery. Drug Des Devel Ther. 8: 1107–1123. https://doi.org/10.2147/dddt.s55621
Article Information
Publication history
Received: May 31, 2026
Accepted: Sep 10, 2026
Available online: Sep 23, 2026
Published: Oct 20, 2026
Copyright
© 2026 The Author(s); This is an open access article under the CC BY-NC license (https://creativecommons.org/licenses/by-nc/4.0/).
How to cite
Vinoth, S. and Santhakumar, K. (2026). Antiangiogenic Drug Testing Using Proangiogenic and Hypoxia Zebrafish Model. Bio-protocol 16(20): e5846. DOI: 10.21769/BioProtoc.5846.

 Download Citation in RIS Format
Category
Cancer Biology > Angiogenesis > Cancer therapy
Update
Do you have any questions about this protocol?
Post your question to gather feedback from the community. We will also invite the authors of this article to respond.
 Post a Question


