


- Protocols

- Articles and Issues
- For Authors
- About
- Become a Reviewer


Identifying Differentially Expressed Proteins via Plasma Exosomal Proteomics

Published: Vol 16, Iss 19, Oct 5, 2026 DOI: 10.21769/BioProtoc.5840 Views: 16
Reviewed by: Hemant Kumar PrajapatiAnonymous reviewer(s)
 PDF
PDF  Ask a question
Original research article
The authors used this protocol in:
Jan 2026
Advertisement


Protocol Collections
Comprehensive collections of detailed, peer-reviewed protocols focusing on specific topics




Abstract
Extracellular vesicle (EV) proteomics can be used to study intercellular communication and find biomarkers of non-invasive diseases. Traditional separation methods (ultracentrifugation, size exclusion chromatography) and data-dependent acquisition (DDA) mass spectrometry usually have the drawbacks of copurification of pollutants, poor reproducibility, and insufficient sampling of low-abundance peptides. This protocol describes a workflow for label-free extracellular vesicle proteomics, which combines size exclusion chromatography for vesicle separation, data-independent acquisition (DIA) for deep discovery, and parallel reaction monitoring (PRM) for targeted verification. Plasma-derived extracellular vesicles are treated by standardized lysis, digestion, and LC-MS/MS procedures, so that the protein group of extracellular vesicles can be identified and quantified robustly. The main advantages of this scheme are that it can achieve high quantitative reproducibility, unbiased detection of low-intensity peptides, and seamless transition from discovery to targeted verification, while also being suitable for liquid biopsy samples and various cardiovascular diseases.
Key features
• Combines size exclusion chromatography (SEC)-based EV isolation with label-free data-independent acquisition (DIA) for deep, unbiased discovery-phase extracellular vesicle proteomics.
• Employs parallel reaction monitoring (PRM) for orthogonal, highly sensitive targeted validation of candidate biomarkers discovered by DIA.
• PRM records the entire, high-resolution fragment ion spectrum for the targeted peptide.
• Developed for atrial fibrillation; adaptable to other cardiovascular diseases, therapy monitoring, and liquid biopsies.
Keywords: Extracellular vesicles Proteomics
Biomarkers
Parallel reaction monitoring
Mass spectrometry
Proteomics
Biomarkers
Parallel reaction monitoring
Mass spectrometry
Graphical overview
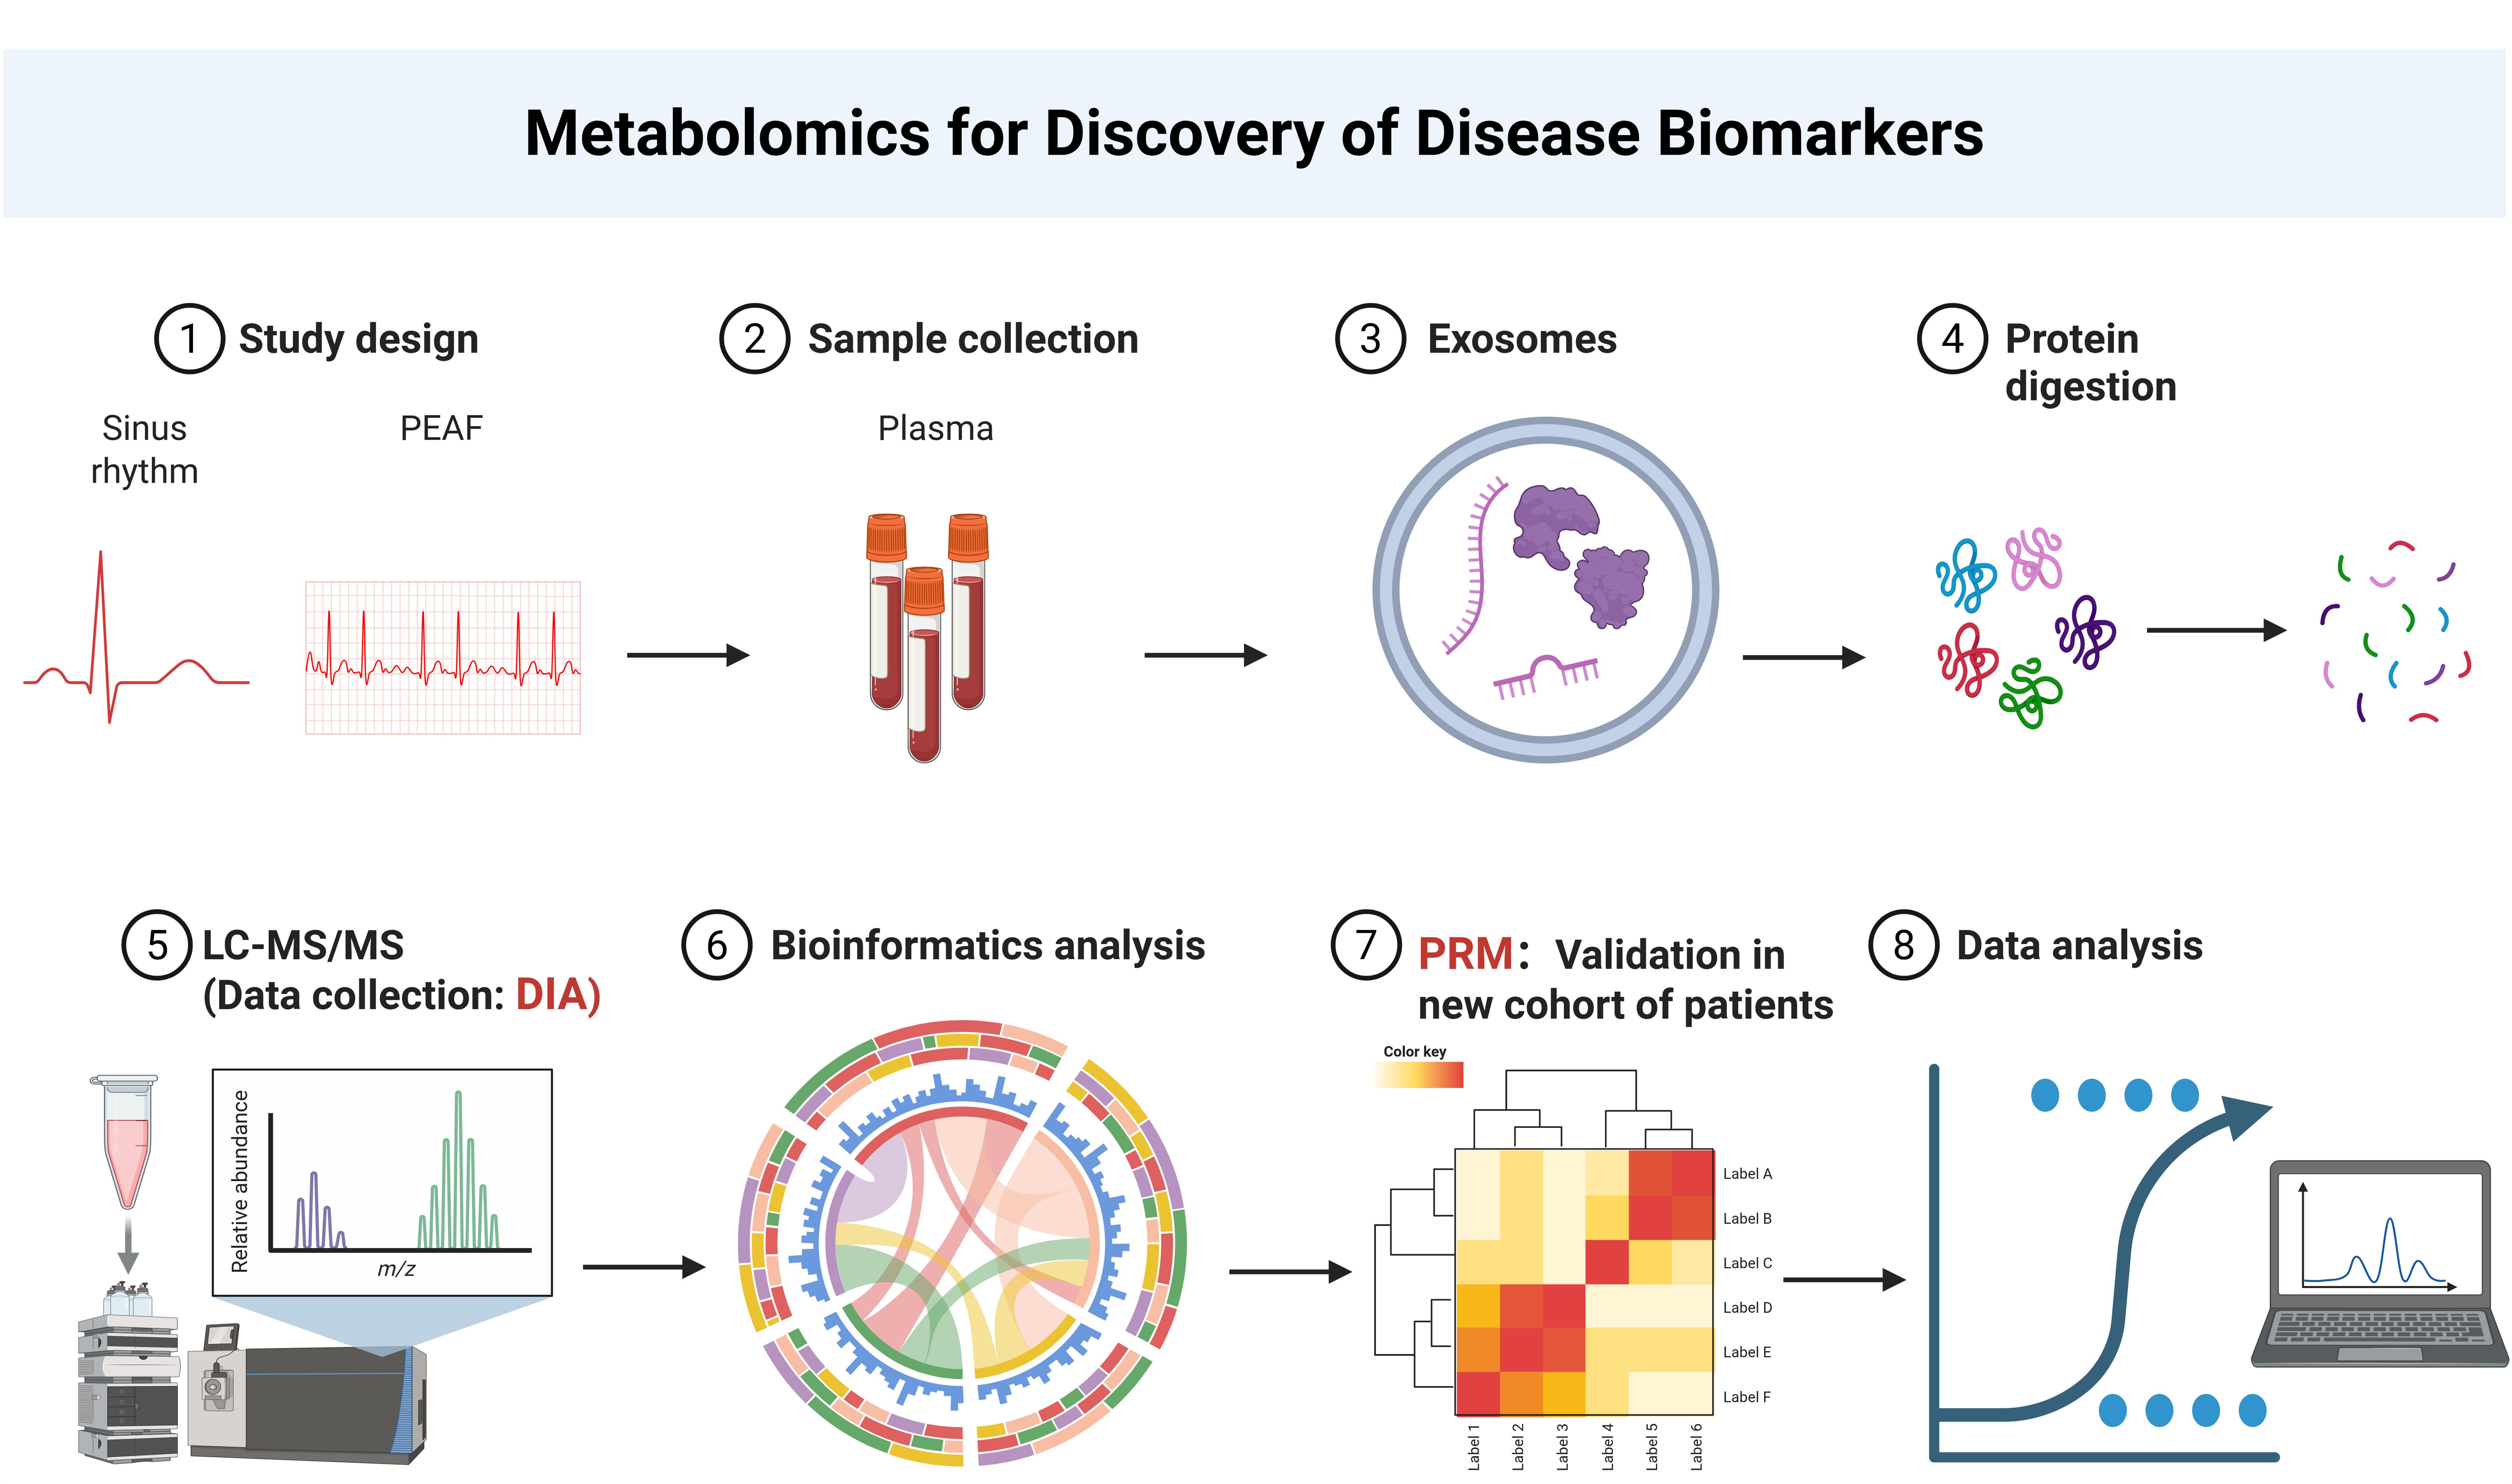
Background
Extracellular vesicle (EV) proteomics has become a powerful discipline for deciphering intercellular communication networks, identifying biomarkers of non-invasive diseases, and advancing precision medicine [1]. The protein cargo of nanoscale EVs (50–150 nm), derived from the endosome pathway, directly reflects the pathophysiological state of parent cells, making EV proteins an attractive target for liquid biopsy development. [1]. At the sample preparation stage, traditional EV separation methods, such as ultracentrifugation, size exclusion chromatography (SEC), and ultrafiltration, are often affected by the copurification of non-EV contaminants (e.g., abundant plasma proteins, lipoproteins, and protein aggregates), low recovery rates, and low batch-to-batch reproducibility [1,2].
Even after separation, low-abundance EVs are often obscured by the extreme dynamic range of biological fluids, especially in plasma, where high-abundance proteins such as albumin and immunoglobulin dominate the samples, masking disease-related low-abundance proteins [3,4]. In addition, the lack of a standardized end-to-end workflow—from vesicle separation to protein digestion, mass spectrometry collection, and data analysis—leads to poor repeatability and difficulties in cross-study verification [5,6]. At the detection level, the large number of proteins detected in proteomics measurements covers up the inherent heterogeneity among individual EVs, potentially resulting in the loss of rare but functionally important subgroups [7].
In order to address these challenges, proteomics based on mass spectrometry has been widely used to characterize the protein composition of EVs. Data-dependent acquisition (DDA) is the most commonly used mass spectrometry acquisition mode, and precursor ions are selected according to the cracking intensity [8]. Although DDA is suitable for protein identification and spectral library generation, it has some drawbacks, such as insufficient sampling of low-intensity precursors and poor cross-batch quantitative reproducibility [8,9].
In order to overcome these limitations, data-independent acquisition (DIA) has become a promising alternative. DIA systematically fragments all precursor ions within a predefined isolation window in a predefined m/z range, thus enabling unbiased and comprehensive analysis of the precursor ions and providing high quantitative reproducibility for large-scale cohort studies [10]. Unlike DDA, which selects precursor ions based on intensity, DIA enhances the identification and quantification of low-intensity peptides and significantly improves protein-group coverage [10]. For example, by combining SEC with DIA-MS, 2,896 EV-related proteins can be identified and quantified from as little as 200 μL of plasma, representing 3.5 times greater coverage than that reported in previously published studies on melanoma [11]. Although DIA provides in-depth coverage for protein omics in the discovery stage, targeted verification of candidate biomarkers requires an orthogonal strategy with higher quantitative accuracy [12].
Parallel reaction monitoring (PRM) is a targeted MS method implemented on high-resolution instruments, such as Orbitrap, which offers excellent sensitivity and quantitative accuracy [13,14]. Unlike multiple reaction monitoring (MRM), which is based on triple-quadrupole instruments, PRM scans all product ions from the target peptide (FDR:1%) to produce a complete MS/MS spectrum, minimizing ion interference and improving specificity [15]. However, PRM has its inherent limitations: because of the wider MS/MS scanning range and longer cycle time, peptide coverage is affected. In addition, high-resolution mass spectrometers require higher instrument costs and more complex operation and maintenance [16]. The throughput of PRM is also limited to 100–300 targets at a time, which makes it not suitable for target discovery [17,18]. Beyond its application in atrial fibrillation (AF) biomarker discovery, this label-free PRM EV proteomics protocol can be extended to multiple other translational contexts. In the development of liquid biopsy, this pipeline is well-suited to analyzing circulating foreign bodies from minimally invasive samples (such as plasma, urine, or saliva) to identify disease-specific protein signatures [19].
The protocol can also characterize EVs from specific cardiac cell types by targeting cell type–specific surface markers, thereby helping to dissect the contribution of cell specificity to disease pathogenesis.
In treatment monitoring, the same workflow can quantify extracellular proteins longitudinally to track the emergence of treatment response or drug resistance, especially in the context of antiarrhythmic drug therapy or catheter ablation for AF. In addition, for other cardiovascular diseases characterized by progressive structural remodeling, such as heart failure with preserved ejection fraction, hypertrophic cardiomyopathy, and cardiac amyloidosis, this approach provides a minimally invasive method that can monitor disease progression and evaluate treatment effects through a series of extracellular protein profiles. Finally, this standardized label-free PRM EV proteomics scheme provides a multifunctional platform for translational cardiovascular research and has great potential for accelerating the discovery and clinical implementation of EV-based biomarkers for AF and other diseases.
Materials and reagents
Biological materials
1. Human plasma (collected from healthy donors and AF donors at TEDA International Cardiovascular Hospital under ethics approval ([2021]-0325-2))
Reagents
1. Trypsin (Promega, catalog number: V5117)
2. DL-dithiothreitol (Sigma-Aldrich, catalog number: D9163-25G)
3. Iodoacetamide (Sigma-Aldrich, catalog number: V900335-5G)
4. Trifluoroacetic acid (Sigma-Aldrich, catalog number: 302031-1L)
5. Urea (Sigma-Aldrich, catalog number: V900119-500G)
6. Acetonitrile (ThermoFisher Scientific, catalog number: 204433)
7. Methanol (ThermoFisher Scientific, catalog number: A452-4)
8. TEAB (Sigma-Aldrich, catalog number: 140023)
9. Protease Inhibitor Cocktail III (Merck Millipore, catalog number: 539134-10ML)
10. Formic acid (ThermoFisher Scientific, catalog number: A117-50)
11. PBS (Gibco, catalog number: 6124451)
12. PFA (Sigma, catalog number: P6148)
13. Glutaraldehyde (Ted Pella, catalog number: 16051)
14. Uranyl oxalate (Endoscope instrument, catalog number: GZ02625)
Solutions
1. K2EDTA anticoagulant (K2EDTA) (see Recipes)
Recipes
1. K2EDTA
| Reagent | Final concentration | Quantity or volume (example for a 3-mL tube) |
|---|---|---|
| K2EDTA (dipotassium salt) | 1.5–2.2 mg per mL of whole blood (most commonly ~1.5–1.8 mg/mL) | 4.5–6.6 mg (adjust according to tube draw volume) |
| Total | n/a | Dry film; no liquid volume |
Laboratory supplies
1. Solid phase extraction column (SPE strata-X 10 mg/1 mL) (desalination column) (Phenomenex, catalog number: 8B-S100-AAK)
2. Extracellular vesicle extraction column (IZON, catalog number: qEVoriginal Columns/SP1)
3. PAGE Silver Staining kit (Solarbio, catalog number: G7210)
4. 0.22-μM microporous filter membrane (Merk Millipore Ltd., catalog number: 0000212310)
5. Ultrafiltration centrifuge tube 0.5 mL/10 KD (Millipore, catalog number: UFC501024)
6. K2EDTA-coated vacuum blood collection tubes (BD, catalog number: 367856)
7. PierceTM C18 tips, 100 μL bed (96 tips) (Thermo Scientific, catalog number: 87784)
8. BCA Protein Assay kit (Beyotime, catalog number: P0011)
9. Exosomoe Purification Filter (EPF column) (Umibio, catalog number: UR52136)
10. Formvar (SS13.1) carbon-loaded copper mesh (Pelco, catalog number: 01753-F)
Equipment
1. Low-temperature centrifuge (Eppendorf, model: centrifuge 5427R)
2. Vacuum concentrator (Eppendorf, model: Concentrator plus)
3. Constant temperature water bath (Shanghai Boxun Medical Biological Instrument Co., Ltd., catalog number/model: DK-8D)
4. Constant temperature blast drying oven (Shanghai Yiheng Scientific Instrument Co., Ltd., catalog number/model: DHG-9240A)
5. Micro quantitative analyzer (IMPLEN, model: NP80Touch)
6. Automated solid phase extraction instrument (TECAN, model: Resolvex A100)
7. Room-temperature centrifuge (SCILOGEX, catalog number/model: SCI-24)
8. Scanner (Epson, model: V600)
9. Electrophoresis apparatus (Bio-Rad, model: 1645050)
10. TimsTOF Pro 2 mass spectrometry (Bruker, model: Tims TOF PRO 2)
11. NanoElute UHPLC system (Bruker, model: NanoElute)
12. Electron microscope (Jeol, model: JEM-1230)
Software and datasets
1. MaxQuant (https://www.maxquant.org/maxquant/) (Max Planck Institute of Biochemistry, Martinsried, Germany, v.1.6.15.0)
2. GraphPad Prism 8.0.2
Procedure
A. Sample collection
1. After overnight fasting, collect blood samples from all subjects. Collect 2 mL of blood from each subject.
2. Collect samples in EDTA-containing vacutainer tubes and centrifuge at 1,307× g for 10 min at 4 °C (EDTA-containing vacutainer tubes contain K2EDTA anticoagulant).
3. Separate the plasma and blood cells, place the plasma in a standard plasma collection tube, and store it at -80 °C until carrying out the experiments (Figure 1).
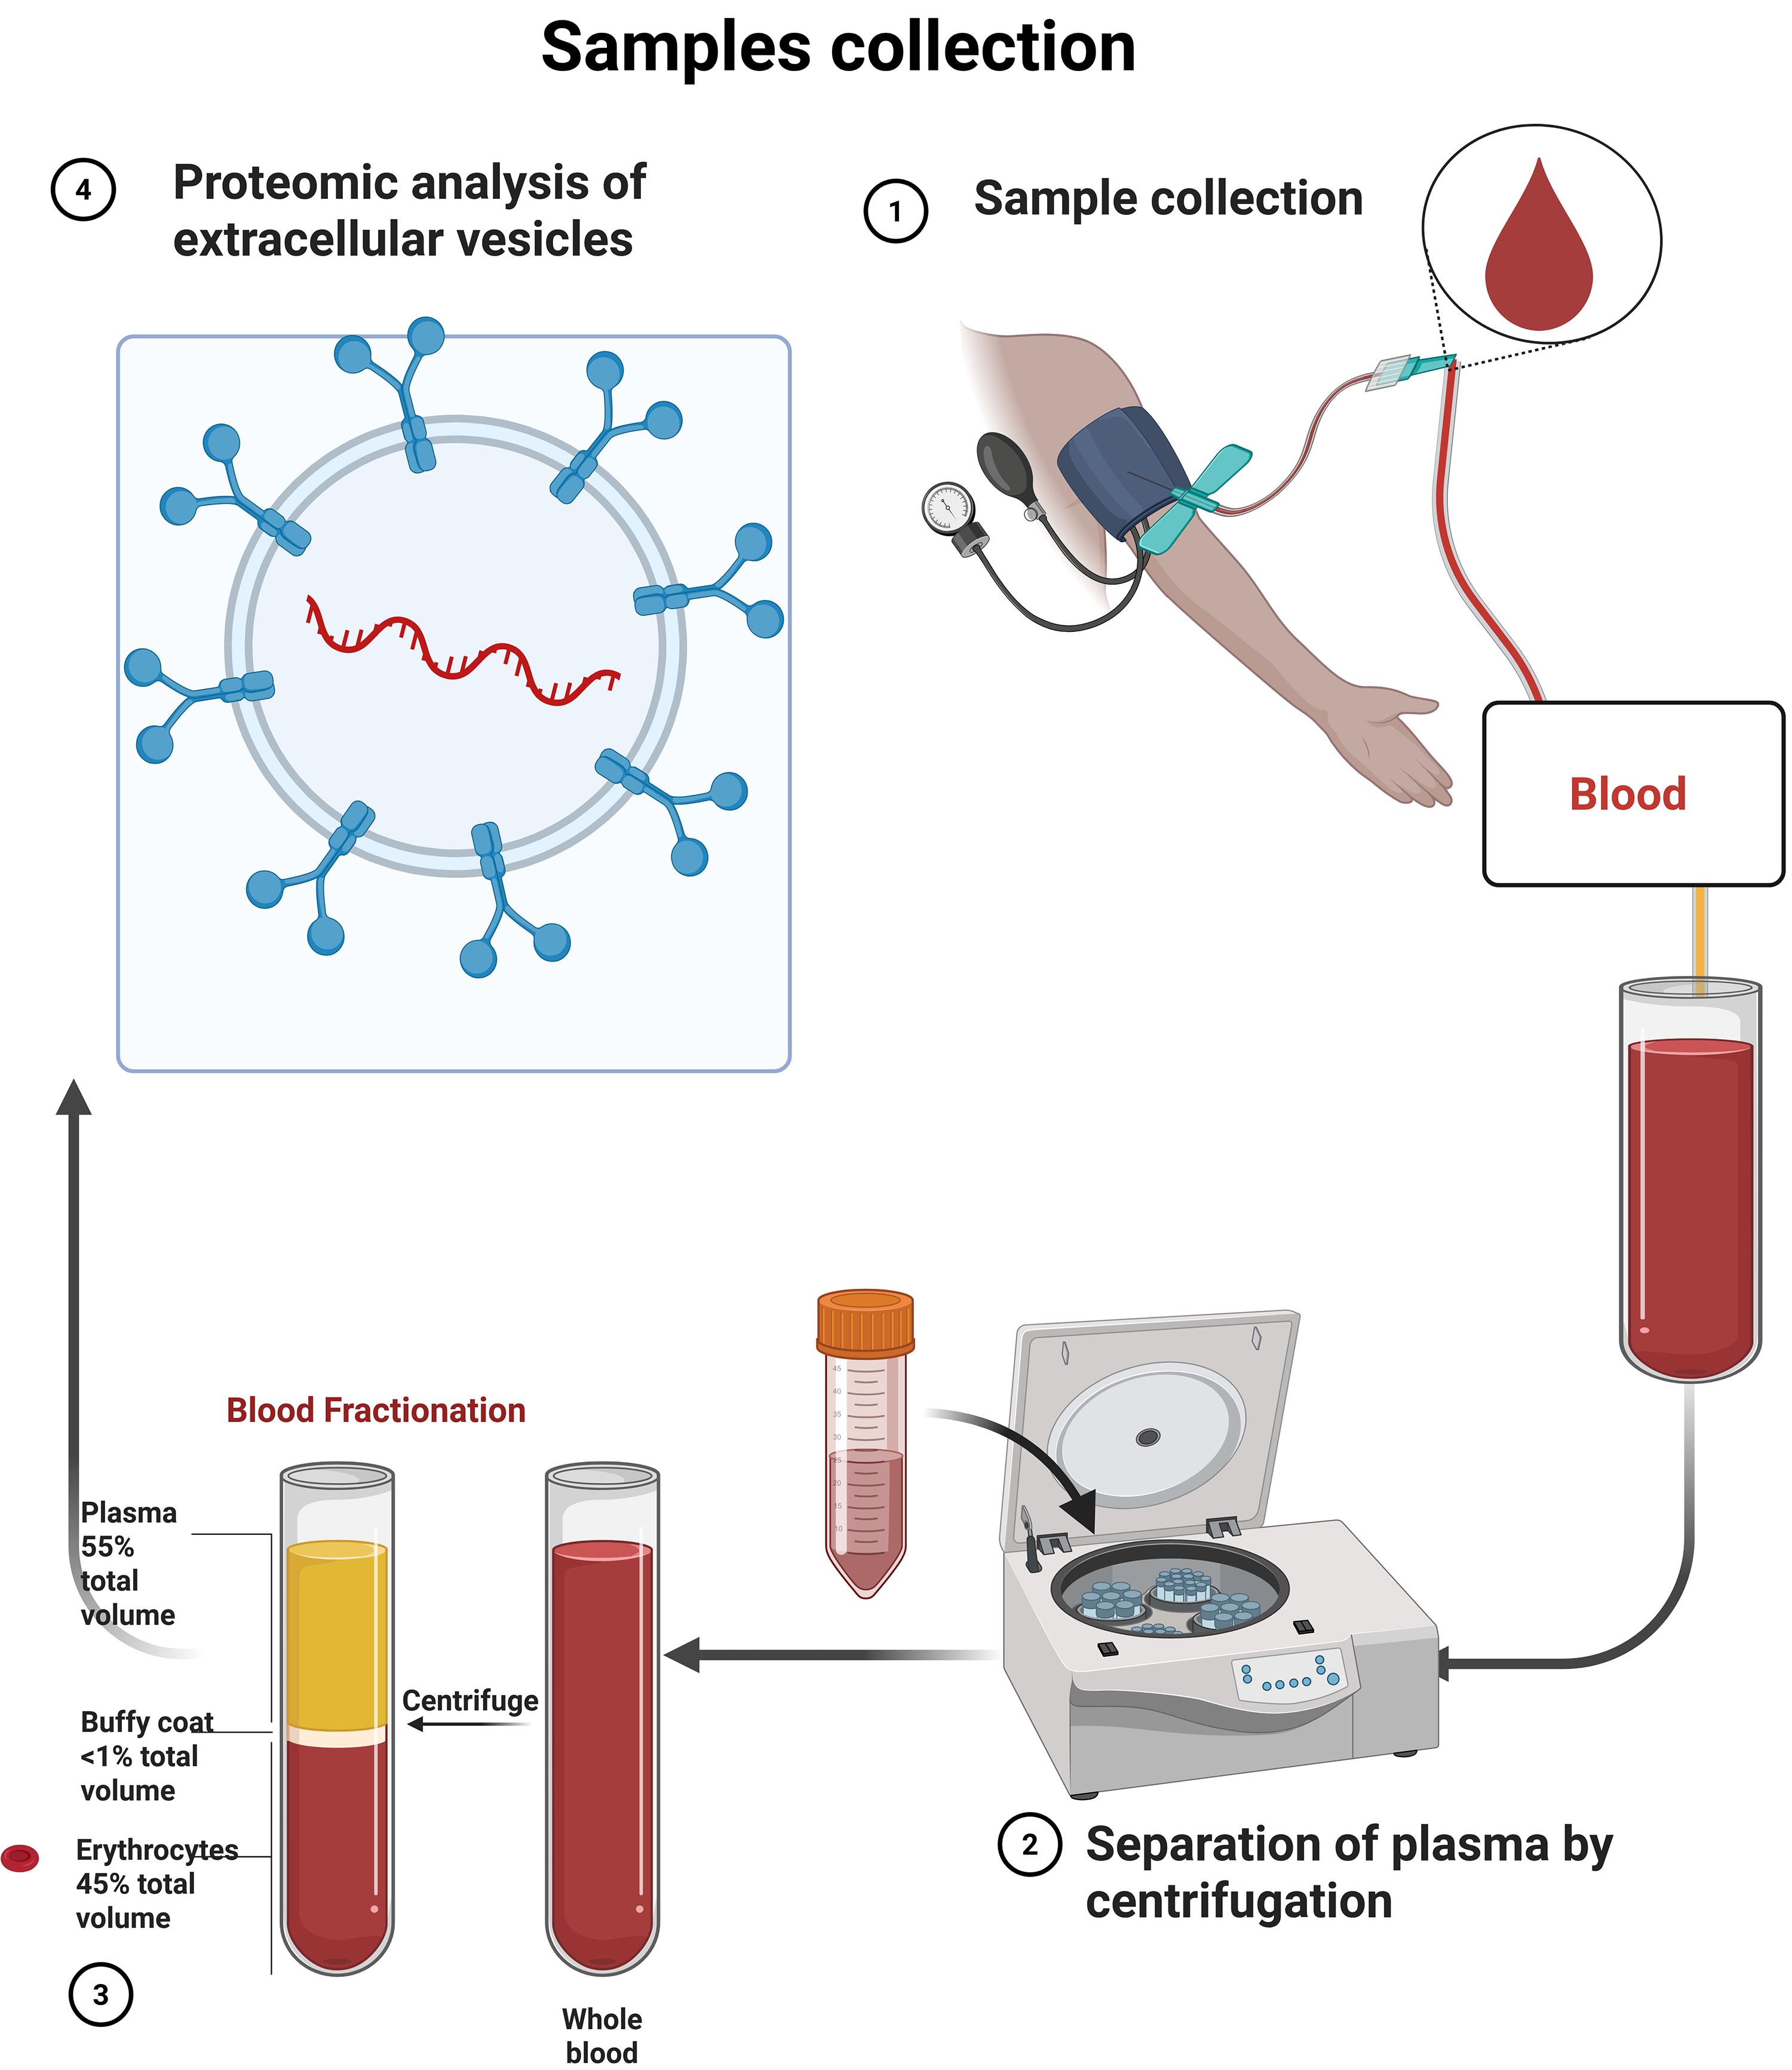
Figure 1. Sample collection process. Collect whole blood samples from patients, centrifuge the samples, and separate plasma samples for subsequent extracellular vesicle (EV) proteomic analysis.
B. EV isolation
1. Use plasma samples for EV isolation with EVs isolation kits (Izon qEV Concentration Kit columns). Use 1 mL of plasma volume for EV isolation.
2. Column equilibrium flushing: Thoroughly rinse and equilibrate the column with elution buffer to ensure the stability of the column bed structure.
3. Sample loading: Slowly add 1 mL of the sample for separation and allow it to naturally permeate into the column bed.
4. Elution and discard: Discard the first 6 mL of void volume solution that flows out and then add PBS buffer to continue elution. Target component collection: Collect 3 mL of effluent immediately following the discarded liquid as EVs and freeze-dry it.
5. Purification of EVs: Transfer the crude EV particles from the previous step to the upper chamber of an Exosomoe Purification Filter (EPF column) and centrifuge at 3,000× g for 10 min at 4 °C. After centrifugation, collect the liquid at the bottom of the EPF column, which is the purified EV particles.
6. Preservation of EVs: Pack purified EVs in 50–100 μL and store at -80 °C in a low-temperature refrigerator for subsequent experiments.
7. Nanoparticle tracking analysis (NTA) detection experimental method: Measure the EVs’ particle size and concentration using nanoparticle tracking analysis (NTA) at Umibio (Shanghai) Co. Ltd., with NanoSight NS300 (Malvern Panalytical, Britain) and corresponding software NTA 3.4 Build 3.4.4. Dilute isolated EV samples using 1× PBS buffer to measure the particle size and concentration. Maintain temperature between 20 and 30 °C.
8. Experimental method for transmission electron microscopy detection: Fix EVs onto a copper mesh with samples:
a. Resuspend EVs in 50–100 μL of 2% PFA. For frozen EVs, thaw and mix them with an equal amount of 4% PFA.
b. Add 2.5 μL of EV suspension to the Formvar carbon-loaded copper mesh. Alternatively, drop 5–10 μL of EV suspension onto the sealing film, with the copper mesh Formvar film facing downward onto the suspension. Prepare 2–3 copper nets for each EV sample.
c. Add 100 μL of PBS to the sealing film. Clamp the copper mesh (Formvar membrane facing downward) onto PBS droplets with tweezers to clean it.
d. Place the copper mesh in 50 μL of 1% glutaraldehyde droplets for 5 min.
e. Place the copper mesh in 100 μL of ddH2O for 2 min (wash 8 times).
9. Negative staining treatment of EVs and electron microscopy detection (TEM):
a. Place the copper mesh in 50 μL of uranyl oxalate droplets at pH 7.0 for 5 min.
b. Place the copper mesh in the stainless-steel ring at the top of the sample stage and absorb excess liquid using filter paper.
c. Air dry the copper mesh for 5–10 min.
d. Place the copper mesh in a box and photograph under an electron microscope at 80 kV.
10. Use CD63, CD81, and TSG101 to identify EVs during isolation of the EVs. Use TEM and NTA to validate the EV isolation and purification for quality control (Figure 2A, B). The reference standards for extracellular vesicle quality assessment are shown in Table 1.
Table 1. Reference standards for quality assessment of extracellular vesicles
| Quality parameter | Reference standard | |
| Nanoflow quality assessment | Particle concentration | 107–1013 particles/mL |
| Particle size | 30–200 nm | |
| Particle size quality assessment | Particle concentration | 107–1012 particles/mL |
| Particle size | 30–200 nm | |
| Electron microscopy quality assessment | Appearance | Complete in shape, spherical in shape, and uniform in size |
| Magnification | Default amplification of 200 nm, but can amplify 1 μm, 500 nm, 200 nm, and 100 nm | |
| Quality assessment of protein concentration | Protein concentration | >200 ng/μL |
| Protein quality assessment | Positive indicator results | CD63, TSG101 with bands |
| Extracellular vesicle fluorescence labeling quality assessment | Labeling efficiency | >20% |
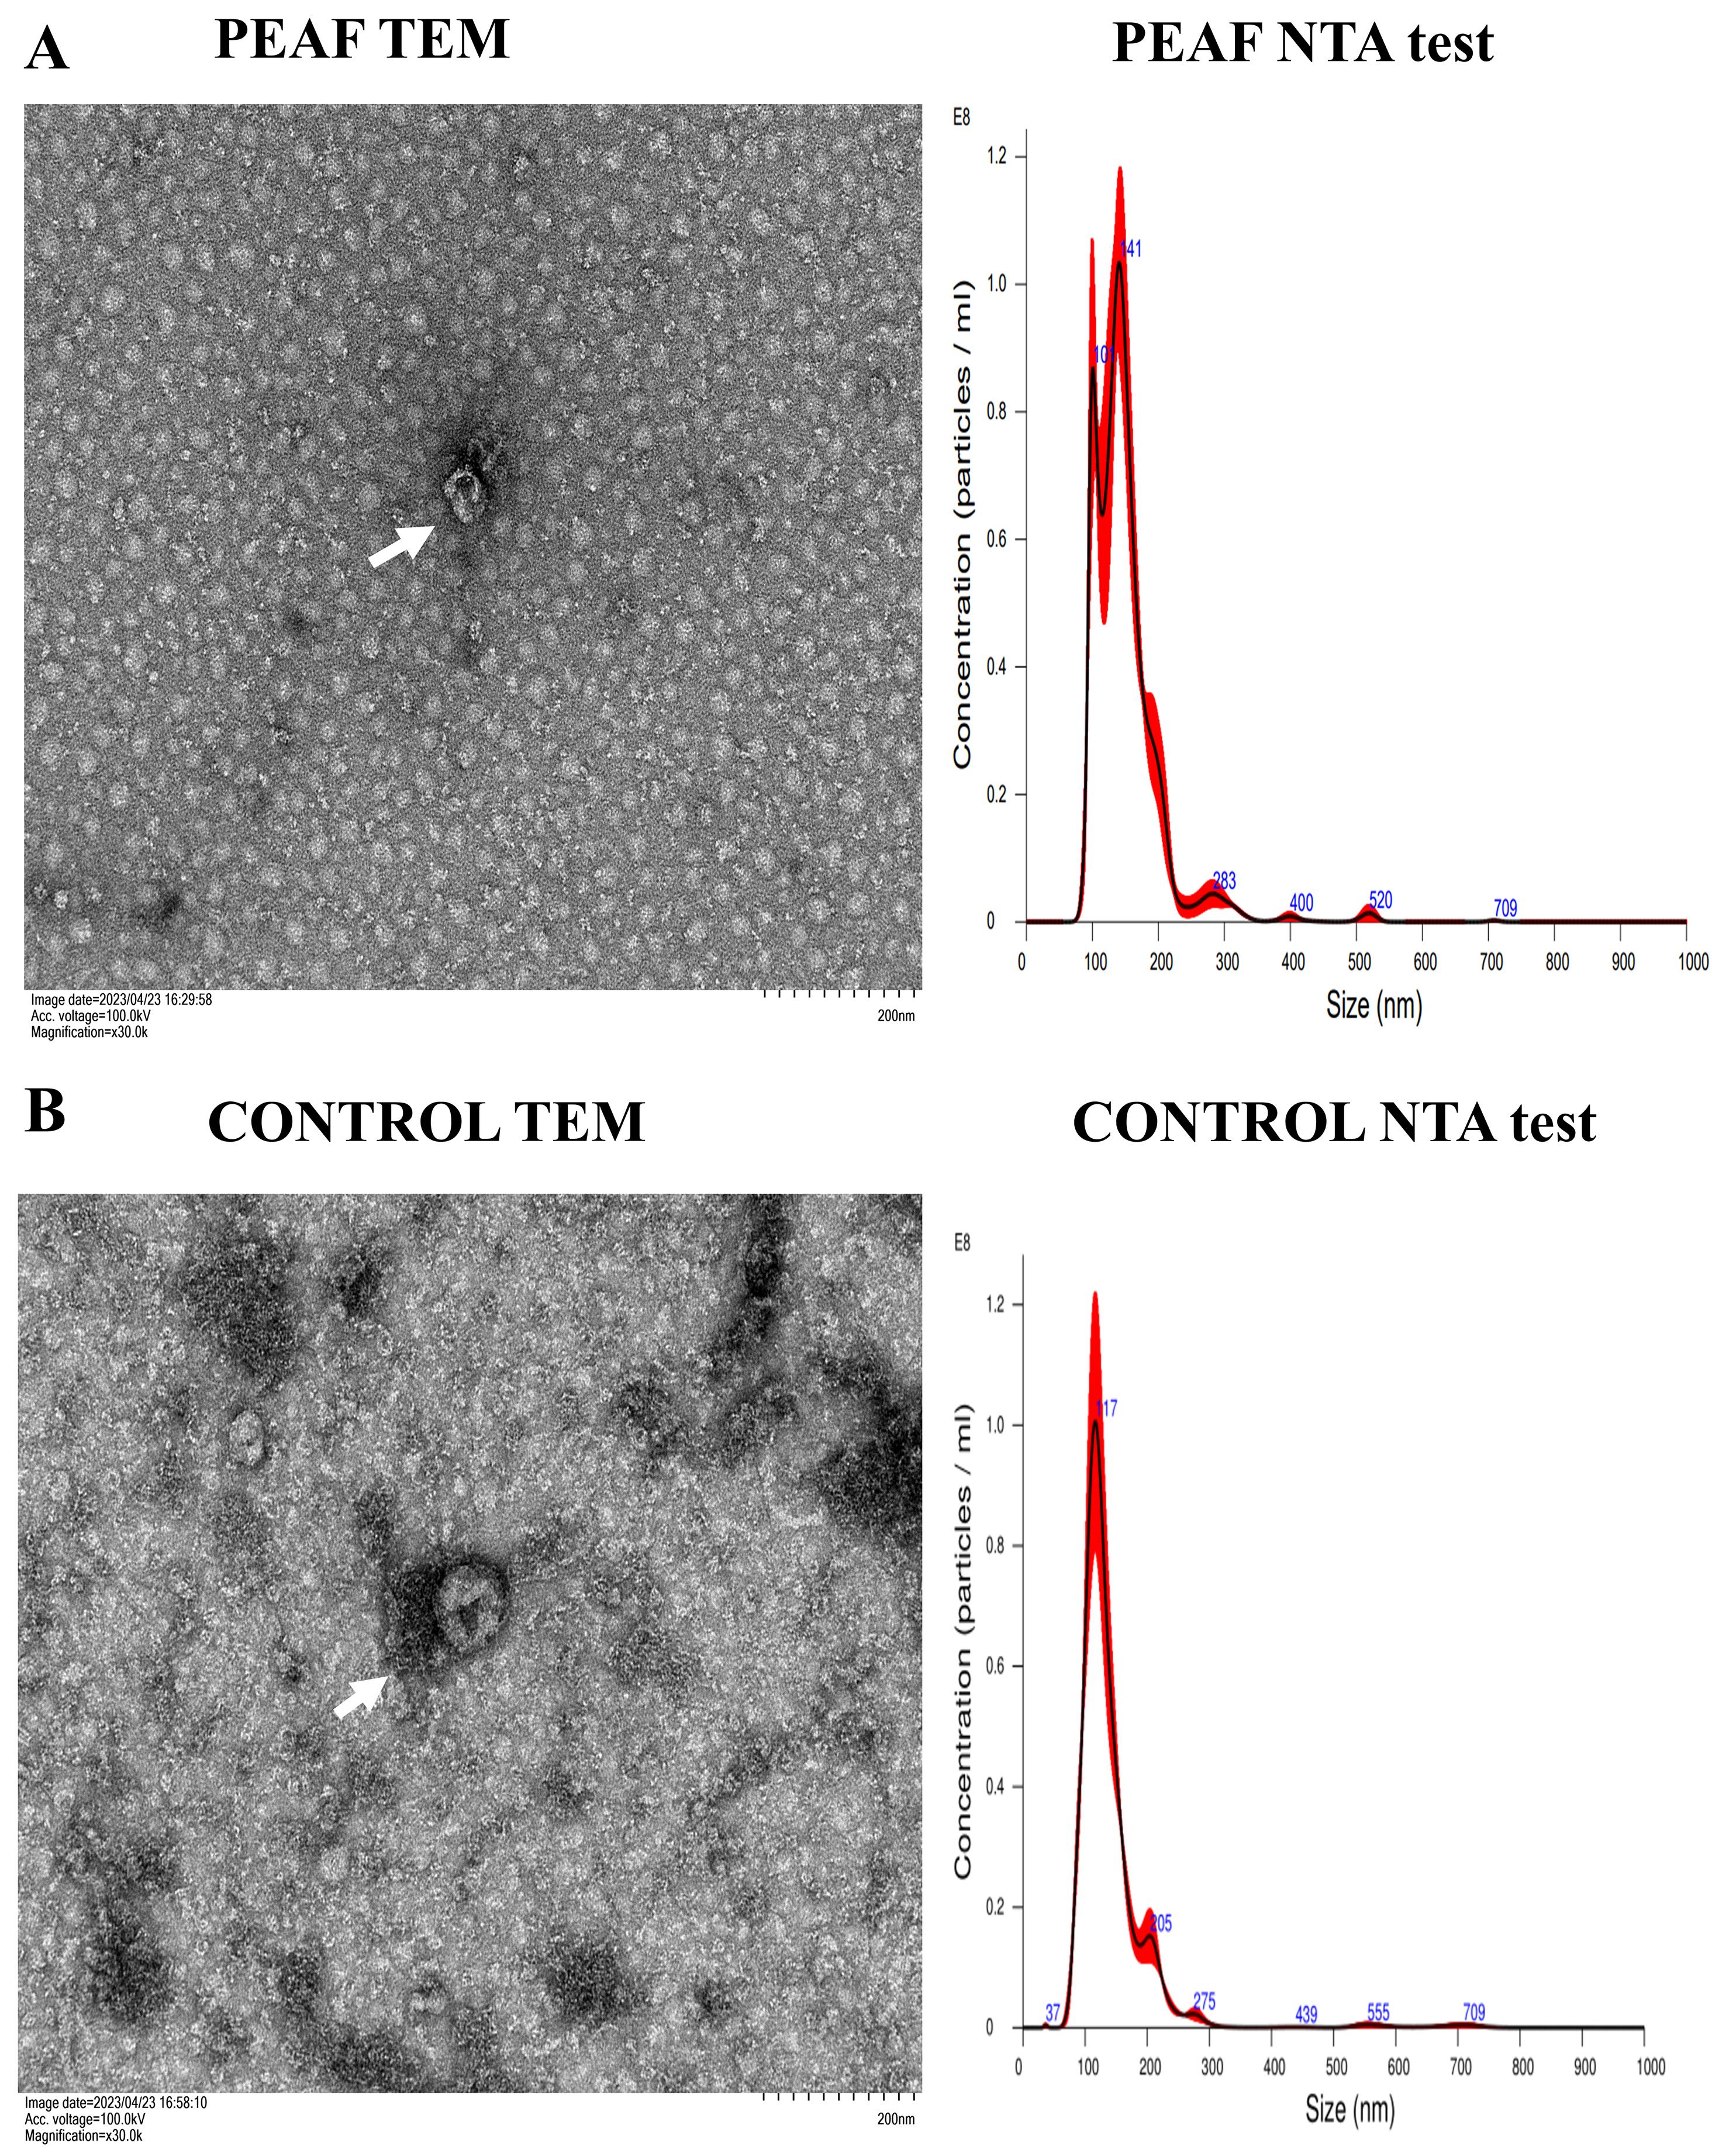
Figure 2. Representative transmission electron microscopy (TEM) and representative nanoparticle tracking analysis (NTA) of the case and control groups. (A) Left: Representative TEM image of samples from patients with PEAF, showing that isolated samples consist of vesicles with typical membrane morphology. Right: Representative NTA of extracellular vesicles isolated from plasma samples of patients with persistent atrial fibrillation (PEAF). The red overlay typically represents data from a single scan or repeated measurements.The white arrow represents the EVs in the PEAF group. (B) Left: Representative TEM image of samples from patients with sinus rhythm (Control). Right: Representative NTA of extracellular vesicles isolated from plasma samples of patients with sinus rhythm. The red overlay typically represents data from a single scan or repeated measurements, while the black solid line represents the average (or median) of all measurements. The more concentrated and closely aligned the red line is, the higher the purity and the more uniform the particle size of the EVs. The white arrow represents the EVs in the control group.
C. Protein extraction
1. Add urea to a final concentration of 8 M and protease inhibitor for ultrasonic lysis.
2. Use the BCA reagent kit for protein concentration determination.
a. Sample processing: After extraction and purification, add the EVs to an appropriate amount of lysis buffer and lyse on ice for 30 min, until measurement.
b. Equilibrate the BCA protein quantification kit to room temperature and observe for precipitation of each reagent. If there is precipitation, please wait for dissolution.
c. Preparation of working fluid:
i. Hole count calculation: 8 standard samples + total number of holes in the sample.
ii. Total volume calculation: 200 μL of working fluid per well.
iii. Preparation of working fluid: Prepare a ratio of reagent A to reagent B of 50:1 according to the total volume.
d. Diluted standard: Add eight PCR tubes to deionized water according to the volume below. Add 120 μL of protein standard BSA to tube 1, and after thorough mixing, take 150 μL and add to tube 2. Repeat this process until reaching tube 7. Tube 8 does not require any treatment; load the sample directly into it (Table 2).
Table 2. Dilute standard
| Pipe number | Dilution volume (μL) | Standard volume (μL) | Final concentration (μg/mL) |
|---|---|---|---|
| 1 | 180 | 120 (5 mg/mL BSA) | 2,000 |
| 2 | 150 | 150 (take from the front tube) | 1,000 |
| 3 | 150 | 150 (take from the front tube) | 500 |
| 4 | 150 | 150 (take from the front tube) | 250 |
| 5 | 150 | 150 (take from the front tube) | 125 |
| 6 | 150 | 150 (take from the front tube) | 62.5 |
| 7 | 150 | 150 (take from the front tube) | 31.25 |
| 8 | 150 | 0 | 0 |
e. Add 25 μL of standard substance and an appropriate concentration of target sample to the micropores of a 96-well plate. If the predicted concentration of the target sample is low, add 25 μL directly. If the predicted concentration is high, add 25 μL after dilution with diluent, for example, diluting 5 times to obtain 5 μL of sample + 20 μL of diluent.
f . Add 200 μL of BCA working fluid to each well and gently shake to mix well.
g. Cover the 96-well plate and incubate at 37 °C for 30 min (if the concentration is low and the color is light, appropriately increase the incubation temperature or extend the incubation time).
h. Open the enzyme-linked immunosorbent assay (ELISA) reader in advance and select the measurement program.
i. Cool the above sample to room temperature and measure absorbance at 562 nm using an enzyme-linked immunosorbent assay (ELISA) reader. Calculate the protein concentration based on the standard curve (multiply the final protein concentration of the sample by the corresponding dilution factor).
D. Trypsin digestion
1. Take an equal amount of protein from each sample for enzymatic hydrolysis and adjust the volume to be consistent with the lysis buffer.
2. For digestion, reduce the protein solution with 5 mM dithiothreitol for 30 min at 56 °C and alkylate with 11 mM iodoacetamide for 15 min at room temperature in darkness.
3. Dilute the protein sample by adding 100 mM TEAB to a urea concentration of less than 2 M.
4. Add trypsin at a ratio of 1:50 (protease: protein, m/m) and carry out enzymolysis overnight. Concentrate the peptides and purify them in the supernatant with ZipTip.
5. Recover the peptide segment by centrifugation at 12,000× g for 10 min at room temperature.
6. Finally, recover the peptide segments once using ultrapure water and combine the two peptide segment solutions.
E. LC–MS/MS analysis
1. Dissolve the peptide segment in liquid chromatography and separate using the NanoElute ultra-high-performance liquid chromatography system.
2. Dissolve the tryptic peptides in solvent A (0.1% formic acid, 2% acetonitrile/in water) and load the sample directly onto a homemade reversed-phase analytical column (25-cm length, 75/100 μm i.d.).
3. Separate peptides with a gradient from 6% to 24% solvent B (0.1% formic acid in acetonitrile) over 70 min, 24% to 35% for 14 min and climbing to 80% in 3 min, then holding at 80% for the last 3 min, all at a constant flow rate of 450 nL/min on the nanoElute UHPLC system.
4. Subject the peptides to a capillary source and then to timsTOF Pro mass spectrometry.
5. Apply the electrospray voltage at 1.60 kV.
6. Analyze precursors and fragments at the TOF detector, with an MS/MS scan range from 100 to 1,700 m/z.
7. Set the data collection mode to Parallel Accumulative Serial Fragmentation (PASEF) mode.
8. Select precursors with charge states 0 to 5 for fragmentation and acquire 10 PASEF-MS/MS scans per cycle.
9. Set the dynamic exclusion time for tandem mass spectrometry scanning to 30 s to avoid repeated scanning of the parent ion.
F. Database search
1. Retrieve the secondary mass spectrometry data using MaxQuant (v1.6.15.0). Search parameter settings: The database is Homousapiens_9606_SP_20220107.fasta (20376 sequences), and an anti-database is added to calculate the false positive rate (FDR) caused by random matching.
2. Add common contamination databases to the database to eliminate the influence of contaminating proteins in the identification results.
3. Set the enzyme digestion method to Trypsin/P, the number of missing cutting positions t to 2, the minimum length of the peptide segment to 7 amino acid residues, the maximum number of modifications in the peptide segment to 5, the tolerance for mass error of primary parent ions in first search and main search to 20 and 4.5 ppm, respectively, and the tolerance for mass error of secondary fragment ions to 20 ppm.
4. Set alkylation of cysteine with carbamidomethyl (C) as the fixed modification, while the variable modification is oxidation of methionine and acetylation of the N-terminus of the protein. Set the FDR for protein identification and PSM identification to 1%.
G. Bioinformatics analysis
1. Derive GO annotation of the proteome from the EggNOG database.
2. Classify proteins by GO annotation based on three categories: cellular component, molecular function, and biological process.
3. Annotate the protein domain functional descriptions identified by PfamScan, which analyzes the data through both the Pfam domain database and the protein sequence alignment.
4. Perform pathway analysis using the KEGG pathway.
5. Consider the pathways with corrected P-values < 0.05 as significant and separate them into individual categories.
6. Examine differentially expressed proteins (DEPs) (same meaning as “differentially abundant proteins”) of all extracellular vesicles by the KEGG pathway database for convenient presentation and protein–protein interaction analysis. The selection criterion for DEP is P-value < 0.05; consider a change in protein differential expression level exceeding 1.5 as a significant upregulation threshold, and a change level less than 1/1.5 as a significant downregulation threshold.
7. For further hierarchical clustering based on extracellular vesicle DEPs functional classification:
a. Obtain all the categories after enrichment, along with their P-values, and then filter for those categories enriched in at least one of the clusters with a P-value < 0.05.
b. Transform this filtered P-value matrix by the function x = -log10 (P-value).
c. Cluster these P-values by one-way hierarchical clustering (Euclidean distance, average linkage clustering) in Genesis.
d. Visualize cluster membership by a heat map using the “heatmap” function from the “ggplot2” R package.
e. Search all DEP databases against the STRING database version 11.5 for protein–protein interactions.
f. Select only interactions between the proteins belonging to the searched data set, thereby excluding external candidates.
8. STRING defines a metric called “confidence score” to define interaction confidence (confidence score ≥ 0.7).
a. Visualize the interaction network from STRING in the R package “networkD3.”
Data analysis
Acquire all proteomics raw data as mass spectrometry raw files. Based on sample origins, a sample-specific protein database is constructed, and database searches are performed using appropriate search algorithms [MaxQuant (v1.6.15.0)]. Carry out peptide and protein-level quality control based on search results. Assign functional annotations [GO, KEGG, protein domain, COG/KOG, STRING, Reactome, WikiPathways, HallMark, and transcription factor (TF) annotations] to the identified proteins. Perform protein quantitation, including distribution and reproducibility analysis, followed by differential expression screening and generation of statistical plots. Differentially expressed proteins (DEPs) undergo functional classification (GO secondary classification, subcellular localization, COG/KOG, and KEGG pathway classification). Conduct enrichment analysis of DEPs using Fisher’s exact test for GO, KEGG, protein domain, Reactome, and WikiPathways. When multiple experimental groups exist, use enrichment clustering analysis to compare functional relationships of DEPs across conditions. Finally, perform protein–protein interaction (PPI) network analysis to identify key regulatory proteins under specific experimental conditions (Figure 3). Analyze the DEP data using Microsoft Excel and GraphPad Prism software for statistical analysis (Figure 4).
The biological replicates used in the original research paper were n = 3 blood samples per group. The student’s t-test was used, and Fisher’s Exact tests or χ2 tests were used for categorical variables. Non-parametric tests for independent samples were used to analyze quantitative data and to calculate the statistical significance of the experimental results. A P-value < 0.05 was defined as statistically significant.
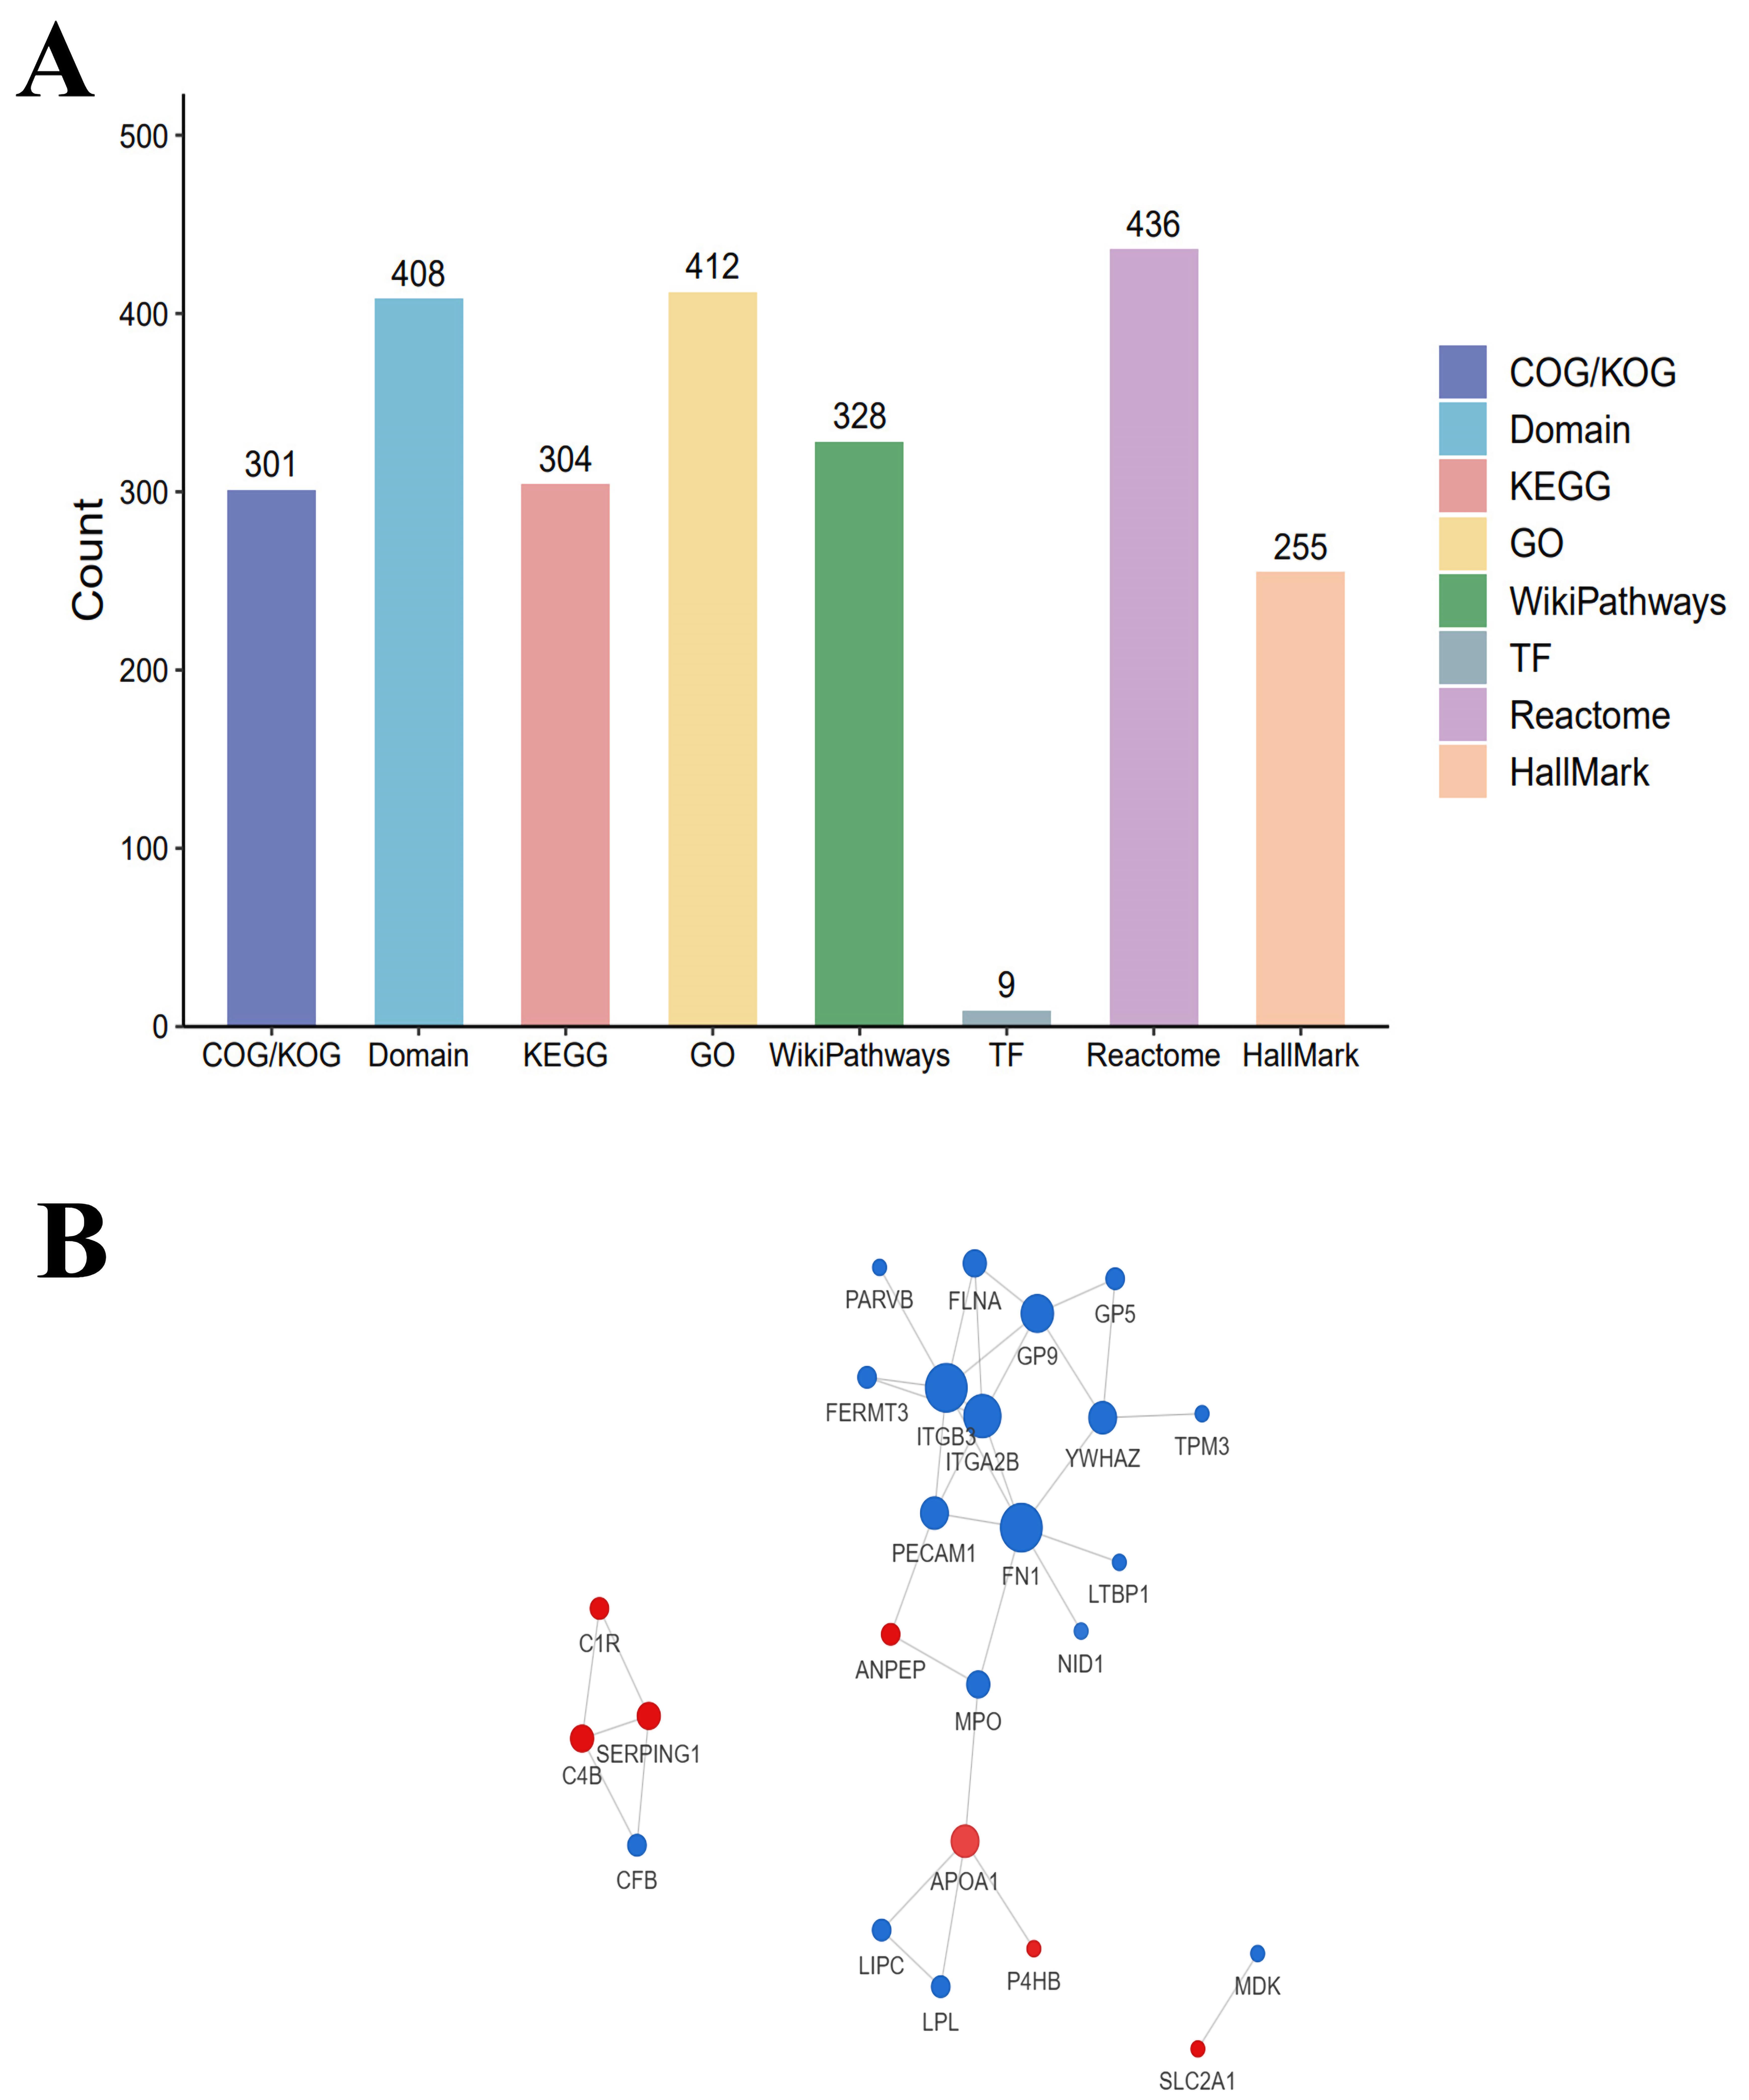
Figure 3. Cluster analysis and protein interaction network analysis. (A) In order to gain a thorough understanding of the functional characteristics of different proteins, we conducted comprehensive functional annotation on the identified proteins, including gene ontology (GO), protein domain, KEGG pathway, COG/KOG functional classification, and subcellular localization. Detailed annotations were provided on topics such as Reactome, WikiPathways, HallMark, and transcription factor (TF). (B) The circles in the figure represent differential proteins, and different colors represent the differential expression of proteins: blue indicates downregulation, and red indicates upregulated proteins; the size of the dots represents the number of proteins that interact with them.
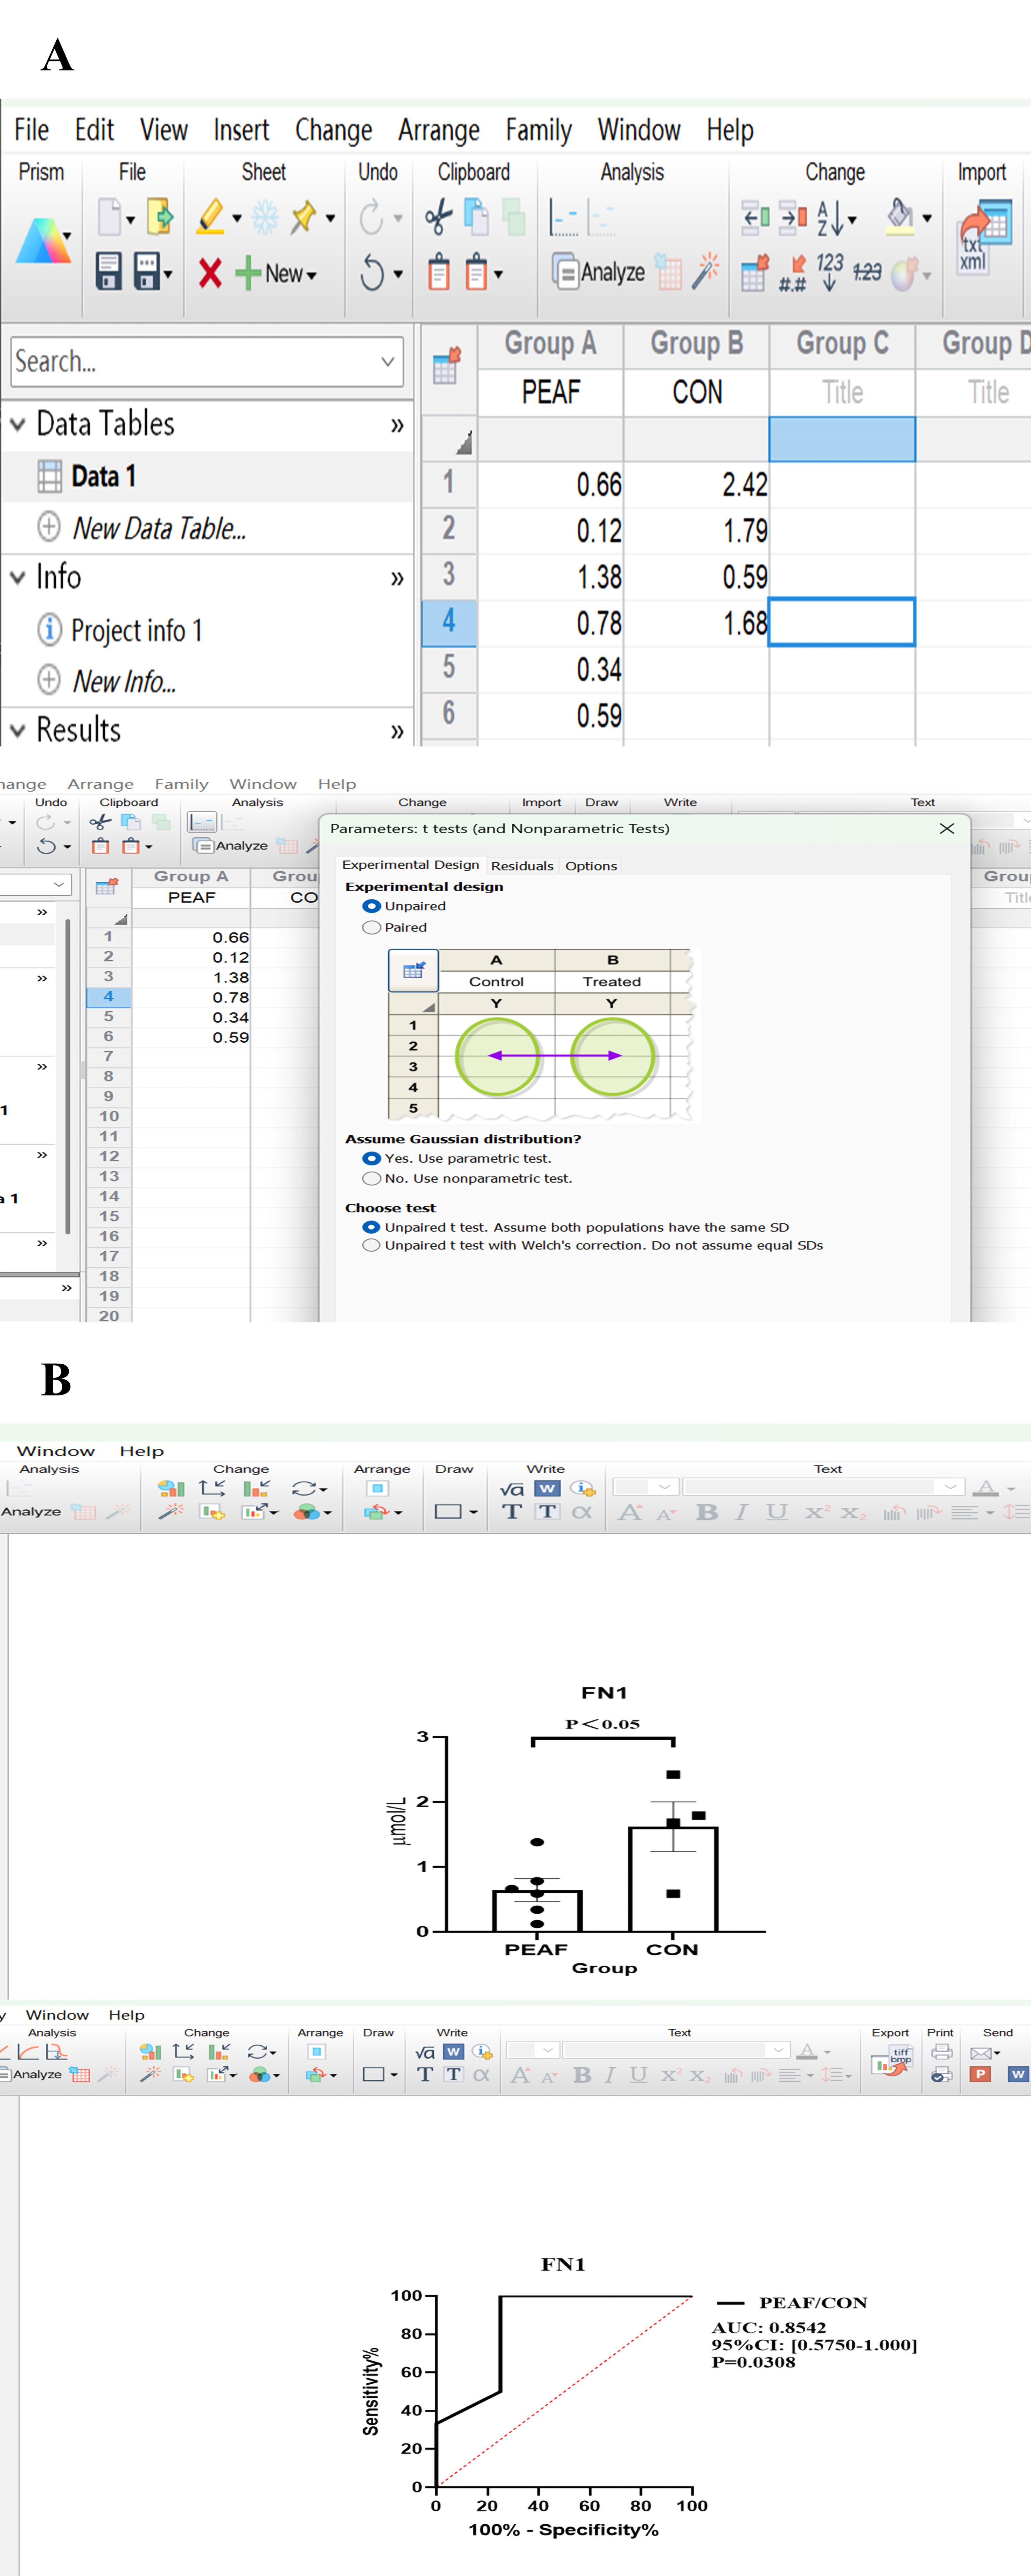
Figure 4. Data analysis using GraphPad Prism. (A) Print screen showing the use of the GraphPad Prism software to input the values for each group. (B) Example of bar graph (top) and ROC curve (bottom) outputs. The bar graph shows mean values with the standard error of the mean (SEM).
Validation of protocol
This protocol has been used and validated in the following research article:
Zhang et al. [14]. Plasma extracellular vesicle proteomics identifies FN1/F13A1-TGF-β pathway as the major signaling pathway associated with persistent atrial fibrillation. J Pharm Biomed Anal.
General notes and troubleshooting
General notes
1. Select proteins with significantly different protein expression or modification levels; select at least five proteins or modification sites for validation.
2. Priority can be given to selecting proteins that have already been reported functionally or have potential relevance to the experimental system of study.
3. Select key proteins with significant differential expression in specific functions, pathways, and components obtained from bioinformatics analysis.
Troubleshooting
Problem 1: Poor reproducibility of differentially expressed proteins (DEPs) between two independent cohorts.
Possible causes: Small sample size per group (e.g., n = 3) combined with high interindividual variation of plasma EV proteome; lack of normalization for batch effects.
Solution: Use at least n = 5–6 per group. Perform median normalization plus local regression (LOESS) to correct for intensity drift. Include technical replicates for 20% of samples to assess reproducibility. Remove proteins with >50% missing values in any group before statistical analysis. Use Student’s t-test with permutation-based FDR correction (q < 0.05) instead of a simple p-value threshold.
Problem 2: Low protein yield from plasma EVs, leading to insufficient peptide amount for LC–MS/MS analysis.
Possible causes: Low starting plasma volume; inefficient EV isolation method (e.g., polymer-based precipitation co- precipitates contaminants that interfere with lysis); incomplete lysis of EV pellets.
Solution: Use at least 500 μL of plasma per sample and opt for size exclusion chromatography (e.g., Izon qEV columns) or ultracentrifugation combined with a protease inhibitor cocktail. Add 8 M urea with sonication (3 × 10 s pulses on ice) to ensure complete EV lysis. Quantify protein with a highly sensitive assay (e.g., BCA kit enhanced protocol or fluorescence-based assay). A minimum of 5 μg of protein is recommended for four-dimensional label-free quantification.
Problem 3: Insufficient number of identified EV markers (e.g., CD9, CD63, CD81, TSG101) despite successful protein quantitation.
Possible causes: Co-isolation of non-EV contaminants (lipoproteins, protein aggregates) that mask low-abundance EV signals; insufficient depth of MS analysis.
Solution: Validate EV enrichment by western blot or NTA before proteomics. For MS, extend the LC gradient to 90 min and use a 25-cm column with 75-μm inner diameter. Add a gas phase fractionation (GPF) step for the first two fractions to increase coverage of low abundance EV proteins. Set the false discovery rate (FDR) to 1% at both peptide and protein levels and manually check that at least two unique peptides per EV marker are present.
Acknowledgments
This protocol has been used and validated in the following research article: Zhang et al. [14]. This work was supported by grants from the National Natural Science Foundation of China (82370350) and Tianjin Key Medical Discipline Construction Project (TJYXZDXK-3-036C).
The following figures were created using BioRender: Graphical overview, https://app.biorender.com/illustrations/6a179fbf83ac212f165e691b?slideId=4ebfed59-08bd-4bde-82bc-18bed90415a3; Figure 1, https://app.biorender.com/illustrations/6a17e82d21d2ee70eaa22571?slideId=b6ed32ce-baeb-4f1d-9bd0-29ee8c979c1a.
Competing interests
The authors declare that there is no conflict of interest.
Ethical considerations
All patients signed informed consent. Study protocol was approved by the local Ethics Committee ([2021]-0325-2) in accordance with the legal regulations and the Declaration of Helsinki.
References
- Singh, M., Tiwari, P. K., Kashyap, V. and Kumar, S. (2025). Proteomics of Extracellular Vesicles: Recent Updates, Challenges and Limitations. Proteomes. 13(1): 12. https://doi.org/10.3390/proteomes13010012
- Dakup, P. P., Ludovico, I. D., You, Y., Rao, C., Flores, J., Bramer, L. M., Rewers, M., Webb‐Robertson, B. M., Metz, T. O., Mirmira, R. G., et al. (2025). Challenges and Opportunities in State‐of‐the‐Art Proteomics Analysis for Biomarker Development From Plasma Extracellular Vesicles. Proteomics. 26: 9–20. https://doi.org/10.1002/pmic.70036
- Reymond, S., Gruaz, L. and Sanchez, J. C. (2023). Depletion of abundant plasma proteins for extracellular vesicle proteome characterization: benefits and pitfalls. Anal Bioanal Chem. 415(16): 3177–3187. https://doi.org/10.1007/s00216-023-04684-w
- Diaz, G., Bridges, C., Lucas, M., Cheng, Y., Schorey, J. S., Dobos, K. M. and Kruh-Garcia, N. A. (2018). Protein Digestion, Ultrafiltration, and Size Exclusion Chromatography to Optimize the Isolation of Exosomes from Human Blood Plasma and Serum. J Visualized Exp. e3791/57467–v. https://doi.org/10.3791/57467-v
- Fochtman, D., Marczak, L., Pietrowska, M. and Wojakowska, A. (2024). Challenges of MS‐based small extracellular vesicles proteomics. J Extracell Vesicles. 13(12): e70020. https://doi.org/10.1002/jev2.70020
- Ríos de los Ríos Reséndiz, J., Herrmann-Sim, F., Wilkesmann, L., Helm, D., Schneider, M., Campione, G., Plügge, K., Greiner, G., Lazaro García, L., Berker, J., et al. (2025). A translational protocol optimizes the isolation of plasma-derived extracellular vesicle proteomics. Sci Rep. 15(1): e1038/s41598–025–08366–8. https://doi.org/10.1038/s41598-025-08366-8
- Lee, Y. J., Chae, S. and Choi, D. (2023). Monitoring of single extracellular vesicle heterogeneity in cancer progression and therapy. Front Oncol. 13: e1256585. https://doi.org/10.3389/fonc.2023.1256585
- Canterbury, J. D., Merrihew, G. E., MacCoss, M. J., Goodlett, D. R. and Shaffer, S. A. (2014). Comparison of Data Acquisition Strategies on Quadrupole Ion Trap Instrumentation for Shotgun Proteomics. J Am Soc Mass Spectrom. 25(12): 2048–2059. https://doi.org/10.1007/s13361-014-0981-1
- Kreimer, S., Belov, M. E., Danielson, W. F., Levitsky, L. I., Gorshkov, M. V., Karger, B. L. and Ivanov, A. R. (2016). Advanced Precursor Ion Selection Algorithms for Increased Depth of Bottom-Up Proteomic Profiling. J Proteome Res. 15(10): 3563–3573. https://doi.org/10.1021/acs.jproteome.6b00312
- Fröhlich, K., Fahrner, M., Brombacher, E., Seredynska, A., Maldacker, M., Kreutz, C., Schmidt, A. and Schilling, O. (2024). Data-Independent Acquisition: A Milestone and Prospect in Clinical Mass Spectrometry–Based Proteomics. Mol Cell Proteomics. 23(8): 100800. https://doi.org/10.1016/j.mcpro.2024.100800
- Lattmann, E., Räss, L., Tognetti, M., Gómez, J. M. M., Lapaire, V., Bruderer, R., Reiter, L., Feng, Y., Steinmetz, L. M., Levesque, M. P., et al. (2024). Size-exclusion chromatography combined with DIA-MS enables deep proteome profiling of extracellular vesicles from melanoma plasma and serum. Cell Mol Life Sci. 81(1): e1007/s00018–024–05137–y. https://doi.org/10.1007/s00018-024-05137-y
- Goetze, S., van Drogen, A., Albinus, J. B., Fort, K. L., Gandhi, T., Robbiani, D., Laforte, V., Reiter, L., Levesque, M. P., Xuan, Y., et al. (2024). Simultaneous targeted and discovery-driven clinical proteotyping using hybrid-PRM/DIA. Clin Proteomics. 21(1): e1186/s12014–024–09478–5. https://doi.org/10.1186/s12014-024-09478-5
- Peterson, A. C., Russell, J. D., Bailey, D. J., Westphall, M. S. and Coon, J. J. (2012). Parallel Reaction Monitoring for High Resolution and High Mass Accuracy Quantitative, Targeted Proteomics. Mol Cell Proteomics. 11(11): 1475–1488. https://doi.org/10.1074/mcp.o112.020131
- Zhang, L. L., Lin, W. H., Ye Di, C., Hou, H. T., Chen, H. X., Zhou, J., Yang, Q. and He, G. W. (2026). Plasma extracellular vesicle proteomics identifies FN1/F13A1–TGF-β pathway as the major signaling pathway associated with persistent atrial fibrillation. J Pharm Biomed Anal. 268: 117211. https://doi.org/10.1016/j.jpba.2025.117211
- Schilling, B., MacLean, B., Held, J. M., Sahu, A. K., Rardin, M. J., Sorensen, D. J., Peters, T., Wolfe, A. J., Hunter, C. L., MacCoss, M. J., et al. (2015). Multiplexed, Scheduled, High-Resolution Parallel Reaction Monitoring on a Full Scan QqTOF Instrument with Integrated Data-Dependent and Targeted Mass Spectrometric Workflows. Anal Chem. 87(20): 10222–10229. https://doi.org/10.1021/acs.analchem.5b02983
- Gallien, S., Bourmaud, A., Kim, S. Y. and Domon, B. (2014). Technical considerations for large-scale parallel reaction monitoring analysis. J Proteomics. 100: 147–159. https://doi.org/10.1016/j.jprot.2013.10.029
- Antelo-Varela, M., Bumann, D. and Schmidt, A. (2024). Optimizing SureQuant for Targeted Peptide Quantification: a Technical Comparison with PRM and SWATH-MS Methods. Anal Chem. 96(45): 18061–18069. https://doi.org/10.1021/acs.analchem.4c03622
- Chen, Z., Leung, T. C. N., Lui, Y. L., Ngai, S. M. and Chung, H. Y. (2023). Combination of untargeted and targeted proteomics for secretome analysis of L-WRN cells. Anal Bioanal Chem. 415(8): 1465–1476. https://doi.org/10.1007/s00216-023-04534-9
- Wang, Y. and Zhang, M. (2022). Urinary Exosomes: A Promising Biomarker for Disease Diagnosis. Lab Med. 54(2): 115–125. https://doi.org/10.1093/labmed/lmac087
Article Information
Publication history
Received: Jun 10, 2026
Accepted: Aug 24, 2026
Available online: Sep 23, 2026
Published: Oct 5, 2026
Copyright
© 2026 The Author(s); This is an open access article under the CC BY-NC license (https://creativecommons.org/licenses/by-nc/4.0/).
How to cite
Zhang, L. and He, G. (2026). Identifying Differentially Expressed Proteins via Plasma Exosomal Proteomics. Bio-protocol 16(19): e5840. DOI: 10.21769/BioProtoc.5840.

 Download Citation in RIS Format
Category
Medicine > Cardiovascular system
Biochemistry > Protein > Quantification
Do you have any questions about this protocol?
Post your question to gather feedback from the community. We will also invite the authors of this article to respond.
 Post a Question


