


- Protocols

- Articles and Issues
- For Authors
- About
- Become a Reviewer


3D Iterative Immunofluorescence Imaging on Whole-Mount Samples

Published: Vol 16, Iss 19, Oct 5, 2026 DOI: 10.21769/BioProtoc.5838 Views: 81
Reviewed by: Ivonne SehringRajesh D GunageAnonymous reviewer(s)
 PDF
PDF  Ask a question
Original research article
The authors used this protocol in:

Sep 2026

Protocol Collections
Comprehensive collections of detailed, peer-reviewed protocols focusing on specific topics




Abstract
Multicellular organization relies on reciprocal interactions between molecular events, such as gene expression and protein state, and higher-scale properties, such as spatial patterning and tissue architecture. Understanding these processes requires methods that enable quantitative measurements at subcellular resolution, while maintaining the three-dimensional tissue organization. Conventional immunofluorescence imaging captures spatial information but is limited to the number of fluorescence markers that can be imaged simultaneously, whereas dissociation-based single-cell approaches can profile multimodal cellular states but lack positional information. Here, we describe 3D in toto iterative immunofluorescence imaging, termed 3D-4i, which enables up to ten-plex protein and protein state measurements in early zebrafish embryos. Leveraging sample immobilization on 96-well plates together with a gentle liquid handling system and high-content spinning disc confocal microscopy, this method comprises repeated rounds of antibody staining, optical clearing, confocal imaging, and antibody elution. Subsequent image analysis allows segmentation of nuclei and cells, extraction of quantitative single-cell features, and integration of molecular measurements with spatial context. Altogether, 3D-4i provides a scalable platform for investigating diverse biological processes in intact embryos, while maintaining both subcellular resolution and three-dimensional context.
Key features
• Enables volumetric, single-cell multiplexed protein imaging in intact early zebrafish embryos using iterative immunofluorescence imaging.
• Compatible with automated liquid-handling and high-throughput spinning disc confocal microscopy.
• Supports quantitative analysis of diverse biological processes at single-cell resolution.
Keywords: Fluorescence microscopy Multiplexed imaging
Antibody
High-throughput imaging
Volumetric imaging
Whole-mount samples
Automated liquid handling
Multiplexed imaging
Antibody
High-throughput imaging
Volumetric imaging
Whole-mount samples
Automated liquid handling
Graphical overview
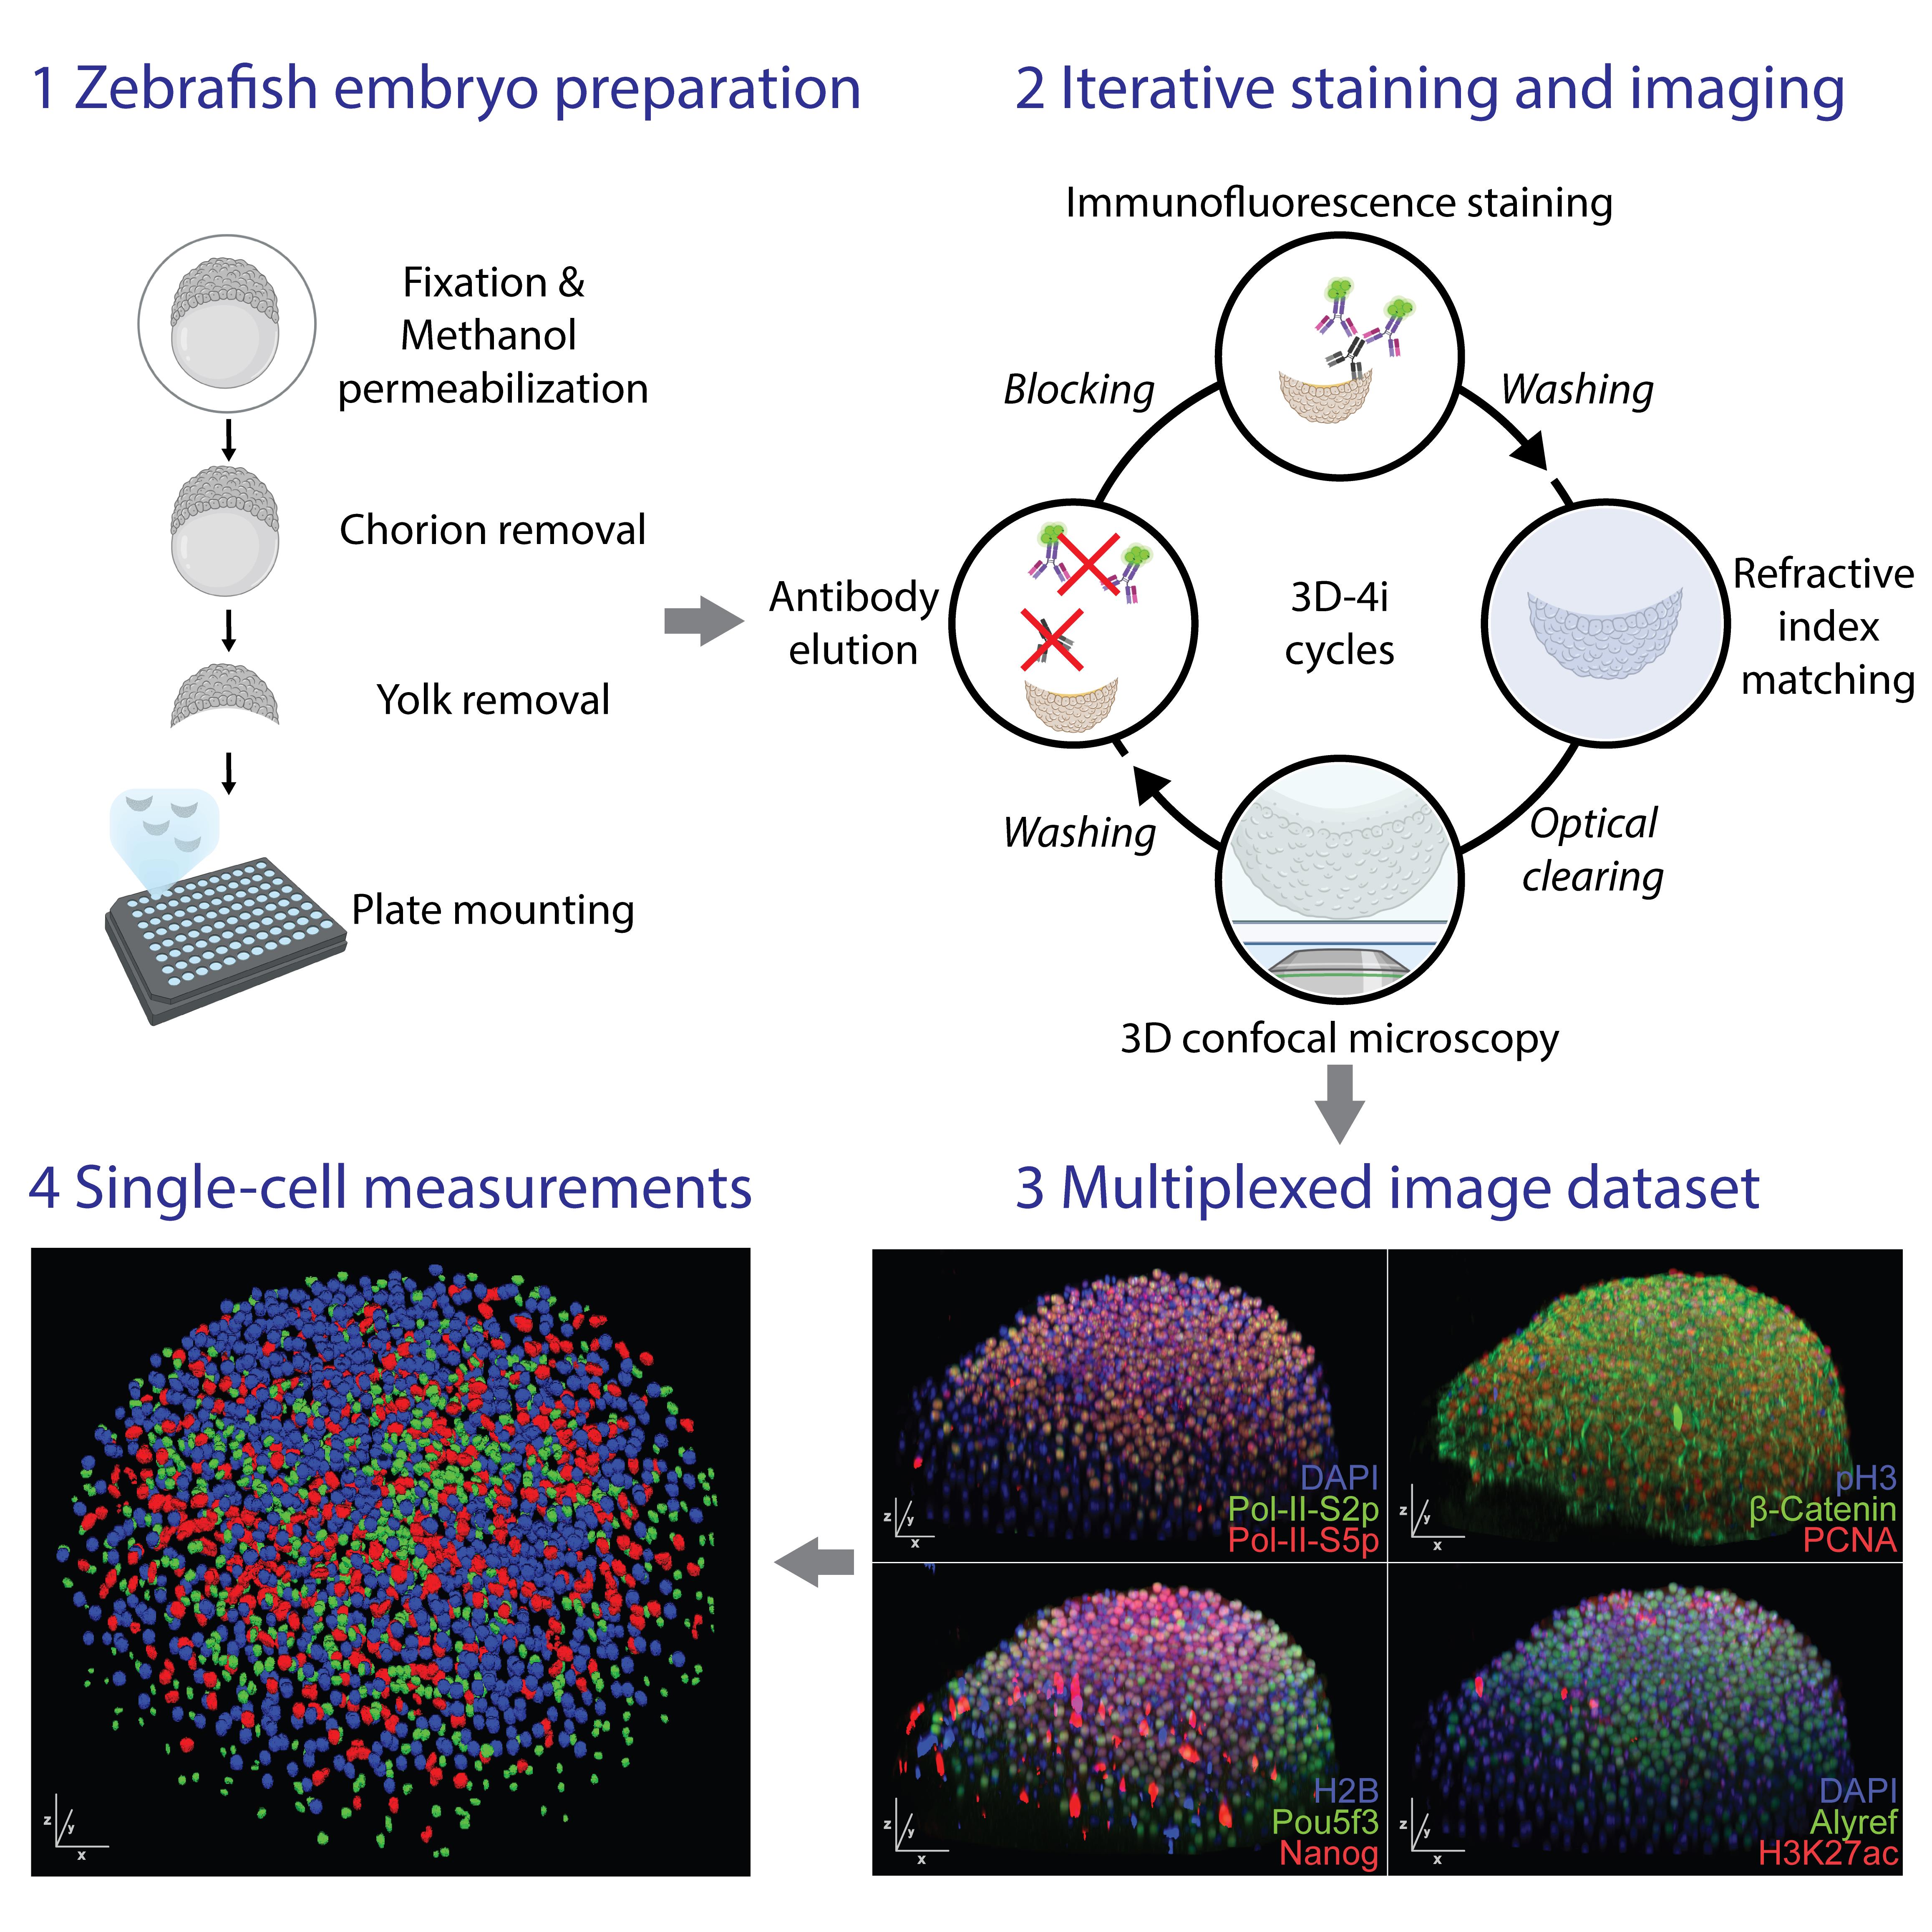
Workflow for multiplexed immunofluorescence in zebrafish embryos using the 3D-4i protocol and subsequent single cell measurements
Background
Multicellular development emerges from coordinated molecular, cellular, and tissue-scale processes. In embryos, proteins, chromatin states, signaling activities, cell-cycle progression, and cell–cell interactions are organized in three-dimensional space and change rapidly over developmental time. Methods that preserve this spatial organization while enabling quantitative measurements at single-cell or subcellular resolution are therefore essential for understanding how cellular states are coordinated within intact tissues. Immunofluorescence microscopy is widely used to visualize protein abundance and localization in fixed samples [1]. It provides direct spatial information and can resolve subcellular patterns, but conventional immunofluorescence is limited by spectral overlap between fluorophores and therefore typically allows only a small number of markers to be measured in the same specimen [2]. In contrast, dissociation-based single-cell approaches can profile many molecular features across large numbers of cells but generally remove cells from their native spatial context [3,4]. This loss of positional information is a major limitation when studying embryos and other organized three-dimensional systems, where cell state is strongly linked to tissue architecture, neighboring cells, and developmental position.
Cyclic immunofluorescence methods overcome part of this limitation by repeatedly staining, imaging, and removing or inactivating fluorescent signals from the same sample. Iterative immunofluorescence imaging uses repeated rounds of antibody staining, confocal imaging, and antibody elution to link multiplexed protein measurements with spatially resolved single-cell information [5–7]. Related cyclic imaging approaches, including CODEX and Immuno-SABER, have similarly enabled high-dimensional profiling of intact samples by increasing the number of measurable targets beyond the limits of standard fluorescence microscopy [8,9]. These methods have been particularly powerful in cultured cells and thin tissue sections, where samples are relatively accessible to antibodies, easy to immobilize, and compatible with repeated liquid exchange. Adapting cyclic immunofluorescence to intact three-dimensional developmental specimens remains technically challenging. In volumetric samples, antibodies must penetrate through many cell tiers, while maintaining specific and uniform staining. Repeated liquid exchange can disturb or detach fragile specimens, especially when samples are not naturally adherent. In addition, optical sectioning through thick samples introduces imaging challenges such as light scattering, signal attenuation, refractive index (RI) mismatch, and optical aberrations. Finally, multiplexed imaging requires that each staining and elution cycle be reproducible and that residual signal from previous cycles remains sufficiently low to avoid compromising later measurements.
The early zebrafish embryo is a useful system for developing and applying volumetric multiplexed imaging methods. Zebrafish embryos develop externally, are optically accessible, and can be collected in large numbers, making them well suited for high-content imaging approaches. However, early embryos are also challenging for cyclic imaging because they are spherical, non-adherent, and sensitive to handling. A successful protocol must therefore combine robust fixation and permeabilization, stable whole-mount immobilization, gentle liquid handling, efficient antibody elution, and high-throughput confocal imaging. Here, we describe 3D in toto iterative immunofluorescence imaging, termed 3D-4i, for multiplexed protein measurements in intact early zebrafish embryos [10]. The protocol immobilizes fixed and permeabilized embryos in coated 96-well plates and uses automated liquid handling to perform repeated rounds of antibody staining, washing, optical clearing, confocal imaging, and elution. High-content spinning disk confocal microscopy enables volumetric imaging of whole embryos, while downstream image analysis supports nuclear and cellular segmentation, extraction of quantitative features, and integration of protein measurements with three-dimensional spatial context.
Altogether, this protocol provides a scalable approach for multiplexed analysis of intact embryos. By preserving tissue organization while expanding the number of measurable protein markers, 3D-4i enables investigation of diverse developmental and cellular processes at single-cell resolution in their native three-dimensional context.
Materials and reagents
Biological materials
1. Zebrafish (Danio rerio) embryos, such as wild-type golden line or Tg(β-actin:H2A-mCherry), were used in this work
Note: This protocol has been rigorously tested for zebrafish embryos of stages 2.5–5 h post fertilization (hpf). Other biological samples, including tissues, whole animals, or embryos from other species, may also be compatible but will require optimization (see General notes).
Reagents
1. 10× DPBS (Thermo Fisher Scientific, catalog number: 14200075)
2. 1× DPBS (Thermo Fisher Scientific, catalog number: 14190144)
3. 16% paraformaldehyde (PFA) (Electron Microscopy Sciences, catalog number: 15710)
4. Bovine serum albumin (BSA) (Sigma-Aldrich, catalog number: B4287-5G)
5. CaCl2·2H2O (Merck Millipore, catalog number: 1023820250)
6. Diatrizoic acid (Sigma-Aldrich, catalog number: D9268)
7. Distilled water (Thermo Fisher Scientific, catalog number: 10977035)
8. Guanidine chloride (Sigma-Aldrich, catalog number: G4505)
9. HCl (e.g., 32%) (Sigma-Aldrich, catalog number: 1003191011)
10. Human fibronectin (1 mg/mL) (Sigma-Aldrich, catalog number: F0895)
11. Iodixanol (Sigma-Aldrich, catalog number: D1556)
12. KCl (Carl Roth, catalog number: 6781.1)
13. L-glycine (Sigma-Aldrich, catalog number: G7126)
14. Maleimide (Sigma-Aldrich, catalog number: 129585)
15. Methanol (Sigma-Aldrich, catalog number: 179957)
16. Methylene blue 1% (Thermo Fisher Scientific, catalog number: 042771.AE)
17. MgCl2·6H2O (Sigma-Aldrich, catalog number: M2670)
18. N-acetyl-cysteine (Sigma-Aldrich, catalog number: A9165)
19. N-methyl-d-glucamine (Sigma-Aldrich, catalog number: M2004)
20. NaCl (Carl Roth, catalog number: 3957.1)
21. NH4Cl (Sigma-Aldrich, catalog number: 254134)
22. Poly-D-lysine (0.1 mg/mL) (Thermo Fisher Scientific, catalog number: A3890401)
23. Sodium hydroxide (NaOH), 1N standard solution (Thermo Fisher Chemicals, catalog number: 124260010)
24. TCEP-HCl (Lucerna Chem, catalog number: BP-P1020)
25. Triton X-100 Surfact-AmpsTM detergent solution (10% solution) (Thermo Fisher Scientific, catalog number: 85112)
26. Tween20 (40% solution) (Sigma-Aldrich, catalog number: P9416)
27. Urea (Sigma-Aldrich, catalog number: U1250)
Solutions
1. E3 buffer (See Recipes)
2. 2× Fixation solution (FS) (see Recipes)
3. Quenching solution (QS) (see Recipes)
4. PBS-T washing solution (PBS-T) (see Recipes)
5. 2× conventional blocking buffer (cBB) (see Recipes)
6. Plate coating solution (see Recipes)
7. 4i Elution buffer (4i-EB) (see Recipes)
8. 2× 4i blocking buffer (sBB) (see Recipes)
9. PROTOS imaging buffer (PROTOS) (see Recipes)
Recipes
1. E3 buffer
60× stock:
| Reagent | Final concentration | Volume (2 L) |
|---|---|---|
| Water | - | 2 L |
| NaCl | 0.3 M | 34.8 g |
| KCl | 0.01 M | 1.6 g |
| CaCl2·2H2O | 0.02 M | 5.8 g |
| MgCl2·6H2O | 0.024 M | 9.78 g |
To prepare a 60× stock, dissolve the ingredients in H2O, to a final volume of 2 L. Adjust the pH to 7.2 with NaOH. Autoclave (https://cshprotocols.cshlp.org/content/2011/10/pdb.rec66449).
1× E3 buffer:
| Reagent | Final concentration | Volume (1 L) |
|---|---|---|
| 60× E3 buffer | 1× | 16 mL |
| Water | - | 984 mL |
| Methylene blue (1%) | 1 mg/L | 100 μL |
2. 2× Fixation solution (FS)
| Reagent | Final concentration | Volume (20 mL) |
|---|---|---|
| 10× DPBS | 2× | 4 mL |
| Water | - | 6 mL |
| 16% PFA | 8% | 10 mL |
First dilute the DPBS to 2× and then add the PFA for dilution. For use, add 1:1 to E3 buffer containing the sample to arrive at 1× DPBS and 4% PFA concentration.
Caution: PFA is a highly toxic chemical and should only be handled in a chemical safety cabinet.
Store the solution in the fridge and use it within a week; ideally, prepare fresh every time.
3. Quenching solution (QS)
| Reagent | Final concentration | Volume (10 mL) |
|---|---|---|
| 1× DPBS | 1× | 10 mL |
| NH4Cl | 100 mM | 53.5 mg |
Dissolve the NH4Cl powder in DPBS while shaking on a rocker.
4. PBS-T
| Reagent | Final concentration | Volume (50 mL) |
|---|---|---|
| 1× DPBS | 1× | 49.875 mL |
| Tween20 (40%) | 0.1% | 125 μL |
Add the Tween20 solution by pipetting up and down in the DPBS to make sure it is evenly distributed.
5. cBB
| Reagent | Final concentration | Volume (10 mL) |
|---|---|---|
| 1× DPBS | 1× | 9.75 mL |
| BSA | 1% | 100 mg |
| Triton-X-100 (10%) | 0.25% | 250 μL |
Dissolve the BSA powder in the DPBS by gently rocking the tube on a shaker. Store the solution in the fridge and use it within a month.
6. Plate coating solution
| Reagent | Final concentration | Volume (1 mL) |
|---|---|---|
| 1× DPBS | 1× | 400 μL |
| Poly-D-lysine (0.1 mg/mL) | 0.05 mg/mL | 500 μL |
| Human fibronectin (1 mg/mL) | 0.1 mg/mL | 100 μL |
Prepare the solution directly before use. Caution: Prolonged storage will reduce the coating material as it adsorbs to the container walls.
7. 4i Elution buffer (4i-EB)
Stock:
| Reagent | Final concentration | Volume (250 mL) |
|---|---|---|
| Water | - | To 250 mL final volume |
| L-glycine | 0.5 M | 9.38 g |
| Urea | 1.2 M | 18.02 g |
| Guanidine chloride | 3 M | 71.65 g |
Prepare the elution buffer stock containing water, L-glycine, urea, and guanidine chloride. Store at 4 °C for up to 6 months.
Ready-to-use solution:
| Reagent | Final concentration | Volume (5 mL) |
|---|---|---|
| 4i elution buffer stock | - | 5 mL |
| TCEP-HCl | 0.07 M | 100 mg |
| HCl (33%) | Adjust to pH 2.5 | ~77 μL |
Before use, add TCEP-HCl to the required volume and adjust the pH to 2.5 with HCl. Confirm the pH using a pH test strip.
8. 2× 4i blocking buffer (sBB)
| Reagent | Final concentration | Volume (10 mL) |
|---|---|---|
| 1× DPBS | 1× | 10 mL |
| BSA | 2% | 0.2 g |
| NH4Cl | 0.4 M | 0.2 g |
| Maleimide (just before use) | 0.6 M | 0.58 g |
The sBB can be prepared and stored in the fridge; however, maleimide is added just before use.
9. PROTOS imaging buffer (PROTOS)
| Reagent | Final concentration | Volume (100 mL) |
|---|---|---|
| Water | - | To 100 mL final volume |
| N-methyl-d-glucamine | 23.5% | 23.5 g |
| Diatrizoic acid | 29.4% | 29.4 g |
| Iodixanol | 32.4% | 32.4 g |
| N-acetyl-cysteine (add on the day before use) | 0.35 M | 5.7 g |
Add 50 mL of water to a beaker, followed by N-methyl-D-glucamine and diatrizoic acid. Stir until fully dissolved, then add Iodixanol and continue stirring until dissolved. Adjust the final volume to 100 mL with water. Store tightly sealed and protected from light to prevent evaporation and refractive index (RI) changes. Confirm an RI of approximately 1.45 using a refractometer. Add the required amount of N-acetyl-cysteine on the day of use.
Notes:
1. This refractive index matching solution is an adjusted version of the PROTOS clearing solution used in the Chung lab (https://docs.abcam.com/pdf/protocols/clarity-protocol.pdf).
2. Depending on the sample, the antibodies used, and the imaging platform used, other refractive index matching solutions can be used (e.g., CUBIC [11] or fructose-glycerol [12]).
Laboratory supplies
1. Glass Pasteur pipette (Hilgenberg, catalog number: 3150102)
2. Glass vials (e.g., Fisher Scientific, catalog number: 14-961-29)
3. Glass Petri dish (e.g., BRAND, catalog number: BR455717-10EA)
4. 5 mL tubes (e.g., Eppendorf, catalog number: 0030119401)
5. Imaging Spacer, 9 mm diameter × 0.12 mm depth (Sigma-Aldrich, catalog number: GBL654002-100EA)
6. Superfrost® ExcellTM slides (Menzel-Gläser, catalog number: J5800AMNZ)
7. 22 mm round cover slip glass (Menzel-Gläser, catalog number: DV40009)
8. 96-well imaging plate μCLEAR®, SCHWARZ, CELLSTAR® (Greiner Bio-One, catalog number: 655090)
9. pH testing strips (Macherey-Nagel, catalog number: 92110)
10. Nuclear counterstain dye (e.g., DAPI) (Invitrogen, catalog number: D1306)
11. Primary antibodies of choice [e.g., PCNA (D3H8P) rabbit monoclonal antibody; Cell Signaling Technology, catalog number: 13110]
12. Secondary antibodies of choice (e.g., Invitrogen, highly cross-adsorbed secondary antibody, Alexa FluorTM series)
13. (Optional) ZenonTM IgG Labeling kits (Invitrogen)
14. (Optional) Reagent reservoirs (BRAND, catalog number: BR701450)
15. (Optional) BRAVO compatible 70 μL tips in 384-unit box (Agilent Technologies, catalog number: 19133-142)
Note: Choice of primary antibody species and secondary detection antibodies must be compatible and tested with the sample. (see Supplementary Section C and General notes).
Equipment
1. Chemical safety cabinet/hood
2. Watchmaker's tweezers DUMONT Inox (DUMONT, model: Size 5)
3. Magnetic stirrer (e.g., IKA, model: RCT basic, catalog number: 0020129521)
4. Stereomicroscope (e.g., ZEISS, model: Stemi 508)
5. Orbital rocker-shaker (e.g., IKA, ROCKER 3D, catalog number: 0004001000)
6. FisherbrandTM UV crosslinker (Fisher Scientific, catalog number: 13-245-222)
7. Laboratory centrifuge with rotors compatible with 96-well plate inserts (e.g., Eppendorf, model: 5810R)
8. Spinning disk confocal microscope (e.g., Visitron, model: VisiScope CSU-X1)
9. pH meter (e.g., METTLER TOLEDO, model: SevenDirect series)
10. Pipetboy acu 2 (Integra, catalog number: 1550179)
11. Freezer (-20 °C)
12. Refrigerator (2–8 °C)
13. (Optional) Refractometer (e.g., KERN, model: analog refractometer)
14. (Optional) Liquid handling platform (e.g., Agilent Technologies, model: BRAVO)
Software and datasets
1. (Required) ImageJ/FIJI [13]
2. (Optional advanced analysis) All code used for the image analysis pipelines is available via GitHub at https://github.com/pelkmanslab/abbott/tree/v0.3.9.1, https://doi.org/10.5281/zenodo.22012790, https://github.com/pelkmanslab/abbott-features/tree/v0.1.5.2, https://doi.org/10.5281/zenodo.22012817, https://github.com/pelkmanslab/abbott-segmentation-tasks/tree/v0.4.2, https://doi.org/10.5281/zenodo.22012831, and https://github.com/MaksHess/manuscript-multiplexed-embryo-profiling, as also provided in [10,14].
Procedure
Successful acquisition of high-quality multiplexed datasets requires robust sample preparation and mounting steps (Procedure Sections A and B), validated antibody compatibility (Supplementary Sections A–D), an optimized imaging platform, and a suitable clearing method (see General notes). Before starting iterative staining, thoroughly validate and optimize these steps (Figure 1 and Supplementary information). Once compatibility has been confirmed, proceed to the 3D-4i protocol in the Procedure Section C and data analysis.
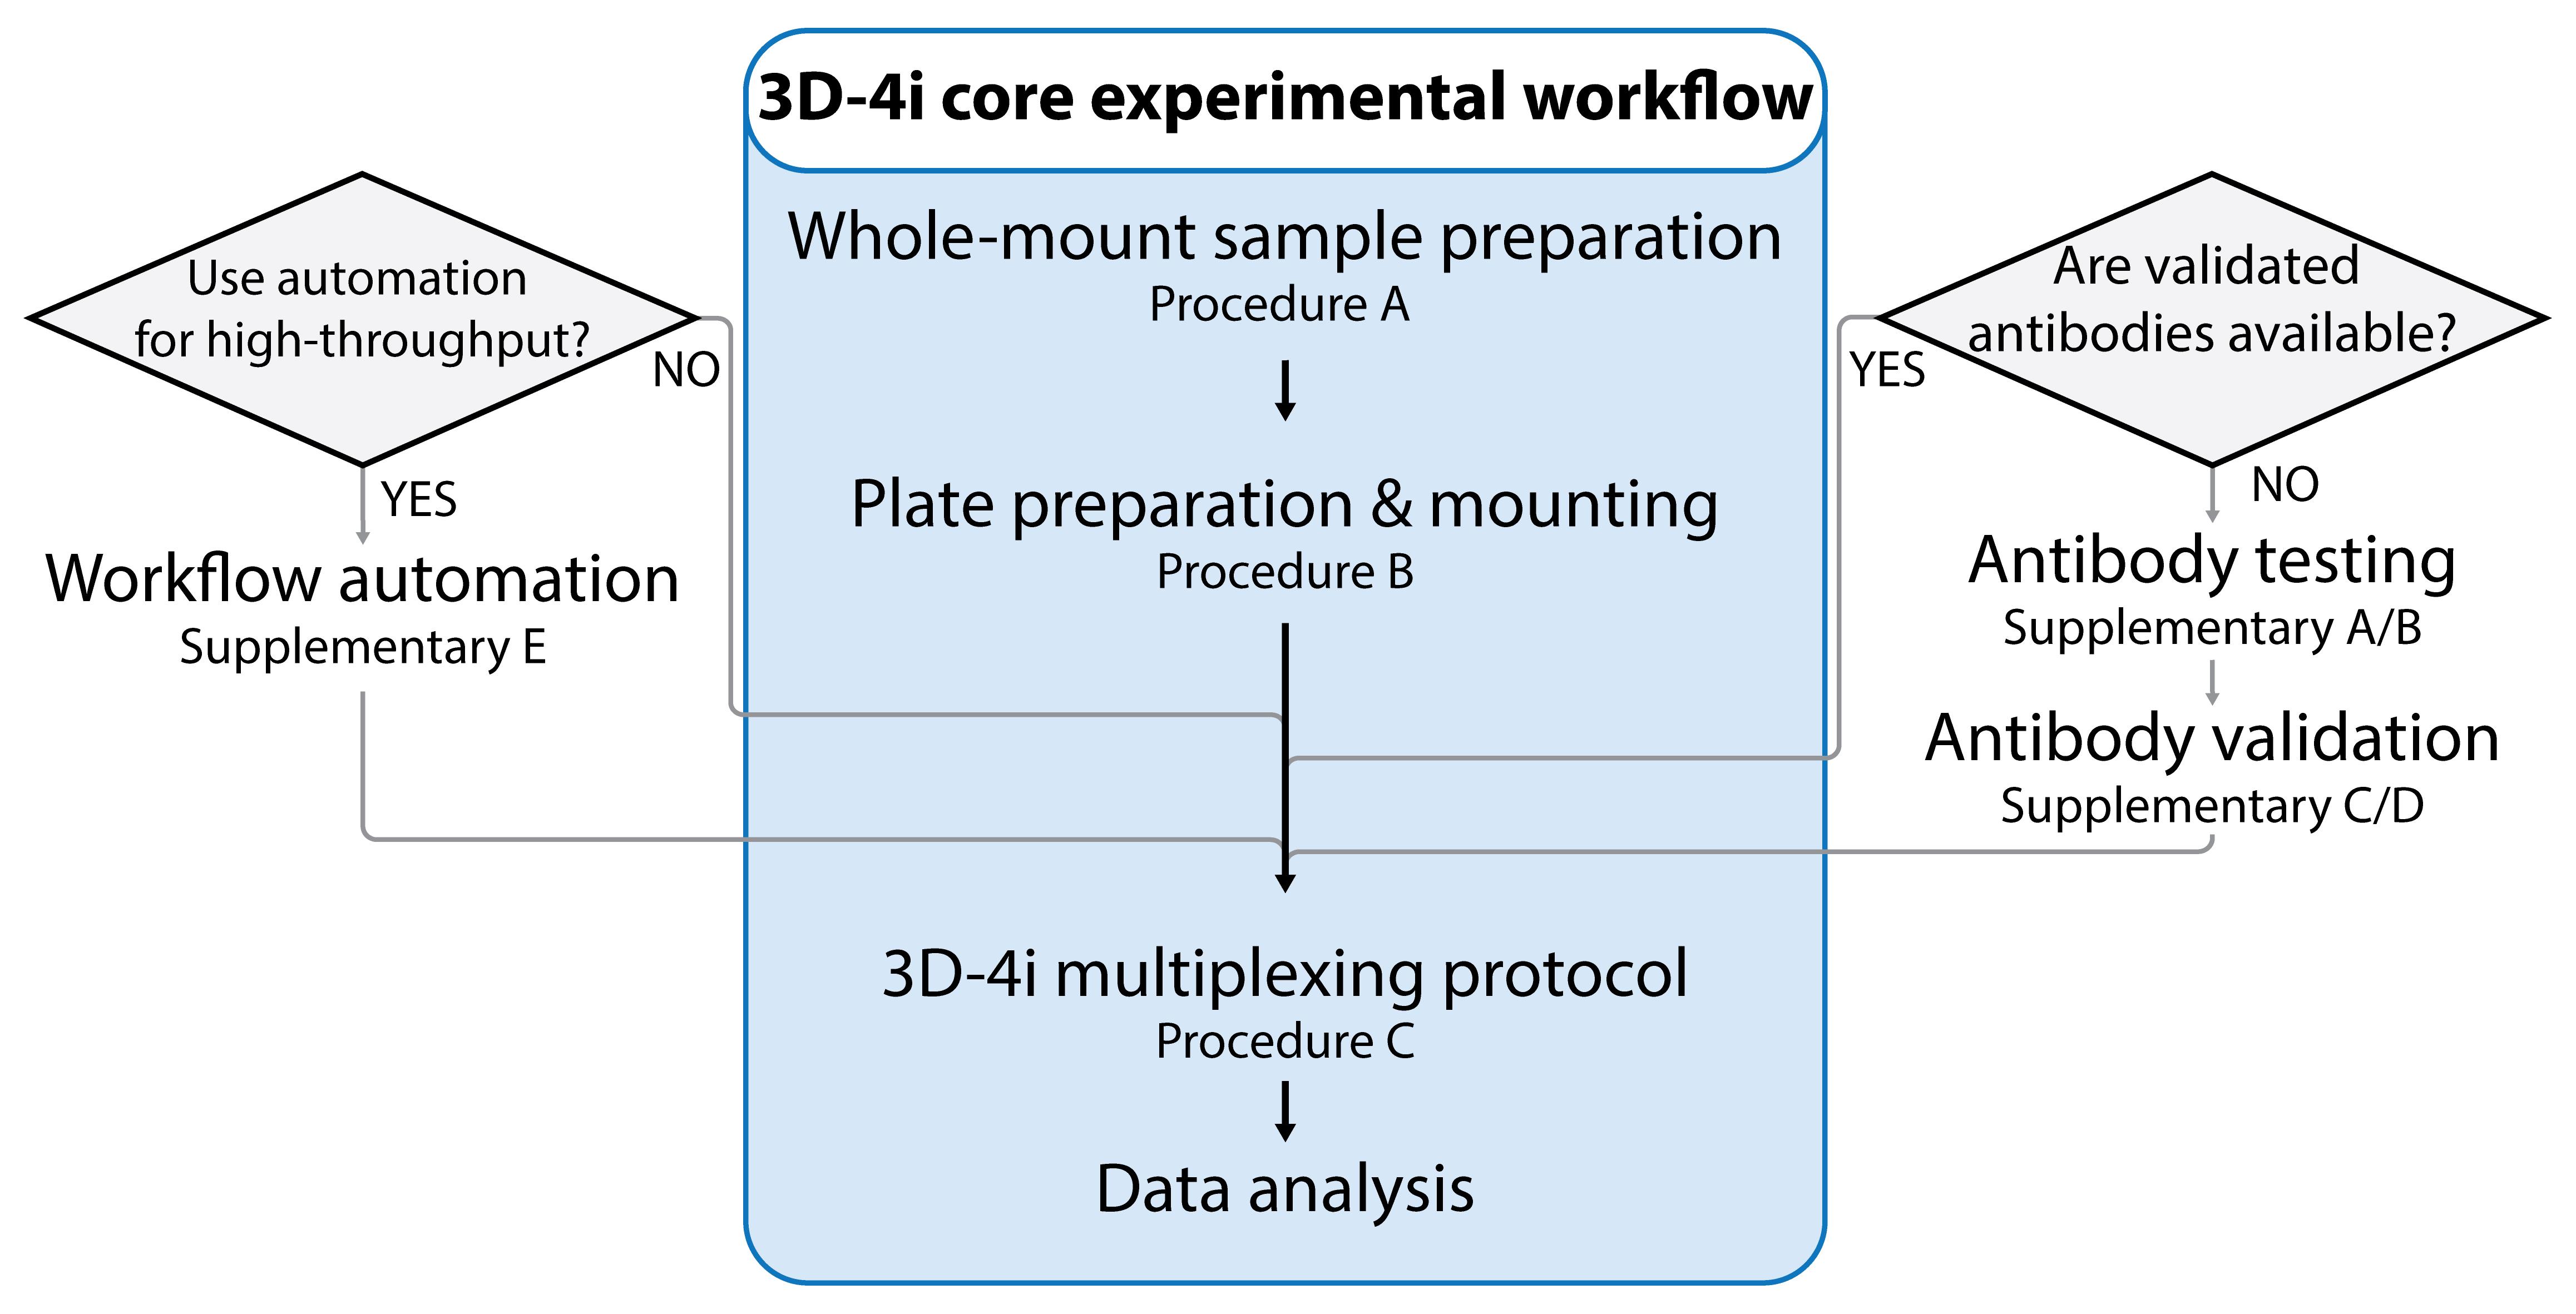
Figure 1. Flowchart of the 3D-4i core and optimization workflow
A. Whole-mount sample preparation (for zebrafish embryos)
Note: This section explains how to prepare the animal cap of zebrafish embryos for the 3D-4i protocol based on existing immunofluorescence protocols [15,16]. For other biological tissues, for example, mouse embryos, we recommend only mounting the tissue of interest and adjusting the following steps based on the sample size (see General notes).
1. Prepare E3 buffer, fixation solution (FS), and quenching solution (QS) (see Recipes).
2. Collect zebrafish eggs from set matings and incubate in E3 buffer until the desired developmental stage of the embryos is achieved [17]. Transfer embryos to 5 mL Eppendorf tubes.
3. Fixation:
a. Add 2.5 mL of FS to 2.5 mL of E3 buffer containing the sample. Incubate at 4 °C overnight (up to 18 h).
Note: Perform all incubations on an orbital shaker (see General notes).
b. Replace the solution with DPBS five times.
c. Wash for 30 min at room temperature (RT).
d. Add 5 mL of QS and incubate for 30 min at RT.
e. Wash five times with 5 mL of DPBS, incubating for 10 min each.
Pause point: Fixed embryos can be stored at 4 °C for up to 1 week.
4. De-chorionation:
Note: From this point onward, handle embryos with glass Pasteur pipettes to prevent adhesion to plastic surfaces.
a. Transfer the zebrafish eggs to a glass Petri dish.
b. Under a stereomicroscope, create a small opening in the chorion with watchmaker forceps and carefully remove it without damaging the embryo [18].
5. Permeabilization:
a. Transfer the zebrafish embryos stepwise from DPBS into methanol using 25% methanol content increases every five minutes until 100% methanol. Perform this dehydration step on ice or at 4 °C:
i. Incubate for 5 min with 25% methanol/75% DPBS.
ii. Incubate for 5 min with 50% methanol/50% DPBS.
iii. Incubate for 5 min with 75% methanol/25% DPBS.
iv. Incubate for 5 min with 100% methanol.
b. Once in 100% methanol, perform another replacement with 100% methanol.
c. Incubate the zebrafish embryos in methanol for at least 2 h at -20 °C, ideally overnight.
Pause point: Embryos can be stored at -20 °C for up to 6 months.
d. Rehydrate the required number of embryos on ice or at 4 °C:
i. Incubate for 5 min with 25% PBS-T/75% methanol.
ii. Incubate for 5 min with 50% PBS-T/50% methanol.
iii. Incubate for 5 min with 75% PBS-T/25% methanol.
iv. Incubate for 5 min with 100% PBS-T.
e. Wash one additional time using PBS-T.
6. Yolk removal:
a. Transfer the rehydrated embryos to a glass vial and gently pipette up and down with a glass Pasteur pipette until the yolk separates from the animal caps due to mechanical shearing and sinks.
b. Transfer the animal caps to fresh glass vials containing PBS-T, leaving the dissociated yolk behind.
Note: All subsequent steps use the isolated animal caps, hereafter referred to as zebrafish embryos.
B. Plate preparation and sample mounting
Note: This section describes mounting the samples prepared in Section A (Figure 2A). The procedure is written for one well containing multiple samples, but can be scaled to additional wells for higher throughput. This approach has also been validated for other samples, including mouse embryos and tissues (see General notes).
1. Prepare the plate coating solution freshly (see Recipes).
2. Add 50 μL of coating solution to each well of a flat-bottom 96-well imaging plate and incubate for 2 h at RT.
Critical: Ensure that the coating solution covers the entire well bottom.
Note: Plates with coverslip-type glass or thin plastic bottoms are compatible. Use central wells to ensure that the objective can reach the samples, considering its working distance and the plate rim.
3. Aspirate the remaining solution and allow the plate to dry for 2 h at RT.
4. Add 100 μL of DPBS to each coated well.
5. Carefully transfer the samples prepared in Section A into the well (Figure 2B).
Note: Up to eight zebrafish embryos at 2.5–5 hpf can be placed in each well. In DPBS, the embryos naturally orient with the animal cap facing the well bottom and objective.
6. Allow the samples to settle for 2 h at RT.
7. Centrifuge the plate at 200× g for 5 min.
8. Crosslink the samples using a UV transillumination device for 1 h (settings: high intensity, 365 nm).
9. Incubate the plate overnight at 4 °C for additional settling before continuing with the 3D-4i protocol.
10. (Optional) To further ensure sample crosslinking to the bottom of the well, perform a low magnification “overview” imaging step of the well using the autofluorescence of the tissue at 488 nm or a DAPI staining step (Figure 2C).
11. If samples detach during imaging or the 3D-4i procedure, refer to the Troubleshooting section.
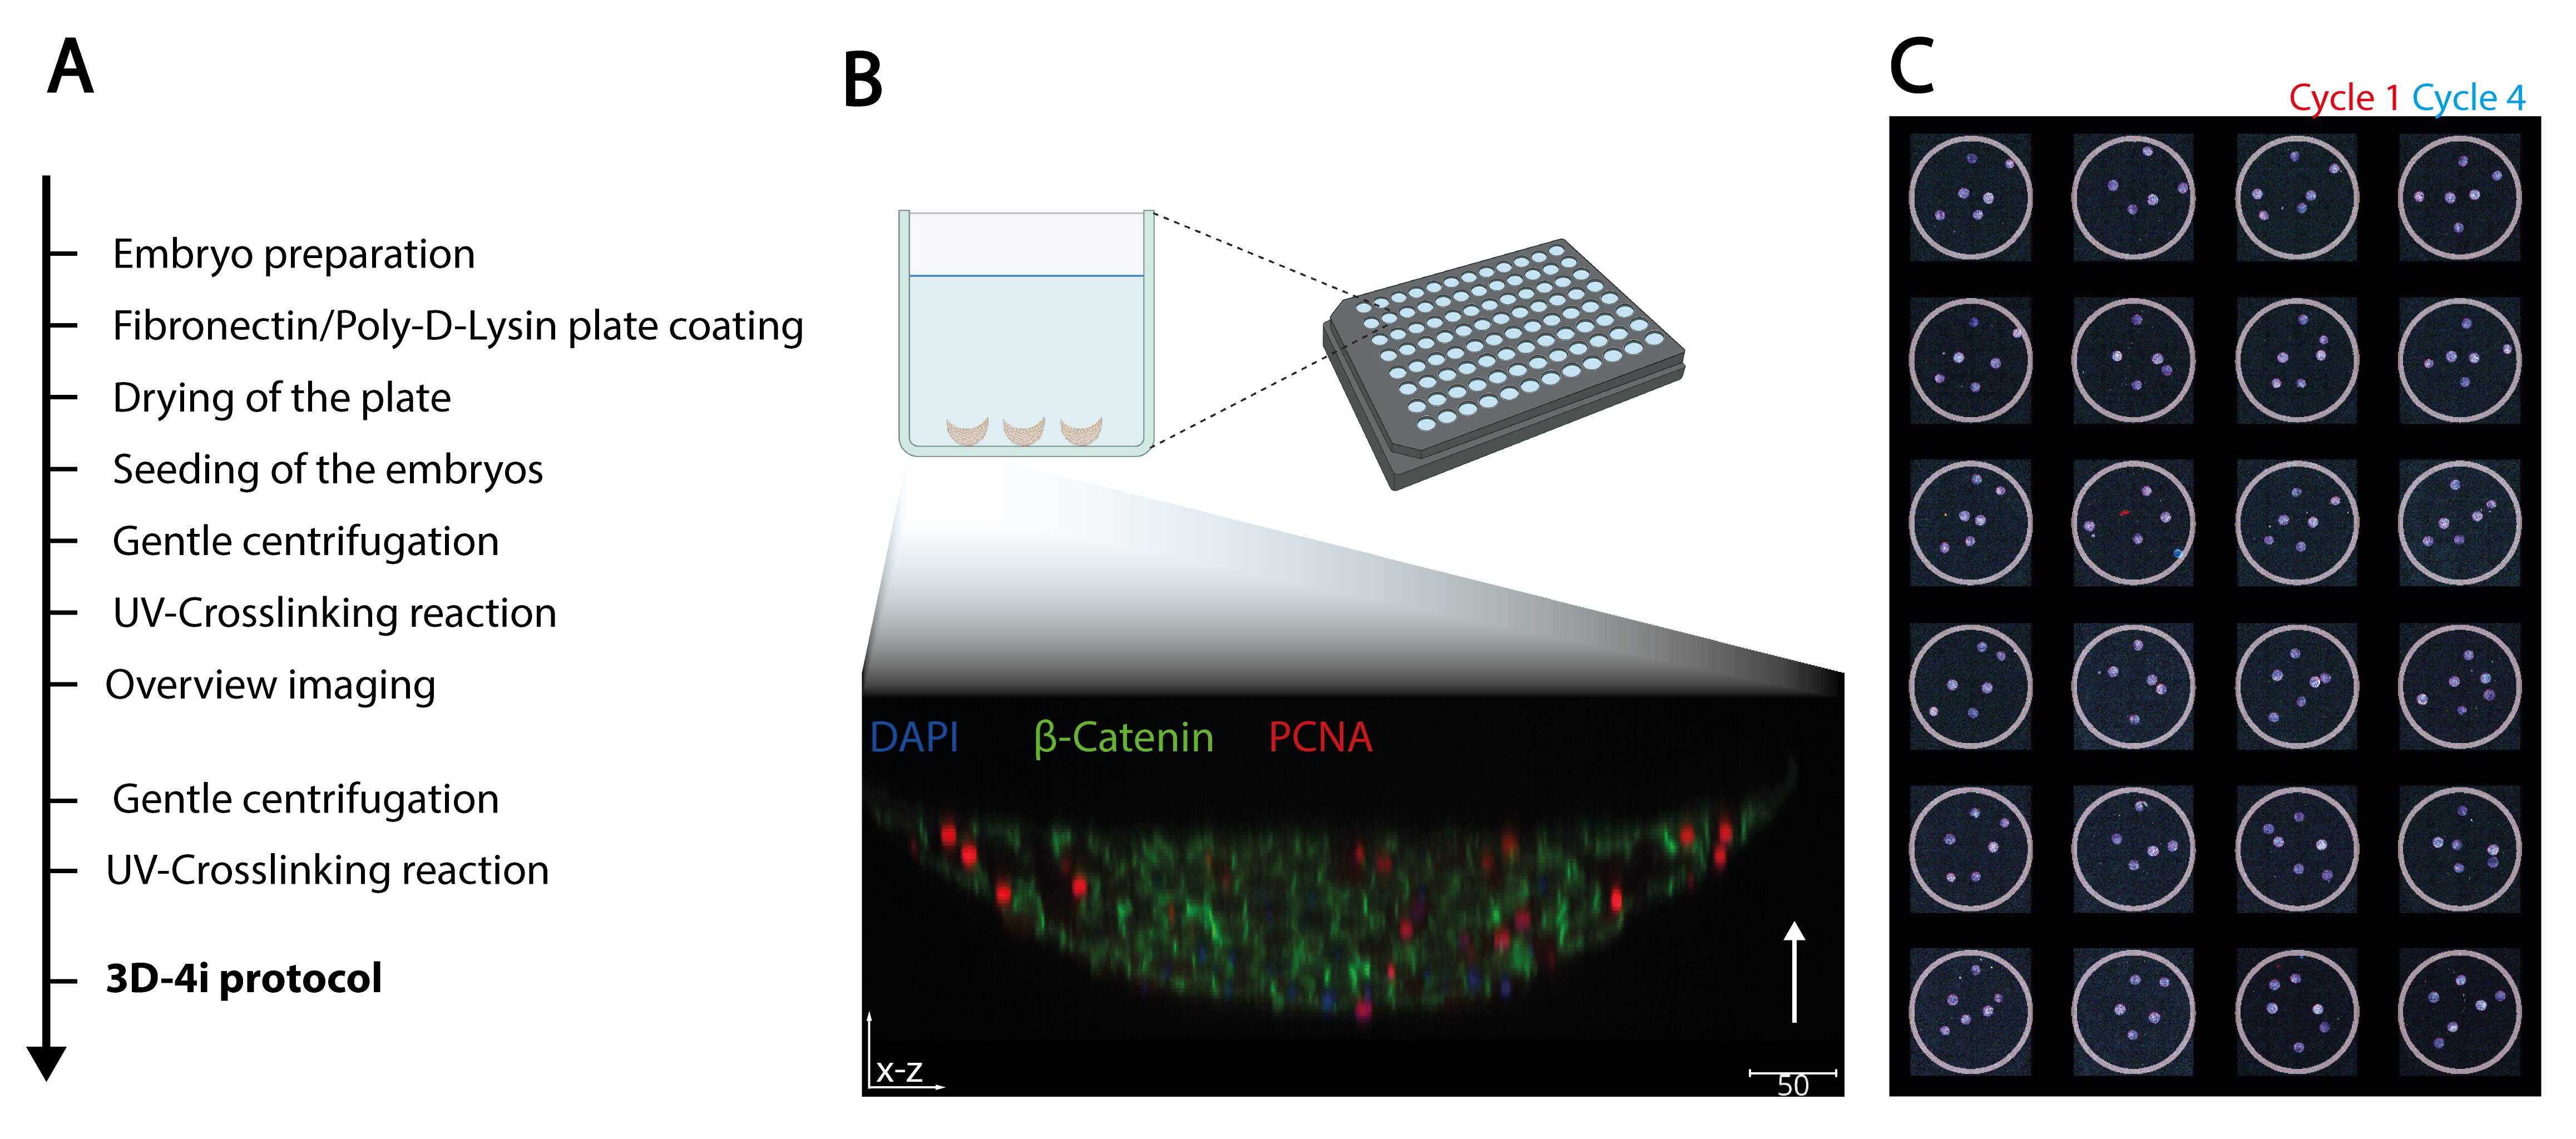
Figure 2. Preparation and plate mounting of zebrafish embryos. (A) Sample and plate preparation steps for mounting before performing the 3D-4i multiplexing protocol. (B) Visualization of the zebrafish embryos mounted inside the imaging plate well. Example fluorescence image in side view (x–z) acquired with a spinning disk confocal microscope and 1 μm z-step size (arrow depicts imaging direction from objective). Scale bar: 50 μm. (C) Example overview of a 96-well imaging plate with 5–6 zebrafish embryos mounted each in 24 individual wells. DAPI signal with color corresponding to cycle 1 (red) and 4 (blue) of the 3D-4i multiplexing protocol. Total number of embryos is 138; the number of detached embryos during a four-cycle 3D-4i protocol is 1 (second column from the left, third row from the top).
C. 3D in toto iterative immunofluorescence imaging on whole-mount samples (3D-4i)
Note: This section contains an adjusted version of the original 4i method from Kramer et al. (2023) that is compatible with whole-mount samples. We recommend that the user also take a look at the first edition of the 4i protocol [6,7]. An example experimental planning of the 3D-4i protocol is provided in Table 1.
Critical: Protect the sample from light at all times (see General notes).
Critical: To prevent drying, always retain approximately 70 μL of liquid in each well. Prepare blocking buffers and antibody solutions at 2× concentration and add them 1:1 to the residual volume to achieve 1×.
Critical: Plan the controls to be included: Per experiment, prepare one extra well for elution controls (see Supplementary Section C, step 2, Control well C and Figure S3). In this well, the epitopes of the previous cycle are re-stained in the current cycle using only the secondary antibodies. The resulting signal provides an estimate of residual fluorescence carried over from the preceding cycle.
See Figure 3A for a graphical representation of the cycling protocol.
Table 1. Example planning of primary and their corresponding secondary antibodies used in the multiplexing experiment that is displayed in Figure 3 (adapted from Hess et al. [10]).
| Staining cycle | Primary antibody (host species) | Stain type | Secondary antibody | Fluorescence channel |
| 1 | DAPI | 405 | ||
| 1 | Pol-II-S2p (rat) | Indirect | Donkey anti-rat | 488 |
| 1 | Anti-FLAG (mouse) | Indirect | Donkey anti-mouse | 568 |
| 1 | PCNA (rabbit) | Indirect | Donkey anti-rabbit | 647 |
| 2 | DAPI | 405 | ||
| 2 | H3K27ac (rabbit) | Direct/1-step | Zenon rabbit | 488 |
| 2 | β-Catenin (mouse) | Indirect | Donkey anti-mouse | 568 |
| 2 | pH3 (rabbit) | Direct/1-step | Zenon rabbit | 647 |
| 3 | DAPI | 405 | ||
| 3 | H2B (rabbit) | Direct/1-step | Zenon rabbit | 488 |
| 3 | ALYREF (mouse) | Direct/1-step | Zenon mouse | 555 |
| 3 | Pol-II-S5p (rat) | Indirect | Donkey anti-rat | 647 |
| 4 | DAPI | 405 | ||
| 4 | Nanog | Direct/1-step | Zenon rabbit | 488 |
| 4 | Free | Indirect | Free | 568 |
| 4 | Free | Indirect | Free | 647 |
1. Antibody elution
Note: Perform a pre-elution before the first staining cycle to minimize sample shrinkage or expansion between cycles and facilitate antigen retrieval.
Critical: Optimize the elution time for each sample type and developmental stage. Insufficient elution causes signal retention, whereas excessive elution may damage the tissue or reduce antigenicity.
a. Prepare a fresh, ready-to-use 4i-EB solution and adjust the pH to 2.5 using a pH test strip.
b. Make sure there is approximately 70 μL of DPBS inside the wells.
c. Add 70 μL of 4i-EB to each well. Gently mix and remove 70 μL.
d. Repeat four times to completely replace DPBS.
e. Incubate for 1 h at RT.
f. Remove 70 μL and add 70 μL of DPBS to wash the 4i-EB away.
g. Repeat 12 times to ensure complete volume replacement. Confirm that the final wash has returned the pH to approximately 7.0.
2. Blocking
a. Prepare 2× sBB and add maleimide just before use.
Note: Maleimide is required to reduce crosslinking and autofluorescence by reacting with reduced cysteine residues in proteins. Not adding it fresh will reduce its efficiency.
b. Add 70 μL of 2× sBB to the residual 70 μL of DPBS in each well.
c. Incubate the plate for 1 h at RT. Prepare the primary antibody solutions during this incubation.
d. Remove 70 μL and add 70 μL of DPBS to wash away the sBB containing maleimide.
e. Repeat 12 times to ensure complete volume replacement.
3. Primary antibody staining
a. Prepare 2× cBB.
b. Prepare at least 70 μL of primary antibody mixture per well in 2× cBB. Use previously optimized dilutions or the manufacturer's recommendations for immunohistochemistry/immunofluorescence.
c. Remove 70 μL and add 70 μL of primary antibody mixture per well to achieve 1× concentration.
d. Incubate overnight at RT.
e. Remove 70 μL and add 70 μL of DPBS to wash.
f. Repeat 12 times to ensure complete volume replacement.
4. Secondary antibody staining
a. Prepare 2× cBB.
b. Prepare at least 70 μL of secondary antibody mixture per well, including nuclear dye, at 2× in 2× cBB.
Note: Select secondary antibodies according to the host species of the primary antibodies and the available fluorescence channels. We recommend combining DAPI (405 nm) with Alexa Fluor–conjugated secondary antibodies detected at 488, 568, and 647 nm. However, other nuclear dyes can be used. Ensure that at least one reference stain is included in every cycle to enable image registration (see Data analysis).
c. Remove 70 μL and add 70 μL of secondary antibody mixture per well to achieve a 1× concentration.
d. Incubate for 4 h at RT in the dark.
e. Remove 70 μL and add 70 μL of DPBS to wash.
f. Repeat 12 times to ensure complete volume replacement.
5. Optical clearing of the sample (RI-matching)
a. Prepare PROTOS imaging buffer in advance and add N-acetyl-cysteine on the day of use.
b. Remove 70 μL and add 70 μL of PROTOS imaging buffer.
c. Repeat four times or until DPBS has been completely replaced.
Note: PROTOS and other RI-matching solutions are viscous and must be pipetted slowly to prevent detachment of the samples due to high shear stress.
d. Incubate the samples for at least 20 min to ensure RI-matching.
6. Imaging
a. Use the positions saved from previous cycles (or the optional overview imaging) to facilitate later alignment of individual staining cycles.
Critical: Use the lowest laser power and exposure time that provide an adequate signal-to-noise ratio and minimize photo-crosslinking.
Note: Select a z-step size appropriate for the required quantitative resolution. For zebrafish embryos at 2.5–5 hpf, we use a 1 μm z-step over a 250 μm z-range with a 20×/1.0 NA water-immersion objective.
7. Subsequent staining cycles
a. Remove 70 μL of PROTOS imaging buffer and add 70 μL of DPBS.
b. Repeat 12 times, until the sample is no longer cleared/transparent and all PROTOS has been removed.
c. Pause point: Once the sample is back in DPBS, the protocol can be paused, and the plate stored at 4 °C. Seal the plate to make sure the residual DPBS does not evaporate, and the samples do not dry out.
Note: We recommend continuing as soon as possible (within a few days), as sample integrity may decrease, and samples may detach with an increased number of days and cycles into the protocol.
d. The samples are now ready to start the next staining cycle, beginning with the antibody elution step described in step C1.
e. Repeat the cyclic protocol until all desired epitopes within the same sample have been imaged (see Figure 3B for example images from four consecutive staining cycles with three epitopes stained in each).
Note: The achievable number of cycles depends on the sample, epitopes, and experimental conditions. We have successfully performed four cycles (10-plex) in zebrafish embryos; additional cycles require monitoring sample integrity (see General notes).
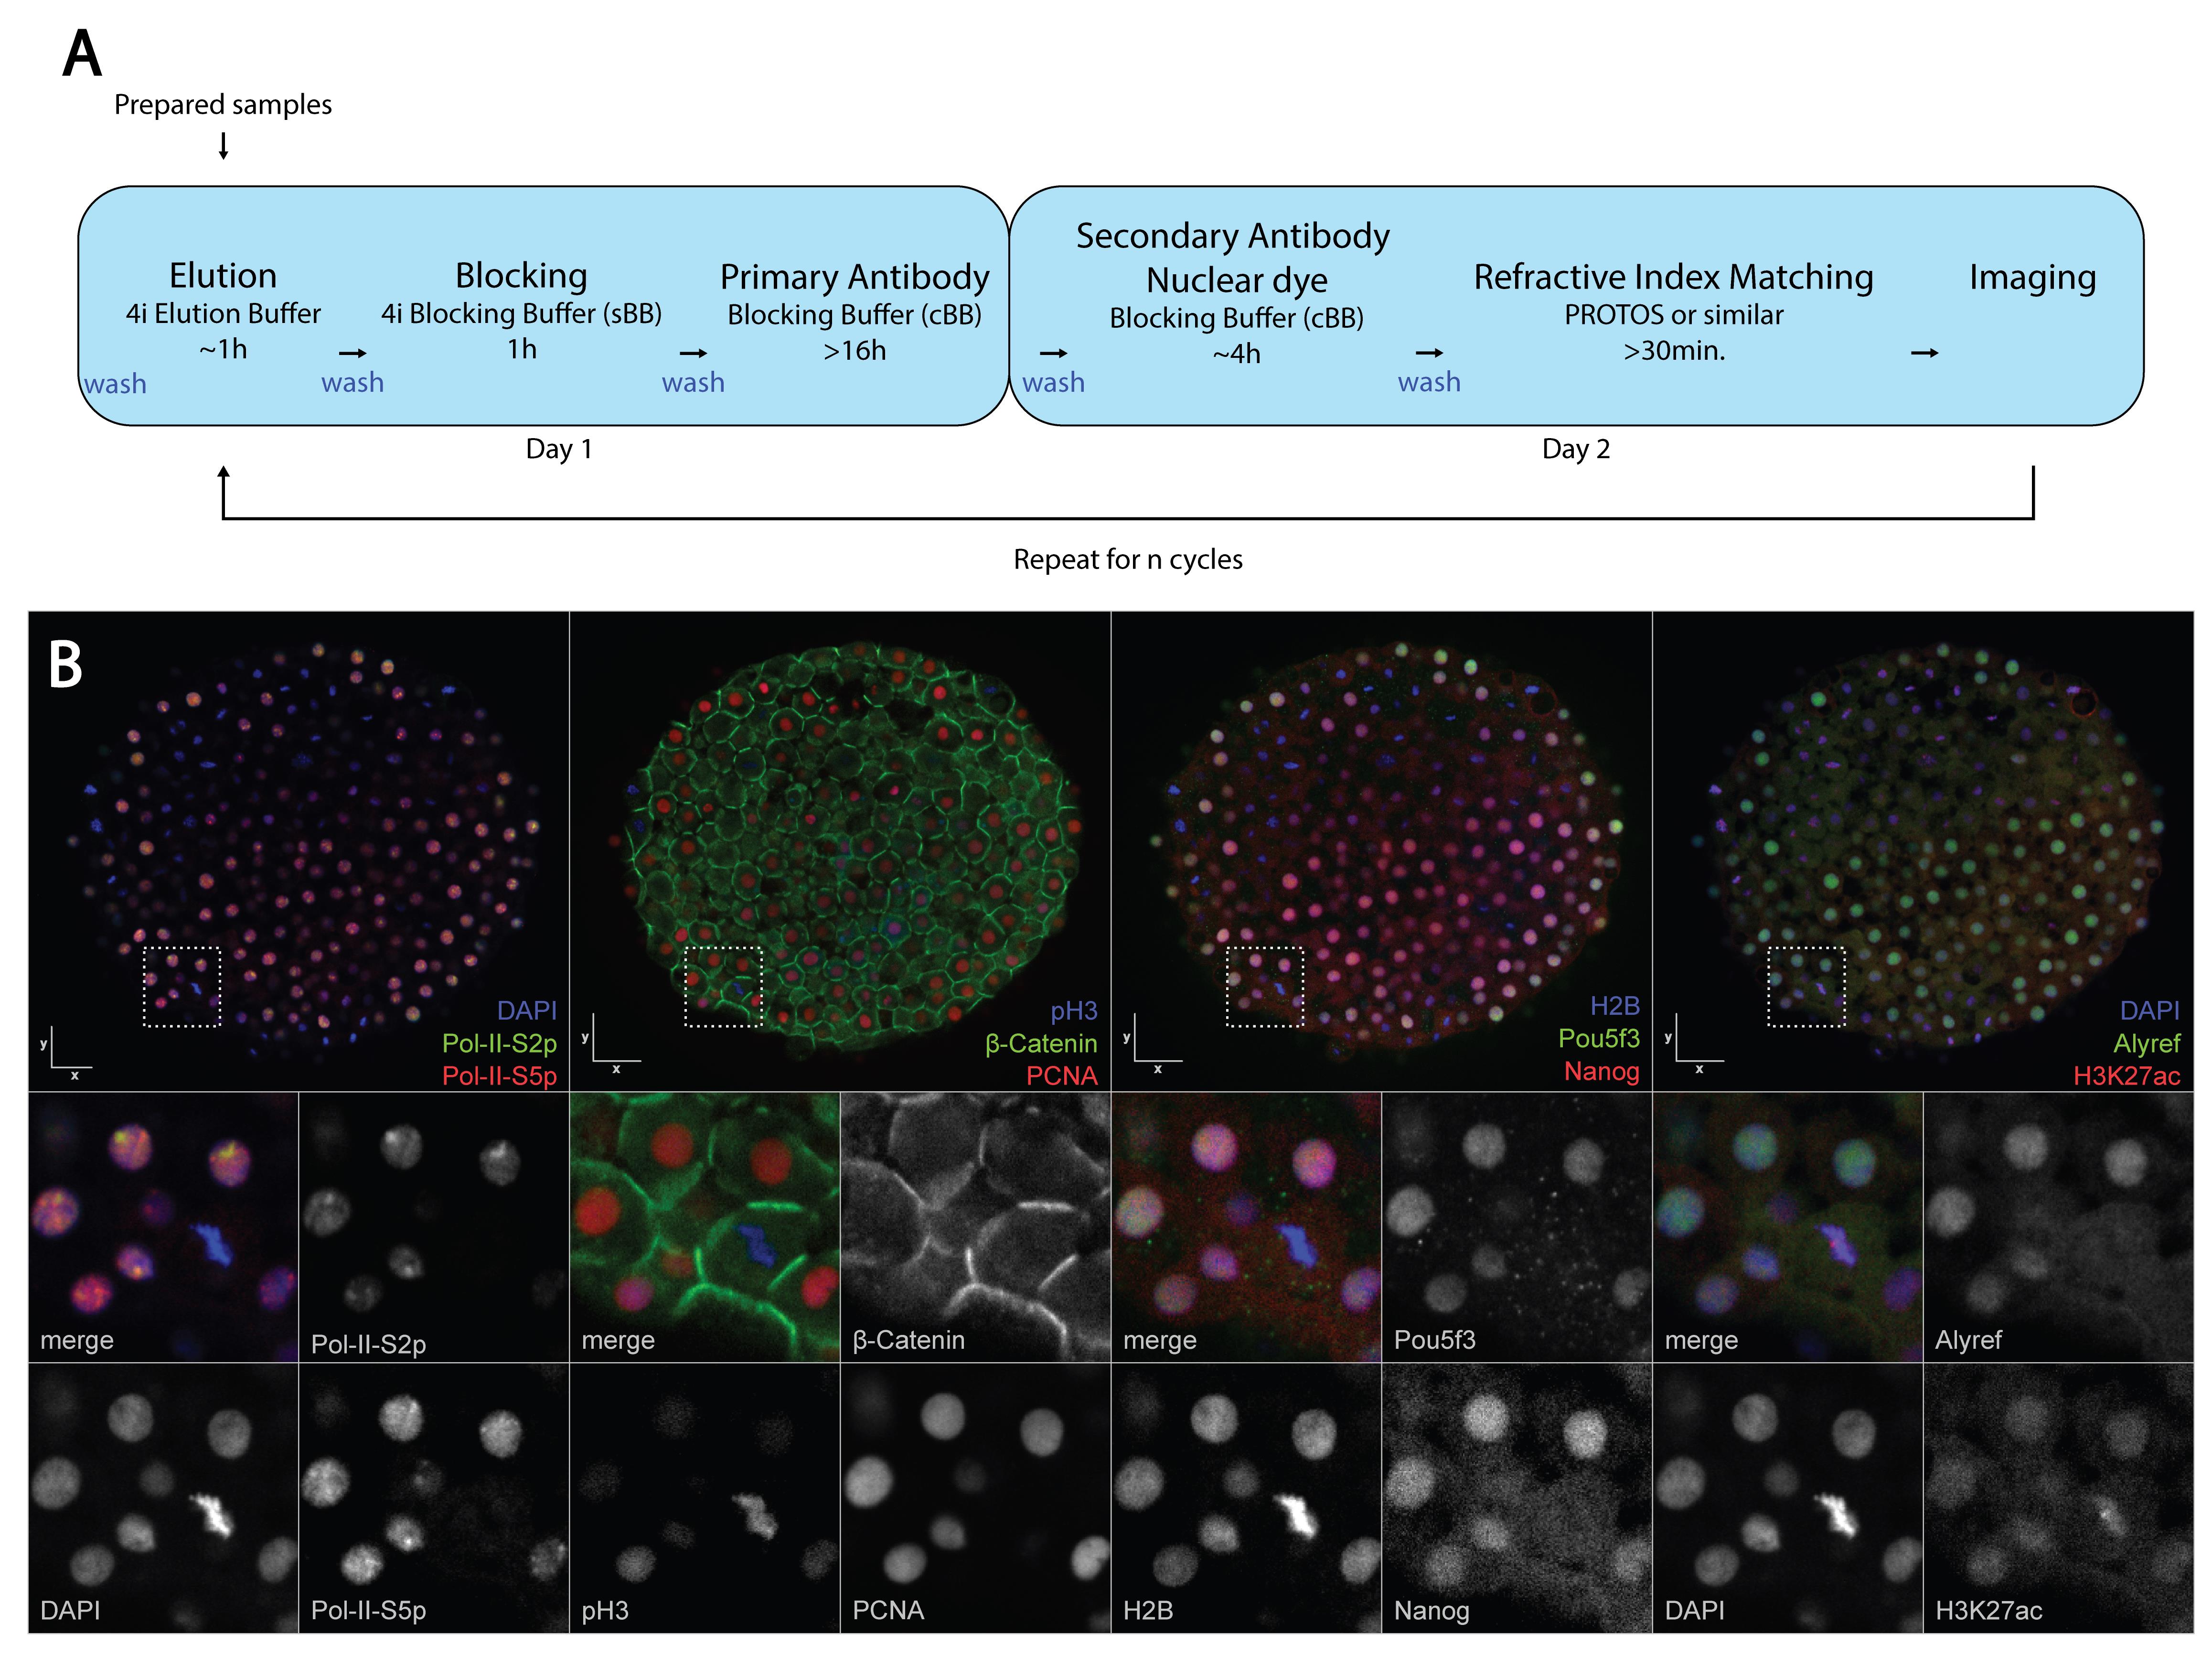
Figure 3. Workflow and multiplexed images obtained by performing 3D-4i. (A) Workflow depicting a standard 3D-4i cycle. (B) Zebrafish embryo animal cap stained in four consecutive cycles of 3D-4i, resulting in a 10-plex experiment. A representative center z-slice is shown after registering and aligning all cycles into one z-stack. The same z-position and zoom are provided for all four cycles (dashed lines mark the ROI). Table 1 shows the antibody and fluorescence channel plan for this experiment. Panel B is adapted from Hess et al. [10]. x, y scale bars, 50 μm.
Data analysis
Note: The following data analysis steps are not required to run the protocol; however, they greatly help with the antibody panel design (using FIJI) and allow the user to make quantitative measurements of the stained epitopes in the sample at the single-cell resolution (using available codes in the provided GitHub repositories). The advanced pipeline requires coding skills in Python, ideally supported by a dedicated workstation for image analysis (with sufficient RAM and GPU power for loading images into memory and post-processing steps).
1. Basic analysis for antibody panel design (FIJI)
This step is intended to check the antibody compatibility with the sample and the 3D-4i protocol, as well as to inspect staining bias or signal attenuation in the z direction. The resulting images confirm the settings required for the 3D-4i multiplexing protocol.
a. Embryo segmentation:
i. Open image stack in FIJI.
ii. Split fluorescence channels.
iii. Generate maximum-intensity projection.
iv. Define embryo region of interest.
v. Exclude debris and imaging artifacts.
vi. Save embryo ROI in ROI Manager.
b. Intensity measurements:
i. Select measurement parameters.
ii. Measure antibody signal inside embryo ROI.
iii. Define background ROI outside the embryo.
iv. Measure background intensity.
v. Calculate background-corrected intensity.
vi. Calculate signal-to-background ratio.
vii. Compare staining across embryos and conditions. This step is shown in Figure 4B.
c. Elution control:
i. Open antibody-stained image.
ii. Open post-elution secondary-only image.
iii. Use the identical embryo ROI.
iv. Measure residual post-elution signal.
v. Compare residual signal to true antibody signal. See Figure S3 for example images.
vi. Exclude antibodies with a strong remaining specific signal.
Note: The signal intensity present after elution should be close to the background signal observed from using secondary antibodies only. This value is dependent on the microscope and camera setup.
d. Intensity bias corrections:
i. Inspect surface-to-center staining patterns. See Figure S2 for example images.
ii. Draw line profiles from the embryo edge to the center.
iii. Plot intensity profiles.
iv. Compare profiles across embryos.
v. Optimize antibodies showing staining bias before panel inclusion. Refer to Supplementary Section D.
vi. Exclude strongly biased antibodies from quantitative analysis.
Note: If the signal is not expected to vary biologically across the sample, verify that staining reaches the tissue center. If penetration is incomplete, test a lower antibody concentration or a 1-step staining approach. Refer to Supplementary Section D.
e. Signal attenuation correction:
i. Inspect signal intensity across z-planes.
ii. Plot z-axis intensity profiles.
iii. Use a nuclear or broadly distributed signal as a reference.
iv. Estimate depth-dependent attenuation.
v. Apply correction only when attenuation is reproducible.
vi. Retain raw images for quality control.
2. Advanced image analysis pipeline to generate a 3D-4i multiplexed dataset
This workflow is intended to generate combined image stacks containing aligned image z-stacks and then perform quantitative analysis with single-cell resolution. It generates embryo-level, cell-level, and subcellular measurements from registered volumetric images. It describes the workflow used in [10].
a. File conversion:
i. Convert raw microscope files.
ii. Preserve acquisition metadata.
iii. Generate multiscale image pyramids.
iv. Store channels, cycles, and positions consistently.
b. Image correction using BaSiC Fiji plugin [19]:
i. Apply flatfield correction.
ii. Correct camera background.
iii. Check signal saturation.
iv. Correct channel shifts.
v. Save correction parameters.
c. Registration using elastix library [20]:
i. Select the nuclear channel as the reference.
Note: To align cycles, one channel must be consistently showing the same signal. We recommend using the same nuclear dye in the 405 nm channel across cycles.
ii. Register cycles to the reference cycle (e.g., cycle 1).
iii. Correct cycle-to-cycle displacement.
iv. Inspect nuclear-channel overlays.
v. Exclude poorly registered embryos/nuclei.
d. Combination of files across cycles using OME-Zarr [21]:
i. Combine registered channels.
ii. Assign antibody names to channels.
iii. Link channels to cycle metadata.
iv. Store multiplexed embryo image.
v. Retain registration transforms.
e. Embryo segmentation in Ilastik [22]:
i. Segment embryo volume.
ii. Separate the sample from the background.
iii. Remove detached fragments.
iv. Inspect the embryo mask in 3D.
f. Nuclei segmentation with Cellpose [23]:
i. Segment nuclei from the nuclear channel.
ii. Optimize segmentation parameters.
iii. Remove merged or fragmented nuclei.
iv. Exclude boundary objects.
v. Save nuclear masks.
g. Cell segmentation:
i. Use nuclei as segmentation seeds.
ii. Use a membrane signal, if available.
iii. Generate cell masks by watershed expansion.
iv. Inspect cell boundaries.
v. Save cell masks.
h. Feature aggregation and extraction:
i. Measure nuclear, cellular, and cytoplasmic intensity features.
ii. Extract morphology, texture, spatial position, and neighborhood features.
iii. Combine all measurements into a single-cell feature table.
iv. Add embryo, well, plate, antibody, and cycle metadata.
v. Add quality-control labels.
vi. Export the final feature table.
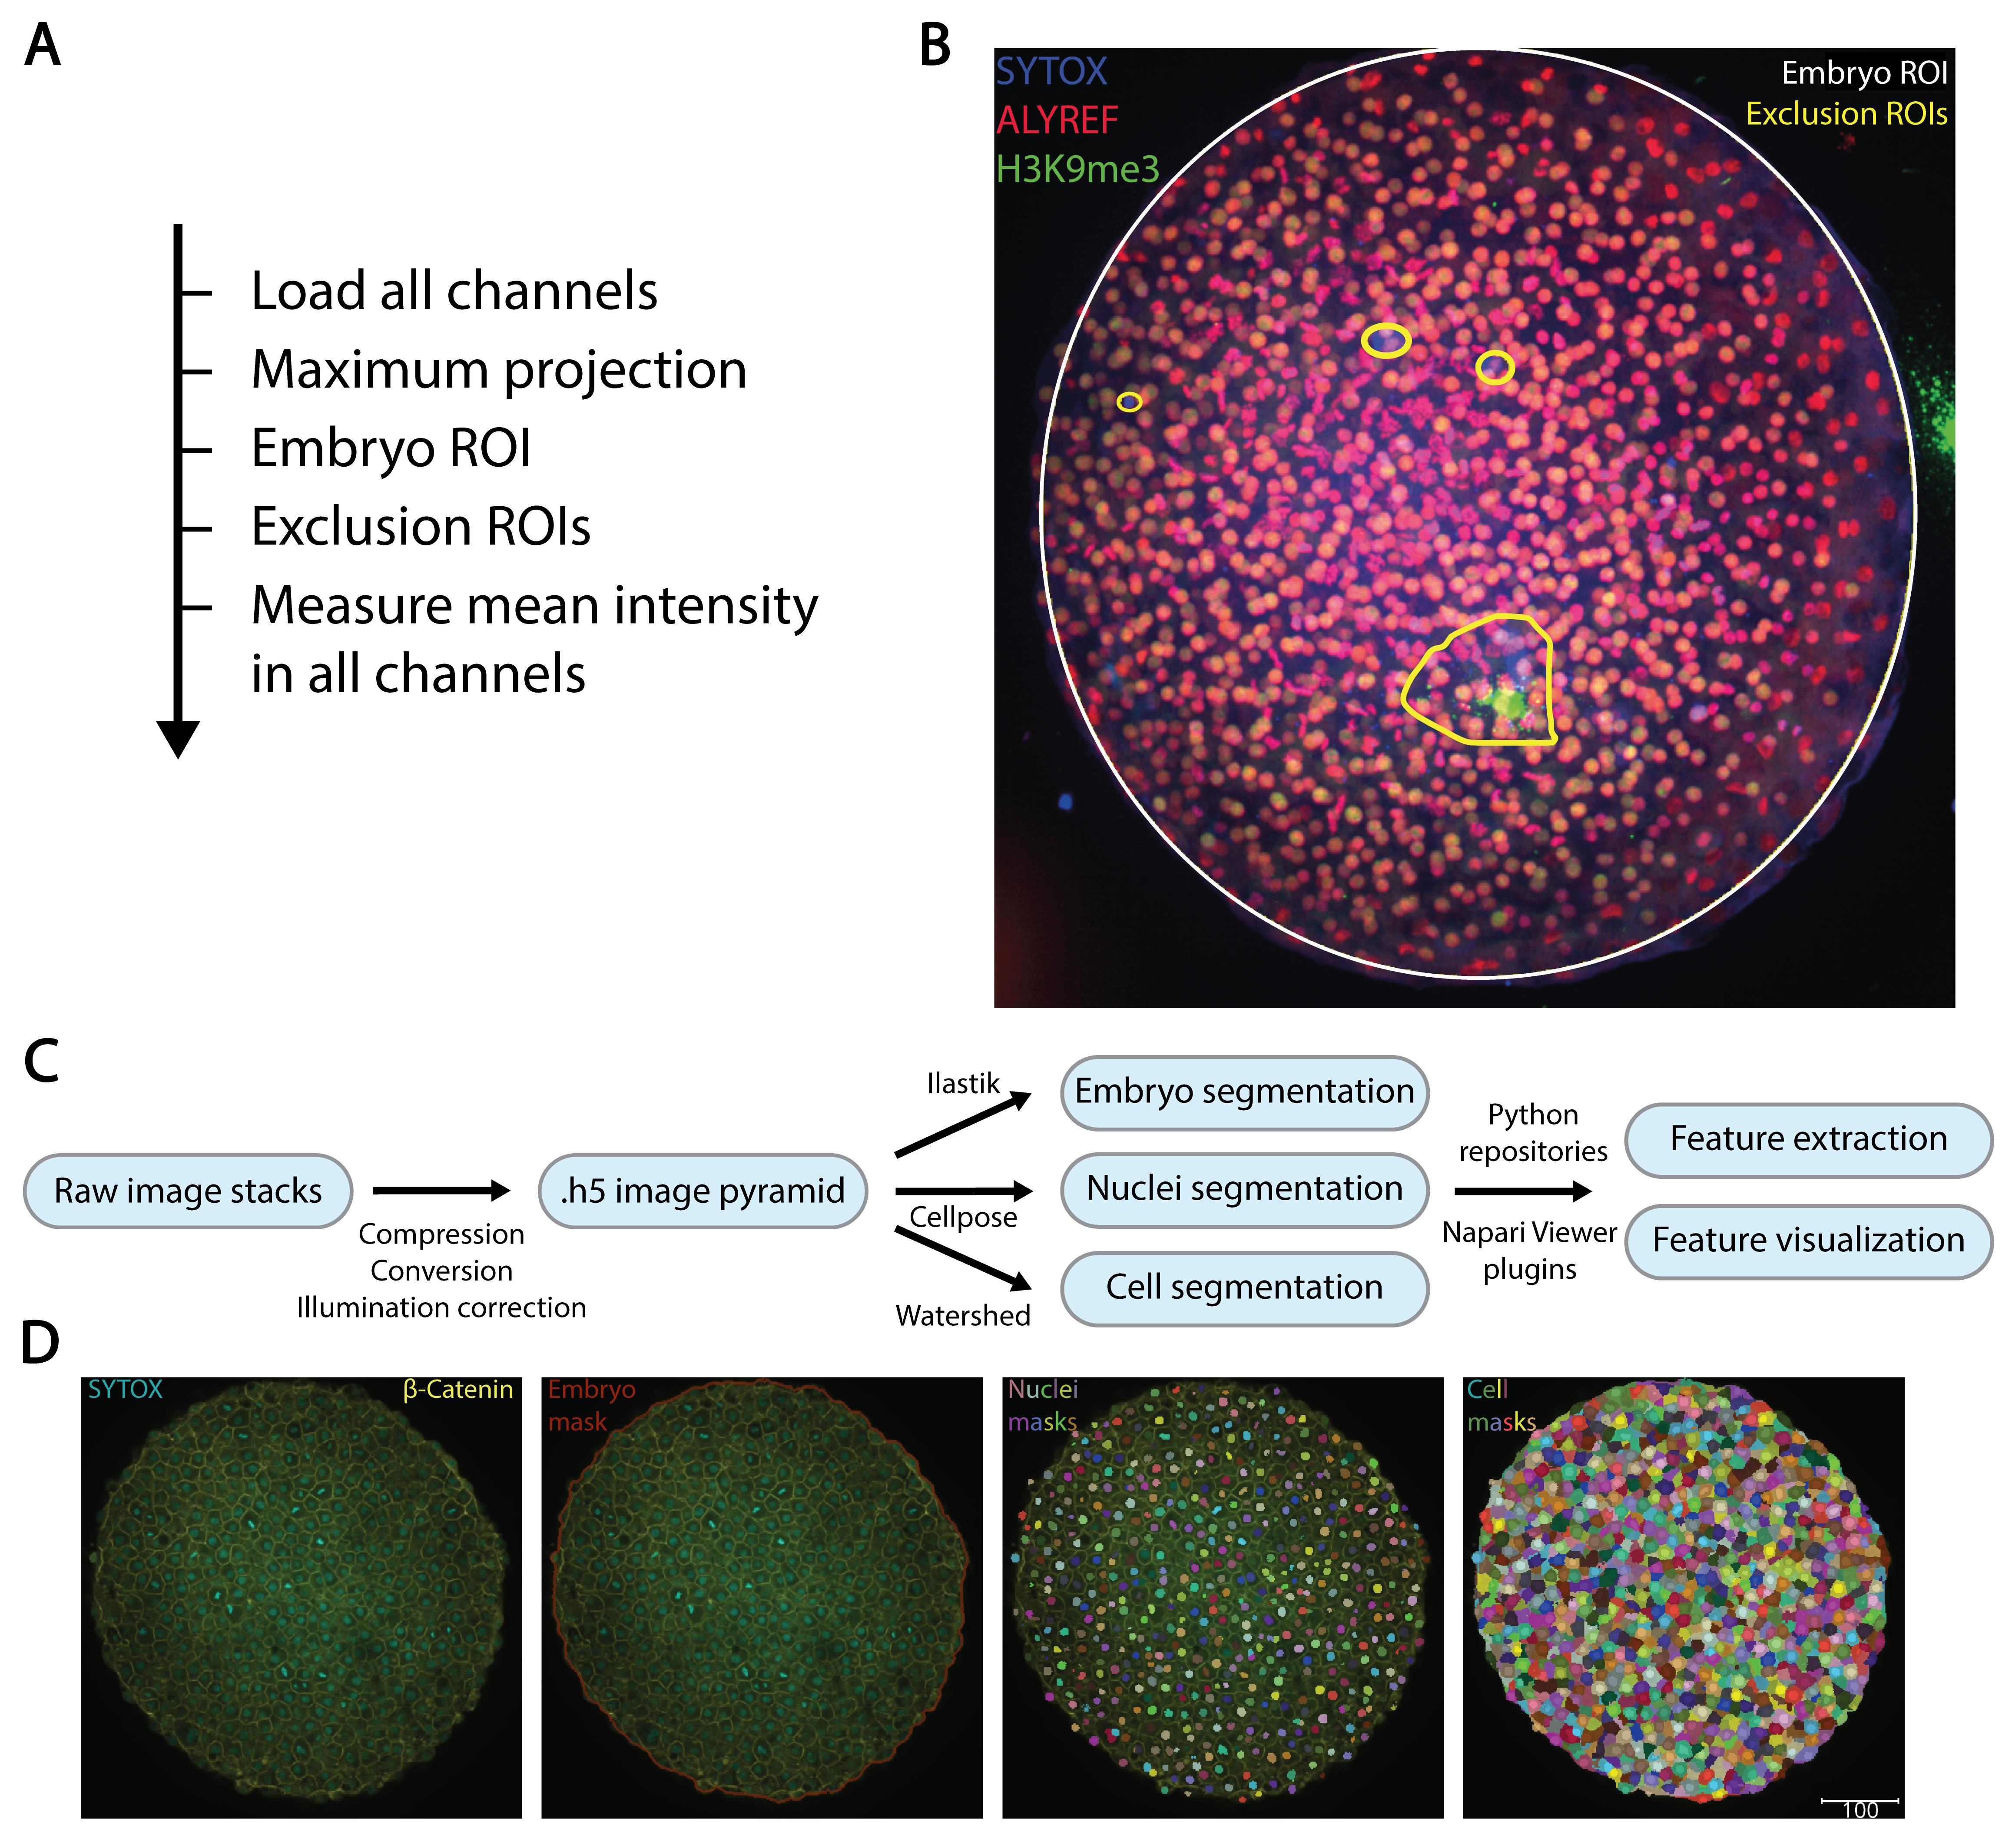
Figure 4. Data analysis: simple and extended workflows. (A) Simple FIJI workflow for manual ROI drawing, exclusion of unspecific fluorescence spots, and measurement of mean intensity in each channel. (B) Example image opened in FIJI, max projected for the two immunofluorescence stainings of ALYREF and H3K9me3 and SYTOX nuclear marker. Manual embryo ROI (white) and exclusion ROIs (yellow) are visible. (C) Extended analysis workflow, used in [10], for generating corrected z-stacks across cycles and performing segmentation and feature extraction. (D) Example image from the segmentation pipeline showing nuclear staining (SYTOX) and membrane staining (β-Catenin) for nuclei and cell outline segmentation. Embryo segmentation mask. Segmented nuclei masks. Segmented cell masks. Scale bar, 100 μm.
Validation of protocol
1. Replicates and control information for data exclusively used in this protocol
Elution controls (Figure S3):
Replicate = 1 experiment, n = 3 embryos per antibody per control (A/B)
Controls: Secondary antibody staining without primaries to estimate background from unspecific binding.
Antibody testing (Figure S1):
Replicate = 1 experiment, n = 5 embryos per antibody
Controls: Used different timepoints to check for differences in expression patterns/intensities.
Staining bias evaluation (Figure S4):
Replicate = 1 experiment, n = 6 embryos per Fab fragment or antibody condition.
Control: The endogenously expressed H2A-mCherry signal that was compared to the stained signal.
2. Validation of the data
This protocol has been used and validated in the following research article:
• Hess et al. [10]. Multiplexed embryo profiling links cellular state to zygotic genome activation in single cells. Nat Commun. https://doi.org/10.1038/s41467-026-77784-7 (Figures 1 and 2).
The 3D-4i protocol is an optimized version of the base 4i protocol, which was used and validated in the following research article and is also available as a Bio-protocol paper:
• Gut et al. [5]. Multiplexed protein maps link subcellular organization to cellular states. Science, 361 (6401). https://doi.org/10.1126/science.aar7042 (Figures 1 and 2).
• Kramer et al. [6]. Iterative Indirect Immunofluorescence Imaging (4i) on Adherent Cells and Tissue Sections. Bio-protocol, 13 (13). https://doi.org/10.21769/BioProtoc.4712
General notes and troubleshooting
General notes
Note: All remarks from the original 4i framework [6] also apply to the advanced 3D-4i protocol presented here. We encourage readers to take a look at the original publication. General notes and remarks for a successful implementation are summarized and expanded here.
1. Perform all incubations and washes at either 4 °C or RT, on an orbital shaker.
2. Although all steps can be performed by careful manual pipetting, automated liquid handling, using slow pipetting speeds, is strongly recommended to maximize sample retention over multiple imaging cycles (see Supplementary Section E and Figure S5).
3. Protect the sample plate from light to minimize photo-crosslinking and background accumulation, particularly when samples are outside the imaging buffer containing radical scavengers. Use a dark plate cover, perform incubations under a dark box, and switch off external lights during imaging.
4. Successful 3D-4i requires balancing efficient antibody elution with preservation of antigenicity and sample integrity. The elution steps must be strong enough to remove fluorescence without compromising subsequent staining cycles. A strategy for antibody testing and panel design is provided in Supplementary Section C.
5. Antibodies are generally compatible with the 3D-4i protocol (please refer to Supplementary Section B) if they work in whole-mount immunofluorescence for the selected sample type. High-affinity antibodies may result in staining bias that can be mitigated through direct/1-step immunofluorescence (see Troubleshooting and Supplementary Section D). To test antibody compatibility, see Supplementary Section C, step 1. A large selection of antibodies has been tested on zebrafish embryos and is provided in Table S1.
6. Optimize not only the antibody panel but also the staining order. Low-abundance epitopes, such as phosphorylated proteins and transcription factors, may be lost over repeated cycles but generally elute efficiently. Highly abundant targets, such as cytoskeletal proteins, are more persistent but may be harder to elute. Therefore, stain low-abundance or high-priority targets in early cycles and abundant targets later. Relevant controls are described in Supplementary Section C, step 2.
7. Although extensively validated in zebrafish embryos, the method can be adapted to other tissues, small organisms, and embryos. Plate mounting is broadly applicable, but sample preparation, elution duration, and immunofluorescence incubation times must be optimized for each system.
8. We routinely perform four 3D-4i cycles with consistent quality. Beyond four cycles, sample degradation and loss of antigenicity may increase. Additional cycles may be feasible depending on the sample type and experimental conditions.
Troubleshooting
Problem 1: Detachment of the plate-mounted zebrafish embryos.
Possible causes: Incomplete plate coating or excessive shear stress during pipetting.
Solution: Ensure that the adhesive coating solution covers the entire well bottom. Pipette slowly and carefully, particularly during washes. If available, use automated liquid handling with reduced pipetting speeds. Some detachment is expected, but over 90% of samples should stay in place after mounting and pre-elution.
Problem 2: Residual fluorescence from the preceding cycle.
Possible causes: Incomplete elution, highly abundant epitope, photo-crosslinking, or a combination of these factors.
Solution: Test different antibody dilutions and assess elution efficiency. Stain low-abundance targets in early cycles and highly abundant targets in later cycles to prevent signal carryover and epitope masking. Protect samples from light throughout the protocol. If the signal persists after optimization, test an alternative antibody or use the antibody only in the final cycle.
Problem 3: Loss of low-abundance epitopes over repeated cycles.
Possible cause: Low-abundant proteins and protein modifications are sensitive to low pH and high salt concentrations in the 4i-EB.
Solution: Stain these targets during early cycles. Evaluate their stability using the three elution controls described in Supplementary Section C, Step 2.
Problem 4: Signal attenuation in z-direction.
Possible causes: Incomplete RI matching, residual DPBS, insufficient clearing time, or sample- and microscope-dependent light attenuation.
Solution: Ensure that DPBS is completely replaced by RI-matching medium and allow sufficient time for optical clearing. If attenuation persists, correct during post-processing using wavelength-dependent attenuation correction (see Data analysis, Advanced pipeline). Attenuation generally increases with sample size and imaging depth.
Problem 5: Stronger staining at the sample periphery.
Possible causes: Limited antibody penetration, over-fixation, or antibody-binding kinetics, particularly for highly abundant epitopes.
Solution: Avoid over-fixation and extend primary and secondary antibody incubations to permit diffusion throughout the tissue. Peripheral staining bias may also be reduced using 1-step immunofluorescence with Fab fragment- or nanobody-conjugated primary antibodies (see Supplementary Section D, Figure S4).
Supplementary information
The following supporting information can be downloaded here:
1. Contents:
A. General immunofluorescence protocol (for antibody testing)
B. List of tested antibody compatibilities with ZF embryos
C. Antibody validation and elution controls
D. Mitigation of staining bias using Fab fragments
E. (Optional) Liquid handling platform
2. Table S1. supp_table_ZF_working_antibodies.xlsx
3. Table S2. Pipetting settings to operate protocols on the BRAVO automated liquid handling platform.
4. Table S3. Protocols for automated liquid handling.
5. Figure S1. Example immunofluorescence images in ZF embryos.
6. Figure S2. Staining bias mitigation using directly coupled primary antibodies.
7. Figure S3. Antibody compatibility evaluation and elution controls.
8. Figure S4. Evaluation of staining bias mitigation using Fab fragment 1-step immunofluorescence.
9. Figure S5. Automated liquid handling platform enables high-throughput 3D-4i multiplexing.
Acknowledgments
S.S. was supported by postdoctoral fellowships from EMBO (ALTF 851-2022) and the SNSF (TMPFP3_217219), as well as an SNSF Ambizione grant (PZ00P3_216331). L.P. was supported by the SNSF (grant 310030_192622), the European Research Council Advanced Grant CROSSINGSCALES (885579), and the University of Zurich.
The protocol was originally described and validated in Hess et al. [10], https://doi.org/10.1038/s41467-026-77784-7, from which some figure parts were re-used and adjusted, namely: Graphical overview, third panel (Figure 1C from the original publication); Figure 3B (Figure 1D from the original publication); and Figure S5C (Figure 1B from the original publication).
We thank members of the Pelkmans and Gilmour groups, as well as the Center for Microscopy and Image Analysis, for helpful discussions. Parts of the Graphical abstract and Figure 2 were created in BioRender: Wyss, M. (2026), https://BioRender.com/dwnmsfx, https://BioRender.com/eat8hqq.
Author contributions
M.H., M.F.W., S.S., and L.P. contributed to the research project leading to the method; M.F.W. performed the experiments and method development; M.F.W., S.S., and L.P. wrote the original draft; M.F.W., S.S., and L.P. performed the review and editing; S.S. and L.P. acquired funding; M.H., S.S., and L.P. supervised.
Competing interests
L.P. is an inventor on patents related to the 4i method (patent WO2019207004A1), is a founder and shareholder of Sagimet Biosciences, and holds ownership in and serves on the advisory board of Element Biosciences. The remaining authors declare no competing interests.
Ethical considerations
All animal work was carried out according to the FELASA guidelines and standards of the University of Zurich.
References
- Thul, P. J., Åkesson, L., Wiking, M., Mahdessian, D., Geladaki, A., Ait Blal, H., Alm, T., Asplund, A., Björk, L., Breckels, L. M., et al. (2017). A subcellular map of the human proteome. Science. 356(6340): eaal3321. https://doi.org/10.1126/science.aal3321
- Hickey, J. W., Neumann, E. K., Radtke, A. J., Camarillo, J. M., Beuschel, R. T., Albanese, A., McDonough, E., Hatler, J., Wiblin, A. E., Fisher, J., et al. (2021). Spatial mapping of protein composition and tissue organization: a primer for multiplexed antibody-based imaging. Nat Methods. 19(3): 284–295. https://doi.org/10.1038/s41592-021-01316-y
- Farrell, J. A., Wang, Y., Riesenfeld, S. J., Shekhar, K., Regev, A. and Schier, A. F. (2018). Single-cell reconstruction of developmental trajectories during zebrafish embryogenesis. Science. 360(6392): eaar3131. https://doi.org/10.1126/science.aar3131
- Wagner, D. E., Weinreb, C., Collins, Z. M., Briggs, J. A., Megason, S. G. and Klein, A. M. (2018). Single-cell mapping of gene expression landscapes and lineage in the zebrafish embryo. Science. 360(6392): 981–987. https://doi.org/10.1126/science.aar4362
- Gut, G., Herrmann, M. D. and Pelkmans, L. (2018). Multiplexed protein maps link subcellular organization to cellular states. Science. 361(6401): eaar7042. https://doi.org/10.1126/science.aar7042
- Kramer, B., Castillo, J., Pelkmans, L. and Gut, G. (2023). Iterative Indirect Immunofluorescence Imaging (4i) on Adherent Cells and Tissue Sections. Bio Protoc. 13(13): e4712. https://doi.org/10.21769/bioprotoc.4712
- Kramer, B. A., Sarabia del Castillo, J. and Pelkmans, L. (2022). Multimodal perception links cellular state to decision-making in single cells. Science. 377(6606): 642–648. https://doi.org/10.1126/science.abf4062
- Black, S., Phillips, D., Hickey, J. W., Kennedy-Darling, J., Venkataraaman, V. G., Samusik, N., Goltsev, Y., Schürch, C. M. and Nolan, G. P. (2021). CODEX multiplexed tissue imaging with DNA-conjugated antibodies. Nat Protoc. 16(8): 3802–3835. https://doi.org/10.1038/s41596-021-00556-8
- Saka, S. K., Wang, Y., Kishi, J. Y., Zhu, A., Zeng, Y., Xie, W., Kirli, K., Yapp, C., Cicconet, M., Beliveau, B. J., et al. (2019). Immuno-SABER enables highly multiplexed and amplified protein imaging in tissues. Nat Biotechnol. 37(9): 1080–1090. https://doi.org/10.1038/s41587-019-0207-y
- Hess, M., Wyss, M. F., Wu, E., Schaniel, G. M., Lüthi, J., Rebagliati, C., Hannuschke, D., Vastenhouw, N. L., Gilmour, D., Shamipour, S., et al. (2026). Multiplexed embryo profiling links cellular state to zygotic genome activation in single cells. Nat Commun.: e1038/s41467–026–77784–7. https://doi.org/10.1038/s41467-026-77784-7
- Susaki, E. A., Tainaka, K., Perrin, D., Kishino, F., Tawara, T., Watanabe, T. M., Yokoyama, C., Onoe, H., Eguchi, M., Yamaguchi, S., et al. (2014). Whole-Brain Imaging with Single-Cell Resolution Using Chemical Cocktails and Computational Analysis. Cell. 157(3): 726–739. https://doi.org/10.1016/j.cell.2014.03.042
- Ke, M. T., Fujimoto, S. and Imai, T. (2013). SeeDB: a simple and morphology-preserving optical clearing agent for neuronal circuit reconstruction. Nat Neurosci. 16(8): 1154–1161. https://doi.org/10.1038/nn.3447
- Schindelin, J., Arganda-Carreras, I., Frise, E., Kaynig, V., Longair, M., Pietzsch, T., Preibisch, S., Rueden, C., Saalfeld, S., Schmid, B., et al. (2012). Fiji: an open-source platform for biological-image analysis. Nat Methods. 9(7): 676–682. https://doi.org/10.1038/nmeth.2019
- Hornbachner, R., Shamipour, S., Arslan, F. N., Fan, R., Hess, M., Curvaia, F., Lüthi, J., Oates, A. C., Bedzhov, I., Gilmour, D., et al. (2026). Shield-4i: A Whole-mount Multiplexed Imaging Platform for Studying Multiscale Information Flow in 3D Multicellular Systems. bioRxiv: e735871. https://doi.org/10.64898/2026.07.01.735871
- Shamipour, S., Hofmann, L., Steccari, I., Kardos, R. and Heisenberg, C. P. (2023). Yolk granule fusion and microtubule aster formation regulate cortical granule translocation and exocytosis in zebrafish oocytes. PLoS Biol. 21(6): e3002146. https://doi.org/10.1371/journal.pbio.3002146
- Joseph, S. R., Pálfy, M., Hilbert, L., Kumar, M., Karschau, J., Zaburdaev, V., Shevchenko, A. and Vastenhouw, N. L. (2017). Competition between histone and transcription factor binding regulates the onset of transcription in zebrafish embryos. eLife. 6: e23326. https://doi.org/10.7554/eLife.23326
- Westerfield, M. (2000). THE ZEBRAFISH BOOK A guide for the laboratory use of zebrafish Danio (Brachydanio) rerio (4th ed.). University of Oregon Press.
- Frommelt, J., Liu, E., Bhaidani, A., Hu, B., Gao, Y., Ye, D. and Lin, F. (2023). Flat mount preparation for whole-mount fluorescent imaging of zebrafish embryos. Biol Open. 12(7): e060048. https://doi.org/10.1242/bio.060048
- Peng, T., Thorn, K., Schroeder, T., Wang, L., Theis, F. J., Marr, C. and Navab, N. (2017). A BaSiC tool for background and shading correction of optical microscopy images. Nat Commun. 8(1): 14836. https://doi.org/10.1038/ncomms14836
- Marstal, K., Berendsen, F., Staring, M. and Klein, S. (2016). SimpleElastix: A User-Friendly, Multi-lingual Library for Medical Image Registration. 2016 IEEE Conference on Computer Vision and Pattern Recognition Workshops (CVPRW), 574–582. https://doi.org/10.1109/CVPRW.2016.78
- Moore, J., Basurto-Lozada, D., Besson, S., Bogovic, J., Bragantini, J., Brown, E. M., Burel, J.-M., Casas Moreno, X., De Medeiros, G., Diel, E. E., et al. (2023). OME-Zarr: a cloud-optimized bioimaging file format with international community support. Histochem Cell Biol. 160(3): 223–251. https://doi.org/10.1007/s00418-023-02209-1
- Sommer, C., Straehle, C., Kothe, U. and Hamprecht, F. A. (2011). Ilastik: Interactive learning and segmentation toolkit. 2011 IEEE International Symposium on Biomedical Imaging: From Nano to Macro. 230–233. https://doi.org/10.1109/ISBI.2011.5872394
- Stringer, C., Wang, T., Michaelos, M. and Pachitariu, M. (2020). Cellpose: a generalist algorithm for cellular segmentation. Nat Methods. 18(1): 100–106. https://doi.org/10.1038/s41592-020-01018-x
Article Information
Publication history
Received: Jul 2, 2026
Accepted: Aug 24, 2026
Available online: Sep 15, 2026
Published: Oct 5, 2026
Copyright
© 2026 The Author(s); This is an open access article under the CC BY-NC license (https://creativecommons.org/licenses/by-nc/4.0/).
How to cite
Wyss, M. F., Hess, M., Shamipour, S. and Pelkmans, L. (2026). 3D Iterative Immunofluorescence Imaging on Whole-Mount Samples. Bio-protocol 16(19): e5838. DOI: 10.21769/BioProtoc.5838.

 Download Citation in RIS Format
Category
Developmental Biology
Systems Biology
Do you have any questions about this protocol?
Post your question to gather feedback from the community. We will also invite the authors of this article to respond.
 Post a Question


