


- Protocols

- Articles and Issues
- For Authors
- About
- Become a Reviewer


How to Perform a Tracer Displacement BRET Assay for the TRPML1 Ion Channel

(*contributed equally to this work, § Technical contact) Published: Vol 16, Iss 18, Sep 20, 2026 DOI: 10.21769/BioProtoc.5820 Views: 666
Reviewed by: Elena A. OstrakhovitchAnonymous reviewer(s)
 PDF
PDF  Ask a question
Original research article
The authors used this protocol in:

Jun 2023

Protocol Collections
Comprehensive collections of detailed, peer-reviewed protocols focusing on specific topics




Abstract
The transient receptor mucolipin subtype 1 (TRPML1) is a ubiquitously expressed ion channel involved in lysosomal homeostasis. Recent pharmaceutical interest in developing agonist ligands has emerged due to beneficial effects in neurodegenerative diseases. The major high-throughput screening techniques to investigate this ion channel involve fluorescent calcium imaging and electrophysiology. Despite their high capacity for screening compounds, it is well known that both methods face hurdles, such as the need for expensive, specialized equipment. Here, we present a novel technique to screen for ligands of TRPML1 using a bioluminescence resonance energy transfer (BRET) assay. This assay consists of a target engagement assay in live cells, which permits the determination of binding constants between ligands and the target of interest in equilibrium or time-dependently. We employ a full-length TRPML1 C-terminally tagged with the small bioluminescent protein nanoluciferase. This ensures the correct localization of the ion channel in the lysosomal membrane and an optimal placement of the luciferase in the cytoplasm. We also developed a cell- and lysosome-permeable fluorescent BRET tracer that gives a BRET signal only when bound to the ion channel. This new protocol allows researchers worldwide to screen compounds that would interact with TRPML1 by using any plate reader with luminescent and fluorescence filters.
Key features
• This assay enables high-throughput screening of ligands for the TRPML1 ion channel without the need for a kinetic plate reader.
• With the tracer displacement assay, it is possible to derive the apparent ligand affinity (KdA) for TRPML1.
• The assay uses full-length TRPML1, preserving the physiological context of lysosomal TRPML1.
Keywords: TRPML1 BRET
Tracer
ML-SA1
Cell-based assay
Biophysical assay
BRET
Tracer
ML-SA1
Cell-based assay
Biophysical assay
Graphical overview
Background
The transient receptor mucolipin subtype 1 (TRPML1) is a lysosomal ion channel expressed in every cell type [1]. Its deregulation has been implicated in many diseases, including genetic diseases (e.g., Mucolipidosis type IV [2], Niemann–Pick [3], and Duchenne muscular dystrophy [4]), bacterial [5] and viral infections [6], and cancer [7–14]. Recent pharmaceutical interest in developing agonist ligands has emerged due to beneficial effects in neurodegenerative diseases [15]. The identification of cell-permeable modulators for TRPML1 has been challenging due to the dynamic nature of these proteins and the inability to express and purify them in bacteria because of their complex structure. As a result, in vitro biochemical assays are largely unavailable. To overcome these issues, researchers have essentially relied on compound screening in cells overexpressing a cytoplasmic version of TRPML1 rather than the endolysosomal form [16–19]. This allows the apical application of compounds and the direct measurement of channel activity by calcium (Ca2+) imaging assay or by electrophysiology. However, these assays represent a non-physiological condition for drug screening because the compounds do not target the receptor in its native location [20,21]. More recently, the use of genetically encoded calcium indicators (GECI, such as GCaMP’s), specific intracellular calcium-sensitive dyes (such as Fura-2 and Fluo-4), and lysosomal preparations for patch-clamping has changed how we investigate compound binding to wild-type TRPML1 [22,23]. Despite these advancements, drug-screening campaigns remain extremely work-intensive due to successive washing steps and special handling of cells, and, more importantly, the use of expensive equipment for the functional assays.
Target engagement (TE) assays have emerged as an essential confirmatory assay for on-target activity in live cells, which accounts for compound permeability, biological target localization, and competition with intracellular constituents [24]. Among the different assay modalities, the bioluminescent resonance energy transfer (BRET) technology has been widely used to investigate compound binding to important targets such as kinases, GPCRs, and others [25]. This assay depends on the intracellular tracer that emits fluorescence once bound to the target protein fused to a luciferase [26]. The tracer (also called a BRET probe) is composed of a small molecule with experimental data on potency and mode of action in the target of interest, by either cryo-electron microscopy (cryo-EM), X-ray diffraction, or other structural biology techniques. This compound is rationally modified to covalently incorporate a fluorescent moiety in a position that would not interfere with binding to the protein target. This compound must also be cell-permeable in live cells and must bind to the target in a pocket that is placed at an optimal distance from the luciferase [27]. Once these parameters are achieved, one can perform the competition assay between a known concentration of the tracer and non-fluorescent test compounds, referred to as the tracer displacement (TD) assay. It is important to note that if the parent molecule that originated the tracer is promiscuous within a protein family, it allows the researchers to use the same tracer to investigate many proteins of the family [28]. Finally, it is worth mentioning that the BRET assay will only give data for compounds that bind to the same region of the tracer. Therefore, one of the major challenges to establishing a functional BRET assay is to develop a validated BRET tracer for the intended target.
Given the need for new screening assays for the TRPML1 ion channel and the ability of TE assays to investigate targets in their native environment, we set out to develop a BRET assay for TRPML1 using a new validated tracer called MRC087. The tracer was designed using a molecular docking approach to incorporate a fluorescent BODIPY-based compound into the mucolipin synthetic agonist-1 (referred to as ML-SA1). ML-SA1 was chosen due to its wide use in the scientific community as a TRPML1 agonist with a defined mode of action by cryo-EM [1,29,30] and reported structure-activity relationships [16].
Materials and reagents
Biological materials
1. Human embryonic kidney 293T cells (American Type Culture Collection, CRL-3216)
Reagents
1. Flexi® cloning system (Promega, catalog number: C8640)
2. hTRPML1 fused to YFP plasmid (Addgene, catalog number: 18826)
3. Plasmid constructs: The gene encoding the full-length human TRPML1 (Uniprot: Q9GZU1) was cloned in frame with nanoluciferase in plasmid pFC32K, part of the Flexi® cloning system. The coding sequence for hTRPML1 was PCR-amplified from hTRPML1 fused to YFP plasmid using primers hTRPML1-fb003 (GGCTGCGATCGCCATGACAGCCCCGGCGGGTCC) and hTRPML1-rb003 (ATGGGTTTAAACATTCACCAGCAGCGAATGCTCCTCCG). Correct cloning was confirmed by sequencing.
4. Fetal bovine serum (FBS) (Gibco, catalog number: A5256701)
5. FuGENE® HD transfection reagent (Promega, catalog number: E2311)
6. Nanoluciferase substrate/inhibitor (Promega, catalog number: N2162)
Note: The nanoluciferase substrate (furimazine-based) [31] and inhibitor [32] are both proprietary of Promega Corp, thus the exact composition of the kit is not fully disclosed.
7. Tracer dilution buffer (Promega, catalog number: N2191)
8. MRC087, 10 mM stock in DMSO (self-made, see [33]); validated and deposited in tracerDB (ID T000049; tracerdb.org) [34]
9. Dimethyl sulfoxide (DMSO), molecular biology grade (Sigma-Aldrich, catalog number: D2650-100ML)
10. NucleoBond Xtra Maxi Plus kit (Macherey Nagel, catalog number: 740416.50)
11. DMEM, high glucose (Gibco, catalog number: 11965092)
12. Penicillin-streptomycin (10,000 U/mL) (Gibco, catalog number: 15140122)
13. Dulbecco’s phosphate-buffered saline (PBS) (Sigma-Aldrich, catalog number: D8537-500ML)
14. 0.25% trypsin-EDTA (Gibco, catalog number: 25200072)
15. Trypan Blue solution, 0.4% (Gibco, catalog number: 15250061)
16. Opti-MEM serum-free without phenol red and antibiotics (Gibco, catalog number: 11058021)
Laboratory supplies
1. Cell culture flask, 250 mL, 75 cm2 (Greiner, catalog number: 658175)
2. 15 mL centrifuge tube (Corning, catalog number: 430766)
3. 96-well, white-walled/opaque bottom plate (Greiner Bio-One, catalog number: 655098)
4. 125 μL tips, sterile, with filter (Integra, catalog number: 4425)
5. 12.5 μL tips, sterile, with filter (Integra, catalog number: 4405)
6. Neubauer chamber (Cral, catalog number: C1010)
7. Reagent reservoir, 25 mL (Thermo, catalog number: 809311)
8. Aluminum foil
9. 10 mL sterile serological pipette (Sarstedt, catalog number: 86.1254.001)
Equipment
1. Inverted microscope (Leica, model: DMi8)
2. Centrifuge (Eppendorf, model: 5810R) with S-4-104 rotor
3. Plate reader (BMG LABTECH CLARIOstar)
4. Pipette controller (USA Scientific Inc, model: ErgoOne FAST)
5. Multichannel pipette 100 μL (Thermo Fisher Scientific, model: Finnpipette F1)
6. Orbital shaker (Heidolph, model: Titramax 101)
7. Biosafety cabinet (ESCO, model: Airstream AC2-4S8)
Software and datasets
1. GraphPad Prism (GraphPad, Version 11.0.2)
2. tracerDB [34] (tracerdb.org): a crowdsourced database of experimentally validated fluorescent tracers for target engagement assays (last accessed July 2026)
Procedure
A. Cell culture and transfection (perform in a biosafety cabinet)
1. Grow the cells in a T75 flask using DMEM supplemented with 10% FBS and antibiotics (1% penicillin and streptomycin).
Note: This supplemented DMEM medium used for cell culture is also referred to as complete culture medium in this protocol.
2. Once the cells reach 80%–90% confluency, aspirate the cell medium with a sterile 10 mL pipette and add 10 mL of warm (37 °C) PBS.
3. Swirl to wash out the residual culture media. Aspirate the PBS with a sterile 10 mL pipette and add 1 mL of warm (37 °C) 0.25% trypsin-EDTA solution.
4. Place the flask in a 37 °C, 5% CO2 incubator for 2 min.
Note: Cell viability may be reduced with longer incubation times.
5. Gently swirl the flask to detach cells. Once cells start to slide as patches or show smooth edges under a microscope, add 9 mL of complete culture media to deactivate the trypsin.
6. Pipette up and down to fully dissociate the cells and transfer the cell suspension to a 15 mL sterile centrifuge tube.
7. Centrifuge cells at 210× g for 6 min at 20 °C.
8. Remove the supernatant and suspend cells with 10 mL of complete culture medium.
9. Mix 20 μL of cell suspension with 20 μL of trypan blue and count viable cells using a Neubauer chamber.
10. Dilute cells to 2 × 10⁵ cells/mL with complete culture media.
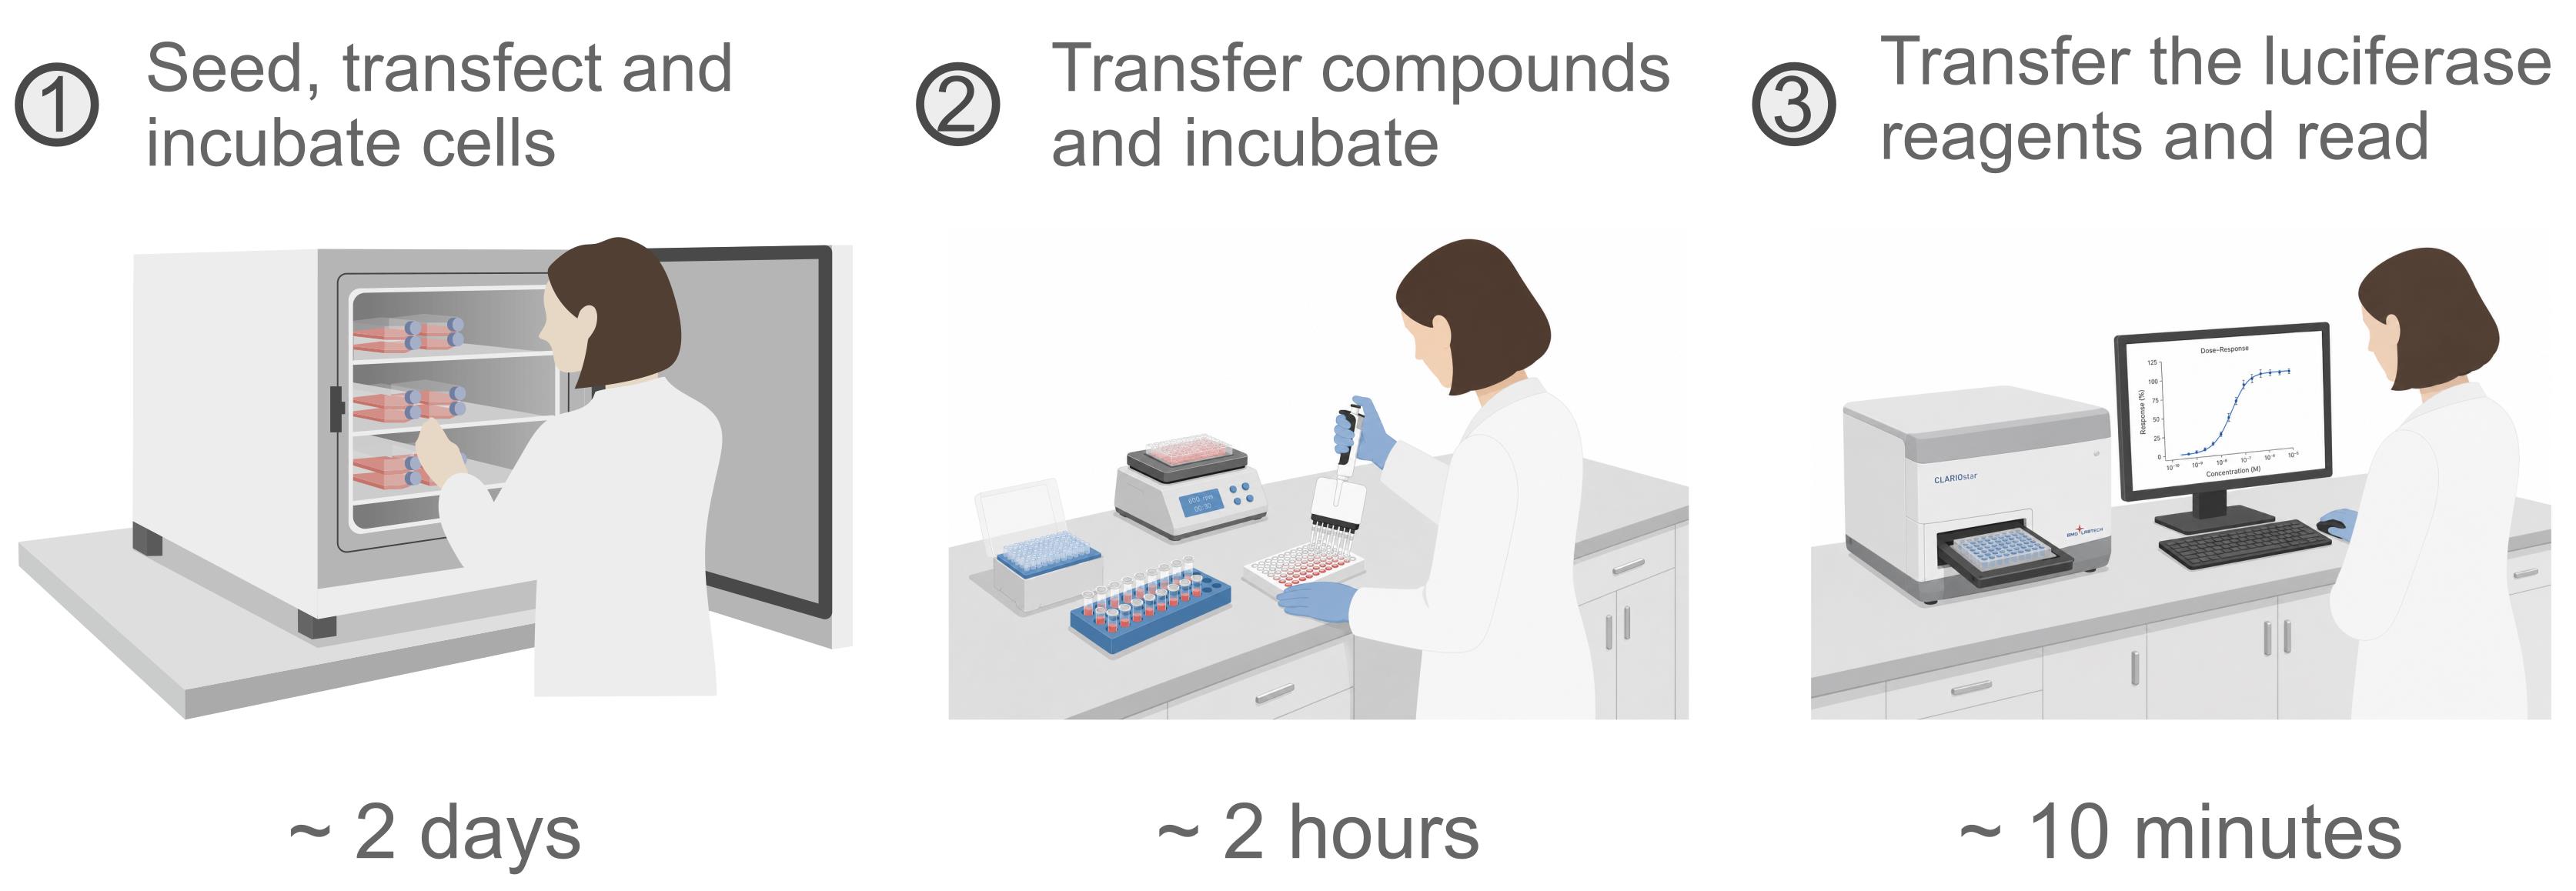
11. Transfer the cell suspension to a sterile reagent reservoir and add 100 μL of cell suspension per well to a white-walled/opaque-bottom 96-well assay plate using a multichannel pipette.
Note: We recommend 20,000 cells per well for HEK293T. Adjust for other cell types to reach 60%–80% confluency at the time of transfection.
12. Prepare the transfection mix: add 24 μg of plasmid DNA in 1.2 mL of Opti-MEM serum-free without phenol red or antibiotics. Then, add 72 μL of FuGENE® HD transfection reagent and mix by inversion 10 times. Incubate at room temperature for 10 min.
Notes:
1. This transfection mix is enough for a full 96-well plate.
2. The plasmid DNA was originally purified using the NucleoBond Xtra Maxi Plus kit, which contains RNase A and renders transfection-grade plasmid DNA. See procedures for cloning and purification in [33].
13. Transfer 10 μL of the transfection mix to every well of the assay plate.
14. Place the assay plate in a 37 °C, 5% CO2 incubator for 48 h.
B. Add compounds to cells and incubate (perform outside a biosafety cabinet)
1. Remove the assay plate from the incubator and carefully wash the cells with 100 μL of warm (37 °C) PBS.
2. Replace the PBS with 85 μL of warm Opti-MEM without phenol red and antibiotics.
3. Prepare the MRC087 tracer mix: aliquot 2 μL of the 10 mM stock solution to a microtube. Then, add 498 μL of tracer dilution buffer (TDB) and mix 10 times.
Critical: Keep the tracer mix protected from light. The tracer mix is prone to degradation under constant light irradiation and may affect the results. For long-term storage, keep it frozen in 100% DMSO at -30 °C until use.
Notes:
1. This tracer mix is enough for a full 96-well plate. Adjust the volume of reagents if only half of the assay plate will be used.
2. Do not mix vigorously to avoid foaming.
4. Prepare the compound dilution solutions: prepare a 10-point serial dilution (starting from 10 mM) of the test compound in DMSO in a 1:2 ratio. The final volume in each well should be 5 μL.
Critical: The 11th and 12th points must be composed of only DMSO, no test compound added.
Notes:
1. The maximum DMSO concentration used in the assay is 1%, after compound and tracer addition.
2. The compound dilution can be prepared in any available plasticware (96-well plate, PCR strip, microtubes, etc.).
5. Dispense 45 μL of Opti-MEM without phenol red and antibiotics to every compound dilution solution and mix it well to ensure homogenization.
6. Transfer 10 μL of the compound dilution solutions to every well of the assay plate, in quadruplicate (Figure 1).
Notes:
1. For a full 96-well assay plate, prepare the serial dilutions for two test compounds.
2. If potent compounds are present, adjust the dilution ratio to 1:3.
3. If dose-response is not needed, adjust the compound and assay plates composition to test up to 20 compounds in quadruplicate.
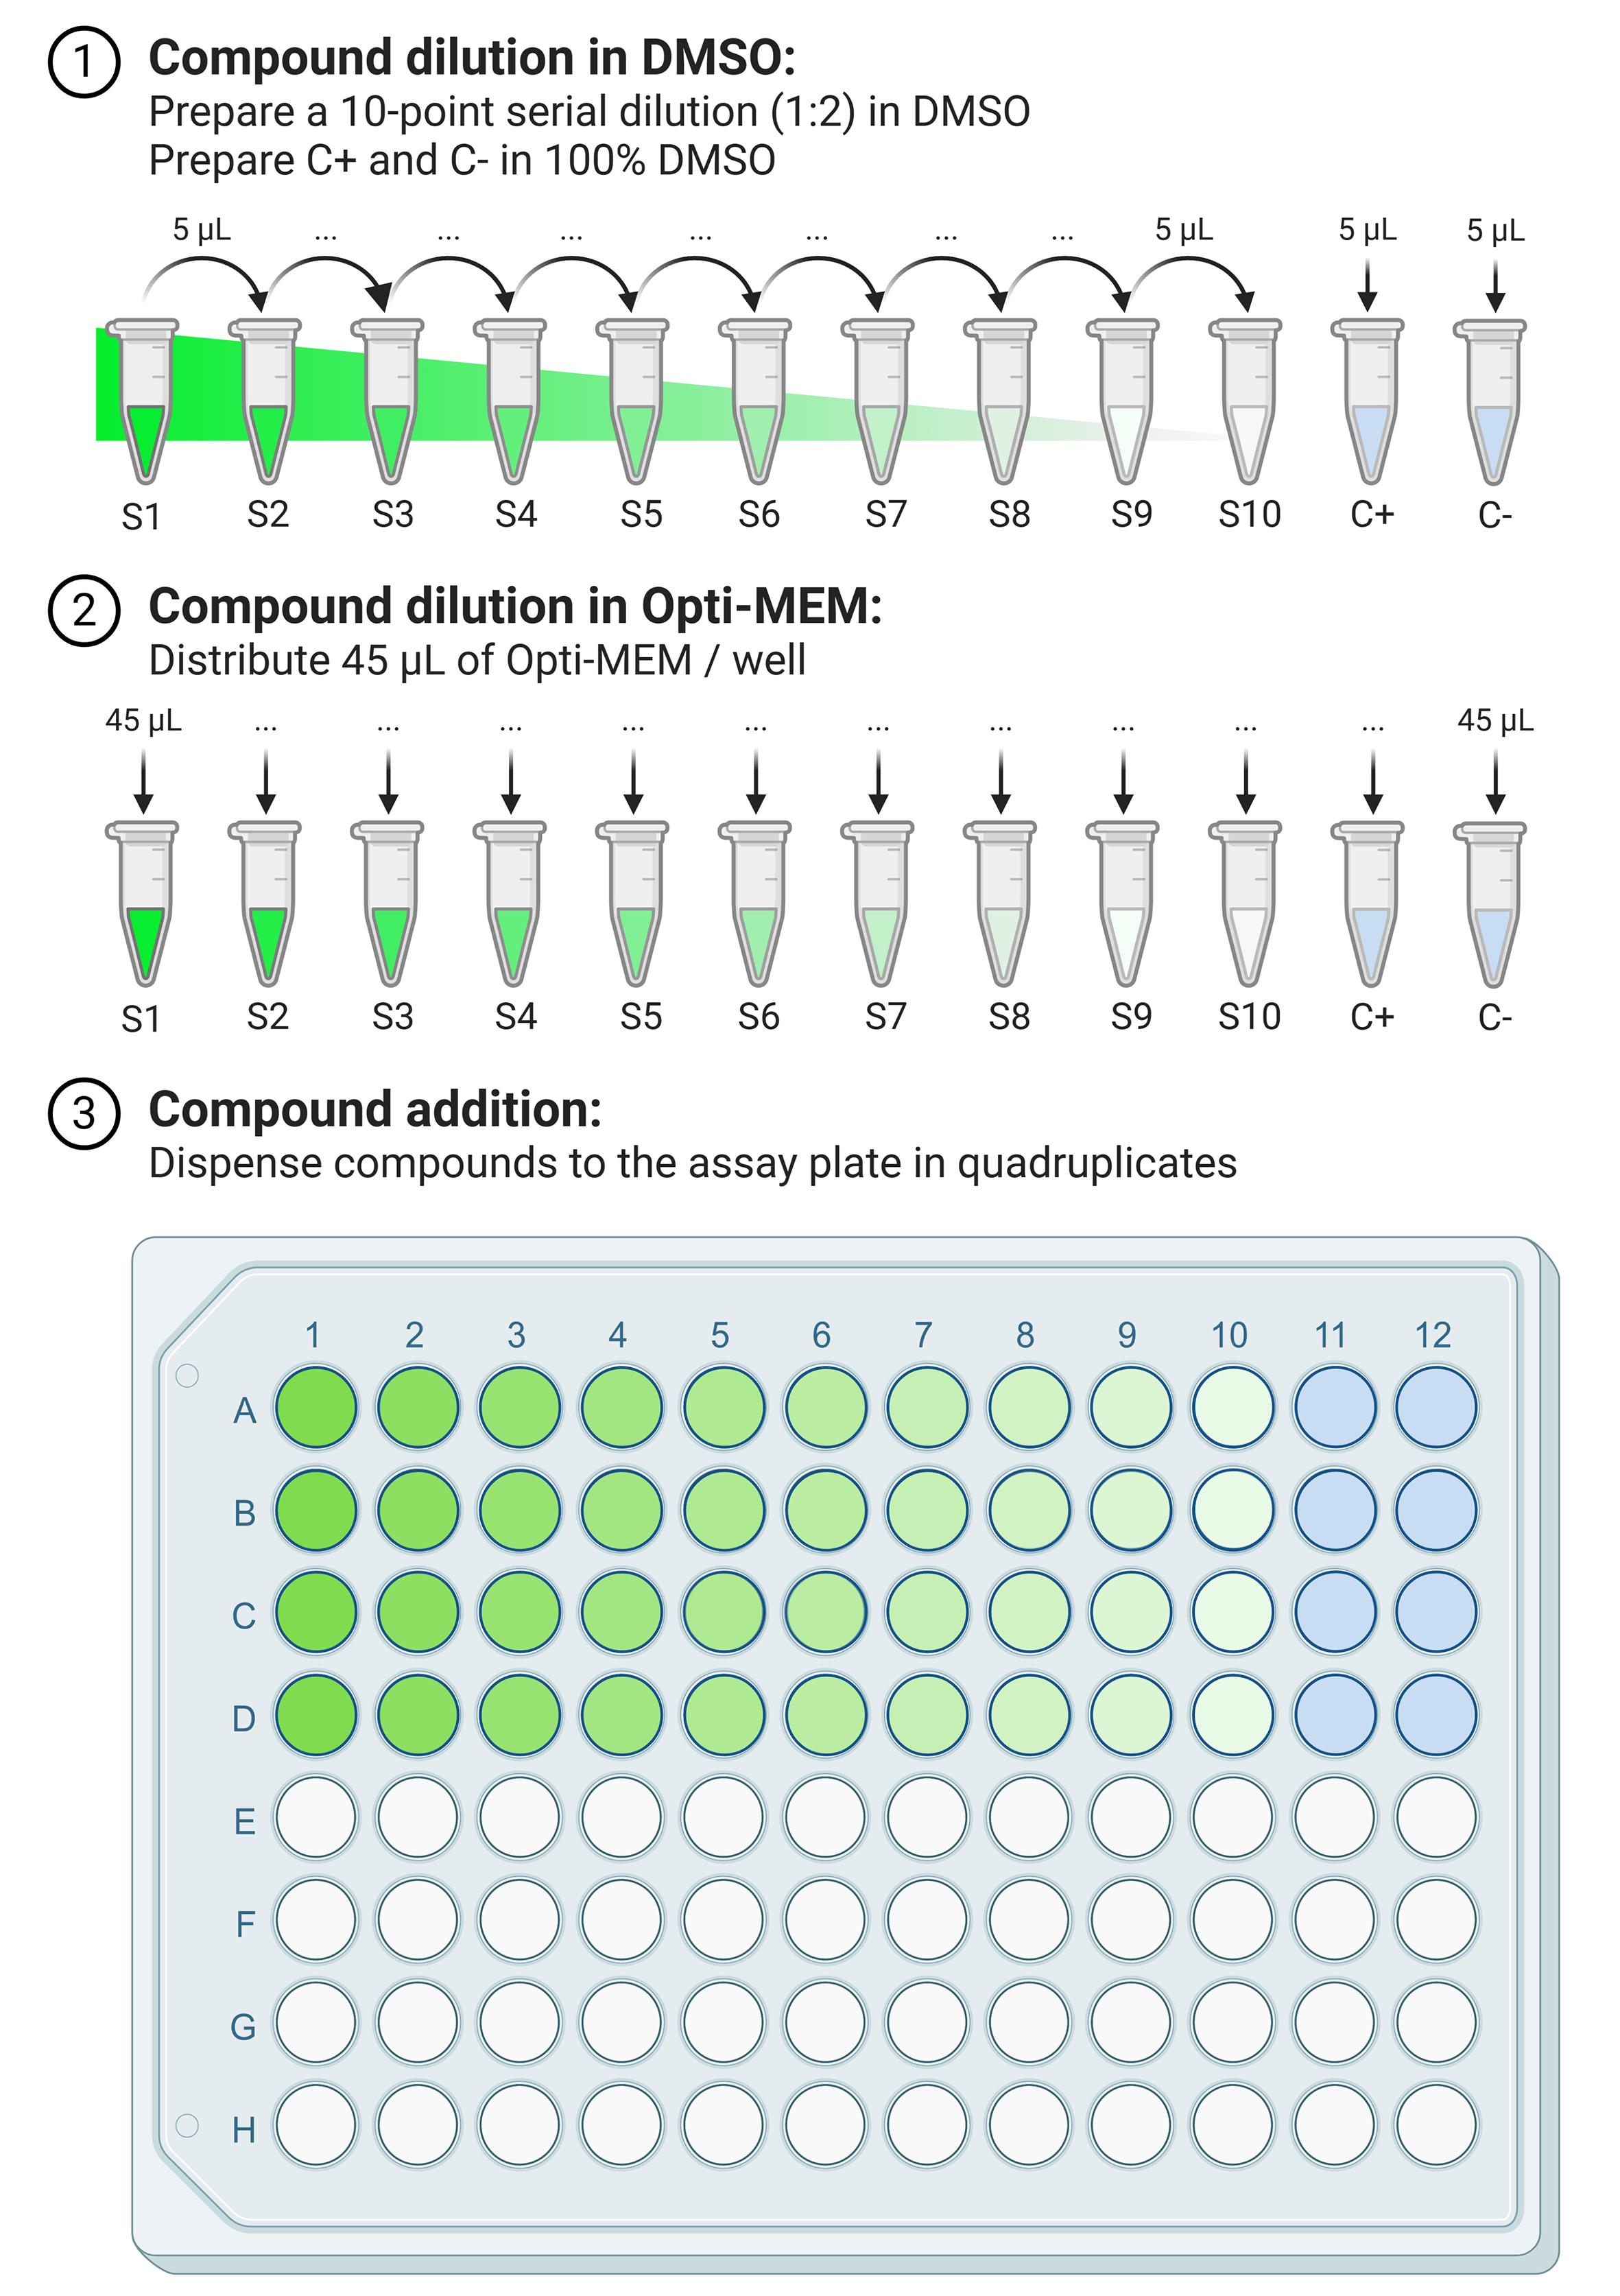
Figure 1. Schematic representation showing how to prepare the dose-response of one compound in the BRET assay. To ensure that the whole assay plate is used, prepare a second serial dilution of a second test compound in advance.
7. Dispense 5 μL of the tracer (MRC087) mix to every well of the assay plate, with the exception of the 12th column (Figure 2).
Critical: Do not dispense the tracer mix in the 12th column; instead, add only the respective vehicle (5 μL of TDB).
Note: These steps ensure that tracer control will give the maximum signal of the assay, and bank control will only give a nonspecific signal.
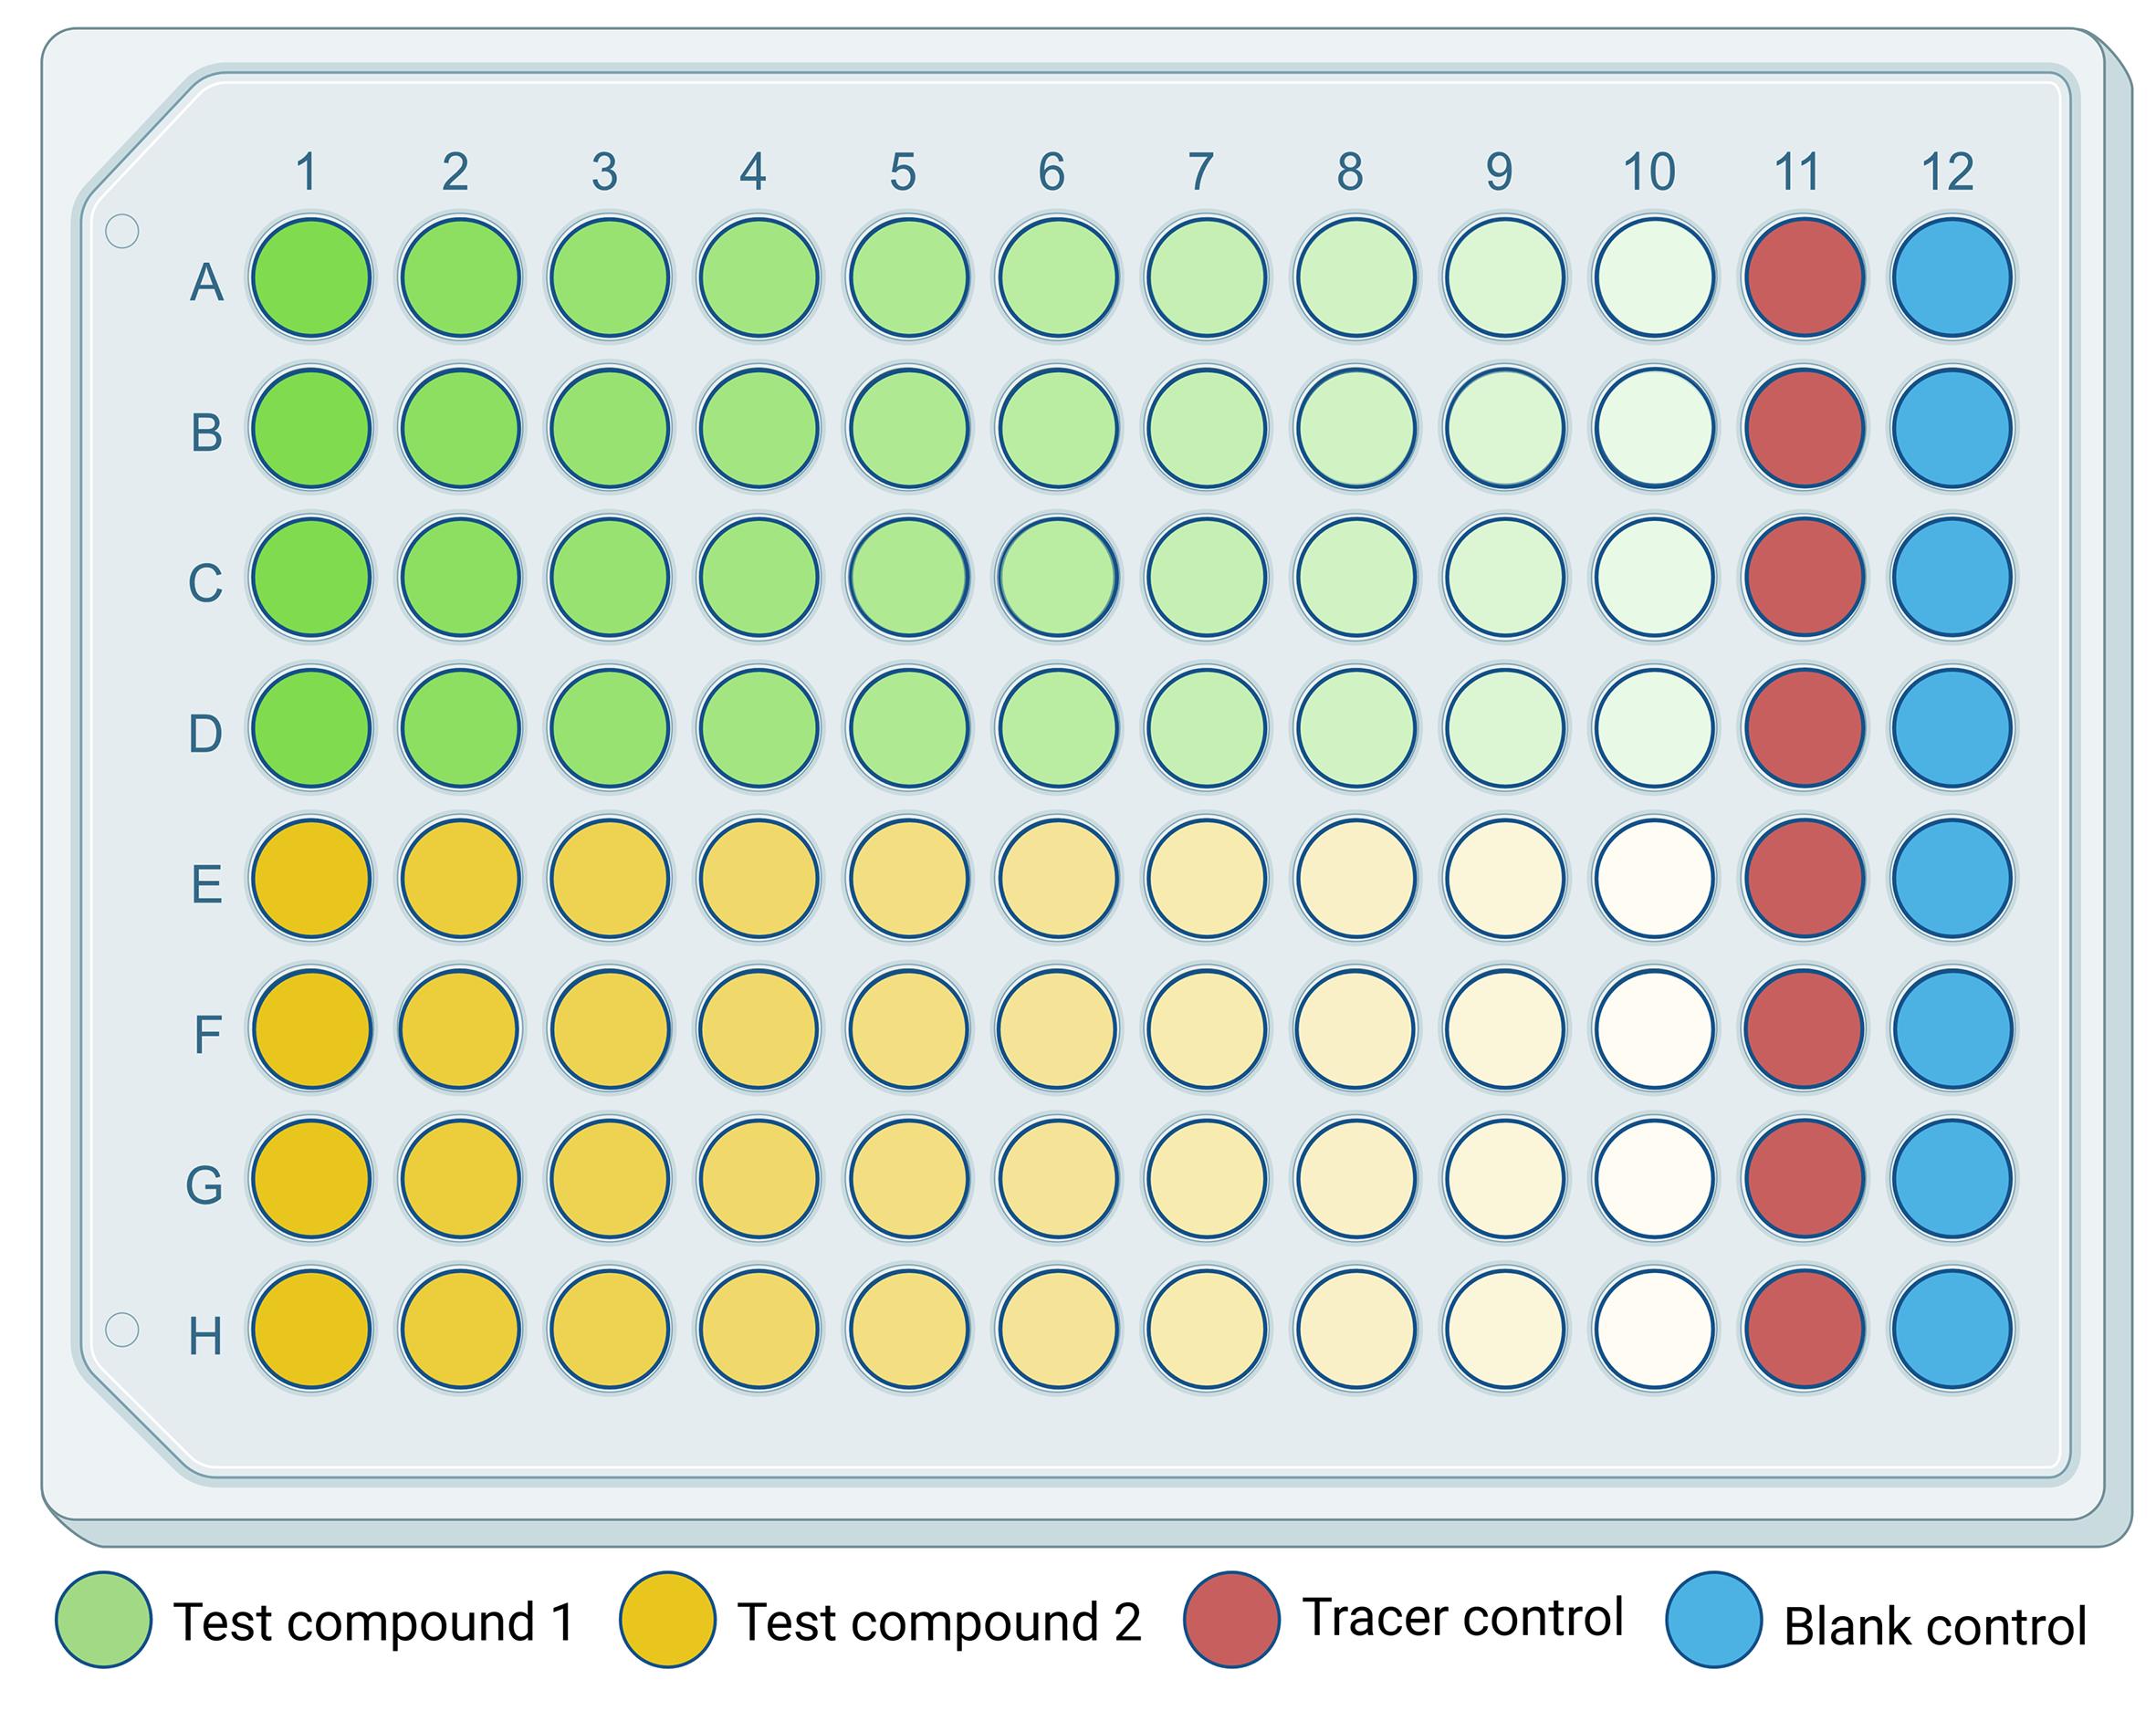
Figure 2. Plate layout for a dose-response assay using two unlabeled test compounds (green and yellow circles). The color fades from dark (1st column) to pale (10th column) as the concentration of the compound decreases. Tracer control (red circles, 11th column) and blank control (blue circles, 12th column) are mandatory for the assay. Tracer control is composed of tracer and vehicle (100% signal, no test compound). Blank control is composed of the vehicle (0% signal, no test compound or tracer). Both controls are used for data normalization and Z’-factor determination.
8. Wrap the assay plate in aluminum foil and incubate at 37 °C for 2 h.
Note: This step does not require an incubator with a CO2 line.
C. Dispense nanoluciferase substrate/inhibitor and read the assay (perform outside a biosafety cabinet)
1. Prepare the nanoluciferase substrate/inhibitor solution: in a 15 mL centrifuge tube, add 5.5 mL of warm (37 °C) Opti-MEM without phenol red, followed by 33 μL of nanoluciferase substrate and 11 μL of nanoluciferase inhibitor. Vortex for 2 min.
Note: This nanoluciferase substrate/inhibitor solution is enough for a full 96-well plate.
Critical: Keep the nanoluciferase substrate/inhibitor protected from light. For long-term storage, keep it frozen at -30 °C until use.
2. Transfer 50 μL of the nanoluciferase substrate/inhibitor solution to every well of the assay plate and wrap it in aluminum foil.
3. Place the assay plate in an orbital shaker at room temperature at 600 rpm for 5 min.
Critical: Nanoluciferase emits stable blue light after 5 min in contact with its substrate up to 2 h. If you read immediately after adding the substrate, the light emissions will overflow the equipment and will decay until it reaches the stable emission phase.
4. Remove the aluminum foil and place the assay plate in the plate reader.
5. Set the light emissions at 460 ± 10 nm and fluorescent emissions at 610 ± 20 nm. Set the integration time to 0.5 s and adjust the gain to 3,600 for both detection channels.
Note: Gain was adjusted to 3,600 (maximum) as it gave the best signal-to-noise in this protocol. The gain may be reduced depending on the plate reader available.
6. Read the assay plate from the top, without the lid.
Data analysis
The number of biological replicates depends on the experiment goal (e.g., screening of large compound libraries or performing dose-response curves). To ensure reproducibility, especially for dose-response curves, we recommend performing at least three independent biological replicates with four technical replicates per experiment. Always include a tracer control in the 11th column (cells with tracer plus vehicle) and a blank control in the 12th column (cells with vehicle only) (Figure 1).
A. Calculate the mili-BRET (mBRET) ratio, also referred to as miliBRET units (mBU)
1. Divide the raw fluorescent emission (610 ± 20 nm) by the raw light emission (460 ± 10 nm) within the same well.
2. Multiply the previous result by 1,000. This gives the miliBRET units (also called mBRET or mBU).
Note: The raw BRET values normally give a fraction of a decimal, as the fluorescence signal is much smaller than the luminescence. To solve this issue, a standard practice is to multiply by 1,000 to generate the miliBRET units (mBRET or mBU) [35].
3. Average the miliBRET units obtained in the tracer control (entire 11th column) and in the blank control (entire 12th column).
4. Normalize the data from each well to the averaged controls. Set the averaged value of the tracer control to 100% signal and the blank control to 0% signal.
Note: Essentially, this is a competition assay (hence, tracer displacement assay) between the fluorescent tracer and the non-fluorescent test compound. You should expect that the higher the compound affinity for the protein, the lower the tracer fluorescence.
B. Plot the data and visualize the curve fit
1. Plot the normalized miliBRET units as a function of test compound concentration in an XY graph using GraphPad Prism v11.0.2.
2. Determine the apparent EC50 (Figure 3) by fitting the data to a four-parameter, no baseline weighting, and no constraints sigmoidal dose–response equation available in GraphPad Prism v11.0.2, where X is the test compound concentration, as shown in equation (I) below:
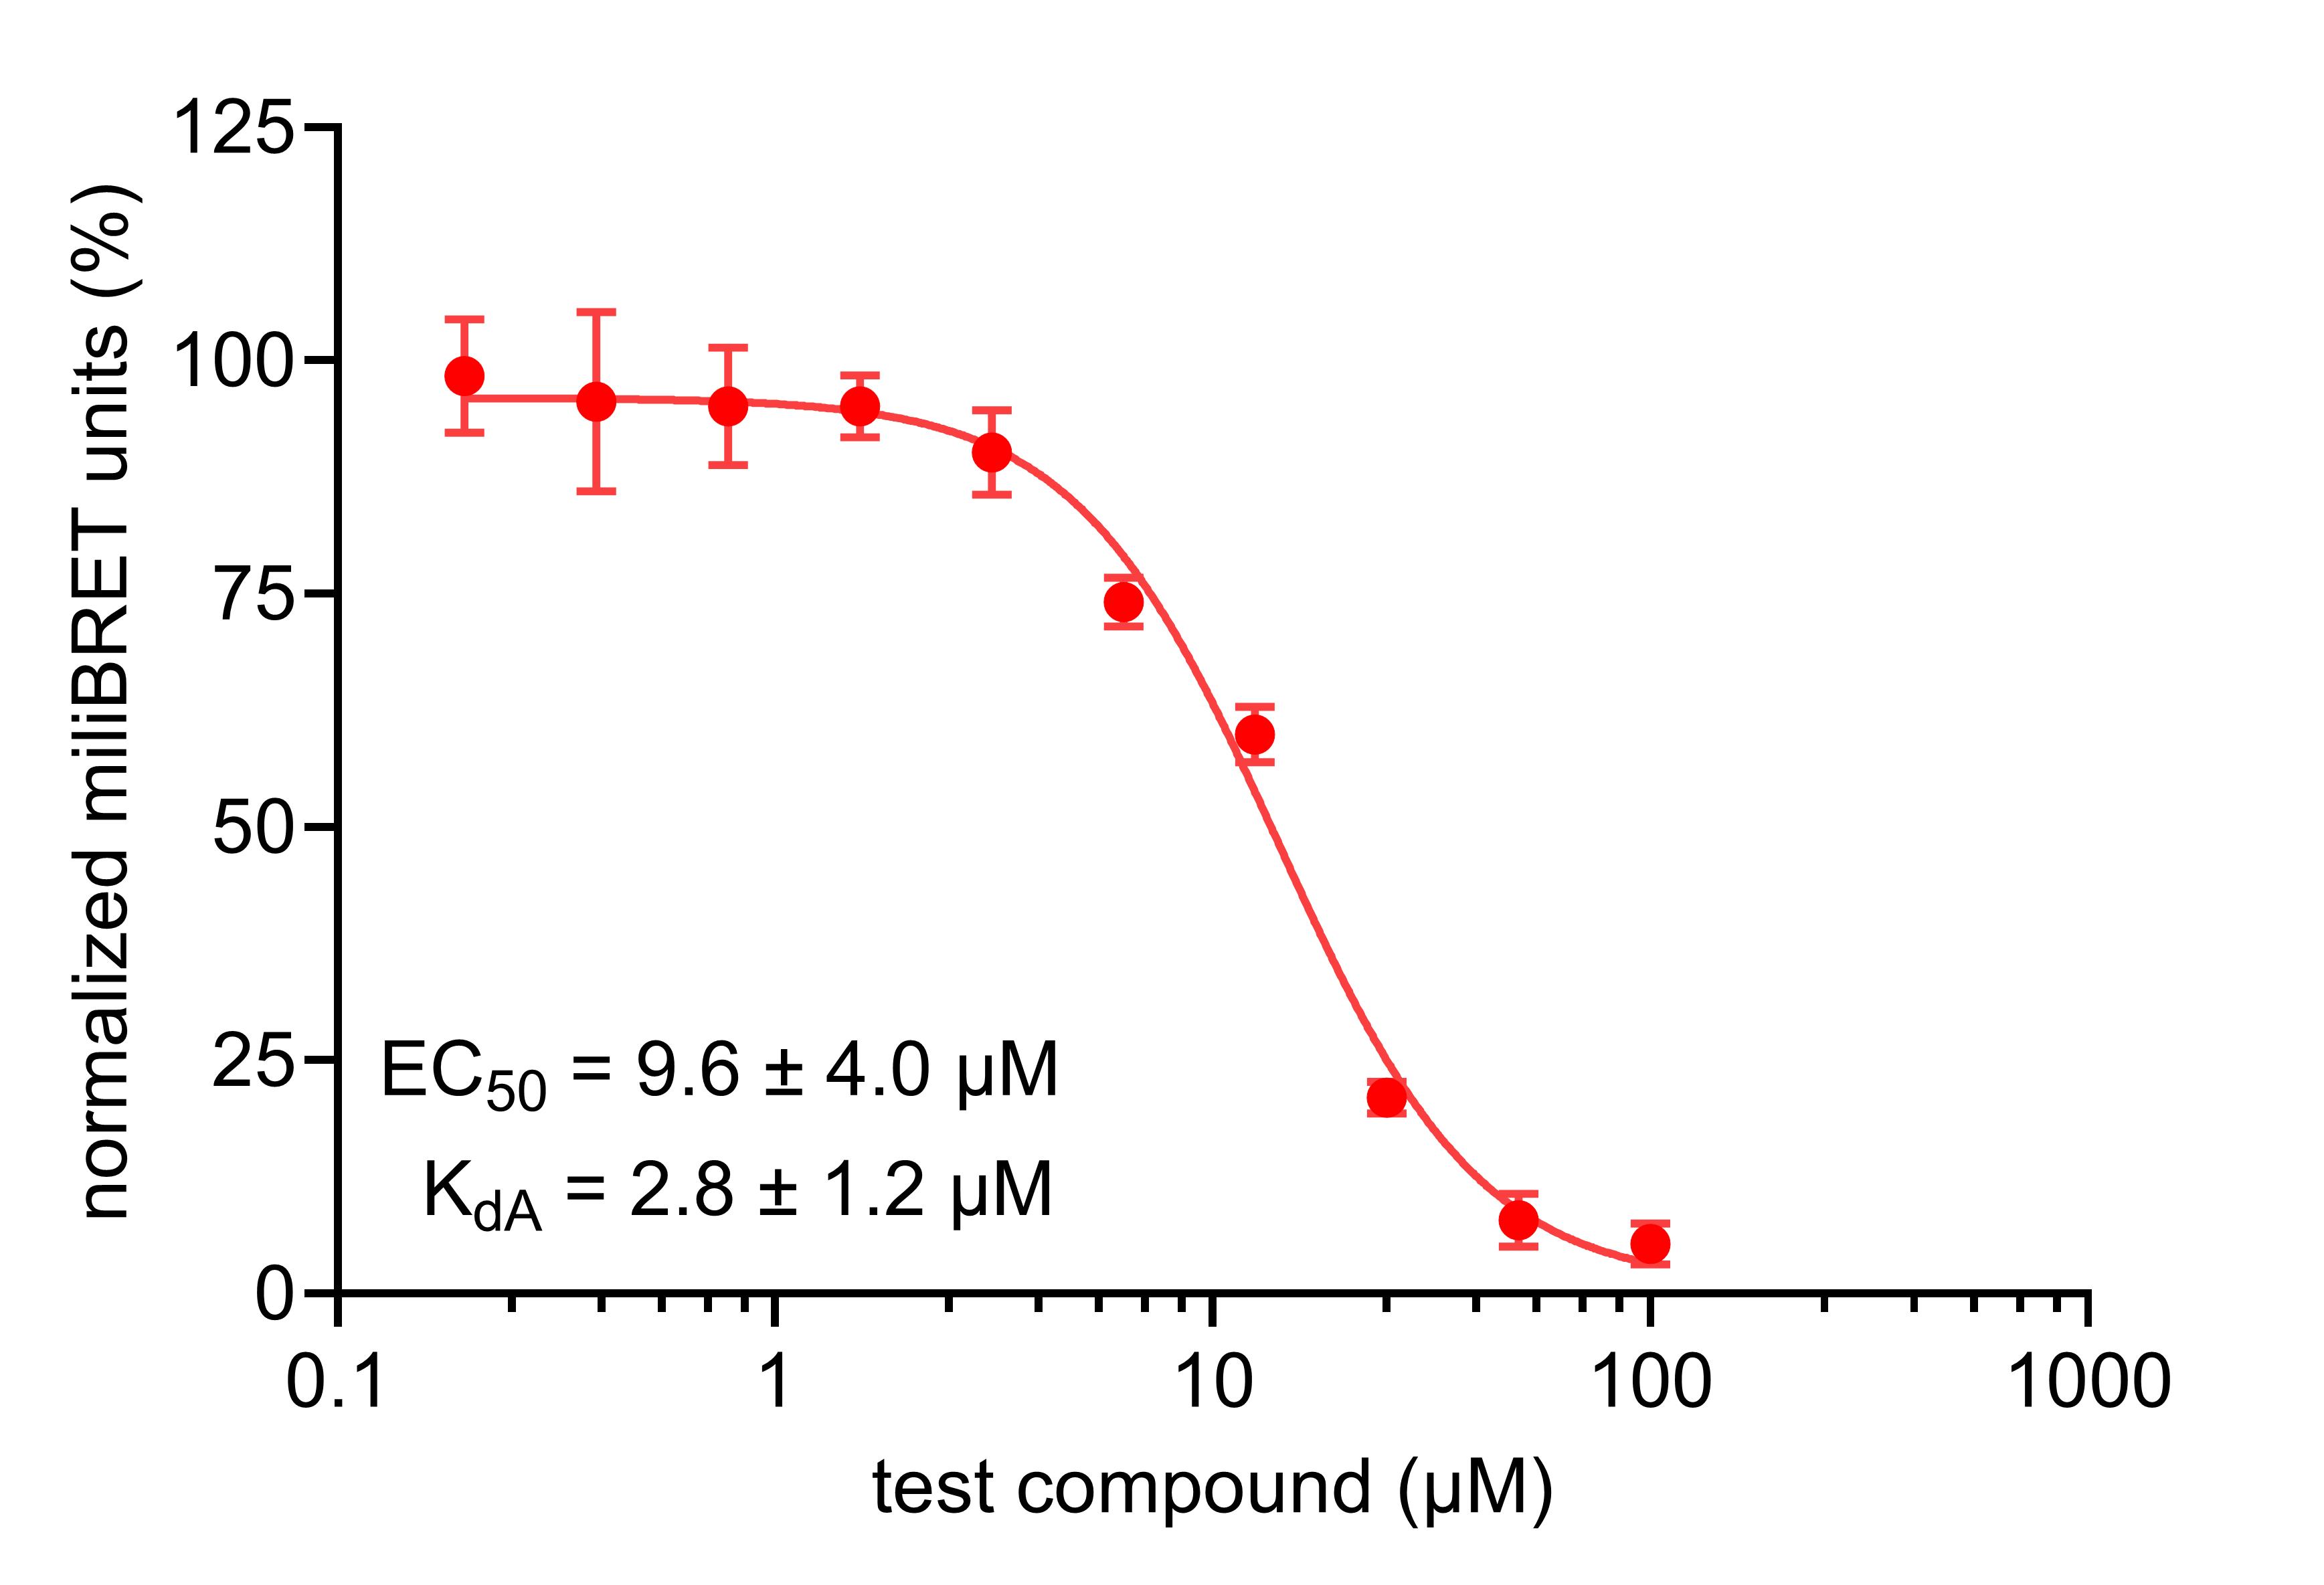
Figure 3. Representative dose-response curve from [33]. The plot shows the normalized miliBRET units as a function of a non-fluorescent test compound concentration. EC50 shown is the mean ± SD of three independent experiments, using the tracer MRC087 (2.0 μM). EC50 was converted to Kd using the Chen-Prusoff formalism.
3. The EC50 can be converted to ligand binding constants (KdA) via Cheng–Prusoff formalism [36] using the EC50 obtained for the test compound, the concentration of the tracer in the assay (L), and the tracer apparent Kd (of 913 nM, tracerDB ID T000049) [34], as shown in equation (II) below:
C. Calculate the Z’-factor of the assay
1. Using the mBRET values obtained from the 11th and 12th columns, calculate the Z’-factor to evaluate assay quality (Figure 4). Z’-factor is calculated using the means (μ) and standard deviations (σ) of the tracer (t) and blank (b) controls [37], as shown in equation (III) below:
Note: A high-quality assay must have a Z′-factor ≥ 0.5. Lower values indicate large variability in the controls. We recommend not using data from plates with Z’-factor values below 0.5.
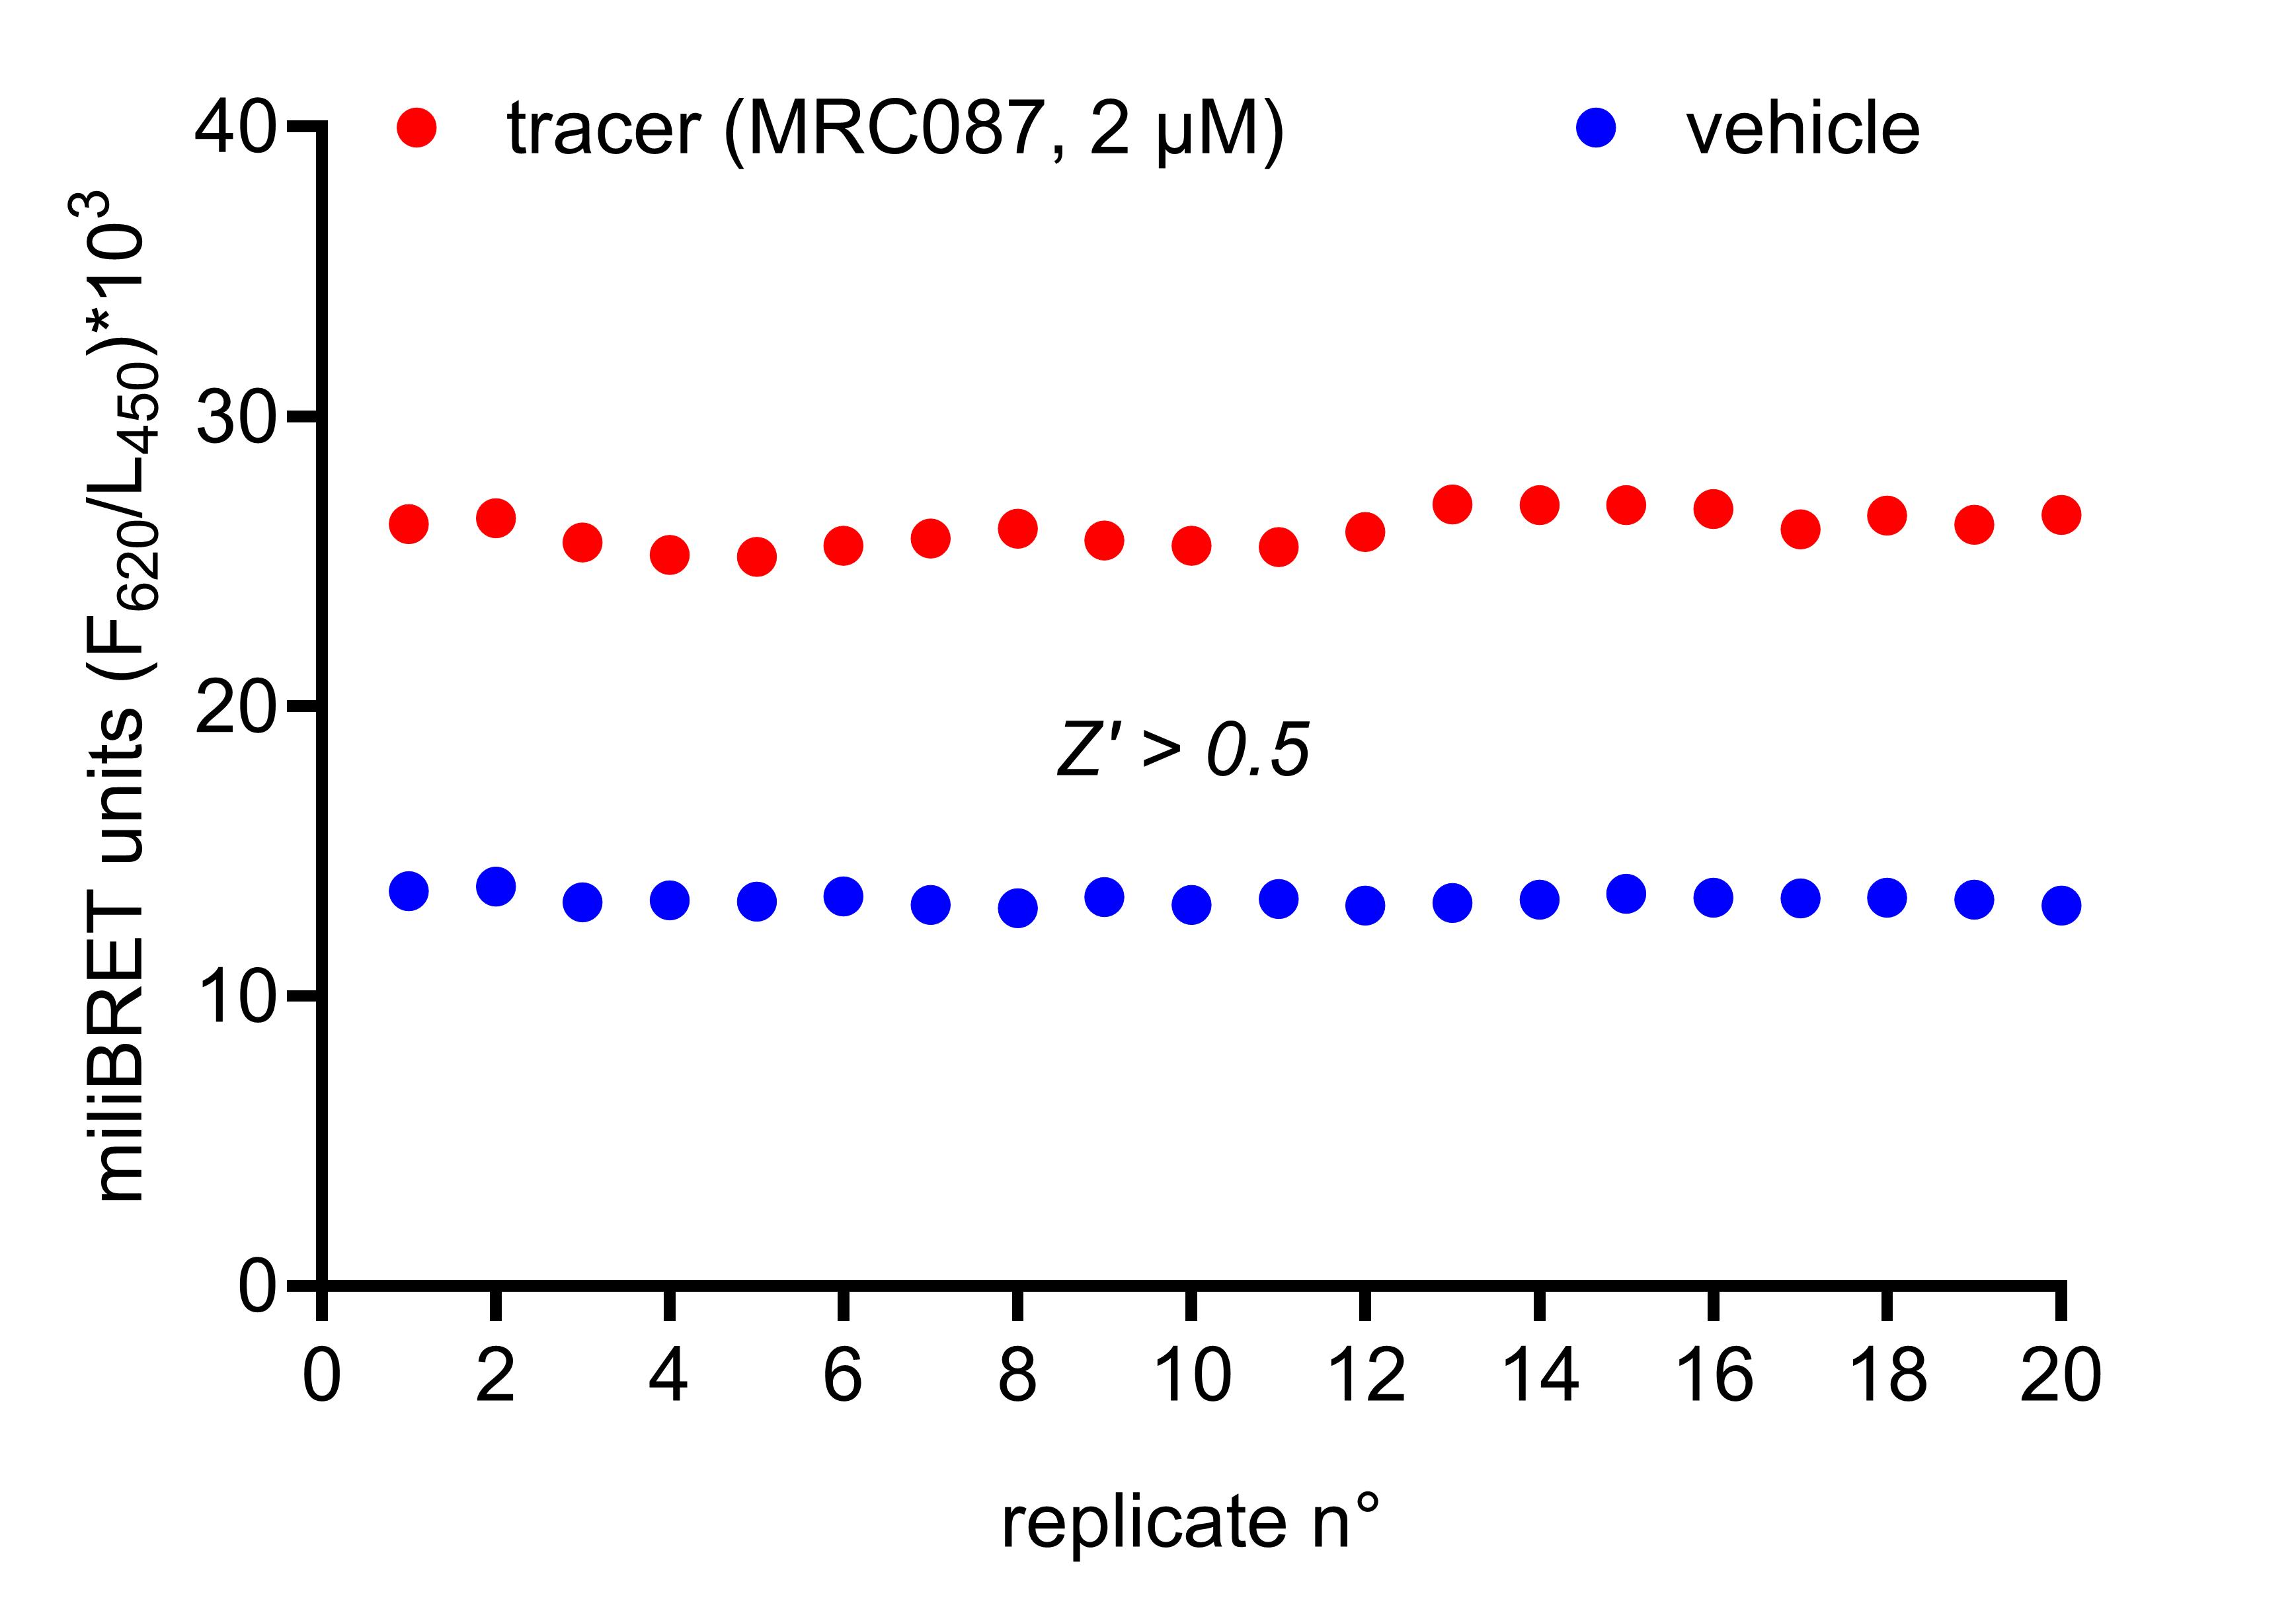
Figure 4. Z’-factor visualization and determination. Data obtained from the tracer and blank controls (n = 20/condition). The calculated Z’-factor for this assay was >0.5, an indication of a robust assay.
Validation of protocol
This protocol (or parts of it) has been used and validated in the following research articles:
• Cunha et al. [33]. A novel BRET-based assay to investigate binding and residence time of unmodified ligands to the human lysosomal ion channel TRPML1 in intact cells. Journal of Biological Chemistry (Figure 5).
• Cunha et al. [38]. (S)-ML-SA1 Activates Autophagy via TRPML1-TFEB Pathway. ChemBioChem (Figure 3).
General notes and troubleshooting
General notes
1. This is a competition (tracer-displacement) assay: It reports the apparent affinity (KdA) of a ligand for TRPML1 in intact cells and therefore measures target binding together with cellular and lysosomal permeability, not channel function. Orthogonal functional assays (e.g., Ca2+ imaging or lysosomal patch-clamp) are recommended to distinguish agonists from antagonists and to confirm functional activity.
2. Because the assay uses full-length TRPML1 correctly localized to the lysosomal membrane, it interrogates the physiologically relevant, endolysosomal form of the channel and inherently accounts for the ability of a compound to cross both the plasma and the lysosomal membranes.
3. The approach can be adapted to other lysosomal or membrane targets, provided that a nanoluciferase fusion that expresses and localizes correctly and a cell- and lysosome-permeable fluorescent tracer that produces a target-dependent BRET signal are both available.
4. Keep the final DMSO concentration identical across all wells; a final concentration of 1% (v/v) or lower is well tolerated by HEK293T cells, whereas higher concentrations may reduce cell viability and compress the assay window.
5. Assess assay quality using the on-plate controls: derive the assay window and the Z’-factor from the tracer control (column 11) and the blank control (column 12). A Z’-factor of 0.5 or greater indicates a robust assay suitable for screening.
6. The tracer (MRC087) is light sensitive. Protect stock solutions and working mixes from light and prepare them fresh on the day of the experiment.
7. Nanoluciferase luminescence is stable from approximately 5 min to 2 h after substrate addition [39,40]. Read all plates within this window and keep the timing consistent between plates to allow direct comparison of results.
Troubleshooting
| Problem | Possible cause | Solution |
| Low or no BRET signal (low mBU) | Low transfection efficiency or nanoluciferase expression | Verify plasmid quality and the FuGENE:DNA ratio (3:1); confirm cell confluency and viability; optimize the amount of DNA per well. |
| Weak or decreasing BRET signal | Tracer degraded by light exposure | Protect the tracer stock and working mix from light; prepare fresh and minimize time on the bench. |
| High well-to-well variability | Uneven cell seeding, incomplete mixing, or plate edge effects | Resuspend cells thoroughly before dispensing; mix dilutions well; avoid or bracket edge wells with buffer. |
| Luminescence overflow or signal decay during the read | Plate read too soon after substrate addition | Wait at least 5 min after adding the substrate and read within the 5 min to 2 h stable window. |
| No displacement by known active ligands | Insufficient permeability or incubation time, or poor compound solubility | Increase the compound incubation time; confirm solubility and DMSO tolerance; verify compound identity and potency. |
| Poor curve fit or missing lower plateau | Dose range does not bracket the EC50 | Adjust the top concentration and/or dilution factor to span the expected EC50. |
| High background in the blank (column 12) | Phenol red or nonspecific fluorescence | Use Opti-MEM without phenol red throughout and confirm the correct control layout. |
Acknowledgments
This work was supported by FAPESP (Fundação de Amparo à Pesquisa do Estado de São Paulo; grant number: 2014/50897-0 and 2024/19473-0) and CNPq (Conselho Nacional de Desenvolvimento Científico e Tecnológico; grant number: 465651/2014-3). M.R.C. was the recipient of a FAPESP Postdoctoral fellowship (grant number: 2021/04853-4). This protocol was described and validated in Cunha et al. [33] Journal of Biological Chemistry (2023), DOI: 10.1016/j.jbc.2023.104807.
Author contributions
Conceptualization, Investigation, Writing—Original Draft, Writing—Review & Editing, M.R.C.; Investigation, Writing—Original Draft, C.M.C.C-P; Funding acquisition, K.B.M., R.M.C.; Supervision, R.M.C.
Competing interests
The authors declare no conflicts of interest.
Ethical considerations
This protocol uses the established human cell line HEK293T (American Type Culture Collection, CRL-3216), obtained from a commercial repository. It does not involve human participants, primary human tissue, identifiable personal data, or live vertebrate animals; therefore, approval by an ethics committee and informed consent were not required. HEK293T cells were handled under biosafety level 2 (BSL-2) containment in accordance with institutional biosafety guidelines.
References
- Schmiege, P., Fine, M., Blobel, G. and Li, X. (2017). Human TRPML1 channel structures in open and closed conformations. Nature. 550(7676): 366–370. https://doi.org/10.1038/nature24036
- Grimm, C., Butz, E., Chen, C. C., Wahl-Schott, C. and Biel, M. (2017). From mucolipidosis type IV to Ebola: TRPML and two-pore channels at the crossroads of endo-lysosomal trafficking and disease. Cell Calcium. 67: 148–155. https://doi.org/10.1016/j.ceca.2017.04.003
- Shen, D., Wang, X., Li, X., Zhang, X., Yao, Z., Dibble, S., Dong, X. p., Yu, T., Lieberman, A. P., Showalter, H. D., et al. (2012). Lipid storage disorders block lysosomal trafficking by inhibiting a TRP channel and lysosomal calcium release. Nat Commun. 3(1): e1038/ncomms1735. https://doi.org/10.1038/ncomms1735
- Yu, L., Zhang, X., Yang, Y., Li, D., Tang, K., Zhao, Z., He, W., Wang, C., Sahoo, N., Converso-Baran, K., et al. (2020). Small-molecule activation of lysosomal TRP channels ameliorates Duchenne muscular dystrophy in mouse models. Sci Adv. 6(6): eaaz2736. https://doi.org/10.1126/sciadv.aaz2736
- Capurro, M. I., Greenfield, L. K., Prashar, A., Xia, S., Abdullah, M., Wong, H., Zhong, X. Z., Bertaux-Skeirik, N., Chakrabarti, J., Siddiqui, I., et al. (2019). VacA generates a protective intracellular reservoir for Helicobacter pylori that is eliminated by activation of the lysosomal calcium channel TRPML1. Nat Microbiol. 4(8): 1411–1423. https://doi.org/10.1038/s41564-019-0441-6
- Xia, Z., Wang, L., Li, S., Tang, W., Sun, F., Wu, Y., Miao, L. and Cao, Z. (2020). ML-SA1, a selective TRPML agonist, inhibits DENV2 and ZIKV by promoting lysosomal acidification and protease activity. Antiviral Res. 182: 104922. https://doi.org/10.1016/j.antiviral.2020.104922
- Jung, J. and Venkatachalam, K. (2019). TRPML1 and RAS-driven cancers – exploring a link with great therapeutic potential. Channels. 13(1): 374–381. https://doi.org/10.1080/19336950.2019.1666457
- Jung, J., Cho, K., Naji, A. K., Clemons, K. N., Wong, C. O., Villanueva, M., Gregory, S., Karagas, N. E., Tan, L., Liang, H., et al. (2019). HRAS‐driven cancer cells are vulnerable to TRPML1 inhibition. EMBO Rep. 20(4): e201846685. https://doi.org/10.15252/embr.201846685
- Xu, M., Almasi, S., Yang, Y., Yan, C., Sterea, A. M., Rizvi Syeda, A. K., Shen, B., Richard Derek, C., Huang, P., Gujar, S., et al. (2019). The lysosomal TRPML1 channel regulates triple negative breast cancer development by promoting mTORC1 and purinergic signaling pathways. Cell Calcium. 79: 80–88. https://doi.org/10.1016/j.ceca.2019.02.010
- Rühl, P., Rosato, A. S., Urban, N., Gerndt, S., Tang, R., Abrahamian, C., Leser, C., Sheng, J., Jha, A., Vollmer, G., et al. (2021). Estradiol analogs attenuate autophagy, cell migration and invasion by direct and selective inhibition of TRPML1, independent of estrogen receptors. Sci Rep. 11(1): 8313. https://doi.org/10.1038/s41598-021-87817-4
- Siow, W. X., Kabiri, Y., Tang, R., Chao, Y. K., Plesch, E., Eberhagen, C., Flenkenthaler, F., Fröhlich, T., Bracher, F., Grimm, C., et al. (2022). Lysosomal TRPML1 regulates mitochondrial function in hepatocellular carcinoma cells. J Cell Sci. 135(6): e259455. https://doi.org/10.1242/jcs.259455
- Frey, N., Ouologuem, L., Blenninger, J., Siow, W. X., Thorn-Seshold, J., Stöckl, J., Abrahamian, C., Fröhlich, T., Vollmar, A. M., Grimm, C., et al. (2024). Endolysosomal TRPML1 channel regulates cancer cell migration by altering intracellular trafficking of E-cadherin and β1-integrin. J Biol Chem. 300(1): 105581. https://doi.org/10.1016/j.jbc.2023.105581
- Fan, C., Wu, H., Du, X., Li, C., Zeng, W., Qu, L. and Cang, C. (2024). Inhibition of lysosomal TRPML1 channel eliminates breast cancer stem cells by triggering ferroptosis. Cell Death Discovery. 10(1): 256. https://doi.org/10.1038/s41420-024-02026-y
- Zhang, H. L., Hu, B. X., Ye, Z. P., Li, Z. L., Liu, S., Zhong, W. Q., Du, T., Yang, D., Mai, J., Li, L. C., et al. (2024). TRPML1 triggers ferroptosis defense and is a potential therapeutic target in AKT-hyperactivated cancer. Sci Transl Med. 16(753): eadk0330. https://doi.org/10.1126/scitranslmed.adk0330
- Somogyi, A., Kirkham, E. D., Lloyd-Evans, E., Winston, J., Allen, N. D., Mackrill, J. J., Anderson, K. E., Hawkins, P. T., Gardiner, S. E., Waller-Evans, H., et al. (2023). The synthetic TRPML1 agonist ML-SA1 rescues Alzheimer-related alterations of the endosomal-autophagic-lysosomal system. J Cell Sci. 136(6): e259875. https://doi.org/10.1242/jcs.259875
- Plesch, E., Chen, C. C., Butz, E., Scotto Rosato, A., Krogsaeter, E. K., Yinan, H., Bartel, K., Keller, M., Robaa, D., Teupser, D., et al. (2018). Selective agonist of TRPML2 reveals direct role in chemokine release from innate immune cells. eLife. 7: e39720. https://doi.org/10.7554/elife.39720
- Grimm, C., Jörs, S., Saldanha, S. A., Obukhov, A. G., Pan, B., Oshima, K., Cuajungco, M. P., Chase, P., Hodder, P., Heller, S., et al. (2010). Small Molecule Activators of TRPML3. Chem Biol. 17(2): 135–148. https://doi.org/10.1016/j.chembiol.2009.12.016
- Liang, C. (n.d.). Aryl-sulfonamide and aryl-sulfone derivatives as TRPML modulators (Patent No. US 2020/0352921 A1).
- Liang, C. (n.d.). Piperazine derivatives as TRPML modulators (Patent No. WO 2018/005713 A1).
- Leser, C., Keller, M., Gerndt, S., Urban, N., Chen, C. C., Schaefer, M., Grimm, C. and Bracher, F. (2021). Chemical and pharmacological characterization of the TRPML calcium channel blockers ML-SI1 and ML-SI3. Eur J Med Chem. 210: 112966. https://doi.org/10.1016/j.ejmech.2020.112966
- Keeley, T. P., Siow, R. C. M., Jacob, R. and Mann, G. E. (2017). Reduced SERCA activity underlies dysregulation of Ca2+ homeostasis under atmospheric O2 levels. FASEB J. 32(5): 2531–2538. https://doi.org/10.1096/fj.201700685rrr
- Reeks, J., Mahajan, P., Clark, M., Cowan, S. R., Di Daniel, E., Earl, C. P., Fisher, S., Holvey, R. S., Jackson, S. M., Lloyd-Evans, E., et al. (2025). High throughput cryo-EM provides structural understanding for modulators of the lysosomal ion channel TRPML1. Structure. 33(8): 1374–1385.e7. https://doi.org/10.1016/j.str.2025.05.014
- Yang, Y., Teng, S., Zhang, Y., Ji, Y. H., Wang, H. and Tan, Z. Y. (2026). Lysosomal Ion Channel TRPML1 Contributes to Neuropathic Pain Associated With Diabetic Peripheral Neuropathy in Mice. Diabetes. 75(7): 1298–1306. https://doi.org/10.2337/db25-0901
- Ramos, P. Z., Catta-Preta, C. M. and Couñago, R. M. (2026). Target engagement in bacterial and protozoan pathogens: in vitro and cellular assays for drug discovery. Curr Opin Struct Biol. 96: 103194. https://doi.org/10.1016/j.sbi.2025.103194
- Coriano, C., Powell, E. and Xu, W. (2016). Monitoring Ligand-Activated Protein–Protein Interactions Using Bioluminescent Resonance Energy Transfer (BRET) Assay. In H. Zhu and M. Xia (Eds.). High-Throughput Screening Assays in Toxicology (Vol. 1473, pp. 3–15). New York, NY: Springer New York. https://doi.org/10.1007/978-1-4939-6346-1_1
- Capener, J. L., Schwalm, M. P., Vasta, J. D., Michaud, A., Teske, K. A., Marsiglia, W. M., Huber, K. V. M., Dar, A. C., Knapp, S., Axtman, A. D., et al. (2026). Advances in BRET probes for intracellular target engagement studies. Nat Chem Biol. 22(5): 691–701. https://doi.org/10.1038/s41589-025-02103-y
- Machleidt, T., Woodroofe, C. C., Schwinn, M. K., Méndez, J., Robers, M. B., Zimmerman, K., Otto, P., Daniels, D. L., Kirkland, T. A., Wood, K. V., et al. (2015). NanoBRET—A Novel BRET Platform for the Analysis of Protein–Protein Interactions. ACS Chem Biol. 10(8): 1797–1804. https://doi.org/10.1021/acschembio.5b00143
- Robers, M. B., Wilkinson, J. M., Vasta, J. D., Berger, L. M., Berger, B. T. and Knapp, S. (2021). Single tracer-based protocol for broad-spectrum kinase profiling in live cells with NanoBRET. STAR Protoc. 2(4): 100822. https://doi.org/10.1016/j.xpro.2021.100822
- Gan, N., Han, Y., Zeng, W., Wang, Y., Xue, J. and Jiang, Y. (2022). Structural mechanism of allosteric activation of TRPML1 by PI(3,5)P2 and rapamycin. Proc Natl Acad Sci USA. 119(7): e2120404119. https://doi.org/10.1073/pnas.2120404119
- Fine, M., Schmiege, P. and Li, X. (2018). Structural basis for PtdInsP2-mediated human TRPML1 regulation. Nat Commun. 9(1): 4192. https://doi.org/10.1038/s41467-018-06493-7
- Hall, M. P., Unch, J., Binkowski, B. F., Valley, M. P., Butler, B. L., Wood, M. G., Otto, P., Zimmerman, K., Vidugiris, G., Machleidt, T., et al. (2012). Engineered Luciferase Reporter from a Deep Sea Shrimp Utilizing a Novel Imidazopyrazinone Substrate. ACS Chem Biol. 7(11): 1848–1857. https://doi.org/10.1021/cb3002478
- Walker, J. R., Hall, M. P., Zimprich, C. A., Robers, M. B., Duellman, S. J., Machleidt, T., Rodriguez, J. and Zhou, W. (2017). Highly Potent Cell-Permeable and Impermeable NanoLuc Luciferase Inhibitors. ACS Chem Biol. 12(4): 1028–1037. https://doi.org/10.1021/acschembio.6b01129
- Cunha, M. R., Catta-Preta, C. M., Takarada, J. E., Moreira, G. A., Massirer, K. B. and Couñago, R. M. (2023). A novel BRET-based assay to investigate binding and residence time of unmodified ligands to the human lysosomal ion channel TRPML1 in intact cells. J Biol Chem. 299(6): 104807. https://doi.org/10.1016/j.jbc.2023.104807
- Dopfer, J., Vasta, J. D., Müller, S., Knapp, S., Robers, M. B. and Schwalm, M. P. (2024). tracerDB: a crowdsourced fluorescent tracer database for target engagement analysis. Nat Commun. 15(1): 5646. https://doi.org/10.1038/s41467-024-49896-5
- Vasta, J. D., Corona, C. R., Wilkinson, J., Zimprich, C. A., Hartnett, J. R., Ingold, M. R., Zimmerman, K., Machleidt, T., Kirkland, T. A., Huwiler, K. G., et al. (2018). Quantitative, Wide-Spectrum Kinase Profiling in Live Cells for Assessing the Effect of Cellular ATP on Target Engagement. Cell Chem Biol. 25(2): 206–214.e11. https://doi.org/10.1016/j.chembiol.2017.10.010
- Yung-Chi, C. and Prusoff, W. H. (1973). Relationship between the inhibition constant (KI) and the concentration of inhibitor which causes 50 per cent inhibition (I50) of an enzymatic reaction. Biochem Pharmacol. 22(23): 3099–3108. https://doi.org/10.1016/0006-2952(73)90196-2
- Zhang, J. H., Chung, T. D. and Oldenburg, K. R. (1999). A Simple Statistical Parameter for Use in Evaluation and Validation of High Throughput Screening Assays. SLAS Discovery. 4(2): 67–73. https://doi.org/10.1177/108705719900400206
- Cunha, M. R., Do Amaral, B. S., Takarada, J. E., Valderrama, G. V., Batista, A. N. L., Batista, J. M., Cass, Q. B., Couñago, R. M. and Massirer, K. B. (2024). (S)‐ML‐SA1 Activates Autophagy via TRPML1‐TFEB Pathway. ChemBioChem. 25(22): e202400506. https://doi.org/10.1002/cbic.202400506
- Coutant, E. P., Gagnot, G., Hervin, V., Baatallah, R., Goyard, S., Jacob, Y., Rose, T. and Janin, Y. L. (2020). Bioluminescence Profiling of NanoKAZ/NanoLuc Luciferase Using a Chemical Library of Coelenterazine Analogues. Chemistry A European J. 26(4): 948–958. https://doi.org/10.1002/chem.201904844
- Coutant, E. P., Goyard, S., Hervin, V., Gagnot, G., Baatallah, R., Jacob, Y., Rose, T. and Janin, Y. L. (2019). Gram-scale synthesis of luciferins derived from coelenterazine and original insights into their bioluminescence properties. Org Biomol Chem. 17(15): 3709–3713. https://doi.org/10.1039/c9ob00459a
Article Information
Publication history
Received: Jul 10, 2026
Accepted: Aug 10, 2026
Available online: Aug 28, 2026
Published: Sep 20, 2026
Copyright
© 2026 The Author(s); This is an open access article under the CC BY-NC license (https://creativecommons.org/licenses/by-nc/4.0/).
How to cite
Readers should cite both the Bio-protocol article and the original research article where this protocol was used:
- Cunha, M. R., Catta-Preta, C. M. C., Massirer, K. B. and Couñago, R. M. (2026). How to Perform a Tracer Displacement BRET Assay for the TRPML1 Ion Channel. Bio-protocol 16(18): e5820. DOI: 10.21769/BioProtoc.5820.
- Cunha, M. R., Catta-Preta, C. M., Takarada, J. E., Moreira, G. A., Massirer, K. B. and Couñago, R. M. (2023). A novel BRET-based assay to investigate binding and residence time of unmodified ligands to the human lysosomal ion channel TRPML1 in intact cells. J Biol Chem. 299(6): 104807. https://doi.org/10.1016/j.jbc.2023.104807

 Download Citation in RIS Format
Category
Biochemistry > Protein > Interaction > Protein-protein interaction
Cell Biology > Cell-based analysis > Drug screenings
Molecular Biology > Protein > Ion channel signaling
Do you have any questions about this protocol?
Post your question to gather feedback from the community. We will also invite the authors of this article to respond.
 Post a Question


