


- Protocols

- Articles and Issues
- For Authors
- About
- Become a Reviewer


Protecting Against Cytoplasmic Protein Aggregates With Cytoplasmic PML Variants

(*contributed equally to this work) Published: Vol 16, Iss 18, Sep 20, 2026 DOI: 10.21769/BioProtoc.5815 Views: 270
Reviewed by: Marion HoggSwetha MurthygowdaSravanthi S P Nadiminti
 PDF
PDF  Ask a question
Original research article
The authors used this protocol in:

Feb 2026

Protocol Collections
Comprehensive collections of detailed, peer-reviewed protocols focusing on specific topics




Related protocols
Abstract
Cytoplasmic protein aggregation is a defining feature of multiple neurodegenerative diseases, including amyotrophic lateral sclerosis, frontotemporal dementia, Huntington’s disease, and certain forms of motor neuron disease. Recent evidence indicates that promyelocytic leukemia protein (PML) and engineered PML-derived variants can act as versatile aggregate-remodeling factors. In particular, cytoplasmically redirected PML variants recognize pathological cytoplasmic inclusions and promote their clearance. Here, we describe a protocol to generate and validate two engineered cytoplasmic PML variants: full-length mPML, which is redirected to the cytoplasm by disruption of its nuclear localization sequence, and the truncated mPMLΔRBC variant, which lacks the RING, B-box, and coiled-coil domain but retains aggregate-reducing activity. The protocol integrates fluorescence-based imaging, bimolecular fluorescence complementation, detergent-soluble/insoluble fractionation, and validation in primary rat cortical neurons. This workflow provides a practical platform for assessing cytoplasmic aggregate burden and for comparing the aggregate-remodeling activities of PML-derived constructs. It can also be adapted to other disease-associated aggregation-prone proteins, including TDP-43, SOD1, FUS, tau, polyGA, and polyQ-expanded proteins.
Key features
• Describes the generation and validation of two complementary cytoplasmic PML variants: full-length mPML and truncated mPMLΔRBC.
• Provides fluorescence-based and BiFC-based assays to visualize pathological cytoplasmic protein assemblies.
• Includes detergent-soluble/insoluble fractionation for biochemical assessment of aggregate burden.
• Establishes a primary rat cortical neuron workflow to evaluate the effect of mPML on TDP-43-CTF aggregates.
• Can be adapted to other aggregation-prone proteins and additional PML-derived aggregate-remodeling candidates.
Keywords: PML Cytoplasmic protein aggregates
TDP-43
SOD1
Neurodegeneration
Aggregate clearance
Cytoplasmic protein aggregates
TDP-43
SOD1
Neurodegeneration
Aggregate clearance
Background
Pathological protein aggregation is a central molecular feature of many neurodegenerative diseases [1,2]. In amyotrophic lateral sclerosis and frontotemporal dementia, cytoplasmic inclusions containing TDP-43 are frequently observed [3]. Mutant SOD1 [4], FUS [5], polyGA dipeptide repeat proteins [6], and polyQ-expanded proteins [7] can also form cytoplasmic aggregates that interfere with cellular proteostasis and neuronal function [8].
Promyelocytic leukemia protein (PML) is best known as the principal scaffold of PML nuclear bodies and participates in transcriptional regulation [9], DNA damage responses [10], antiviral defense [11], senescence [12], and protein quality control [13]. Human PML isoform IV is a 633-amino-acid protein; its N-terminal region contains a RING finger, two B-box domains, and a coiled-coil region, collectively referred to as a tripartite motif. This motif mediates PML oligomerization and the assembly of higher-order protein complexes. The central region contains the nuclear localization sequence, whereas the C-terminal region is isoform-specific and contributes to the recruitment of distinct interacting proteins. Recent findings indicate that PML can also function as an aggregate-remodeling scaffold in protein quality control. PML recognizes protein inclusions and promotes their remodeling by recruiting molecular chaperones, including DnaJB1, together with proteasome-associated factors. These recruited components facilitate the disassembly of aggregate structures and the subsequent proteasome-dependent removal of aggregate material [14]. Thus, PML reduces aggregate burden through both direct aggregate remodeling and the coordinated recruitment of cellular protein quality-control machinery. Although native PML is predominantly localized in the nucleus, cytoplasmic PML variants derived from PML isoform IV can be generated by disrupting its nuclear localization sequence. In this protocol, human PML isoform IV was amplified from a plasmid purchased from Miaoling Biology (catalog number: P40666). Substitution of arginine 486 and lysine 487 with alanine redirects full-length PML to the cytoplasm, generating the mPML variant shown in Figure 1.
This protocol focuses on two engineered cytoplasmic PML variants:
1. mPML, a full-length cytoplasmic PML isoform IV variant containing the R486A and K487A substitutions within its nuclear localization sequence.
2. mPMLΔRBC, a truncated cytoplasmic variant containing residues 395–633 of PML isoform IV. This construct lacks the N-terminal RING finger, B-box, and coiled-coil regions but retains the central and C-terminal portions of PML, including the isoform-specific C-terminal region. Despite its reduced size, mPMLΔRBC retains aggregate-reducing activity and decreases detergent-insoluble TDP-43-CTF and SOD1-G93A species.
The experimental workflow includes construct generation, expression and localization validation, fluorescence-based measurement of aggregate burden in HEK293T cells, biochemical separation of detergent-soluble and detergent-insoluble fractions, and validation of mPML activity against TDP-43-CTF aggregates in primary rat cortical neurons. The protocol can also be adapted to evaluate other aggregation-prone proteins or to screen additional PML-derived aggregate-remodeling candidates.
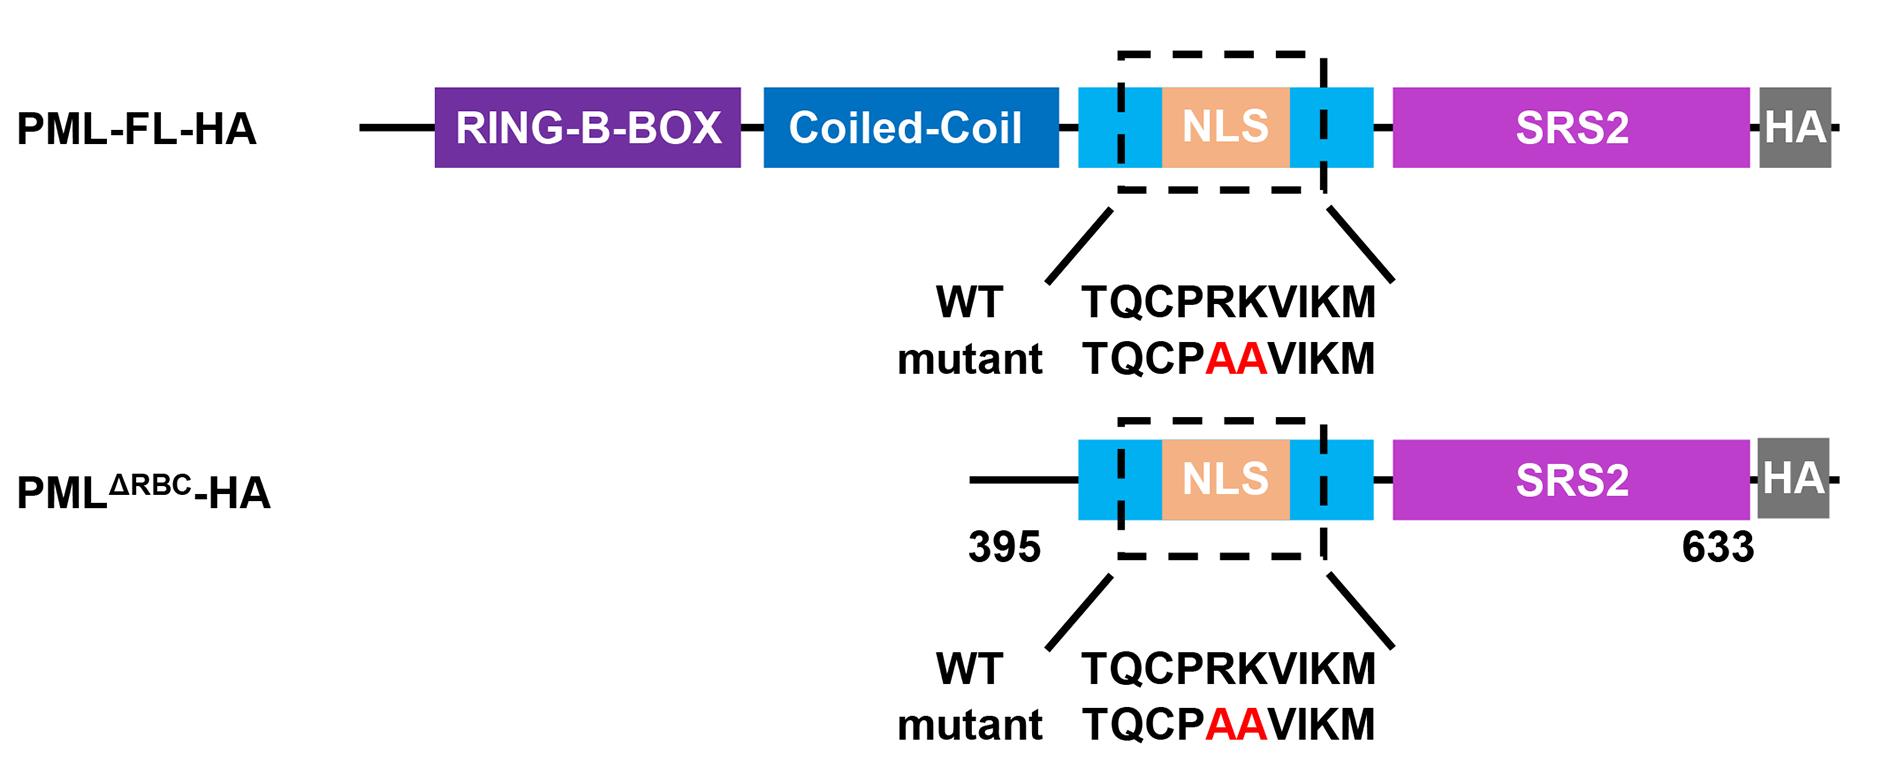
Figure 1. Illustration of promyelocytic leukemia protein (PML) variants. Schematic representation of full-length human PML isoform IV and the truncated PMLΔRBC construct. The N-terminal RING finger, B-box, and coiled-coil regions, the nuclear localization sequence (NLS), the isoform-specific C-terminal region, and the HA tag are indicated. The R486A and K487A substitutions used to generate the cytoplasmic mPML and mPMLΔRBC variants are also shown.
Materials and reagents
Biological materials
1. HEK293T cells (Shanghai Cell Bank, Type Culture Collection Committee; GNHu17)
2. Mouse primary cortical neurons
Plasmids
Note: All plasmids described in this protocol are available from the corresponding authors upon reasonable request.
1. Cytoplasmic PML variant–related plasmids:
a. p23 mPML-HA (you must clone): Expresses cytoplasmically localized PML fused with an HA tag. You can clone the coding sequence of PML into the p23-HA backbone by Gibson assembly. To promote the cytoplasmic location of PML, you can mutate the arginine 486 residue and lysine 487 residue into alanine by site-directed mutagenesis.
Note: Digesting the PCR products with DpnI to eliminate the template plasmid can improve the efficiency of plasmid construction.
b. p23 mPMLΔRBC-HA (you must clone): This construct expresses a cytoplasmically localized truncated PML fragment fused with an HA tag. To obtain the truncated PML, you can amplify the coding sequence corresponding to residues 395–633 of mPML by PCR and insert it into the p23-HA backbone by Gibson assembly.
c. pAAV-mPML-HA (you must clone): An adeno-associated virus (AAV) vector can be used to express cytoplasm-localized PML. You can clone the coding sequence of mPML and insert it into the pAAV-HA backbone by Gibson assembly.
2. Cytoplasmic protein aggregate–related plasmids:
a. pcDNA3.1-Flag-TDP-43-CTF-mNeon-NES (you must clone): This construct expresses the C-terminal fragment of TDP-43 (208-414 residues), fused with N-terminal Flag tag and mNeonGreen (mNeo) fluorescent reporter. To ensure the formation of cytoplasmic protein aggregates, the sequence is C-terminal-fused with a nuclear export signal (NES). You can amplify the coding sequences corresponding to residues 208–414 of TDP-43 with an N-terminal Flag tag by PCR. In parallel, the coding sequence of mNeonGreen is amplified by PCR with a C-terminal NES sequence. The Flag-TDP-43 (208–414 residues) fragment and the mNeonGreen-NES fragment are then inserted into the pcDNA3.1 backbone by Gibson assembly.
b. pcDNA3.1-Flag-SOD1-G93A-mNeon (you must clone): This construct expresses the SOD1-G93A mutant, which is fused with an N-terminal Flag tag and an mNeonGreen reporter. You can amplify the coding sequence of SOD1 with an N-terminal Flag tag by PCR. Simultaneously, you can amplify the coding sequence of mNeonGreen by PCR and then insert these two sequences into the pcDNA3.1 backbone by Gibson assembly. Eventually, you can mutate the glycine 93 residue into alanine by site-directed mutagenesis.
c. pcDNA3.1-VN-SOD1-G93A and pcDNA3.1-VC-SOD1-G93A (you must clone): A bimolecular fluorescence complementation (BiFC) system can be used to visualize SOD1-G93A aggregation by fluorescence imaging. To generate these constructs, amplify the coding sequence of SOD1-G93A and fuse it separately to the N-terminal fragment of Venus (VN) and the C-terminal fragment of Venus (VC). Insert the resulting VN-SOD1-G93A and VC-SOD1-G93A fragments into the pcDNA3.1 backbone by Gibson assembly. The VN and VC fragments can be amplified from the pT2-Venus plasmid (Miaoling Biology, catalog number: P0189).
d. pAAV- Flag-TDP-43-CTF-mNeon-NES (you must clone): An adeno-associated virus (AAV) vector can be used to express the Flag-tagged TDP-43-CTF. You can clone the coding sequence of Flag-TDP-43-CTF-mNeon-NES and insert it into the pAAV backbone by Gibson assembly.
Reagents
1. Dulbecco's modified Eagle medium (DMEM), high glucose (BasalMedia, catalog number: L110KJ)
2. NeurobasalTM medium (Thermo Fisher, catalog number: 21103049)
3. Fetal bovine serum (FBS), heat-inactivated (Lonsera, catalog number: S711-001S)
4. Penicillin-streptomycin (Beyotime, catalog number: C0222)
5. Dulbecco’s phosphate-buffered saline (D-PBS), Ca2+/Mg2+-free (Procell, catalog number: PB180329)
6. Trypsin-EDTA (Thermo Fisher, catalog number: 25200072)
7. Opti-MEM (BasalMedia, catalog number: L530KJ)
8. Polyethylenimine (PEI) (YEASEN, catalog number: 40816ES02)
9. B-27 supplement (Thermo Fisher, catalog number: A3582801)
10. L-glutamine (Thermo Fisher, catalog number: 25030081)
11. Poly-D-lysine (Beyotime, catalog number: C0312)
12. HBSS (Procell, catalog number: PB180323)
13. DNase I (Beyotime, catalog number: D7076)
14. Protease inhibitor cocktail (YEASEN, catalog number: 20124ES10)
15. D-PBS (Sangon Biotech, catalog number: E607009)
16. 5× SDS (Beyotime, catalog number: P0015)
17. Immunofluorescence related reagents:
a. Paraformaldehyde (PFA), 4% in D-PBS (Sigma-Aldrich, catalog number: 16005)
b. Triton X-100 (Sigma-Aldrich, catalog number: T8787)
c. Bovine serum albumin (BSA) (Sangon, catalog number: A500023)
d. Rabbit anti-HA tag antibody (Proteintech, catalog number: 51064-2-AP)
e. CoraLite488-conjugated goat anti-rabbit IgG(H+L) (Proteintech, catalog number: SA00013-2)
f. DAPI (Beyotime, catalog number: C1002)
g. Antifade mounting medium (Vectorlabs, catalog number: H-1900-10)
Solutions
1. RIPA I lysis buffer (see Recipes)
2. 2% BSA (see Recipes)
3. 0.5% PBST (see Recipes)
4. Neurobasal medium (see Recipes)
Recipes
1. RIPA I lysis buffer
| Reagent | Final concentration | Quantity or volume (for 50 mL) |
|---|---|---|
| NP40 | 1% | 0.5 mL |
| CHAPS | 0.5% | 0.25 g |
| SDS (10%) | 0.1% | 0.5 mL |
| NaCl | 150 mM | 0.435 g |
| Tris-HCl (pH 7.4, 1 M) | 50 mM | 2.5 mL |
| Protease inhibitor cocktail (100×) | 1× (add before use) | 500 μL |
Note: Add protease inhibitor cocktail immediately before use and keep the buffer on ice during cell lysis.
2. 2% BSA
| Reagent | Final concentration | Quantity or volume (for 50 mL) |
|---|---|---|
| BSA | 2% | 1 g |
| D-PBS | 1× | 50 mL |
3. 0.5% PBST
| Reagent | Final concentration | Quantity or volume (for 50 mL) |
|---|---|---|
| Triton X-100 | 0.5% | 250 μL |
| D-PBS | 1× | 50 mL |
4. Neurobasal medium
| Reagent | Final concentration | Quantity or volume (for 40 mL) |
|---|---|---|
| NeurobasalTM medium | 96.75% | 38.7 mL |
| Glutamine (200 mM) | 500 μM | 100 μL |
| B-27 | 2% | 800 μL |
| Penicillin-streptomycin | 1% | 400 μL |
Laboratory supplies
1. Cell culture multi-well plates (e.g., 12-well plate) (BIOFIL, catalog number: TCP011012)
2. 1.5 mL Eppendorf tubes (Sangon, catalog number: F607620-9001)
3. 50 mL centrifuge tube (BIOFIL, catalog number: CFT011500)
4. Cell coverslips for 12-well plate (WHB, catalog number: WHB-12-CS)
5. Cell counting chamber slides (Marienfeld, catalog number: 0650010)
6. 10 μL pipette tips (LAIBOER, catalog number: 1100103)
7. 200 μL pipette tips (LAIBOER, catalog number: 1102002)
8. 1 mL pipette tips (LAIBOER, catalog number: 1110004)
Equipment
1. Biological safety cabinet (The Baker Company, model: SG604-INT)
2. Cell incubator (Thermo, model: 371)
3. Inverted microscope (objectives: 4×, 10×, 20×) (yuehe, model: YHF40)
4. Laboratory centrifuge with rotors for 15 and 50 mL conical tubes (Eppendorf, model: 5702)
5. FinnpipetteTM F2 GLP Pipetting kit 2
6. Pipette (Fisher Scientific, catalog number: NC0085685)
7. Cell counter (Counter star, model: Mira BF)
8. Liquid carbon dioxide (CO2) tank
9. Vacuum aspirator (Yuwell, model: 7A-23D)
10. Refrigerated microcentrifuge (Eppendorf, model: 5424R)
11. Fluorescence stereomicroscope (Olympus, model: SZX16)
12. Confocal microscope (Andor, model: Dragonfly 200)
Procedure
This protocol describes the use of cytoplasmically localized PML variants to eliminate cytoplasmic protein aggregates. The procedure includes validation of the subcellular localization of two mPML variants, the full-length mPML and its truncated form mPMLΔRBC, which lacks the N-terminal RING-B-BOX and coiled-coil domains; characterization of two representative cytoplasmic protein aggregates, TDP-43-CTF and SOD1-G93A; and a method for isolating protein aggregates from cell lysates. In addition, we describe how to evaluate the clearance efficiency of mPML in mouse primary neurons. This protocol can also be adapted for use with other cytoplasmic protein aggregates.
A. Validation of the cytoplasmic location of mPML, mPMLΔRBC, and several protein aggregates
1. (Day 1) Coverslip preparation and cell seeding
a. Immerse the coverslips in 50 μg/mL poly-D-lysine solution for 30 min at 4 °C.
b. Take out the coverslips and wash twice with D-PBS.
c. Place the pre-treated coverslips into six wells of a 12-well plate and seed 5 × 10⁵ HEK293T cells onto each coverslip.
2. (Day 2) Transfection of plasmids
a. When the cells reach approximately 80% confluence, transfect each well with one of the following plasmids (Figures 1A and 2A): p23 PML-HA, p23 mPML-HA, p23 PMLΔRBC-HA, p23 mPMLΔRBC-HA, pcDNA3.1-Flag-TDP-43-CTF-mNeon-NES, or pcDNA3.1-Flag-SOD1-G93A-mNeon.
b. Use 500 ng of plasmid DNA per well.
c. Perform transfection using PEI (1 mg/mL stock) at a PEI:DNA mass ratio of 3:1 within Opti-MEM. For 500 ng of DNA, use 1.5 μL of PEI.
d. Replace the culture medium 6–8 h after transfection.
3. (Day 4) Expression and subcellular localization analysis of the proteins
a. Carefully remove the culture medium and wash the samples once with 500 μL of D-PBS.
b. Remove the D-PBS and add 500 μL of 4% PFA to each well. Fix the samples on ice for 15 min. Handle and aspirate PFA in a certified chemical fume hood and collect the waste according to institutional hazardous-waste procedures.
c. Remove the 4% PFA and wash the samples three times with 500 μL of D-PBS for 5 min each.
d. Aspirate the D-PBS and add 500 μL of 0.5% PBST to permeabilize the samples at room temperature for 20 min.
e. Remove the 0.5% PBST and wash the samples three times with 500 μL of D-PBS for 5 min each.
f. Remove the D-PBS and add 250 μL of 2% BSA to block the samples at room temperature for 1 h.
g. Remove the 2% BSA and dilute the rabbit anti-HA primary antibody in 2% BSA at a 1:100 dilution. Add 250 μL of the diluted primary antibody to each well and incubate at room temperature for 1 h or overnight at 4 °C.
h. Remove the primary antibody and wash the samples three times with 500 μL of D-PBS for 5 min each.
i. Remove the D-PBS and dilute Alexa Fluor 488-conjugated anti-rabbit secondary antibody in 2% BSA at a 1:200 dilution. Add 250 μL of the diluted secondary antibody to each well and incubate at room temperature for 1 h.
j. Remove the secondary antibody and wash the samples three times with 500 μL of D-PBS for 5 min each.
k. Remove the D-PBS, add 500 μL of 2.5 μg/mL DAPI solution to each well, and incubate at room temperature for 10 min.
l. Remove the DAPI solution and wash the samples three times with 500 μL of D-PBS for 5 min each.
m. Add 20 μL of antifade mounting medium to the slide and carefully mount the coverslip. Seal the edges with nail polish.
n. Observe the samples under a confocal fluorescence microscope (Figure 2).
Note: Aggregate formation can be initially assessed by fluorescence microscopy. TDP-43-CTF aggregates appear as discrete, high-intensity cytoplasmic inclusions. The aggregate formation can also be further validated by detergent-soluble/insoluble fractionation followed by western blot analysis.
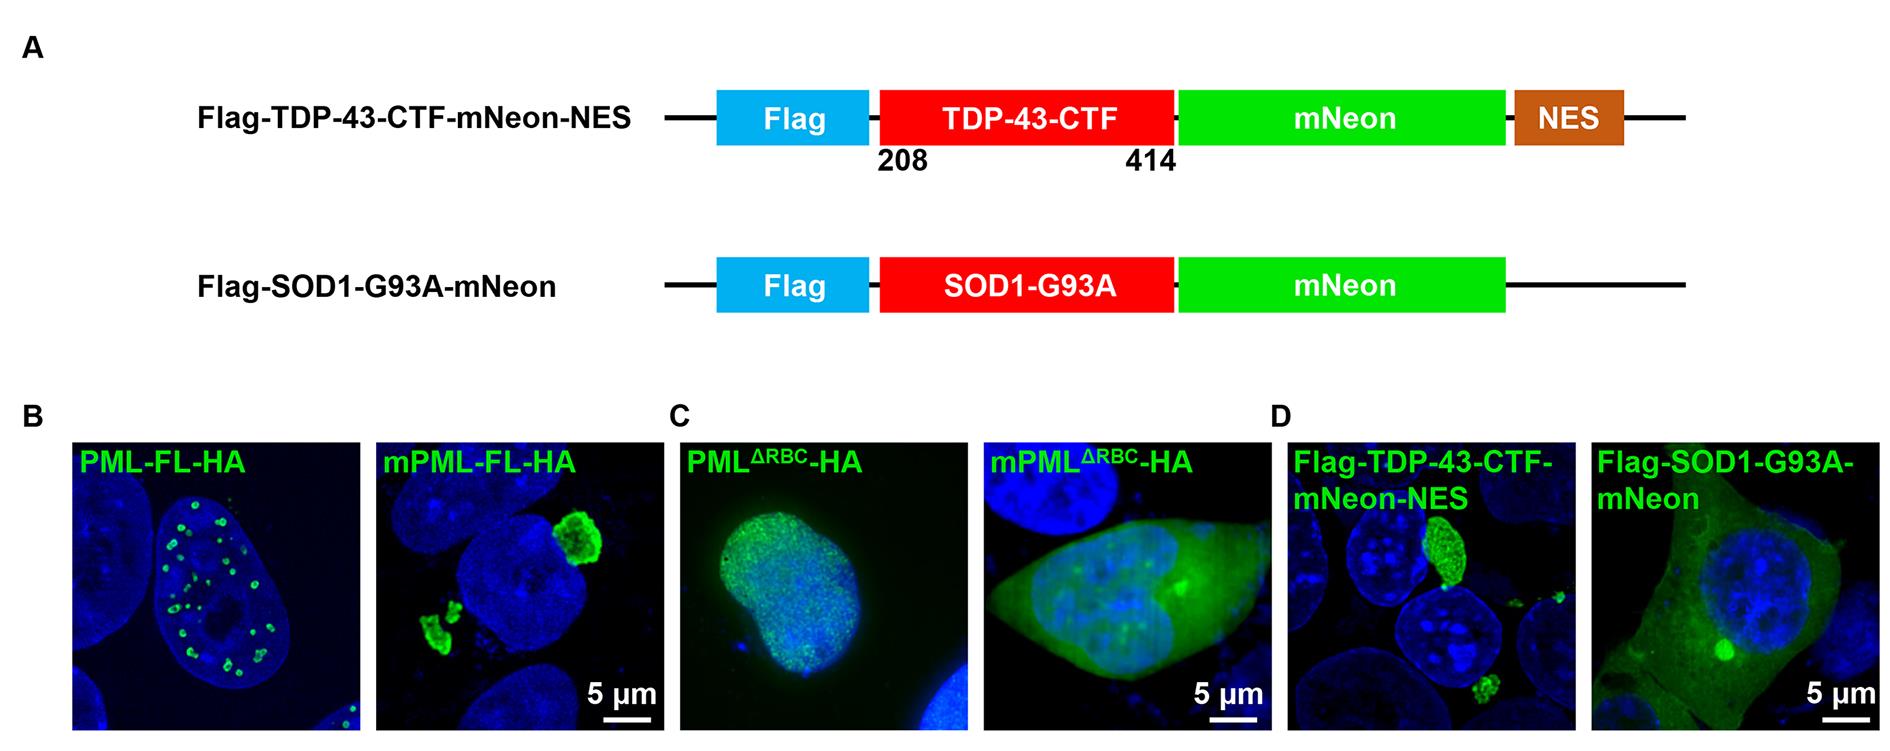
Figure 2. Cytoplasmically localized mPML variants and protein aggregates. (A) Schematic of two classical cytoplasmically localized protein aggregates: Flag-tagged TDP-43 C-terminal fragment (TDP-43-CTF) fused with mNeonGreen (mNeon) and nuclear export signal (NES), and flag-tagged SOD1-G93A fused with mNeon. (B, C) Representative immunofluorescence images of wild-type (WT) or nuclear localization sequence (NLS) mutant full-length and truncated promyelocytic leukemia protein (PML). Proteins were detected by HA tags. (D) Representative fluorescence images of cytoplasmically localized protein aggregates generated by TDP-43-CTF and SOD1-G93A.
B. Validation of the aggregate-clearance effect of mPML variants by fluorescence images
1. (Day 1) Coverslip preparation and cell seeding
a. Immerse the coverslips in 50 μg/mL poly-D-lysine solution for 30 min at 4 °C.
b. Remove the coverslips and wash twice with PBS.
c. Place the pre-treated coverslips into three wells of a 12-well plate and seed 5 × 10⁵ HEK293T cells onto each coverslip.
2. (Day 2) Transfection of plasmids
a. When the cells reach approximately 80% confluence, transfect each well with 500 ng of pcDNA3.1-Flag-TDP-43-CTF-mNeon-NES together with 500 ng of p23-HA empty vector, p23-mPML-HA, or p23-mPMLΔRBC-HA at a 1:1 mass ratio. For the SOD1-G93A bimolecular fluorescence complementation (BiFC) assay, use 250 ng of pcDNA3.1-VN-SOD1-G93A and 250 ng of pcDNA3.1-VC-SOD1-G93A, together with 500 ng of p23-HA empty vector or p23-mPML-HA.
Note: You can evaluate the clearance effect by adjusting the transfection ratio. Under standard conditions, a 1:2 ratio is sufficient, and a 1:4 mass ratio can also be used to obtain a stronger clearance effect.
b. Replace the culture medium 6–8 h after transfection.
3. (Day 4) Evaluate the aggregate-clearance effect by fluorescence images
a. Preparation of slides:
i. Aspirate the culture medium and wash the samples once with 500 μL of D-PBS.
ii. Remove the D-PBS and add 500 μL of 4% PFA. Fix the samples on ice for 15 min.
iii. Remove the 4% PFA and wash the samples three times with 500 μL of D-PBS for 5 min each.
iv. Remove the D-PBS and add 500 μL of 0.5% PBST to permeabilize the samples at room temperature for 20 min.
v. Remove the PBST and wash the samples three times with 500 μL of D-PBS for 5 min each.
vi. Aspirate the D-PBS and add 500 μL of 2.5 μg/mL DAPI solution to each well. Incubate at room temperature for 10 min.
vii. Remove the DAPI solution and wash the samples three times with 500 μL of D-PBS for 5 min each.
viii. Add 20 μL of antifade mounting medium onto the slide and carefully mount the coverslip. Seal the edges with nail polish.
ix. Observe the samples under a confocal fluorescence microscope (Figure 3).
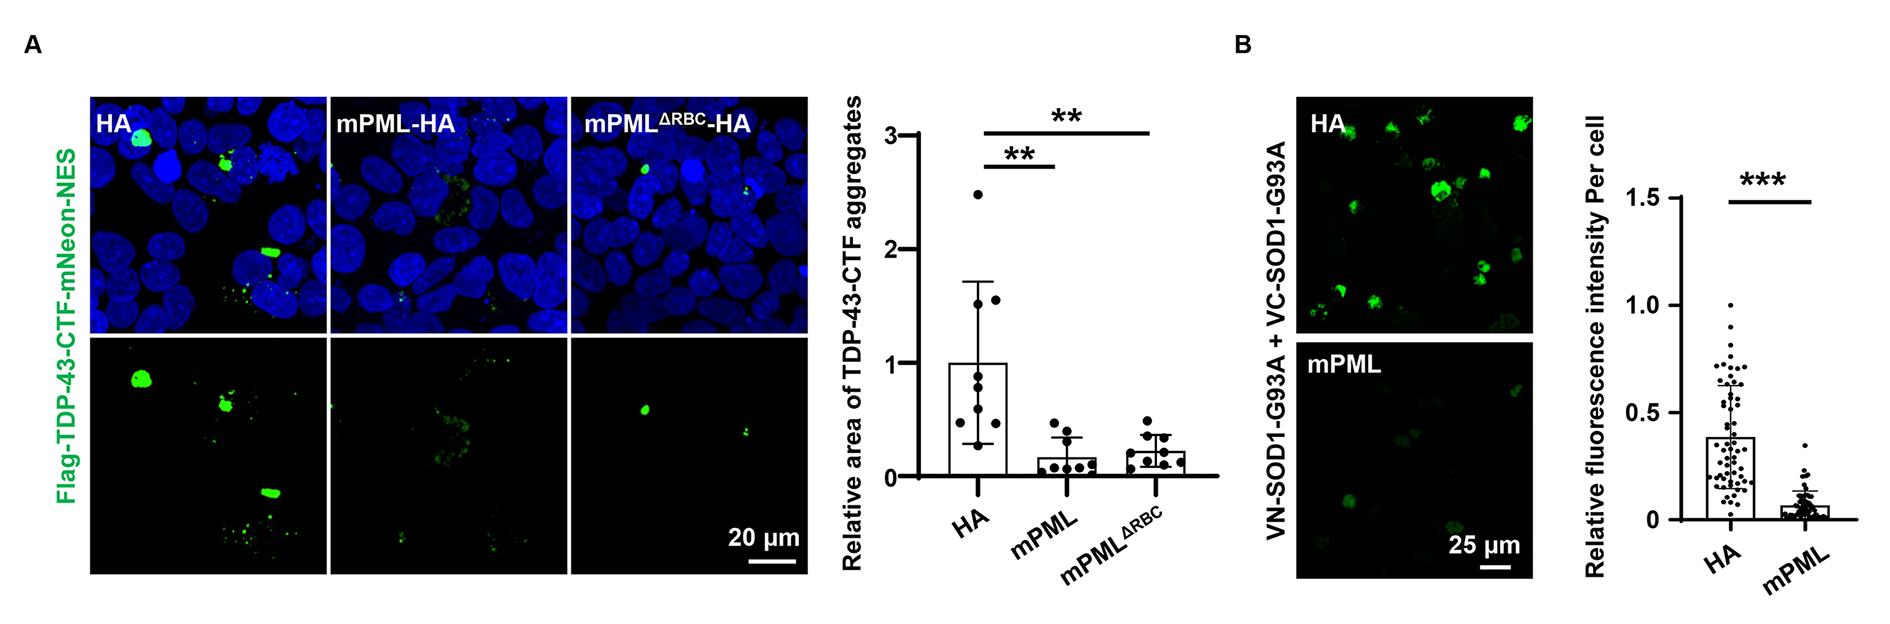
Figure 3. mPML variants promote the clearance of TDP-43-CTF aggregates. (A) Representative fluorescence images (left) and quantification (right) of TDP-43-CTF-mNeon aggregates co-expressed with HA, mPML-HA, or mPMLΔRBC-HA. Data are presented as mean ± S.D. (n = 9 fields per group, three independent experiments). Statistical significance was determined using a two-tailed unpaired Student’s t-test. **p < 0.01. (B) Representative fluorescence images (left) and quantification (right) of SOD1-G93A-Venus co-expressed with HA and mPML-HA. (n = 60 cells per group, from three independent experiments). Statistical significance was determined using a two-tailed unpaired Student’s t-test. ***p < 0.001.
b. Analysis of fluorescence images:
i. Open the fluorescence images in ImageJ and split the channels.
ii. Select the channel corresponding to the protein aggregates. Apply thresholding using Auto Threshold: Yen dark, then set the background to black.
iii. Convert the thresholded image to a binary mask.
iv. Measure the aggregate-positive area and calculate the aggregate area fraction as the ratio of the aggregate-positive area to the total image area.
v. Select the channel corresponding to DAPI signaling. Apply thresholding using Auto Threshold: Otsu dark, then set the background to black.
vi. Convert the thresholded image to a binary mask.
vii. Measure the DAPI-positive area and calculate the DAPI area fraction as the ratio of the DAPI-positive area to the total image area.
viii. Calculate the aggregate-to-DAPI ratio (as aggregate abundance normalized by cell number) by dividing the aggregate area fraction by the DAPI area fraction.
ix. Compare the aggregate abundance among groups (Figure 3).
Note: The aggregate-to-DAPI ratio is used as an approximation of aggregate abundance normalized to cell number. For reliable quantification, images should be acquired using identical microscope settings across all groups.
C. Separation and detection of the protein aggregates
1. (Day 1) Preparation of cells: Seed 5 × 10⁵ HEK293T cells per well in a 12-well plate.
2. (Day 2) Transfection of plasmids
a. When the cells reach 80% confluence, transfect each well with 500 ng of pcDNA3.1-Flag-TDP-43-CTF-mNeon-NES plasmids together with an equal amount of the following plasmids: p23-HA empty vector, p23 mPML-HA, and p23 mPMLΔRBC-HA.
Note: You can also evaluate the clearance effect by adjusting the transfection ratio.
b. Replace the culture medium 6–8 h after transfection.
3. (Day 4) Separation of soluble and insoluble fractions from HEK293T cells
a. Aspirate the culture medium carefully using a vacuum aspirator.
b. Wash the cells once with 500 μL of ice-cold D-PBS.
c. Remove the D-PBS completely.
d. Add 200 μL of ice-cold RIPA I lysis buffer to each well and incubate the plate on ice for 10 min.
e. Transfer the cell lysate carefully to a clean 1.5 mL microcentrifuge tube using a pipette.
f. Sonicate the lysate in an ice-water bath with a 10 s on/10 s off cycle for three cycles. The lysate should become clear and less viscous.
g. Centrifuge the tube at 20,000× g for 15 min at 4 °C.
h. Check the pellet at the bottom of the tube.
i. Carefully transfer the supernatant (as the soluble fraction) to a new microcentrifuge tube, taking care not to disturb the pellet.
j. Add 200 μL of ice-cold D-PBS to the pellet-containing tube and gently resuspend the pellet by pipetting.
k. Centrifuge the tube again at 20,000× g for 15 min at 4 °C.
l. Detect the pellet under a fluorescence microscope (Figure 4A, B) and analyze the separated fractions by western blot (Figure 4C, D). After centrifugation, resuspend the pellet in a small defined volume of D-PBS and transfer to a glass-bottom dish or microscope slide for fluorescence observation using identical exposure settings. For immunoblotting, mix the soluble supernatant with 5× SDS sample buffer to 1×, while the washed pellet is resuspended directly in 1× SDS sample buffer, heated, and homogenized before loading. Equivalent fractions derived from the same initial cell number are loaded for comparison.
Note: You can also apply this procedure to other protein aggregates, such as SOD1-G93A, and evaluate the aggregate-clearance efficiency of mPML variants (Figure 4E).
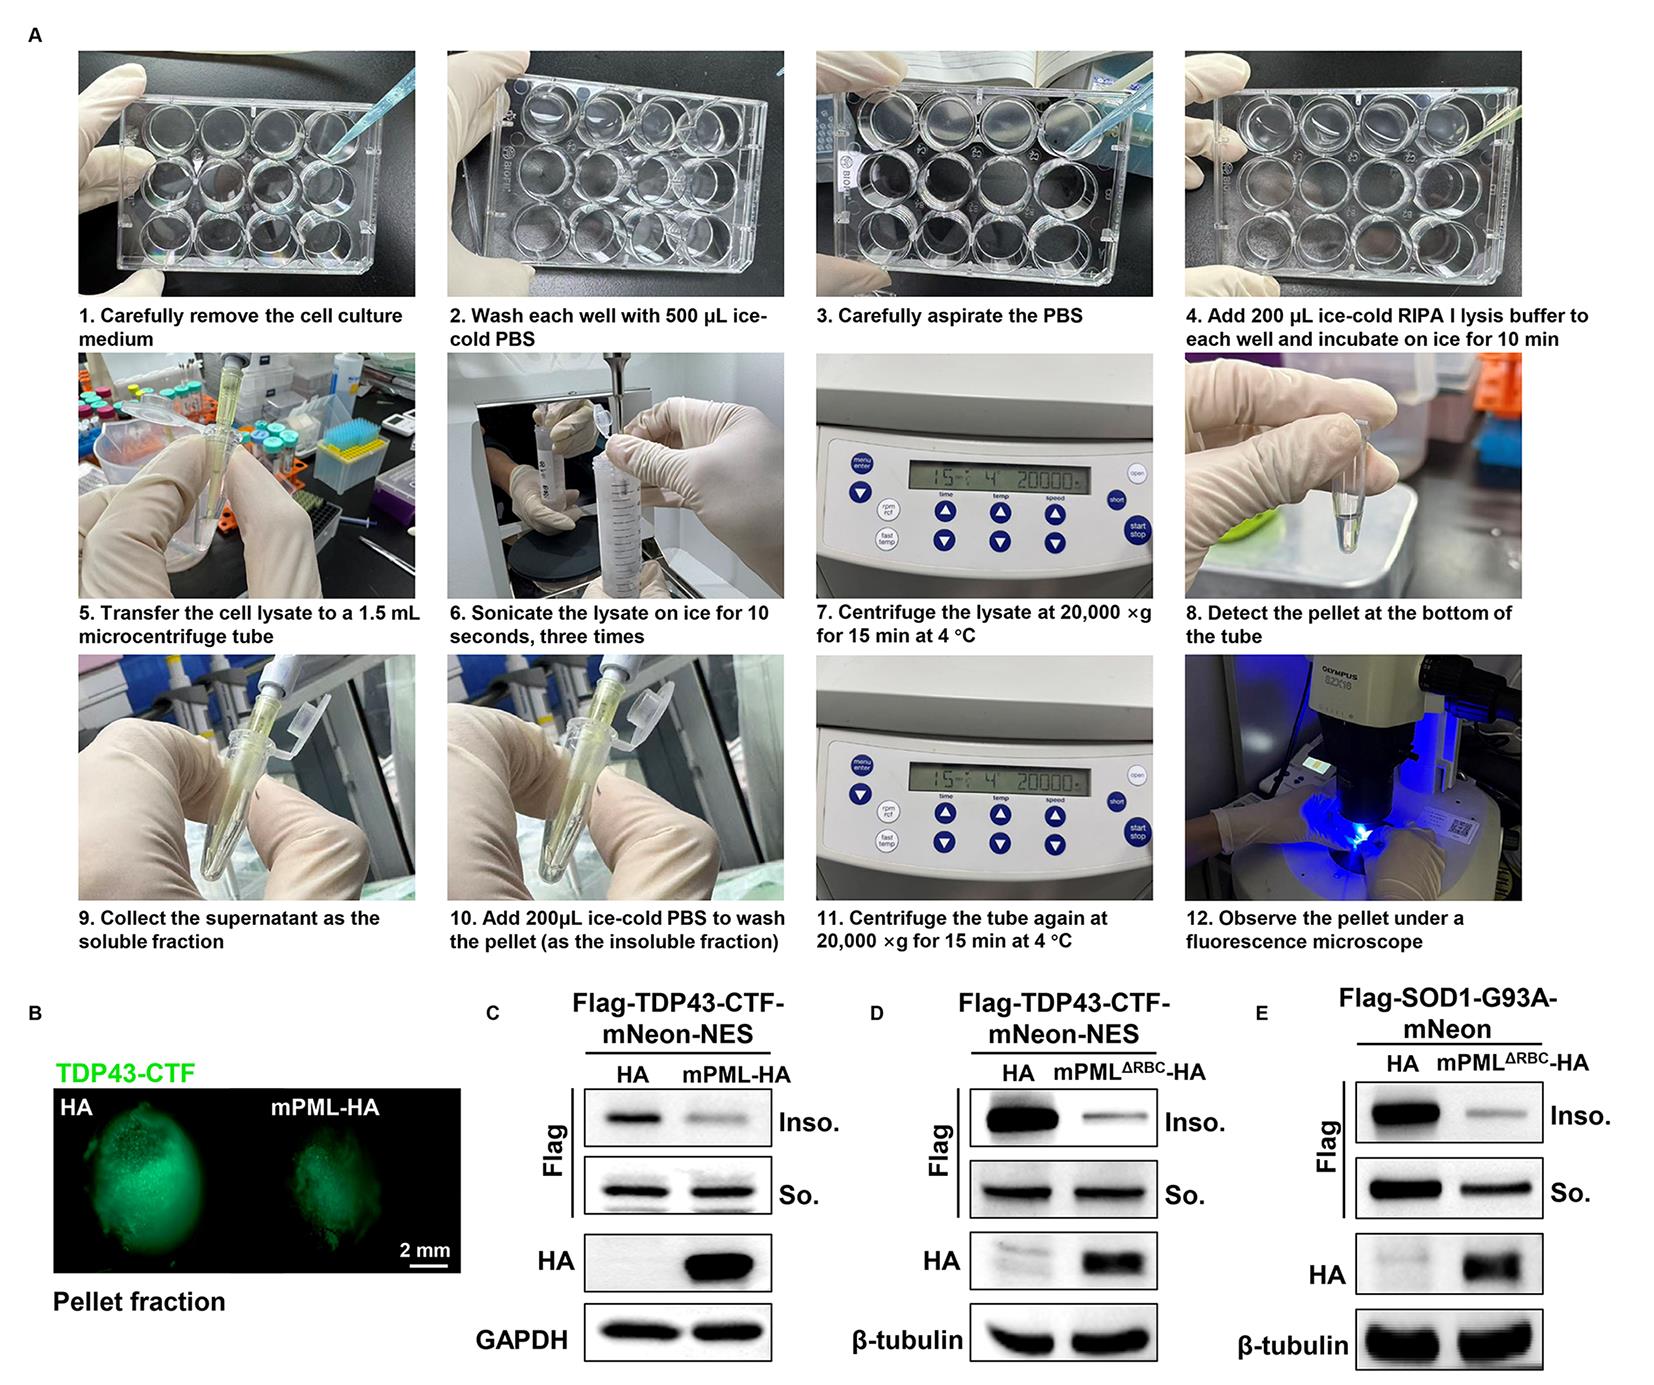
Figure 4. Separation and validation of the aggregate-clearance effect of mPML variants. (A) Schematic of the separation of soluble and insoluble fractions from cell lysates. (B) Representative fluorescence images of the pellet fraction from HEK293T cells expressing TDP-43-CTF-mNeon with HA or mPML-HA. (C) Immunoblot of Flag-TDP-43-CTF-mNeon-NES in lysate fractions from HEK293T cells with or without mPML-HA. (D) Immunoblot of Flag-TDP-43-CTF-mNeon-NES in lysate fractions from HEK293T cells with or without mPMLΔRBC-HA. (E) Immunoblot of Flag-SOD1-G93A-mNeon in lysate fractions from HEK293T cells with or without mPMLΔRBC-HA.
D. Validation of the aggregate-clearance effect of mPML in mouse primary neurons
1. (Day 0) Coating of tissue culture dishes
a. Prepare Poly-D-lysine working solution by diluting the stock to a final concentration of 0.1 mg/mL in sterile distilled water.
b. Place glass coverslips into the wells of 12-well tissue culture plates (one coverslip per well). Add 1 mL of PLL solution (0.1 mg/mL) to each well.
c. Incubate the plates at 37 °C for 6 h (or overnight).
d. Aspirate the PLL solution completely and wash each well three times with 1 mL of D-PBS per wash. Aspirate thoroughly after the final wash.
2. (Day 1) Isolation and plating of primary cortical neurons (Figure 5A)
a. Animal preparation and brain dissection:
i. Neonatal rats (P0–P1, within 24 h of birth) are used as the source of cortical tissue. Euthanize neonatal rats by rapid decapitation following isoflurane anesthesia or CO2 asphyxiation. Disinfect the head with 75% ethanol.
ii. Using fine scissors, make an initial cut at the level of the eyes to open the skull, then extend the cut along the sagittal midline to fully expose the brain. Carefully remove the brain from the skull using a spatula and transfer it into ice-cold HBSS.
iii. Use a fine brush to gently remove meninges and superficial blood vessels from the brain surface. Using forceps and a spatula, dissect the cerebral cortex from each brain hemisphere. Transfer the isolated cortices into a dish containing cold D-PBS with penicillin-streptomycin (1%).
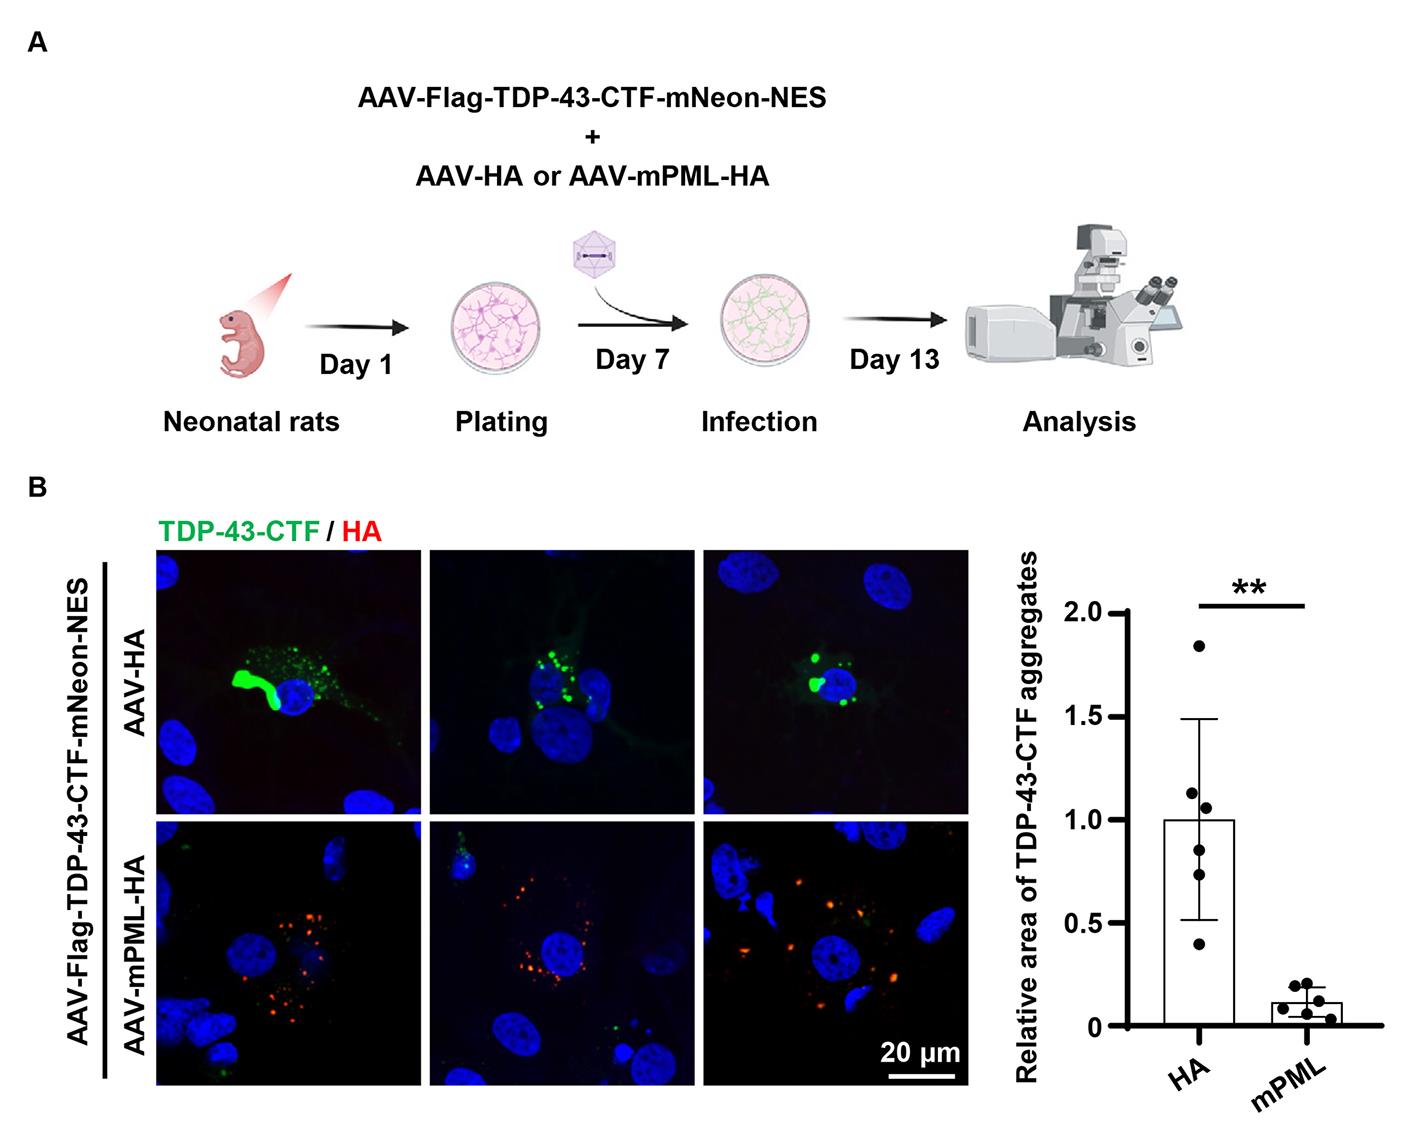
Figure 5. Validation of the aggregate-clearance effect of mPML in rat primary neurons. (A) Schematic of the primary neuron assay. (B) Representative immunofluorescence images (left) and quantification (right) of primary neurons infected with adeno-associated viruses (AAVs) expressing TDP-43-CTF-mNeon with HA or PML-HA. The promyelocytic leukemia protein (PML) was detected by HA-tag. Data are presented as mean ± S.D. (n = 6 fields per group, three independent experiments). Statistical significance was determined using a two-tailed unpaired Student’s t-test. **p < 0.01.
b. Enzymatic digestion and tissue trituration:
i. Pool cortices from 3–4 pups into a single 15 mL conical tube containing 5 mL of 0.1% trypsin-EDTA and 0.05 mg/mL Dnase I. Incubate at 37 °C for 3–4 min for pre-digestion.
ii. Transfer all cortical tissue to a 6-well plate containing the trypsin solution. Mince the tissue finely using sterile scissors until the tissue is reduced to small fragments (~1 mm3).
iii. Transfer the minced tissue back to the 15 mL conical tube. Add 5 mL of DMEM (supplemented with 10% FBS and 1% penicillin-streptomycin) to inactivate the trypsin.
iv. Triturate the tissue gently using a serological pipette (5 and 1 mL) until no visible tissue clumps remain and the suspension appears turbid. Avoid vigorous pipetting to minimize cell damage.
v. Allow the suspension to settle for 15 min at room temperature.
c. Cell collection and purification:
i. Carefully transfer the supernatant (containing the cell suspension) to a new 15 mL conical tube, avoiding the bottom pellet (debris) and the upper fibrous layer (myelin and connective tissue).
ii. Centrifuge at 500× g for 1.5 min at room temperature. Carefully aspirate the supernatant without disturbing the pellet, which may contain residual debris. Resuspend the pellet in 5 mL of fresh DMEM.
iii. Centrifuge again at 1,000× g for 3 min at room temperature. Aspirate the supernatant completely. Resuspend the final cell pellet in neurobasal medium.
iv. Seed cells onto the PLL-coated 12-well plates (with coverslips) at the desired density (e.g., ~2–5 × 10⁵ cells per well in 1 mL of neurobasal medium per well). Place the plates in a humidified incubator at 37 °C with 5% CO2.
v. First medium change (6 h post-plating): Gently tap the plate to dislodge loosely attached cells and debris. Replace the medium with fresh neurobasal medium.
3. (Day 4) Half-medium change
a. Aspirate 50% of the conditioned medium from each well.
b. Replace with an equal volume of fresh neurobasal medium.
4. (Day 7) Half-medium change and primary AAV infection (Figure 5A)
a. Aspirate 50% of the conditioned medium from each well.
b. Replace with an equal volume of fresh neurobasal medium containing AAVs at the desired titer (AAV-TDP-43-CTF with AAV-HA or AAV-mPML-HA, 1.5 × 10¹¹ vg of each AAV were used per well).
5. (Day 10) Half-medium change, secondary AAV infection
a. Aspirate 50% of the conditioned medium from each well.
b. Replace with an equal volume of fresh neurobasal medium containing the same AAVs as at day 7.
6. (Day 13) Evaluate the expression of mPML and abundance of TDP-43-CTF aggregates (Figure 5A)
a. Aspirate the conditioned medium completely.
b. Wash cells gently twice with D-PBS (1 mL per well).
c. Aspirate the D-PBS and add 500 μL of 4% PFA. Fix the samples on ice for 15 min.
d. Remove the 4% PFA and wash the samples three times with 1 mL of D-PBS for 5 min each.
e. Aspirate the D-PBS and add 500 μL of 0.5% PBST to permeabilize the samples at room temperature for 20 min.
f. Remove the 0.5% PBST and wash the samples three times with 1 mL of D-PBS for 5 min each.
g. Remove the D-PBS and add 250 μL of 2% BSA to block the samples at room temperature for 1 h.
h. Remove the 2% BSA and wash the samples three times with 1 mL of D-PBS for 5 min each.
i. Aspirate the D-PBS and dilute the rabbit anti-HA primary antibody in 2% BSA at a 1:100 dilution. Add 250 μL of the diluted primary antibody to each well and incubate at room temperature for 1 h or overnight at 4 °C.
j. Remove the primary antibody and wash the samples three times with 1 mL of D-PBS for 5 min each.
k. Remove the D-PBS and dilute CY3-conjugated anti-rabbit secondary antibody in 2% BSA at a 1:200 dilution. Add 250 μL of the diluted secondary antibody to each well and incubate at room temperature for 1 h.
l. Remove the secondary antibody and wash the samples three times with 1 mL of D-PBS for 5 min each.
m. Remove the D-PBS, add 500 μL of 2.5 μg/mL DAPI solution to each well, and incubate at room temperature for 10 min.
n. Remove the DAPI solution and wash the samples three times with 1 mL of D-PBS for 5 min each.
o. Add 20 μL of antifade mounting medium onto the slide and carefully mount the coverslip. Seal the edges with nail polish.
p. Observe the samples under a confocal fluorescence microscope (Figure 5B).
Data analysis
The data are presented as mean ± S.D. Statistical analyses were performed using GraphPad Prism. To obtain sufficient amounts of protein aggregates for downstream analysis, each experimental group should include at least one well of cells cultured in a 12-well plate. Three biological replicates are essential to validate the aggregate-clearance effects of mPML variants on the protein aggregates of interest. Similarly, for mouse primary neurons, three biological replicates per group are necessary to minimize variability associated with AAV infection efficiency.
Validation of protocol
This protocol has been used and validated in the following research article:
• Wang et al. [14]. PML targets and resolves structured protein inclusions to mitigate neurodegeneration. Nature Cell Biology (Figures 4, 6, and 7, Extended Data Figures 6 and 8–10). https://doi.org/10.1038/s41556-026-01894-z
General notes and troubleshooting
General notes
1. PML has multiple transcript variants. Make sure the PML used is transcript IV, since only this variant can eliminate protein aggregates.
2. When evaluating the aggregate-reducing activity, it is advisable to test several transfection ratios to determine whether a dose-dependent effect is present and to identify the optimal condition.
3. To distinguish aggregate clearance from inhibition of aggregate formation, allow the aggregation-prone protein to accumulate before introducing or inducing PML.
4. During the isolation of insoluble fractions, fluorescence microscopy may be used after each centrifugation step to verify that the target material remains in the fraction and is not inadvertently lost during aspiration.
5. For validation in primary neurons, an AAV serotype such as PHP.eB may be used. Including multiple replicate wells (at least three) is recommended, and a multiplicity of infection (MOI) of approximately 1.25 × 10⁵ vg/cell is generally sufficient to achieve efficient infection. The infection ratio of AAVs expressing different proteins can be adjusted according to the transfection ratio.
6. This protocol can be adapted to other cytoplasmic aggregation-prone proteins by replacing the TDP-43-CTF or SOD1-G93A construct with the protein of interest. Direct fluorescence imaging is suitable for proteins that form readily distinguishable inclusions. For proteins with less prominent assemblies, a complementation-based reporter, such as the VN–VC BiFC system, can be used to improve detection. Biochemical fractionation should be used as an orthogonal assay to confirm changes in the detergent-insoluble fraction.
Troubleshooting
Problem 1: mPML does not promote the clearance of certain protein aggregates.
Possible cause: The aggregates may be localized in the nucleus rather than the cytoplasm.
Solution: Verify the subcellular localization of the protein of interest and use mPMLΔRBC instead of mPML.
Problem 2: Distinct protein aggregates cannot be observed after centrifugation.
Possible cause: Some pathogenic proteins have a limited ability to form dense aggregates, such as FUS-P525L and SOD1-G93A.
Solutions: Extend the protein expression time by harvesting the cells at 72 h post-transfection instead of 48 h post-transfection and increase the amount of plasmid used for transfection.
Acknowledgments
This work was supported by the National Natural Science Foundation of China (NSFC: 82450108 to S.X.H., 32370739, 32200621 to Y.W., 82371255, 82071258 to L.C.), National Key R&D Program of China (2023YFA1800202, 2024YFA1306000 to S.X.H.), and Shanghai Rising-Star Program (23QA1400600 to Y.W.).
This protocol was used in [14].
Author contributions
Conceptualization, J.-X. Z. and W.Y.; Investigation, J.-X. Z., Y. X., and J. L.; Writing—Original Draft, J.-X. Z., J. L., and W.Y.; Writing—Review & Editing, Y.W.; Funding acquisition, L.C., S.X.H., and Y.W.; Supervision, Y.W.
Competing interests
The authors declare that they have no competing interests.
References
- Ross, C. A. and Poirier, M. A. (2004). Protein aggregation and neurodegenerative disease. Nat Med. 10: S10–S17. https://doi.org/10.1038/nm1066
- Soto, C. and Estrada, L. D. (2008). Protein Misfolding and Neurodegeneration. Arch Neurol. 65(2): e56. https://doi.org/10.1001/archneurol.2007.56
- Neumann, M., Sampathu, D. M., Kwong, L. K., Truax, A. C., Micsenyi, M. C., Chou, T. T., Bruce, J., Schuck, T., Grossman, M., Clark, C. M., et al. (2006). Ubiquitinated TDP-43 in Frontotemporal Lobar Degeneration and Amyotrophic Lateral Sclerosis. Science. 314(5796): 130–133. https://doi.org/10.1126/science.1134108
- Watanabe, M., Dykes-Hoberg, M., Cizewski Culotta, V., Price, D. L., Wong, P. C. and Rothstein, J. D. (2001). Histological Evidence of Protein Aggregation in Mutant SOD1 Transgenic Mice and in Amyotrophic Lateral Sclerosis Neural Tissues. Neurobiol Dis. 8(6): 933–941. https://doi.org/10.1006/nbdi.2001.0443
- Naumann, M., Pal, A., Goswami, A., Lojewski, X., Japtok, J., Vehlow, A., Naujock, M., Günther, R., Jin, M., Stanslowsky, N., et al. (2018). Impaired DNA damage response signaling by FUS-NLS mutations leads to neurodegeneration and FUS aggregate formation. Nat Commun. 9(1): 335. https://doi.org/10.1038/s41467-017-02299-1
- Mori, K., Weng, S. M., Arzberger, T., May, S., Rentzsch, K., Kremmer, E., Schmid, B., Kretzschmar, H. A., Cruts, M., Van Broeckhoven, C., et al. (2013). The C9orf72 GGGGCC Repeat Is Translated into Aggregating Dipeptide-Repeat Proteins in FTLD/ALS. Science. 339(6125): 1335–1338. https://doi.org/10.1126/science.1232927
- McColgan, P. and Tabrizi, S. J. (2018). Huntington's disease: a clinical review. Eur J Neurol. 25(1): 24–34. https://doi.org/10.1111/ene.13413
- Wu, J., Wu, J., Chen, T., Cai, J. and Ren, R. (2024). Protein aggregation and its affecting mechanisms in neurodegenerative diseases. Neurochem Int. 180: 105880. https://doi.org/10.1016/j.neuint.2024.105880
- LaMorte, V. J., Dyck, J. A., Ochs, R. L. and Evans, R. M. (1998). Localization of nascent RNA and CREB binding protein with the PML-containing nuclear body. Proc Natl Acad Sci USA. 95(9): 4991–4996. https://doi.org/10.1073/pnas.95.9.4991
- Imrichova, T., Hubackova, S., Kucerova, A., Kosla, J., Bartek, J., Hodny, Z. and Vasicova, P. (2019). Dynamic PML protein nucleolar associations with persistent DNA damage lesions in response to nucleolar stress and senescence-inducing stimuli. Aging (Albany NY). 11(17): 7206–7235. https://doi.org/10.18632/aging.102248
- Corpet, A., Kleijwegt, C., Roubille, S., Juillard, F., Jacquet, K., Texier, P. and Lomonte, P. (2020). PML nuclear bodies and chromatin dynamics: catch me if you can! Nucleic Acids Res. 48(21): 11890–11912. https://doi.org/10.1093/nar/gkaa828
- Ivanschitz, L., Takahashi, Y., Jollivet, F., Ayrault, O., Le Bras, M. and de Thé, H. (2015). PML IV/ARF interaction enhances p53 SUMO-1 conjugation, activation, and senescence. Proc Natl Acad Sci USA. 112(46): 14278–14283. https://doi.org/10.1073/pnas.1507540112
- Janer, A., Martin, E., Muriel, M. P., Latouche, M., Fujigasaki, H., Ruberg, M., Brice, A., Trottier, Y. and Sittler, A. (2006). PML clastosomes prevent nuclear accumulation of mutant ataxin-7 and other polyglutamine proteins. J Cell Biol. 174(1): 65–76. https://doi.org/10.1083/jcb.200511045
- Wang, Y., Zhu, J. X., Zhan, F. X., Guo, Y., Xia, Y., Liu, J., Dai, P., Hu, Y., Chen, Y. H., Luan, X. H., et al. (2026). PML targets and resolves structured protein inclusions to mitigate neurodegeneration. Nat Cell Biol. 28(3): 520–535. https://doi.org/10.1038/s41556-026-01894-z
Article Information
Publication history
Received: Jun 9, 2026
Accepted: Aug 12, 2026
Available online: Aug 25, 2026
Published: Sep 20, 2026
Copyright
© 2026 The Author(s); This is an open access article under the CC BY-NC license (https://creativecommons.org/licenses/by-nc/4.0/).
How to cite
Zhu, J. X., Xia, Y., Liu, J., Cao, L., Hou, S. X. and Wang, Y. (2026). Protecting Against Cytoplasmic Protein Aggregates With Cytoplasmic PML Variants. Bio-protocol 16(18): e5815. DOI: 10.21769/BioProtoc.5815.

 Download Citation in RIS Format
Category
Neuroscience > Nervous system disorders > Neurodegeneration
Molecular Biology > Protein > Targeted degradation
Cell Biology > Cell-based analysis > Protein interaction
Do you have any questions about this protocol?
Post your question to gather feedback from the community. We will also invite the authors of this article to respond.
 Post a Question


