


- Protocols

- Articles and Issues
- For Authors
- About
- Become a Reviewer


Homogeneous Time-Resolved Fluorescence-Based Assay to Screen ADP-Ribosyl Hydrolase Inhibitors

Published: Vol 16, Iss 18, Sep 20, 2026 DOI: 10.21769/BioProtoc.5814 Views: 629
Reviewed by: Catherine HurdJagrity ChoudhuryAnonymous reviewer(s)
 PDF
PDF  Ask a question

Protocol Collections
Comprehensive collections of detailed, peer-reviewed protocols focusing on specific topics




Abstract
ADP ribosylation (ADPr) is a crucial post-translational modification that plays a vital role in DNA damage repair. Catalyzed by ADP ribose polymerases using NAD+ as a substrate, ADPr activates DNA repair pathways rapidly, thereby maintaining genomic integrity. The involvement of ADP ribose hydrolases in this process is significant, as they hydrolyze PAR chains, facilitating the release of ADPr-modified proteins from DNA or other proteins, which is essential for subsequent DNA repair steps. This protocol outlines a high-throughput screening method for identifying inhibitors of ADP ribose hydrolases, utilizing His-Tb-conjugated and ADPr-modified His-ADP ribose polymerase as the signal donor, and GST-d2-conjugated GST-XRCC1 as the signal receptor. The detection of time-resolved fluorescence signals enables efficient evaluation of compounds with potential therapeutic activity against cancer.
Key features
• A high-throughput screening method is provided for efficiently identifying inhibitors of ADP ribose hydrolases.
• The method employs homogeneous time-resolved fluorescence (HTRF) for sensitive detection of inhibitory effects on ADP ribose hydrolases, enabling high-throughput screening without complex separation steps.
• The research aims to accelerate the development of novel cancer therapies targeting ADP ribose hydrolases to improve treatment outcomes.
Keywords: ADP ribosylation ADP ribose hydrolase
PARG
Homogeneous time-resolved fluorescence
ADP-ribosyl hydrolase inhibitors
ADP ribose hydrolase
PARG
Homogeneous time-resolved fluorescence
ADP-ribosyl hydrolase inhibitors
Graphical overview
Background
ADP ribosylation (ADPr) is an important post-translational modification that occurs in response to DNA damage, contributing to the activation and coordination of DNA repair pathways [1]. This modification is catalyzed by poly(ADP-ribose) polymerases, such as PARP1, which use NAD+ as a substrate to synthesize poly(ADP-ribose) (PAR) chains on target proteins, including PARP1 itself and nucleosomal histones [2]. PAR is subsequently recognized by DNA repair factors containing PAR-binding domains, including XRCC1, thereby facilitating their recruitment to sites of DNA damage [3]. However, once PAR-binding DNA repair factors have been recruited to DNA lesions, ADP-ribose hydrolases are required to hydrolyze PAR chains and promote the timely release and redistribution of these factors, allowing subsequent DNA repair steps to proceed [4]. If PAR chains are not efficiently hydrolyzed, PAR-binding repair factors may remain sequestered at PARylation sites and fail to execute their downstream repair functions. Therefore, the hydrolysis of PAR chains orchestrates the cellular response to DNA damage and contributes to the maintenance of genomic stability [5].
Given the pivotal role of PAR chain hydrolysis in DNA repair, it has emerged as a promising therapeutic target in cancer [5]. Poly(ADP-ribose) glycohydrolase (PARG), in particular, is the major enzyme to hydrolyze PAR chains [4]. PARG inhibition leads to PAR accumulation and impaired resolution of DNA damage signaling, which may increase the sensitivity of cancer cells to DNA-damaging agents, particularly in tumors with defective DNA repair mechanisms [6].
Targeting DNA damage repair has already provided substantial clinical benefits in ovarian and breast cancers. PARP inhibitors have been approved for selected patients with these cancers, particularly those harboring BRCA1/2 mutations or other homologous recombination repair deficiencies [1]. In ovarian cancer, PARP inhibitors have become important maintenance treatments, particularly for patients with platinum-sensitive disease and BRCA mutations or homologous recombination deficiency. In HER2-negative breast cancer, germline BRCA1/2 mutations have been established as predictive biomarkers for selecting patients for PARP inhibitor therapy. These advances demonstrate how research into ADP-ribosylation and DNA repair vulnerabilities has facilitated targeted drug discovery and biomarker-guided patient selection [7]. PARG inhibition represents a complementary approach that may be effective in homologous recombination-deficient ovarian and breast cancers and in tumors that have developed resistance to PARP inhibitors. However, the clinical efficacy of PARG inhibitors and the patient populations most likely to benefit remain to be established [5].
Several biochemical and cell-based methods have been developed to measure PARG activity and screen for PARG inhibitors. Early assays commonly monitored the degradation of radiolabeled PAR substrates using chromatographic or electrophoretic separation. Although sensitive, these methods require radioactive materials and multiple separation steps and are therefore not readily adaptable to large-scale compound screening. Nonradiometric assays were subsequently developed to quantify ADP-ribose released following PAR hydrolysis, enabling PARG inhibitor screening in multi-well formats [8]. Previous HTRF-based assays have measured PARG activity using labeled PAR substrates [9,10]. In contrast, our protocol uses ADP-ribosylated His-PARP1C as an artificial PAR substrate and monitors its interaction with GST-XRCC1, providing a distinct and reproducible approach for screening PARG inhibitors in a low-volume 384-well format. In addition, cell-based immunofluorescence assays measure the persistence or accumulation of cellular PAR following DNA damage and can identify cell-permeable PARG inhibitors [11]. However, the results of cell-based assays may be influenced by compound permeability, cellular metabolism, and other regulators of PAR homeostasis.
The introduction of high-throughput screening techniques significantly enhances the ability to quickly assess large libraries of compounds for their inhibitory effects on ADP ribose hydrolases, such as PARG. Identifying potent and selective PARG inhibitors may provide new therapeutic opportunities for patients with homologous recombination-deficient tumors, tumors characterized by high replication stress, and tumors that have developed resistance to PARP inhibitors. Such inhibitors may be used as monotherapies or in combination with DNA-damaging agents and other DNA damage response-targeted therapies, thereby potentially expanding the population of patients who may benefit from therapies targeting DNA repair vulnerabilities [7,11]. The present protocol directly monitors the PARG-dependent disruption of the interaction between ADP-ribosylated His-PARP1C and the PAR-binding protein GST-XRCC1. Its homogeneous, low-volume, 384-well format avoids radioactive substrates and post-reaction separation steps and allows up to 16 inhibitors to be evaluated simultaneously per plate. This protocol presents a novel approach to facilitate the discovery of potent inhibitors, ultimately contributing to the advancement of therapeutic strategies for cancer treatment and enhancing our understanding of the functional mechanisms of ADP ribose hydrolases in DNA damage repair.
Materials and reagents
Reagents
Note: Unless specified, all reagents are stored at room temperature (RT) (20–25 °C).
1. Super optimal broth with catabolite repression (SOC) (Sigma-Aldrich, catalog number: S1797) (-80 °C)
2. Tryptone (Oxoid, catalog number: LP0042B)
3. Yeast extract (Oxoid, catalog number: LP0021)
4. Kanamycin (Rhawn, catalog number: 25389-94-0) (2–8 °C)
5. Ampicillin (Rhawn, catalog number: 69-52-3) (2–8 °C)
6. Isopropyl β-D-1-thiogalactopyranoside) (IPTG) (Rhawn, catalog number: 367-93-1) (2–8 °C)
7. 10× phosphate-buffered saline (PBS) (Fisher Scientific, catalog number: MT-46013CM)
8. Protease inhibitor cocktail (Sigma-Aldrich, catalog number: P8849) (-20 °C)
9. Tris(hydroxymethyl)aminomethane (Tris base) (MCE, catalog number: HY-15917)
10. Bovine serum albumin (BSA) (Sigma-Aldrich, catalog number: A7906) (2–8 °C)
11. NaCl (Sigma-Aldrich, catalog number: S9888)
12. MgCl2 (Sigma-Aldrich, catalog number: M8266)
13. KCl (Sigma-Aldrich, catalog number: S7653)
14. Tween-20 (Sigma-Aldrich, catalog number: SLCL7671)
15. Dithiothreitol (DTT) (Sigma-Aldrich, catalog number: D0632) (-20 °C)
16. Dimethyl sulfoxide (DMSO) (MCE, catalog number: HY-Y0320C)
17. Imidazole (MCE, catalog number: HY-D0837)
18. Phenylmethylsulfonyl fluoride (PMSF) (MCE, catalog number: HY-B0496)
19. Ethylenedinitrilotetraacetic acid (EDTA) (MCE, catalog number: HY-Y0682A)
20. L-Glutathione reduced (Sigma-Aldrich, catalog number: G4251) (2–8 °C)
21. Bio-Safe Coomassie Stain (Bio-Rad, catalog number: 1610787)
22. Quick StartTM Bradford Protein Assay kit 2 (Bio-Rad, Catalog number: 5000202)
23. β-nicotinamide adenine dinucleotide (NAD+) (Sellect, catalog number: S2518) (-20 °C)
24. Custom DNA oligos (Millipore Sigma) (-20 °C)
25. HTRF mAb Anti-6His Gold Tb-conjugate (His-Tb) (Revvity Health Sciences Inc, catalog number: 50-103-1167) (2–8 °C)
26. mAb Anti-GST d2-conjugate (GST-d2) (Revvity Health Sciences Inc, catalog number: 50-211-7729) (2–8 °C)
27. PDD 00017273 (MCE, catalog number: HY-108360)
Solutions
1. Lysogeny broth (LB) medium (see Recipes)
2. LB agar plates (see Recipes)
3. Lysis buffer (His-tag) (see Recipes)
4. Lysis buffer (GST-tag) (see Recipes)
5. Wash buffer (His-tag) (see Recipes)
6. Elution buffer (His-tag) (see Recipes)
7. Equilibration buffer (GST-Tag) (see Recipes)
8. Elution buffer (GST-tag) (see Recipes)
9. Low salt buffer (see Recipes)
10. Size-exclusion chromatography buffer (see Recipes)
11. PARylation reaction buffer (see Recipes)
12. Assay buffer (see Recipes)
13. 10 μM custom DNA oligo (see Recipes)
Recipes
1. LB medium (liquid)
| Reagent | Final concentration | Quantity for 1 L |
|---|---|---|
| Tryptone | 10 g/L | 10 g |
| Yeast extract | 5 g/L | 5 g |
| NaCl | 10 g/L | 10 g |
| dH2O | - | To 1 L |
Note: Sterilize by autoclaving at 121 °C for 20 min. Allow to cool to RT or 37 °C before use. Store at RT (short term) or 4 °C (long term).
2. LB agar plates
For the solid medium, add 15 g/L agar to the LB medium (Recipe 1) before autoclaving. Autoclave at 121 °C for 20 min. Cool to approximately 50 °C, then add antibiotics (if needed, after cooling to ~50 °C to avoid thermal degradation). Pour approximately 20–25 mL per sterile Petri dish (10 cm diameter). Allow to solidify at RT. Store plates at 4 °C (inverted, in sealed bags) for up to 4 weeks.
3. Lysis buffer (His-tag)
| Reagent | Final concentration | Quantity for 100 mL |
|---|---|---|
| 1 M Tris-HCl (pH 8.0) | 50 mM | 5 mL |
| 5 M NaCl | 300 mM | 6 mL |
| 1 M Imidazole | 10 mM | 1 mL |
| 1 M DTT | 1 mM | 100 μL |
| 1 M PMSF | 1 mM | 100 μL |
| Protease inhibitor cocktail | As recommended | As per manufacturer |
| dH2O | - | To 100 mL |
Note: DTT and PMSF are labile and should be added to the buffer immediately before use. PMSF should be added from a fresh 100 mM stock (in isopropanol or DMSO) just before use. If using Sigma protease inhibitor cocktail P8849 (DMSO solution), add 10 μL per 1 mL of buffer (1:100, v/v) immediately before cell lysis. Do not store the buffers containing DTT, PMSF, or the protease inhibitor cocktail for extended periods.
4. Lysis buffer (GST-tag)
| Reagent | Final concentration | Quantity for 100 mL |
|---|---|---|
| 10× PBS (pH 7.4) | 1× | 10 mL |
| 1 M DTT* | 1 mM | 100 μL |
| 0.5 M EDTA | 1 mM | 200 μL |
| 1 M PMSF* | 1 mM | 100 μL |
| Protease inhibitor cocktail | As recommended | As per manufacturer |
| dH2O | - | To 100 mL |
*See note for Recipe 3.
5. Wash buffer (His-tag)
| Reagent | Final concentration | Quantity for 1 L |
|---|---|---|
| 1 M Tris-HCl (pH 8.0) | 50 mM | 50 mL |
| 5 M NaCl | 300 mM | 60 mL |
| 1 M Imidazole | 20 mM | 20 mL |
| 1 M DTT* | 1 mM | 1 mL |
| 1 M PMSF* | 1 mM | 1 mL |
| dH2O | - | To 1 L |
*See note for Recipe 3.
Note: Filter-sterilize (0.22 μm) and degas (e.g., by vacuum filtration or sonication) to remove dissolved air bubbles that could interfere with the size exclusion column.
6. Elution buffer (His-tag)
| Reagent | Final concentration | Quantity for 1 L |
|---|---|---|
| 1 M Tris-HCl (pH 8.0) | 50 mM | 50 mL |
| 5 M NaCl | 300 mM | 60 mL |
| 1 M Imidazole | 250 mM | 250 mL |
| 1 M DTT* | 1 mM | 1 mL |
| 1 M PMSF* | 1 mM | 1 mL |
| dH2O | - | To 1 L |
*See note for Recipe 3.
Note: Filter-sterilize (0.22 μm) and degas (e.g., by vacuum filtration or sonication) to remove dissolved air bubbles that could interfere with the size exclusion column.
7. Equilibration buffer (GST-Tag)
| Reagent | Final concentration | Quantity for 1 L |
|---|---|---|
| 10× PBS (pH 7.4) | 1× | 100 mL |
| 1 M DTT* | 1 mM | 1 mL |
| dH2O | - | To 1 L |
*See note for Recipe 3.
Note: Filter-sterilize (0.22 μm) and degas (e.g., by vacuum filtration or sonication) to remove dissolved air bubbles that could interfere with the size exclusion column.
8. Elution buffer (GST-tag)
| Reagent | Final concentration | Quantity for 1 L |
|---|---|---|
| 1 M Tris-HCl (pH 8.0) | 50 mM | 50 mL |
| Reduced glutathione | 20 mM | 6.15 g |
| dH2O | - | To 1 L |
Note: Prepare elution buffer immediately before use. Do not store elution buffer at 4 °C for more than a few days. Filter-sterilize (0.22 μm) and degas (e.g., by vacuum filtration or sonication) to remove dissolved air bubbles that could interfere with the size exclusion column.
9. Low salt buffer
| Reagent | Final concentration | Quantity for 1 L |
|---|---|---|
| 1 M Tris-HCl (pH 8.0) | 50 mM | 50 mL |
| 5 M NaCl | 50 mM | 10 mL |
| 1 M DTT* | 1 mM | 1 mL |
| dH2O | - | To 1 L |
*See note for Recipe 3.
Note: Filter-sterilize (0.22 μm) and degas (e.g., by vacuum filtration or sonication) to remove dissolved air bubbles that could interfere with the size exclusion column.
10. Size-exclusion chromatography buffer
| Reagent | Final concentration | Quantity for 1 L |
|---|---|---|
| 1 M Tris-HCl (pH 8.0) | 50 mM | 50 mL |
| 5 M NaCl | 150 mM | 30 mL |
| 1 M DTT* | 1 mM | 1 mL |
| dH2O | - | To 1 L |
*See note for Recipe 3.
Note: Filter-sterilize (0.22 μm) and degas (e.g., by vacuum filtration or sonication) to remove dissolved air bubbles that could interfere with the size exclusion column.
11. 2× PARylation reaction buffer
| Reagent | Final concentration | Quantity for 1 mL |
|---|---|---|
| 1 M Tris-HCl (pH 8.0) | 200 mM | 100 μL |
| 5 M NaCl | 200 mM | 20 μL |
| 0.5 M MgCl2 | 20 mM | 20 μL |
| 1 M DTT* | 20 mM | 10 μL |
| dH2O | - | to 1 mL |
*See note for Recipe 3.
Note: Store at -20 °C for up to 6 months. Thaw and keep on ice before use.
12. Assay buffer
| Reagent | Final concentration | Quantity for 10 mL |
|---|---|---|
| 1 M Tris-HCl (pH 7.5) | 100 mM | 1 mL |
| 5 M KCl | 50 mM | 100 μL |
| 10% (w/v) BSA | 0.25% | 250 μL |
| 100 mM DTT* | 1 mM | 100 μL |
| 10% (v/v) Tween-20 | 0.01% | 10 μL |
| dH2O | - | To 10 mL |
*See note for Recipe 3.
Note: BSA should be of high purity (e.g., fatty acid-free, protease-free).
13. 10 μM custom DNA oligo
| Reagent | Final concentration | Quantity for 10 mL |
|---|---|---|
| Custom DNA oligo | 10 μM custom DNA oligo | 1 mL |
| dH2O | - | To 1 mL |
Laboratory supplies
1. E. coli Rosetta (DE3) competent cells (TIANGEN, catalog number: CB108-02)
2. Petri dish (NEST, catalog number: 752101)
3. Millex 33 mm polyethersulfone (PES) 0.22 μm (Merck Millipore, catalog number: SLGPR33RB)
4. Millex 33 mm PES 0.45 μm (Merck Millipore, catalog number: SLHPR33RS)
5. White, low-volume 384-well plates (Greiner, catalog number: 784075)
6. HisTrapTM HP His tag protein purification columns (Ni-NTA) (Cytiva, catalog number: 17524801)
7. High-resolution GST-tagged protein purification with GSTrapTM HP (glutathione Sepharose) columns (Cytiva, catalog number: 17528201)
8. HiTrapTM Q HP anion exchange chromatography column (Q Sepharose) (Cytiva, catalog number: 17115401)
9. SuperdexTM 200 Increase 10/300 GL small-scale SEC column (Superdex 200 Increase) (Cytiva, catalog number: 28990944)
10. PierceTM Protein Concentrators PES, 3K or 5K MWCO, 0.5–100 mL (Thermo Fisher, catalog number: 88515)
Equipment
1. Autoclave (ZEALWAY, model: GR-85DA)
2. Incubator shaker (Shanghai Minquan, model: MQD-B3R)
3. UV-visible spectrophotometer (Shanghai Metash Instruments, model: UV-6000)
4. Sonicator (Shanghai Jingxin, model: XM-650T)
5. HTRF-compatible plate reader (Thermo Varioskan LUX with TRF module, or equivalent)
6. Nano Drop (Thermo, model: NanoDropTM One/One C)
7. Plate shaker (Cence, model: TDZ5-WS)
8. Multidrop Pico8 liquid handler (Thermo Multidrop Pico8 or equivalent)
9. AKTA (GE, model: AKTA Pure 25M)
Software and datasets
1. GraphPad Prism 8.4.3 (or equivalent)
Procedure
Note: To minimize batch-to-batch variability that may affect compound activity in downstream HTRF assays, it is strongly recommended to express and purify a single large batch of each protein (His-PARP1C, GST-XRCC1, and GSTPARG) in sufficient quantity for all planned experiments. Aliquots of the purified proteins should be stored at -80 °C and used throughout the study to ensure consistent results.
To ensure consistent assay performance and minimize inter-batch variability that may affect compound activity measurements, it is strongly recommended to prepare a single large batch of ADP-ribosylated His-PARP1C (His-PARP1C-PARylation) in sufficient quantity for all planned experiments. Aliquot the modified protein into single-use portions and store at -80 °C. Avoid repeated freeze/thaw cycles.
A. Expression and purification of recombinant PARP1C, XRCC1, and PARG proteins
1. Plasmid construction: Insert the corresponding DNA fragment into the respective vector. Confirm all constructs by DNA sequencing. Three recombinant expression plasmids are generated (Table 1).
Table 1. Recombinant protein constructs used in this study.
| Protein | Vector | Tag | Amino acid residues | Molecular weight |
|---|---|---|---|---|
| PARP1C | pET-28a | N-terminal His-tag | 375–1014 | ~80 kDa |
| XRCC1 | pGEX-4T-1 | N-terminal GST-tag | 317–633 | ~50 kDa |
| PARG | pGEX-4T-1 | N-terminal GST-tag | 1–976 (full-length) | ~150 kDa |
2. Transformation of Rosetta (DE3) competent cells
Note: This procedure is identical for all three plasmids.
a. Remove competent cells from -80 °C and place immediately on ice. After approximately 5 min, when the cell pellet has just thawed, add 1 μL of the recombinant plasmid (or half of a ligation reaction) to the cells.
b. Mix gently by pipetting up and down. Do not vortex.
c. Leave the tube on ice for 25 min.
d. Heat-shock at 42 °C for 90 s, then return the tube to ice and let stand for 5 min.
e. Add 500 μL of sterile antibiotic-free SOC medium, mix gently, and incubate at 37 °C and 200 rpm for 60 min for recovery.
f. Centrifuge briefly at 1,000× g for 1 min. Remove supernatant, leaving ~100 μL, and resuspend the pellet.
g. Spread the entire suspension onto an LB agar plate containing the appropriate selection antibiotic: For pET-28a (His-PARP1C), kanamycin (50 μg/mL); for pGEX-4T-1 (GST-XRCC1, GST-PARG), ampicillin (100 μg/mL).
h. Incubate the plate upright at 37 °C for 30 min, then invert and incubate overnight at 37 °C.
3. Protein expression
Note: Induction conditions may be optimized for each protein, as noted below.
a. Inoculate a single colony from the transformation plate into 5 mL of LB medium containing the appropriate antibiotic. Grow overnight at 37 °C with shaking (200 rpm).
b. The next day, dilute the overnight culture 1:100 into fresh LB medium (same antibiotic) in a larger flask (e.g., 1-L culture per 2.8-L flask). Grow the culture at 37 °C and monitor the OD600 periodically using a UV-visible spectrophotometer, with uninoculated LB medium containing the same antibiotic used as the blank, until the OD600 reaches 0.6–0.8.
c. Induce protein expression by adding IPTG to a final concentration of:
i. For His-PARP1C, 0.5 mM IPTG.
ii. For GST-XRCC1 and GST-PARG, 0.2 mM IPTG.
d. Continue growth at 25 °C for 16 h (overnight) with shaking (200 rpm).
e. Harvest cells by centrifugation at 4,000× g for 20 min at 4 °C. Discard supernatant and store cell pellets at -80 °C or use immediately.
4. Cell lysis and clarification
Note: Perform all subsequent steps at 4 °C.
a. Resuspend the cell pellet in lysis buffer (volume: approximately 5–10 mL per gram of wet cell paste): Lysis buffer (His-tag) for His-PARP1C, and lysis buffer (GST-tag) for GST-tagged proteins (XRCC1, PARG).
b. Lyse the cells by sonication (e.g., 20 min, 2 s on/4 s off, 40% amplitude) or using a high-pressure homogenizer.
c. Centrifuge the lysate at 20,000× g for 30 min at 4 °C to remove cell debris.
d. Filter the supernatant through a 0.45 μm syringe filter before loading onto the chromatography columns.
5. Protein purification (sequential chromatography)
Note: All three proteins are purified using the same three-step chromatography strategy, but the first-step affinity resin differs (Table 2).
Table 2. Purification steps for recombinant proteins.
| Step | His-PARP1C | GST-XRCC1 & GST-PARG |
|---|---|---|
| First affinity | Ni-NTA | Glutathione Sepharose |
| Second ion exchange | Q Sepharose | Q Sepharose |
| Third size exclusion | Superdex 200 Increase | Superdex 200 Increase |
a. Affinity chromatography for His-PARP1C (Ni-NTA):
i. Equilibrate the Ni-NTA column with lysis buffer (His-tag).
ii. Load the clarified lysate onto the column at a flow rate of 1 mL/min.
iii. Wash with wash buffer (His-tag) until absorbance returns to baseline.
iv. Elute the protein with elution buffer (His-tag). Collect fractions.
b. Affinity chromatography for GST-XRCC1 and GST-PARG (Glutathione Sepharose):
i. Equilibrate the glutathione Sepharose column with equilibration buffer (GST-tag).
ii. Load the clarified lysate.
iii. Wash extensively with equilibration buffer.
iv. Elute with elution buffer (GST-tag). Collect fractions.
c. Ion exchange chromatography (Q Sepharose)
Note: This step is identical for all three proteins.
i. Pool the affinity-purified fractions and dilute (or desalt) into low-salt buffer.
ii. Load onto a Q Sepharose column equilibrated with low-salt buffer.
iii. Wash with low-salt buffer, then elute bound proteins with a linear gradient of 0–1 M NaCl in the same buffer over 20 column volumes.
iv. Collect fractions and analyze by SDS-PAGE using 10%–12% polyacrylamide gels. Pool those containing the target protein.
d. Size exclusion chromatography (Superdex 200 Increase)
i. Concentrate the pooled fractions from ion exchange using a centrifugal concentrator.
ii. Inject the concentrated sample (≤5% of column volume) onto a Superdex 200 Increase column. Pre-equilibrate with size-exclusion buffer.
iii. Run at a constant flow rate of 0.5 mL/min. Collect fractions corresponding to the molecular weight of the target protein.
6. Collection and storage
a. Pool the fractions showing a predominant band at the expected molecular weight of the target protein, as assessed by SDS-PAGE using 10%–12% polyacrylamide gels followed by Coomassie staining. Representative SDS-PAGE images of the three purified target proteins are shown in Supplementary Figure S1. Ensure final purity exceeds 95%.
b. Concentrate the protein to a desired concentration (e.g., 0.8 mg/mL for His-PARP1C; 1 mg/mL for GST-XRCC1 and GST-PARG) using a centrifugal concentrator.
c. Aliquot, flash-freeze in liquid nitrogen, and store at -80 °C.
Note: For ADP-ribosylated His-PARP1C preparation (used in the HTRF assay), follow the separate protocol described in section B.
7. Verification of protein purity and identity (optional but recommended)
a. Run 5–10 μg of each purified protein on a 10%–12% SDS-PAGE gel.
b. Confirm identity by western blot using anti-His tag (for PARP1C) or anti-GST tag (for XRCC1 and PARG).
c. Measure protein concentration using a Bradford assay in a cuvette format according to the manufacturer’s instructions.
d. A typical purification is performed using 2 L of bacterial culture. The expected yields are approximately 1 mg of GST-PARG, 8.5 mg of GST-XRCC1, and 0.25 mg of His-PARP1C1, corresponding to approximately 0.500, 4.25, and 0.125 mg per liter of culture, respectively.
B. Preparation of ADP-ribosylated His-PARP1C protein
1. Prepare the PARylation reaction mixture in a total volume of 1 mL. Add the following components to a microcentrifuge tube in the order listed in Table 3.
Table 3. Composition of the PARylation reaction mixture for His-PARP1C automodification.
| Reagent | Final concentration | Quantity for 1 mL (μL) |
|---|---|---|
| 2× PARylation reaction buffer | 1× | 500 |
| 50 mM NAD+ | 2 mM | 40 |
| 10 μM custom DNA oligo | 100 nM | 10 |
| His-PARP1C (0.8 mg/mL) | 0.3 mg/mL | 375 |
| dH2O | - | To 1 mL |
Note: Any double-stranded DNA oligonucleotide (e.g., 20–50 bp) can be used. The oligo serves solely as a DNA scaffold to activate PARP1 automodification. The exact sequence is not critical.
The sequence of the DNA oligonucleotide used in the current assay is:
5′-GTATCCTCGTAGTGCAGATGCGTC-3′
Note: Other single-stranded DNA sequences of a similar length may also be suitable.
2. Incubate the reaction mixture at 25 °C for 120 min to allow ADP-ribosylation of His-PARP1C.
3. Aliquot the resulting ADP-ribosylated His-PARP1C protein (His-PARP1C-PARylation) and store at -20 °C until further use.
C. HTRF-based screening of small-molecule PARG inhibitors
1. Compound preparation (inhibitor dilution)
a. Dissolve the test inhibitor (PDD 00017273) in 100% DMSO to prepare a 2 mM stock solution.
b. Add 0.1 μL of the stock solution per 20 μL reaction (final concentration in the reaction will be 10 μM, as described below).
c. Perform a 3-fold serial dilution in DMSO, starting at 10 μM, to obtain 10 concentrations (in addition to a DMSO control). The final inhibitor concentrations in the 20 μL reaction should be as shown in Table 4.
Table 4. Serial dilution scheme for PARG inhibitor PDD 00017273.
| Concentration in reaction (nM) | Corresponding dilution factor |
|---|---|
| 1.00 × 10⁴ | Starting concentration |
| 3.33 × 10³ | 3-fold from previous |
| 1.11 × 10³ | 3-fold from previous |
| 3.70 × 10² | 3-fold from previous |
| 1.23 × 10² | 3-fold from previous |
| 41.2 | 3-fold from previous |
| 13.7 | 3-fold from previous |
| 4.57 | 3-fold from previous |
| 1.52 | 3-fold from previous |
| 0.507 | 3-fold from previous |
Note: Prepare the serial dilutions such that the final DMSO concentration in all wells is equal (e.g., 0.5% v/v).
2. HTRF reaction setup (20 μL final volume, with duplicates): All steps are performed at 25 °C unless otherwise stated. Use white 384-well low-volume plates. With the assay layout described in this protocol, the IC50 of 16 inhibitors can be evaluated simultaneously on each plate.
a. Add GST-PARG: Dilute GST-PARG in assay buffer to a working concentration of 0.64 nM (8-fold higher than final). Add 2.5 μL of this dilution to each well. The final concentration of GST PARG in the 20 μL reaction is 0.08 nM.
b. Add inhibitor (or control): Add 0.1 μL of serially diluted inhibitor (in DMSO) to the corresponding wells using a Multidrop Pico8 (or a manual pin tool). For the low control (signal min, PARG active, no inhibitor), add 0.1 μL of DMSO without compound. For the high control (signal max, no PARG activity), do not add GST-PARG in step C2a; instead, add 2.5 μL of assay buffer. (Alternatively, the high control can be wells without PARG and without inhibitor.) Mix gently (e.g., plate shaker for 30 s) and incubate at 25 °C for 15 min (PARG-inhibitor pre-incubation).
c. Add ADP-ribosylated His-PARP1C: Dilute ADP-ribosylated His-PARP1C in assay buffer to 2 μM (8-fold higher than final). Add 2.5 μL to each well (final concentration: 250 nM). Mix and incubate at 25 °C for 15 min.
d. Add GST-XRCC1: Dilute GST-XRCC1 in assay buffer to 400 nM (8-fold higher than final). Add 2.5 μL to each well (final concentration: 50 nM). Mix and incubate at 25 °C for 15 min (allows interaction between PARP1C and XRCC1).
e. Add HTRF detection reagents: Dilute His-Tb and GST-d2 in assay buffer according to the manufacturer’s recommendation. Typically, a volume of 5 μL per reagent per well (total 20 μL) is suitable. The final dilution should give a robust signal (e.g., 1:200 for His-Tb and 1:100 for GST-d2). The acceptable range for each is 2–10 μL per 20 μL reaction; using 5 μL each is recommended. Add 5 μL of diluted His-Tb and 5 μL of diluted GST-d2 to each well. Mix thoroughly and incubate at 25 °C for 60 min in the dark.
f. Controls
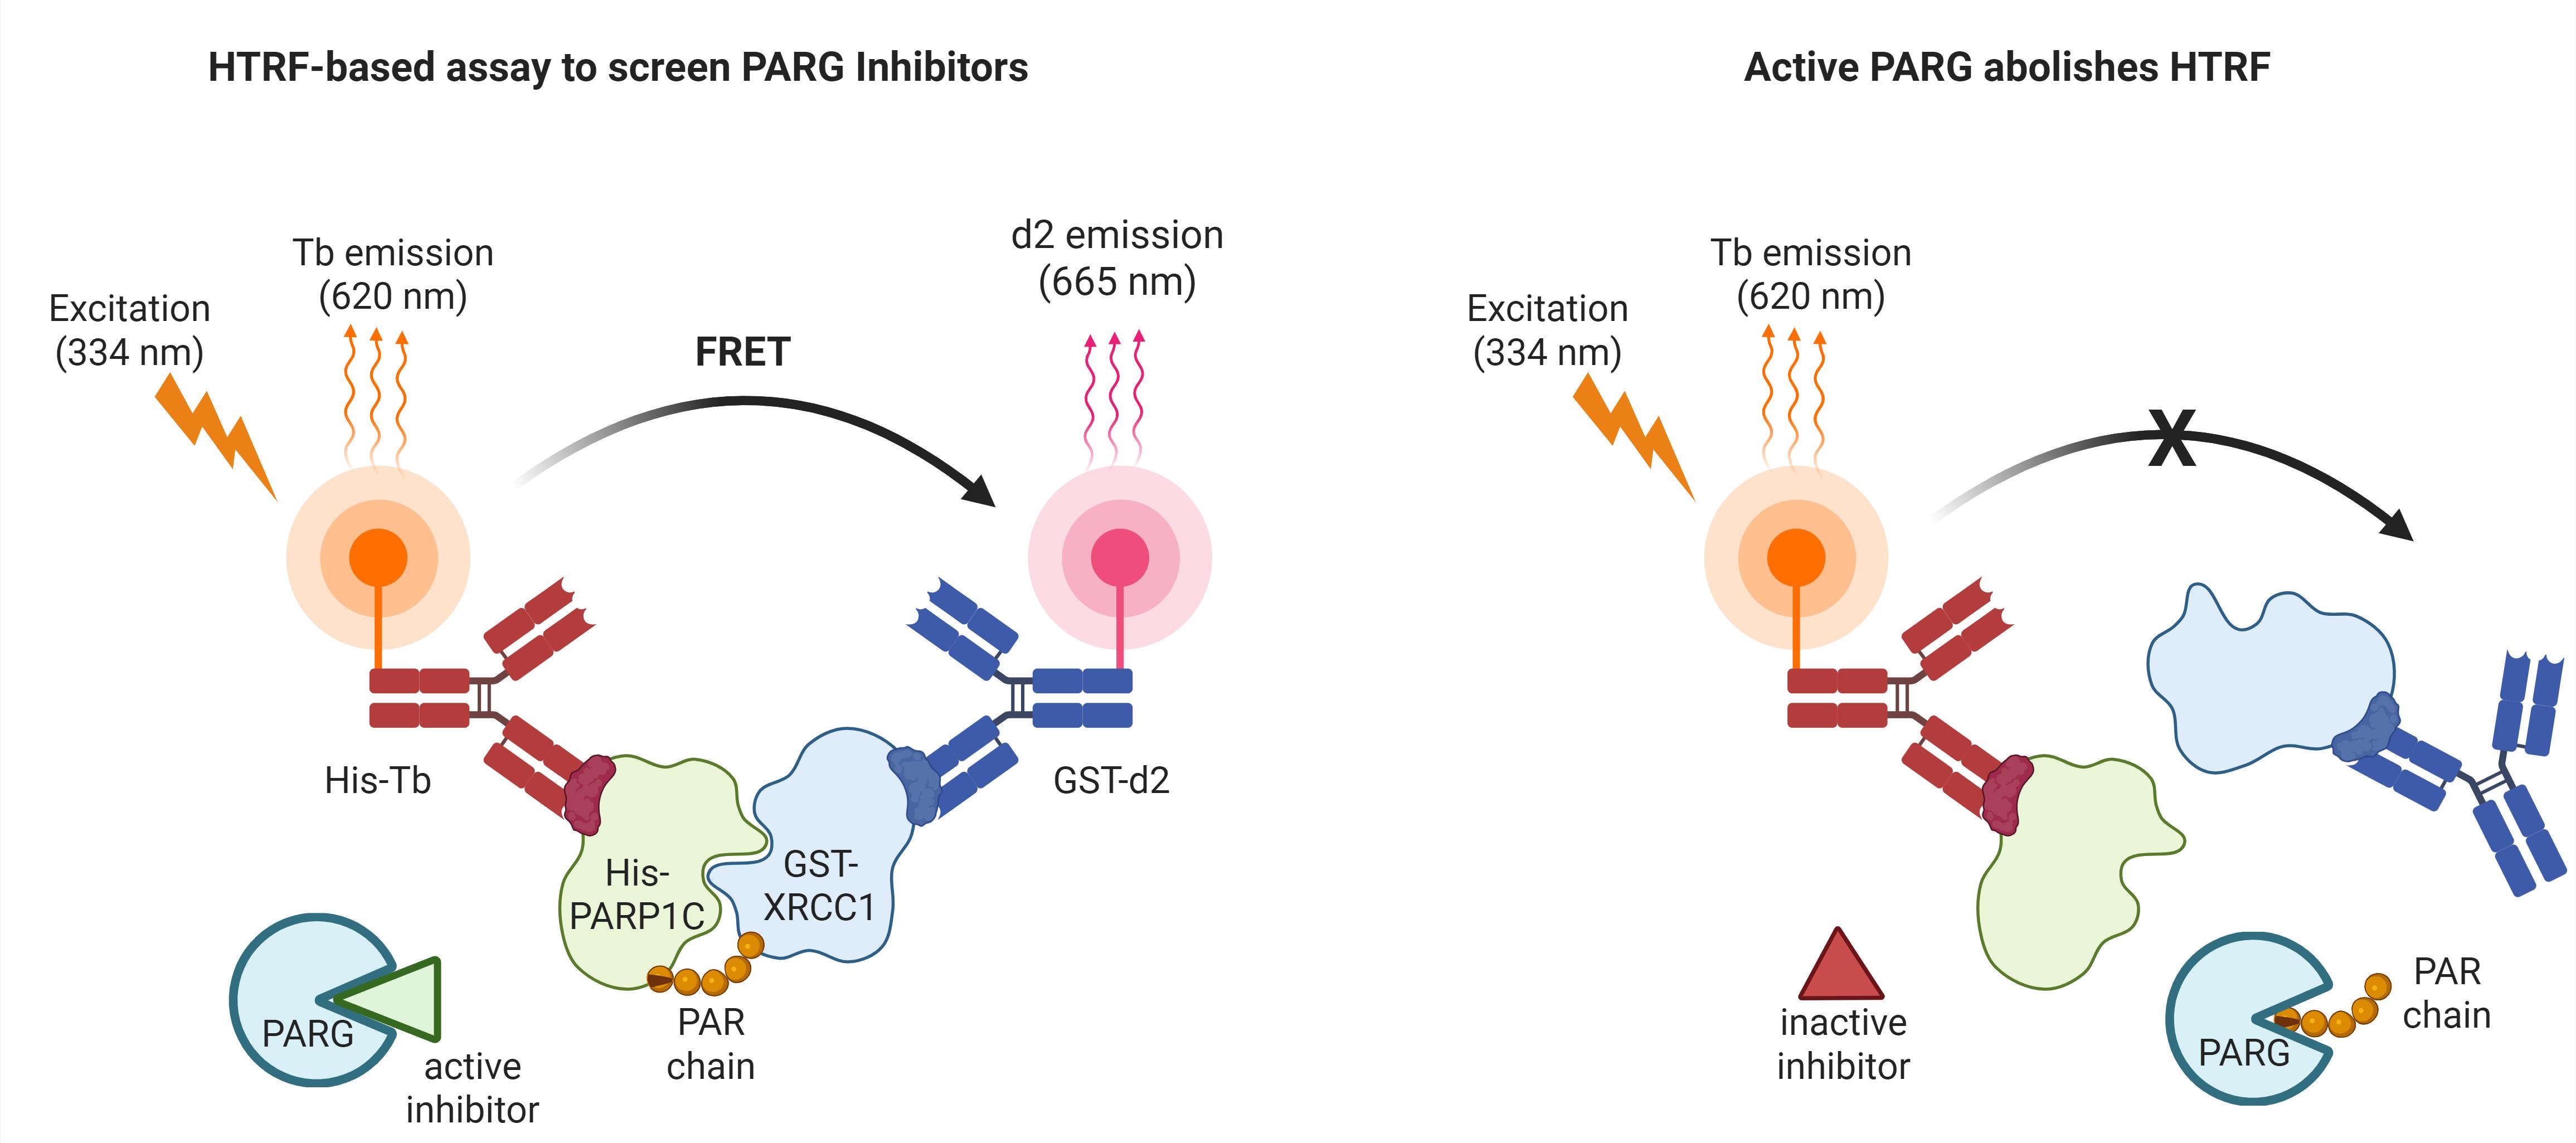
i. High control (max signal: no PARG activity): Wells containing all components except GST-PARG (replace with assay buffer). No inhibitor added (DMSO only). This gives the maximum 665/620 ratio because the PARP1C-XRCC1 interaction remains intact.
ii. Low control (min signal: full PARG activity): Wells containing all components, including GST-PARG, but no inhibitor (DMSO only). This gives the minimum ratio because PARG hydrolyzes the ADP-ribose chains and prevents interaction.
iii. Blank (optional): Assay buffer instead of all protein components, to measure background fluorescence. Usually not required for HTRF ratio calculations.
3. Signal measurement
a. Measure fluorescence using a Thermo Varioskan LUX plate reader (or equivalent) equipped with a time-resolved fluorescence (TRF) module.
b. Excitation wavelength: 334 nm.
c. Emission wavelengths: 620 nm (donor, terbium cryptate), 665 nm (acceptor, d2).
d. Typical delay time: 50 μs; integration time: 400 μs (adjust according to instrument).
e. For each well, calculate the HTRF ratio:
Note: The multiplication factor 106 is used to obtain integer-like values for convenient data handling in this HTRF-based protocol [12].
Data analysis
Use GraphPad Prism for calculations.
1. Define signal values:
a. Signal max = mean ratio of high control wells (no PARG, no inhibitor).
b. Signal min = mean ratio of low control wells (with PARG, no inhibitor).
c. Signal x = ratio of each test well (with inhibitor at concentration x).
2. Calculate the percentage inhibition for each inhibitor concentration:
3. Plot % inhibition vs. log[inhibitor] (log-transformed concentration in nM).
4. Perform nonlinear regression (four-parameter logistic curve) using the built-in “log(inhibitor) vs. response – variable slope” model in Prism.
5. Report IC50 (concentration that gives 50% inhibition) together with 95% confidence intervals.
6. Quality control criteria:
a. For each set of duplicates, calculate the mean HTRF ratio and standard deviation.
b. Acceptable CV within duplicates: ≤15% (for ratio values). If CV exceeds 15%, the data point should be flagged and, if possible, excluded or repeated.
c. Z′ factor ≥ 0.5 must be achieved using the mean values of high and low control duplicates.
Validation of protocol
The assay measures the activity of PARG (poly(ADP-ribose) glycohydrolase) by monitoring the interaction between ADP-ribosylated His-PARP1C (artificial PAR substrate) and GST-XRCC1 (a PAR-binding protein). In the absence of active PARG, the ADP-ribosylated PARP1C remains intact and binds to XRCC1, bringing the HTRF donor (His-Tb, conjugated to an anti-His antibody) and acceptor (GST-d2, conjugated to an anti-GST antibody) into proximity. The results are in a high FRET signal (665 nm/620 nm ratio, “signal max”). When PARG is active, it hydrolyzes the ADP-ribose chains on PARP1C, disrupting the interaction with XRCC1, leading to a low FRET signal (“signal min”). Inhibition of PARG restores the interaction in a concentration-dependent manner, producing an intermediate signal (“signal x”) used to calculate IC50 values.
To further validate the assay, the known PARG inhibitor PDD 00017273 was tested at 10 concentrations. Fluorescence emission at 620 and 665 nm was measured at each concentration, and the HTRF signal was calculated as (emission665/emission620) × 106. The resulting concentration–response curve yielded an IC50 value of 45.8 nM (Figure 1), consistent with the previously reported value [9]. The corresponding raw fluorescence measurements and calculated HTRF ratios are provided in Supplementary Table S1.
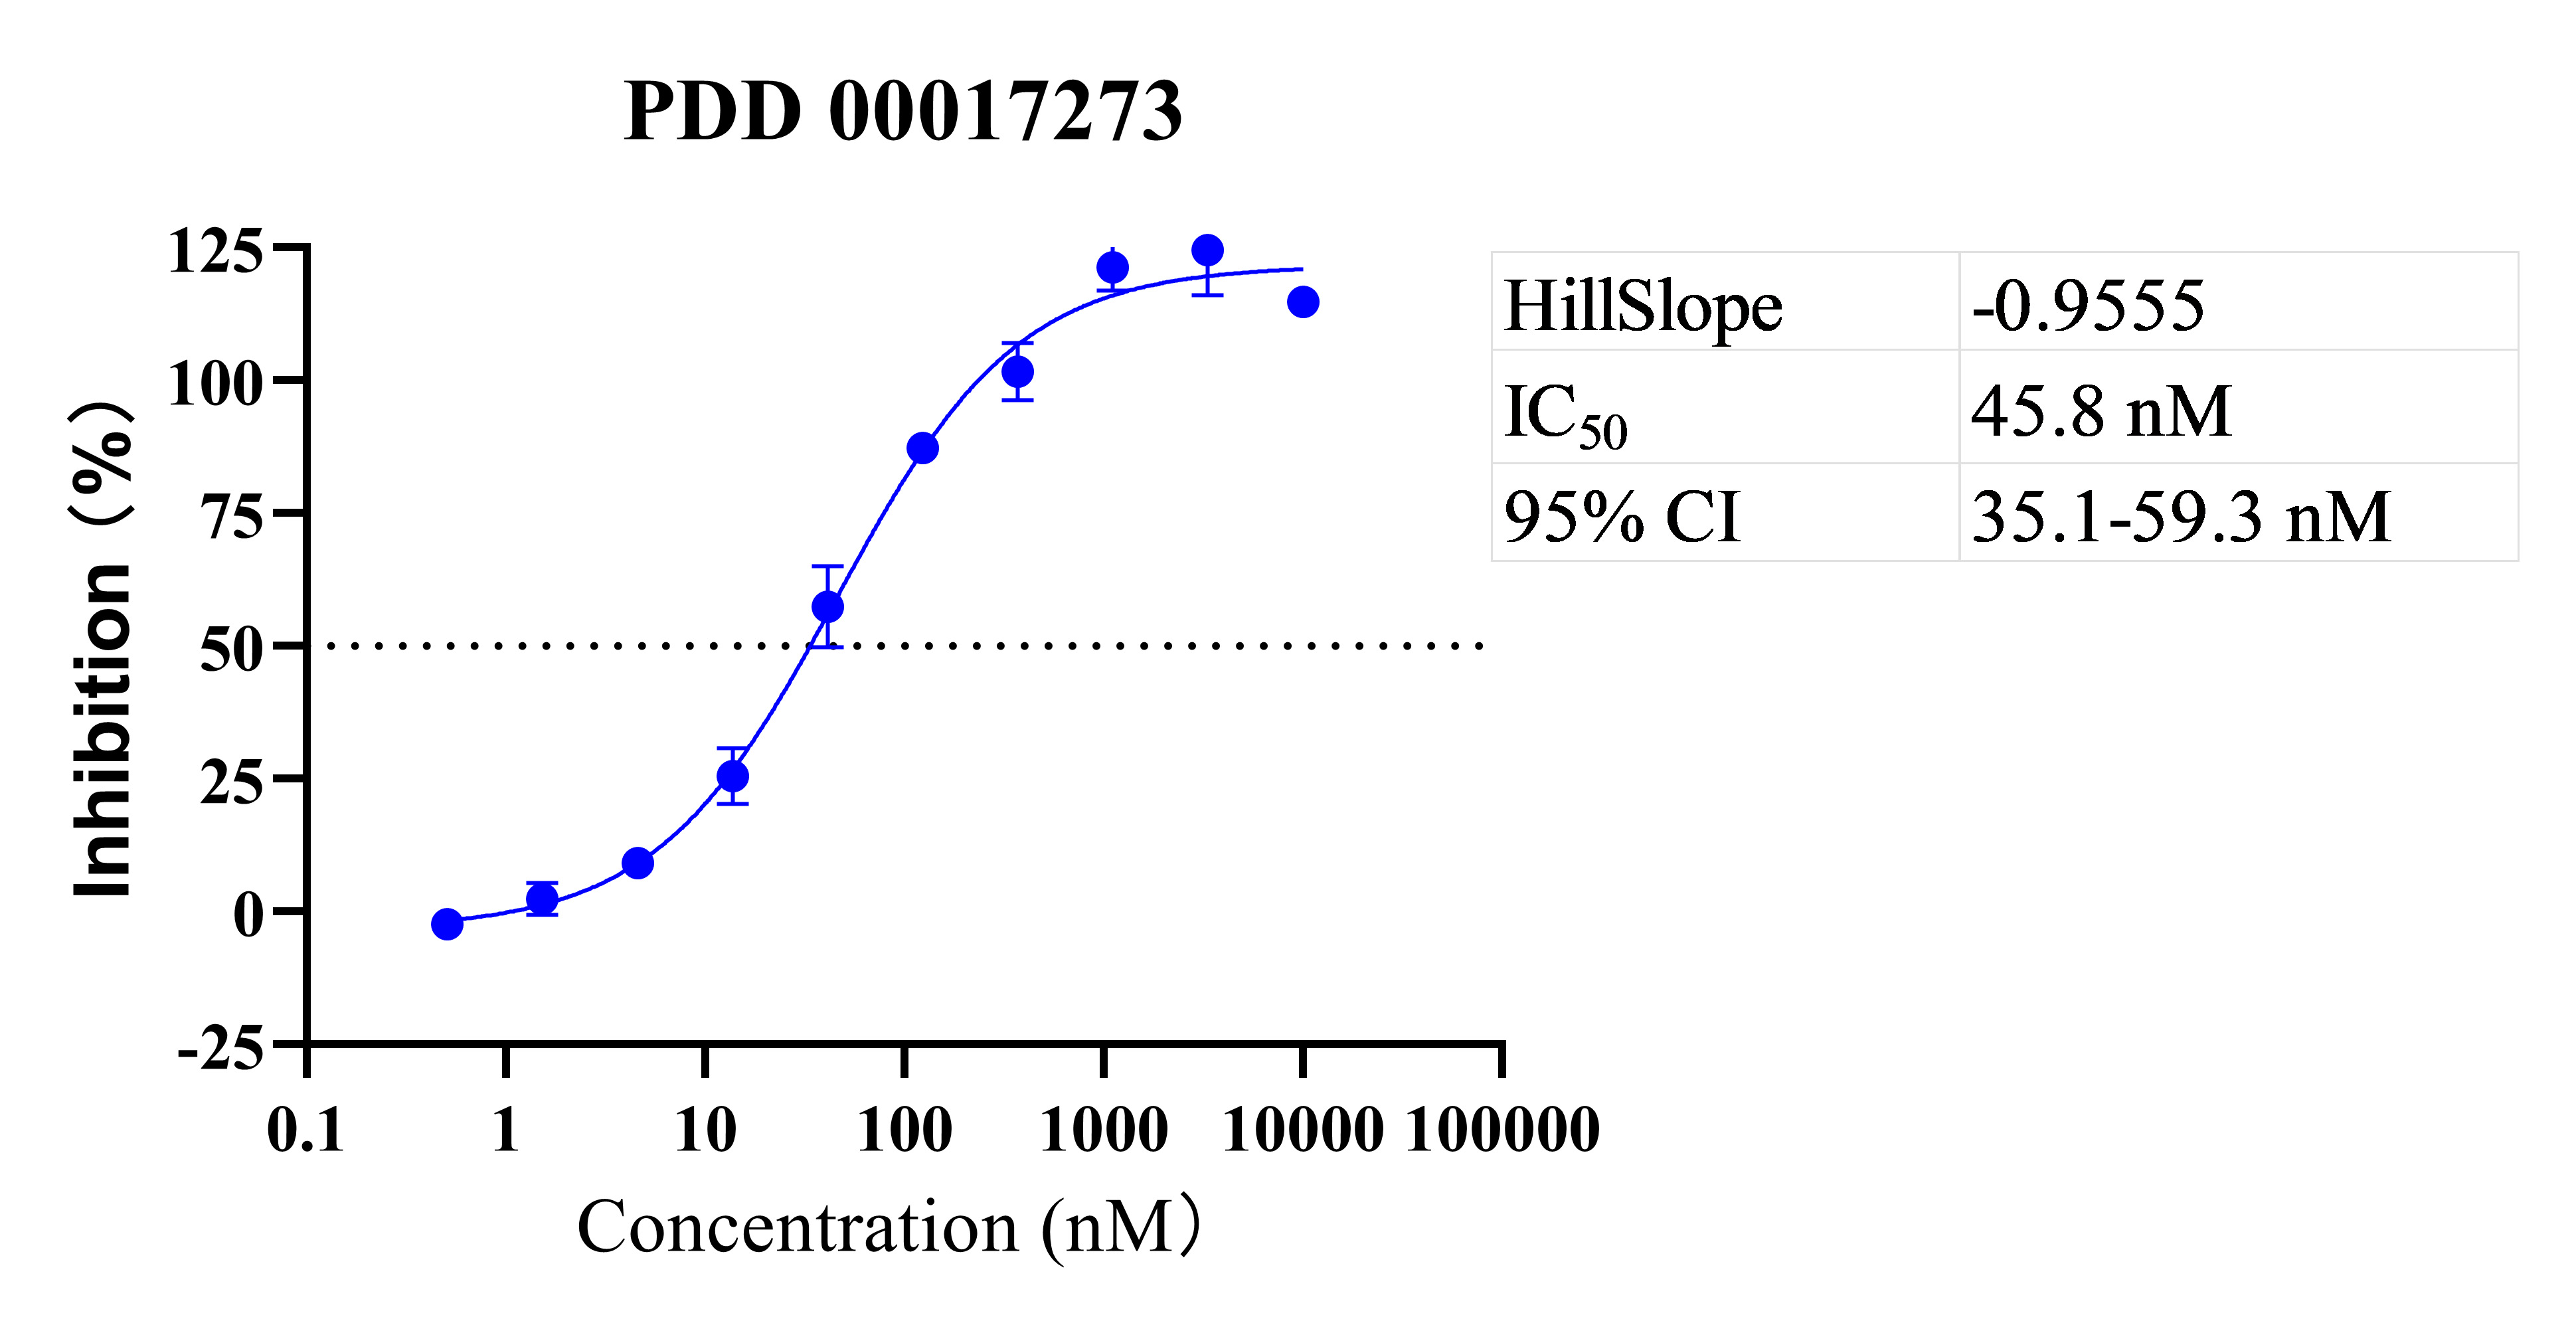
Figure 1. Validation of the homogeneous time-resolved fluorescence (HTRF)-based poly(ADP-ribose) glycohydrolase (PARG) inhibition assay using PDD 00017273. PDD 00017273 was tested at 10 concentrations prepared by a three-fold serial dilution starting at 10 μM. Fluorescence emission was measured at 620 and 665 nm, and the HTRF signal was calculated as (665 nm/620 nm ratio) × 106. The concentration–response curve was generated using a four-parameter logistic regression model. Data are presented as the mean ± SD of 2 replicate measurements. The calculated IC50 value was 45.8 nM (95% CI: 35.1–59.3 nM), consistent with previously reported results. The corresponding fluorescence measurements and calculated HTRF ratios are provided in Supplementary Table S1.
General notes and troubleshooting
Troubleshooting
Problem 1: Weak or no fluorescence signals at both 620 and 665 nm.
Possible cause 1: The HTRF detection reagents were insufficient, incorrectly diluted, or degraded.
Solution 1: Confirm the concentrations, dilution procedures, and storage conditions of the anti-His-Tb donor and anti-GST-d2 acceptor reagents. Prepare fresh working solutions and avoid repeated freeze/thaw cycles.
Possible cause 2: Incorrect microplate reader settings were used.
Solution 2: Verify that the reader is configured with the appropriate excitation wavelength, emission wavelengths of 620 and 665 nm, delay time, and integration time for HTRF detection.
Possible cause 3: An inappropriate microplate was used.
Solution 3: Use white 384-well low-volume plates as specified in the protocol.
Problem 2: High variability is observed among replicate wells.
Possible cause 1: Small volumes were dispensed inaccurately or mixed inconsistently.
Solution 1: Calibrate pipettes or automated dispensers, pre-wet pipette tips, and mix each solution gently but thoroughly.
Possible cause 2: Bubbles were introduced during pipetting or mixing.
Solution 2: Avoid vigorous pipetting and briefly centrifuge the plate at low speed before fluorescence measurement.
Possible cause 3: Evaporation or edge effects occurred during incubation.
Solution 3: Seal the plate during incubation, maintain a constant temperature of 25 °C, and minimize the time between reagent addition and plate reading.
Problem 3: Edge effects are observed in the 384-well plate.
Possible cause 1: Evaporation occurred in the outer wells during incubation.
Solution 1: Seal the plate during incubation and minimize the time between reagent addition and fluorescence measurement. If the assay layout permits, fill unused outer wells with buffer to reduce evaporation.
Possible cause 2: The plate or assay reagents were not equilibrated to the assay temperature.
Solution 2: Equilibrate the plate and all assay reagents to 25 °C before use and maintain a consistent temperature throughout the experiment.
Possible cause 3: The plate was exposed to uneven heating, cooling, or airflow.
Solution 3: Incubate the plate away from direct airflow, heat sources, or cold surfaces, and ensure that it is positioned evenly within the incubator and microplate reader.
Problem 4: The final protein purity is below 95%.
Possible cause 1: Fractions containing contaminating proteins were pooled with the target-protein fractions.
Solution 1: Analyze individual fractions by SDS-PAGE using 10%–12% polyacrylamide gels followed by Coomassie staining. Pool only fractions showing a predominant band at the expected molecular weight of the target protein.
Possible cause 2: The affinity, ion-exchange, or size-exclusion chromatography conditions did not adequately separate the target protein from contaminants.
Solution 2: Optimize the wash and elution conditions for affinity and ion-exchange chromatography. For size-exclusion chromatography, inject a sample volume no greater than 5% of the column volume and pool only the central fractions of the major target-protein peak.
Possible cause 3: The target protein degraded during purification.
Solution 3: Perform the purification at 4 °C or on ice where appropriate, minimize processing time, add freshly prepared DTT, PMSF, or protease inhibitor cocktail as specified, and avoid repeated freeze/thaw cycles.
Supplementary information
The following supporting information can be downloaded here:
1. Supplementary Figure S1. Recombinant protein purification.
2. Supplementary Table S1. Raw fluorescence emission values at 620 and 665 nm and calculated HTRF ratios at 10 compound concentrations.
Acknowledgments
This work was supported in part by Westlake University Education Foundation and Westlake Laboratory of Life Sciences and Biomedicine.
Author contributions
D.W. designed the project. A.Y. and D.W. performed the experiments, analyzed data, and wrote the manuscript. Both authors have read and approved the content of the submitted manuscript.
Competing interests
The authors have no competing interests to claim.
References
- Hou, W. H., Chen, S. H. and Yu, X. (2019). Poly-ADP ribosylation in DNA damage response and cancer therapy. Mutat Res Rev Mutat Res. 780: 82–91. https://doi.org/10.1016/j.mrrev.2017.09.004
- Wei, H. and Yu, X. (2016). Functions of PARylation in DNA Damage Repair Pathways. Genom Proteom Bioinform. 14(3): 131–139. https://doi.org/10.1016/j.gpb.2016.05.001
- Liu, C., Vyas, A., Kassab, M. A., Singh, A. K. and Yu, X. (2017). The role of poly ADP-ribosylation in the first wave of DNA damage response. Nucleic Acids Res. 45(14): 8129–8141. https://doi.org/10.1093/nar/gkx565
- Kassab, M. A. and Yu, X. (2019). The role of dePARylation in DNA damage repair and cancer suppression. DNA Repair. 76: 20–29. https://doi.org/10.1016/j.dnarep.2019.02.002
- Li, P., Wu, D. and Yu, X. (2025). Targeting dePARylation in cancer therapy. DNA Repair. 148: 103824. https://doi.org/10.1016/j.dnarep.2025.103824
- Chen, S. H. and Yu, X. (2019). Targeting dePARylation selectively suppresses DNA repair–defective and PARP inhibitor–resistant malignancies. Sci Adv. 5(4): eaav4340. https://doi.org/10.1126/sciadv.aav4340
- Slade, D. (2020). PARP and PARG inhibitors in cancer treatment. Genes Dev. 34: 360–394. https://doi.org/10.1101/gad.334516.119
- Putt, K. S. and Hergenrother, P. J. (2004). An enzymatic assay for poly(ADP-ribose) polymerase-1 (PARP-1) via the chemical quantitation of NAD+: application to the high-throughput screening of small molecules as potential inhibitors. Anal Biochem. 326(1): 78–86. https://doi.org/10.1016/j.ab.2003.11.015
- James, D. I., Smith, K. M., Jordan, A. M., Fairweather, E. E., Griffiths, L. A., Hamilton, N. S., Hitchin, J. R., Hutton, C. P., Jones, S., Kelly, P., et al. (2016). First-in-Class Chemical Probes against Poly(ADP-ribose) Glycohydrolase (PARG) Inhibit DNA Repair with Differential Pharmacology to Olaparib. ACS Chem Biol. 11(11): 3179–3190. https://doi.org/10.1021/acschembio.6b00609
- Stowell, A. I., James, D. I., Waddell, I. D., Bennett, N., Truman, C., Hardern, I. M. and Ogilvie, D. J. (2016). A high-throughput screening-compatible homogeneous time-resolved fluorescence assay measuring the glycohydrolase activity of human poly(ADP-ribose) glycohydrolase. Anal Biochem. 503: 58–64. https://doi.org/10.1016/j.ab.2016.03.016
- James, D. I., Durant, S., Eckersley, K., Fairweather, E., Griffiths, L. A., Hamilton, N., Kelly, P., O'Connor, M., Shea, K., Waddell, I. D., et al. (2016). An assay to measure poly(ADP ribose) glycohydrolase (PARG) activity in cells. F1000Research. 5: 736. https://doi.org/10.12688/f1000research.8463.2
- Kessl, J. J., Sharma, A. and Kvaratskhelia, M. (2016). Methods for the Analyses of Inhibitor-Induced Aberrant Multimerization of HIV-1 Integrase. Methods Mol Biol. 1354: 149–164. https://doi.org/10.1007/978-1-4939-3046-3_10
Article Information
Publication history
Received: Jun 25, 2026
Accepted: Aug 10, 2026
Available online: Aug 25, 2026
Published: Sep 20, 2026
Copyright
© 2026 The Author(s); This is an open access article under the CC BY-NC license (https://creativecommons.org/licenses/by-nc/4.0/).
How to cite
Yu, A. and Wu, D. (2026). Homogeneous Time-Resolved Fluorescence-Based Assay to Screen ADP-Ribosyl Hydrolase Inhibitors. Bio-protocol 16(18): e5814. DOI: 10.21769/BioProtoc.5814.

 Download Citation in RIS Format
Category
Cancer Biology > Genome instability & mutation > Drug discovery and analysis
Biochemistry > Protein > Posttranslational modification
Molecular Biology > DNA > DNA damage and repair
Do you have any questions about this protocol?
Post your question to gather feedback from the community. We will also invite the authors of this article to respond.
 Post a Question


