


- Protocols

- Articles and Issues
- For Authors
- About
- Become a Reviewer


Semi-Automated Multiplex Workflow for Functional In Vitro Testing of Chemotherapeutic Treatments in Primary, Patient-Derived Cancer Organoids

Published: Vol 16, Iss 24, Dec 20, 2026 DOI: 10.21769/BioProtoc.5803 Views: 239
Reviewed by: Philipp WörsdörferNarendra Verma
 PDF
PDF  Ask a question
Original research article
The authors used this protocol in:

Sep 2024

Protocol Collections
Comprehensive collections of detailed, peer-reviewed protocols focusing on specific topics




Abstract
Most existing preclinical models have been limited in their predictive value to mimic patients’ responses, which is a major drawback in drug development and the identification of predictive biomarkers. To overcome these limitations, patient-derived three-dimensional in vitro models have been proposed. One of them is the organoid model, which preserves the original cellular heterogeneity and recapitulates epithelial architecture and functionality. Recently, studies using patient-derived organoids for drug screening applications have increased in quantity, and organoids have already been applied to pancreatic, colon, and lung cancers and female gynecological malignancies. Here, we established a multiplex workflow to analyze longitudinal therapeutic effects of anti-cancer therapeutics on organoid growth, viability, and cytotoxicity by combining state-of-the-art viability measurement with automated live cell imaging. This workflow can be used for the prediction of patient-specific treatment response, high-throughput screening of potential anticancer drugs, and downstream analysis to identify novel therapeutic targets.
Key features
• Multiplex workflow combines automated live cell imaging and metabolic readouts for viability quantification.
• It uses commercial and state-of-the-art readouts that serve as the gold standard for 3D cell cultures.
• It enables the differentiation of cytotoxic and cytostatic effects of chemotherapeutics.
• It allows for functional, precision medicine and the comparison of patient responses to chemotherapy.
Keywords: Organoids Personalized medicine
Functional precision medicine
Automated imaging
Multiplexing
Cell Titer Glo 3D
Personalized medicine
Functional precision medicine
Automated imaging
Multiplexing
Cell Titer Glo 3D
Graphical overview
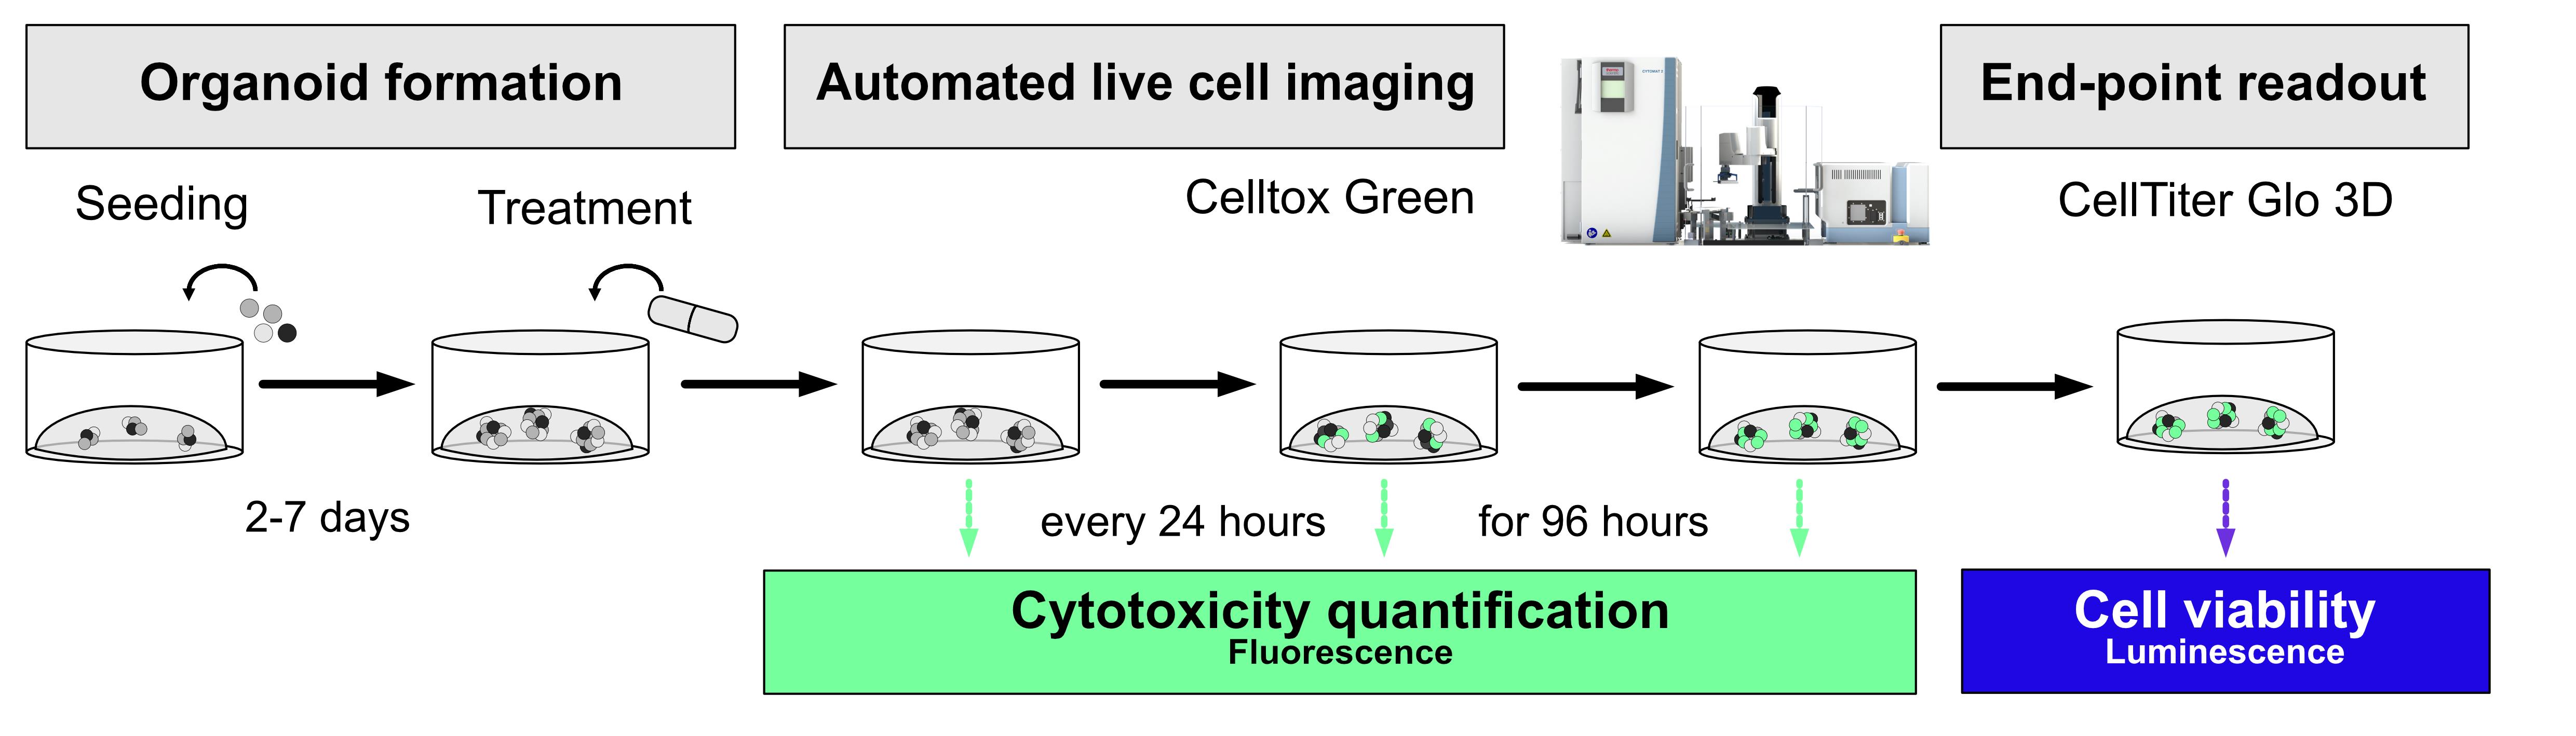
Summary of the described workflow. Organoids are seeded in 96-well plates and grown for 2–7 days, depending on organoid entity and growth characteristics. Then, cells are treated with different concentrations of chemotherapeutics, supplemented with CellTox Green cytotoxicity assay, and transferred to an automated imaging system (i.a. by SYNENTEC). Plates are imaged at the t0 timepoint and every 24 h to compare chemotherapeutic influence on cell growth and cytotoxicity. After 96 h, the CellTiter-Glo 3D cell viability assay is performed for end-point viability readouts.
Background
Despite advantages in prevention, detection, and treatment, cancer remains a major cause of death in Western countries, accounting for millions of new diagnoses and deaths each year. Lung cancer remains the leading cause of cancer-related deaths, followed by colorectal, breast, prostate, and pancreatic cancer [1]. Personalized medicine has the potential to improve treatment efficacy and overcome therapy resistance by characterizing the molecular profile of the patient’s tumor and identifying targetable pathways [2,3]. As conventional 2D in vitro models are limited in their ability to mimic patient-specific tumor biology and therefore often fail to adequately predict patient-specific therapy responses, multiple 3D models have been proposed to overcome these limitations [4]. One of them is the organoid model. Organoids are three-dimensional in vitro models that mimic the structural, genetic, and functional characteristics of their original tissue and preserve cellular heterogeneity. Patient-derived organoids can be generated from resected tumor tissue or fine-needle biopsies [2]. Expansion through serial passaging enables the generation of sufficient biological material for large-scale drug screening and downstream analysis, even from small resected specimens. Since their first description by Sato et al. [5], organoids have revolutionized the field of stem cell research, and their application has also expanded to cancer research. To date, organoids have been successfully established for various tumor entities, including pancreatic ductal adenocarcinoma (PDAC), ovarian cancer, head and neck squamous cell carcinoma, and lung cancer [6–13].
Here, we establish a medium-throughput, multiplex workflow including automated imaging monitoring longitudinal (chemo-) therapeutic effects on growth and cytotoxicity that is paired with gold-standard, state-of-the-art viability measurement using CellTiter-Glo 3D®. Using this workflow, drug response profiles can be easily detected, and morphological changes, i.e., loss of organoid integrity and cytotoxicity, are monitored in parallel. The CellTiter-Glo® 3D cell viability assay (Promega) confirms and complements results generated by imaging approaches and serves as the end-point readout. The protocol described here, therefore, enables the parallel, complementary measurement of various parameters that all share significance for functional precision medicine of primary cancers. Longitudinal imaging enables differentiation of cytostatic and cytotoxic features of used (chemo-) therapeutics, while end-point measurements using gold-standard assays enable comparison with other published datasets. Application of multimodal and longitudinal imaging of patient avatar models like organoids will enable high-throughput screens for alternative anticancer therapeutics, thereby facilitating an essential step toward patient-specific therapy.
Materials and reagents
Reagents
1. Extracellular matrix (ECM), i.a., Matrigel (Corning, catalog number: 354230); aliquot and store at -80 °C
Note: The protocols listed here were established using Matrigel. The use of other substitutes may affect organoid growth.
2. Advanced DMEM/F12 (Gibco, catalog number: 12634010); store at 4 °C
3. DPBS (PanBioTech, catalog number: P04-36500); store at 4 °C
4. TrypLE Express (Gibco, catalog number: 12605010); store at 4 °C
5. 1 M HEPES buffer (PanBioTech, catalog number: P05-01100); store at 4 °C
6. GlutaMax (Gibco, catalog number: 35050038); store at 4 °C
7. Penicillin/Streptomycin (Gibco, catalog number: 15140122); aliquot and store at -20 °C
8. Bovine serum albumin (BSA) (Carl Roth, catalog number: 3854); store at 4 °C
9. CellTox Green cytotoxicity assay (Promega, catalog number: G8731); store at -20 °C
10. CellTiter-Glo 3D cell viability assay (Promega, catalog number: G9682); store at -20 °C
11. Puromycin (InvivoGen, catalog number: ant-pr-1); store at -20 °C
12. Dimethyl sulfoxide (DMSO) (Sigma-Aldrich, catalog number: D2650); store at room temperature (RT)
Solutions
1. Advanced DMEM/F12+++ (ADF+++) (see Recipes)
2. Coating solution (see Recipes)
Recipes
1. ADF+++
| Reagent | Final concentration | Quantity or volume |
|---|---|---|
| Advanced DMEM/F12 | - | 500 mL |
| HEPES | 10 mM | 5 mL |
| GlutaMax | 1× | 5 mL |
| Penicillin/Streptomycin | 1% (v/v) | 5 mL |
Note: Keep at 4 °C for a maximum of four weeks. Invert the bottle to mix.
2. Coating solution
| Reagent | Final concentration | Quantity or volume |
|---|---|---|
| BSA | 0.1% | 2 mL of a 10% BSA stock |
| DPBS | Fill up to 200 mL |
Note: Filter the freshly made solution through a 0.22-μm filter to avoid contamination and keep at 4 °C for a maximum of three months. Invert the bottle to mix.
Laboratory supplies
1. 24-well tissue culture plates (TPP/Faust, catalog number: 92024; or comparable product)
2. 15, 50 mL conical centrifuge tubes (TPP/Faust, catalog numbers: 91015, 91050; or comparable product)
3. 1.5, 2 mL Eppendorf tubes (Sarstedt, catalog numbers: 72.706, 72.695.500; or comparable product)
4. 10, 200, 1,000 μL ART barrier pipette tips (Thermo Scientific, catalog numbers: 10098960, 10029040, 10313272; or comparable product)
5. Vacuum filtration system rapid Filtermax (0.22 μm) (TPP, catalog number: 99505; or comparable product) for filtration of coating solution
6. Duran glass bottles (500, 1,000 mL) (Schott, catalog numbers: 4459, 5455; or comparable product) for coating solution stock
7. Sterile 96-well flat clear bottom white polystyrene TC-treated microplates (Corning, catalog number: 3903; or comparable product)
8. B Braun solo cone Luer syringes (1/20 mL) (Braun, catalog number: 12752637; or comparable product)
9. Single-use 18 G syringe needles (blunt, 40 mm) (VWR, BD Medical, catalog number: BDAM303129)
Equipment
1. Safety cabinet for BSL-2 work, Safe 2020 Class II Biological Safety Cabinet (Thermo Scientific, catalog number: 51026640; or comparable device)
2. Shaking water bath (Lauda, model: Hydro H 20 S; or comparable device)
3. Centrifuge for 50/15 mL tubes (Hettich, model: Rotina 420R; or comparable device)
4. Incubator with temperature, CO2, and humidity control (Binder, model: CB-UL; or comparable device)
5. Standard benchtop brightfield microscope for cell monitoring (Zeiss, model: Axiolab 5; or comparable device)
6. Automation Suite composed of CYTOMAT 2 C-LiN, SYBOT-1000, and CELLAVISTA 4K (SYNENTEC)
Note: Alternatively, automated imagers can also be used as standalones like the CELLAVISTA, NYONE (both SYNENTEC), or the Incucyte systems (Sartorius).
7. Standard laboratory refrigerator
8. Standard laboratory -20 °C freezer
9. Standard laboratory -80 °C freezer
10. Box, bucket, or crate for ice
11. Standard laboratory pipettes (P1000, P100, and P10)
Software and datasets
1. YT-SOFTWARE (SYNENTEC GmbH, v25.9.1; license required) for image analysis
2. Scheduler (SYNENTEC GmbH, v26.0.0; license required) for automated image scheduling
3. Excel (Microsoft, 2021; license required) or LibreOffice packages (v26.2; free to use)
4. Prism (GraphPad, v11.0.0; license required) or R (v4.5.2; free to use) [14] for downstream analysis
Procedure
This protocol describes the use of earlier established organoid lines. If organoid lines have to be established prior to use, refer to Trillsch et al. [15] or Holthaus et al. [16] for protocols for organoid establishment.
A. Seeding organoid into 96-well plates
Note: These steps are derived from published protocols by Mahe et al. [17] for organoid passaging and are presented in a modified form here. The same workflow can therefore be used for passaging organoids into 24-well plates.
Critical: All subsequent steps are performed in a biosafety cabinet under BSL2 conditions. Assess local guidelines before working with potentially infectious primary material.
1. Before starting, prepare the following:
a. Thaw an appropriate amount of the ECM on ice for subsequent usage.
Note: Depending on the aliquot volume of the ECM, thawing can take several hours. If 10-mL aliquots are used, thaw the ECM on ice inside a refrigerator overnight. Thaw 0.7 mL of ECM for each new 96-well plate.
b. Prewarm an appropriate number of 96-well plates at 37 °C.
c. Prepare a bucket with ice.
Note: Handling cells, ADF+++, and ECM on ice allows for easier handling and prevents the ECM from polymerizing.
d. Cool down the centrifuge to 4 °C for the subsequent steps.
e. Prepare ADF+++ (see Recipes) and the respective organoid media.
f. Warm up the respective organoid media.
g. Coat all 15 mL Falcon tubes with sterile coating solution (see Recipes). Prepare one tube for each group of ≤12 wells per organoid line. Apply the solution to all surfaces that come into contact with cells by up-and-down pipetting or decanting.
h. Coat all syringes and needles by attaching the needle to the syringe and up-and-down pipetting the sterile coating solution.
i. Pre-chill ADF+++ to 4 °C for subsequent steps.
j. Prepare a bucket of ice.
2. Disrupt the ECM inside the medium in each well of the routine passage plate (in our case, a 24-well plate; adjust volumes if another plate type is used) using a P1000 pipette tip by scraping off the ECM droplet inside the medium.
Note: It is faster to disrupt all wells first and then harvest the solution inside the 15-mL Falcon tubes. For beginners, it is best to monitor their progress with each well by disrupting and then directly harvesting.
3. Collect ≤12 wells in a single 15-mL Falcon tube.
Note: The inclusion of more wells per tube will result in incomplete pelleting of cells and ECM. Repeated washing steps are advisable in case large amounts of ECM are still visible on top of the cell pellet after centrifugation. Refer to Figure 1 for representative images.
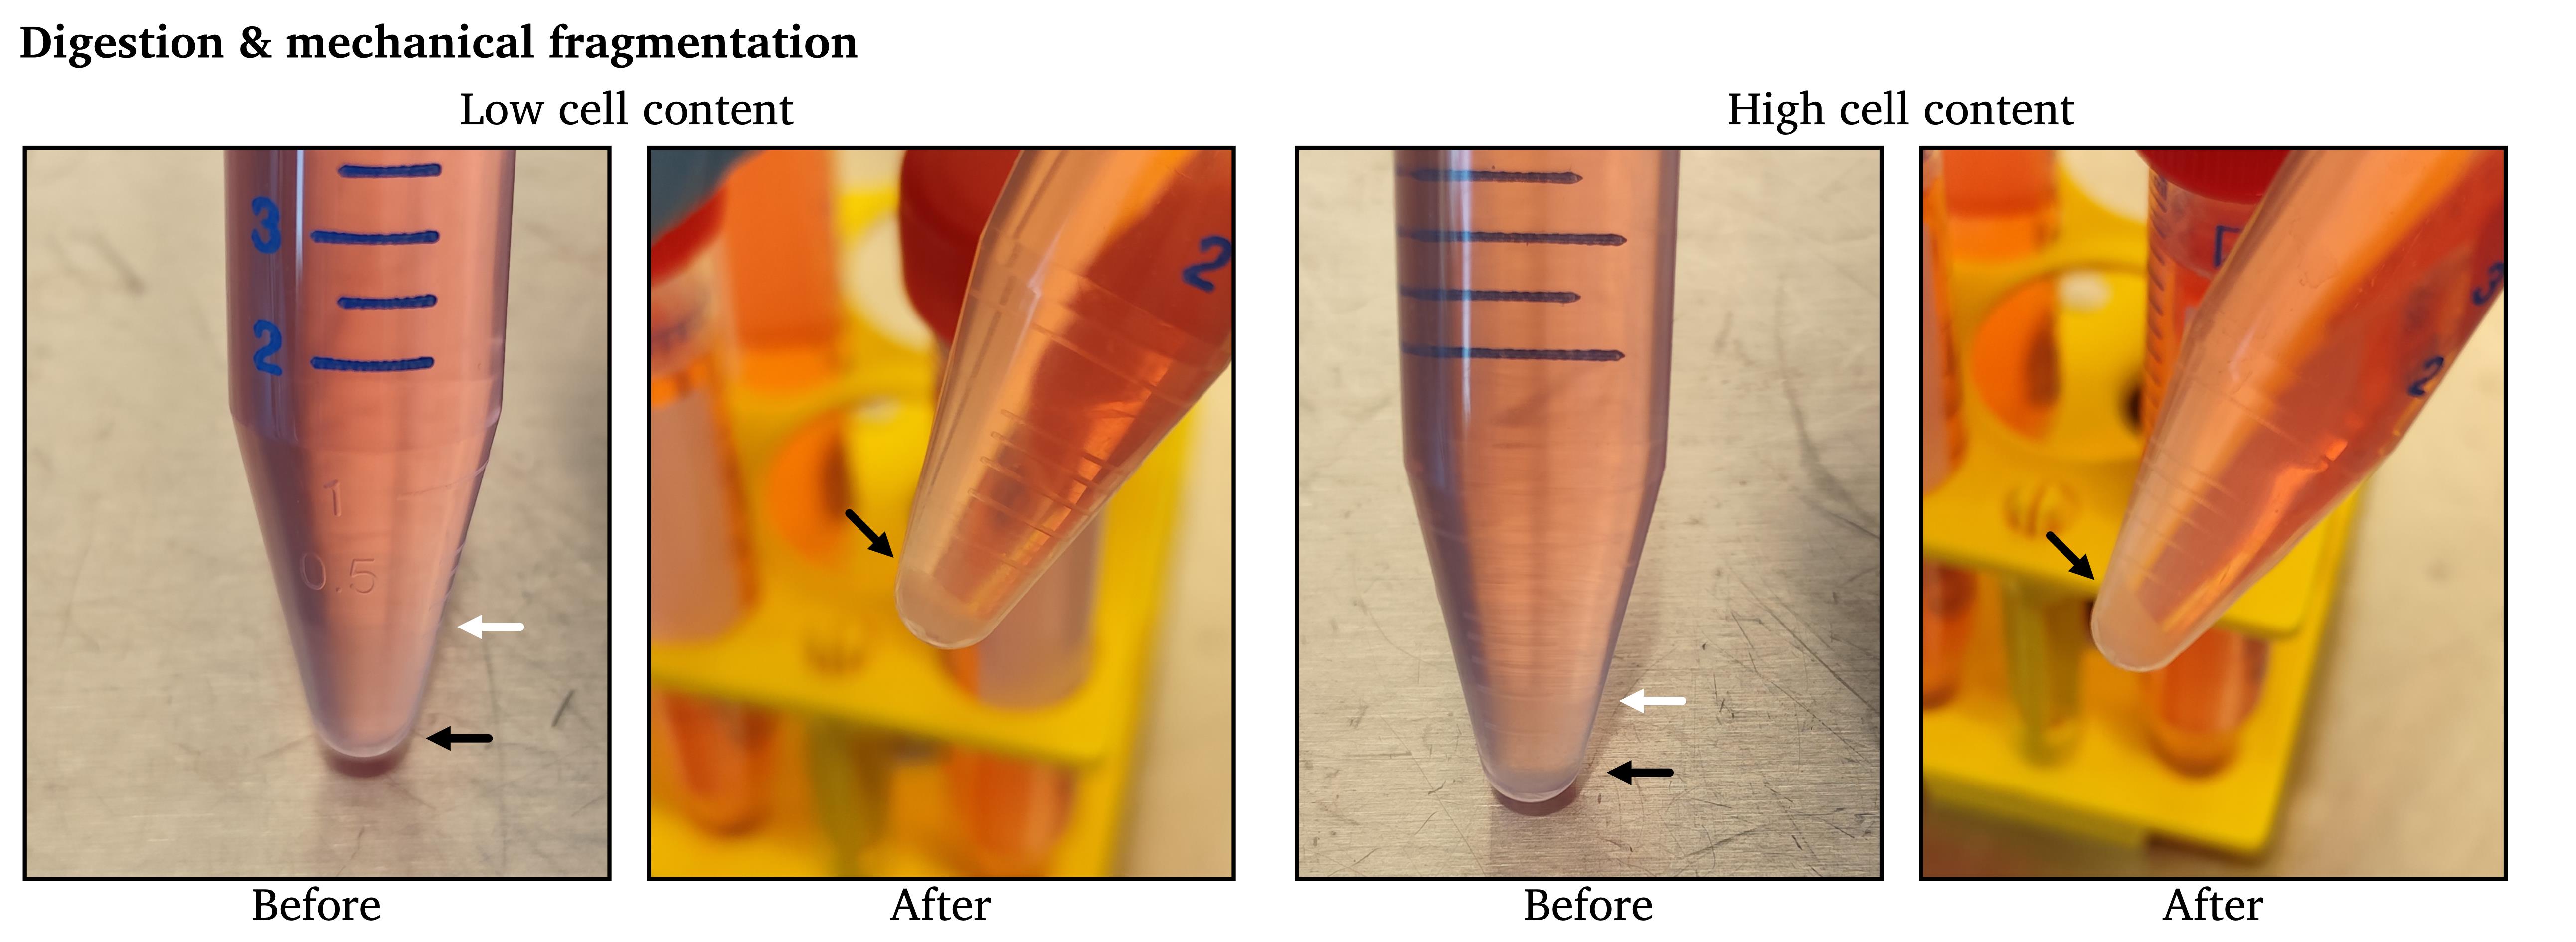
Figure 1. Exemplary images of successful pelleting of cells during passaging. “Before” images taken after step A6 and “After” images taken after A12. White arrows indicate the border of ECM/supernatant, and black arrows indicate the border of cells/supernatant. Aspiration of the ECM is not necessary, as the digestion, fragmentation, and washing will remove the remaining ECM. Image is derived from Holthaus et al. [16].
4. Add an appropriate amount of ice-cold ADF+++ to each 15-mL Falcon tube up to a total volume of 12 mL.
5. Close the tubes and invert the 15-mL Falcon tubes to mix the suspension.
6. Pellet the collected cells by centrifugation at 450× g for 5 min at 4 °C.
7. Aspirate the supernatant.
8. Add TrypLE Express (100 μL per well) and resuspend.
9. Incubate for 5–10 min at 37 °C in a water bath.
Note: A shaking water bath increases the efficacy of digestion.
10. Fragment the organoids by up-and-down pipetting using a coated syringe fitted with an 18 G needle.
Critical: Coat the syringe and needle by up-and-down pipetting with coating solution directly before use. Do not prepare in advance.
Note: The number of up-and-down pipetting is dependent on the handler and organoid entity; 2–5 times is normally sufficient for fragmentation.
11. Add an appropriate amount of ice-cold ADF+++ to each 15-mL Falcon tube up to a total volume of 12 mL.
12. Pellet the collected cells by centrifugation at 450× g for 5 min at 4 °C.
Critical: Successful digestion is visible during this step by the absence of an ECM pellet above the cells.
13. Aspirate the supernatant.
Note: It is best if you continue to work on ice.
14. Add ice-cold ADF+++ up to a total volume of 400 μL per 15-mL tube and resuspend the pellet.
15. Add the cell/media mixture to 0.7 mL of ECM in a 1.5 mL Eppendorf tube on ice and carefully resuspend without creating bubbles.
Critical: It is best to add 400 μL of cell/media suspension to 0.7 mL of ECM in a 1.5 mL Eppendorf tube per plate. The higher the ratio of ECM to cell/media, the longer the ECM droplets will be stable. Try to maintain a 2:1 ratio of ECM to cells/media. Adjust these numbers depending on your volumes, cell numbers, and Falcon tubes. The seeding ratios depend on the organoid lines. As a rule of thumb, lines can be passaged/seeded at a 1:2–1:4 ratio.
16. Repeat for all other prepared Eppendorf tubes.
17. Seed 10 μL per well into a 96-well plate. Seed three plates per organoid cell line as technical replicates.
Note: Use sterile 96-well flat clear bottom white polystyrene TC-treated microplates (see Materials), as they give the best results for fluorescence and luminescence readings and offer high-quality imaging.
Critical: Work on ice, as ECM might polymerize otherwise.
Critical: Resuspend the mixture every four columns, as organoids might sink down and seeding densities might vary as a consequence.
Critical: Use a yellow pipette tip (100–200 μL total volume) and a P100 pipette, as smaller tips tend to clog due to the viscosity of the ECM.
Critical: Pipette in the middle of the well, as disturbances will impair the live cell imaging later on.
18. Repeat until all plates are prepared.
Note: Remaining cells can be seeded into 24-well plates and used for other purposes.
19. Incubate the plates at 37 °C for 30 min.
20. Prewarm the organoid media in a water bath to 37 °C.
21. Overlay the droplets with 100 μL of prewarmed medium.
22. Incubate at 37 °C, 5% CO2 in a humidified incubator for 2–7 days, depending on organoid growth characteristics.
B. Preparation of master plates for titrations of chemotherapeutics
Notes:
1. Prepare technical triplicates per organoid line with one replicate per plate, accounting for three plates per line.
2. Search literature for the appropriate concentrations for each included agent. Generally, a range of 0.1–20 μM serves as a good starting point, but ranges are highly dependent on the potency of the agent and the entity of cancer organoids used.
3. We recommend 20 μL total volume per well of the final drug/media mixture.
1. Add CellTox Green cytotoxicity assay reagent to the media (ADF+++) for a final concentration of 1:2,000 in the wells (50 μL of CellTox Green in 10 mL of ADF+++ for five plates).
Note: Use ADF+++ instead of the respective organoid media if more than one entity is used or the organoid lines require various media.
2. Calculate the volumes of (chemo-) therapeutic agents per well, concentrations, and plate. Exemplary calculations for a stock of 1 mM cisplatin are given in Table 1.
Table 1. Exemplary calculations for a stock of 1 mM cisplatin
| 5 plates (20 μL total volume per well) | ||||||
| Concentration | 0.1 μM | 1 μM | 2.5 μM | 5 μM | 10 μM | 20 μM |
| Volume | 0.1 μL | 1 μL | 2.5 μL | 5 μL | 10 μL | 20 μL |
| add ADF+++ to a total volume of 100 μL per well | ||||||
| 10 plates (20 μL total volume per well) | ||||||
| Concentration | 0.1 μM | 1 μM | 2.5 μM | 5 μM | 10 μM | 20 μM |
| Volume | 0.2 μL | 2 μL | 5 μL | 10 μL | 20 μL | 40 μL |
| add ADF+++ to a total volume of 200 μL per well | ||||||
Critical: If the chemotherapeutic agents are dissolved in DMSO (or other solvents), add the highest concentration of DMSO (or other solvents) on the master plate to your negative control wells.
Critical: Include three negative control wells (including DMSO if appropriate) and three positive control wells (use 2 μg/mL puromycin or comparable compounds) in your plate design. We have included an exemplary plate design in Table 2.
Critical: Edge effects on 96-well plates are considerable and may skew results. We therefore advise against placing controls in edge wells only.
Table 2. Exemplary plate design for 15 different chemotherapeutic agents (A–O), negative, and positive controls. Columns 1–12 and rows A–H are given.
| 1 | 2 | 3 | 4 | 5 | 6 | 7 | 8 | 9 | 10 | 11 | 12 | |
| A | 0.1 μM A | 1 μM A | 2.5 μM A | 5 μM A | 10 μM A | 20 μM A | 0.1 μM I | 1 μM I | 2.5 μM I | 5 μM I | 10 μM I | 20 μM I |
| B | 0.1 μM B | 1 μM B | 2.5 μM B | 5 μM B | 10 μM B | 20 μM B | 0.1 μM J | 1 μM J | 2.5 μM J | 5 μM J | 10 μM J | 20 μM J |
| C | 0.1 μM C | 1 μM C | 2.5 μM C | 5 μM C | 10 μM C | 20 μM C | 0.1 μM K | 1 μM K | 2.5 μM K | 5 μM K | 10 μM K | 20 μM K |
| D | 0.1 μM D | 1 μM D | 2.5 μM D | 5 μM D | 10 μM D | 20 μM D | DMSO | 2 μg/mL puromycin | ||||
| E | 0.1 μM E | 1 μM E | 2.5 μM E | 5 μM E | 10 μM E | 20 μM E | 0.1 μM L | 1 μM L | 2.5 μM L | 5 μM L | 10 μM L | 20 μM L |
| F | 0.1 μM F | 1 μM F | 2.5 μM F | 5 μM F | 10 μM F | 20 μM F | 0.1 μM M | 1 μM M | 2.5 μM M | 5 μM M | 10 μM M | 20 μM M |
| G | 0.1 μM G | 1 μM G | 2.5 μM G | 5 μM G | 10 μM G | 20 μM G | 0.1 μM N | 1 μM N | 2.5 μM N | 5 μM N | 10 μM N | 20 μM N |
| H | 0.1 μM H | 1 μM H | 2.5 μM H | 5 μM H | 10 μM H | 20 μM H | 0.1 μM O | 1 μM O | 2.5 μM O | 5 μM O | 10 μM O | 20 μM O |
3. Pipette the appropriate amounts of chemotherapeutic agents into the wells of a separate sterile 96-well plate using your plate design.
4. Add the media/CellTox Green mixture to the wells.
5. Seal the plate using parafilm for later use or use directly in section C.
Critical: Use the prepared plates as fast as possible, as drug stability may vary and influence downstream results.
C. Semi-automated multiplex workflow for functional in vitro testing of chemotherapeutic treatments
1. Before starting, prepare the following:
a. Warm up organoid media in a water bath at 37 °C.
b. Warm up prepared plates with chemotherapeutic agents to room temperature.
2. Add 80 μL of the prewarmed media to the wells using a multichannel pipette.
3. Add 20 μL of the media/drug mixtures to the respective wells containing the organoids.
4. Transfer the plates with the organoids and the added media/drug mixtures out of the biosafety cabinet.
5. Label the plates with printed labels, including barcodes.
Note: We recommend printed barcodes with printers such as the P-Touch 700 system with 6-mm labels if an automated imaging system is used.
6. Transfer plates to the incubator of the automated imaging system or stand-alone imager.
Note: This protocol uses the automated imaging system from SYNENTEC, comprised of CELLAVISTA 4K, SYBOT X-1000, and CYTOMAT 2 C-LiN (all SYNENTEC) (Figure 2). The use of other devices, such as the Incucyte (Sartorius), is possible but is not covered here.
Caution: Training is required for using the automated imaging system and accompanying software, as inappropriate use may lead to critical release of chemotherapeutic agents, aerosols, and/or infectious agents from the primary cells.
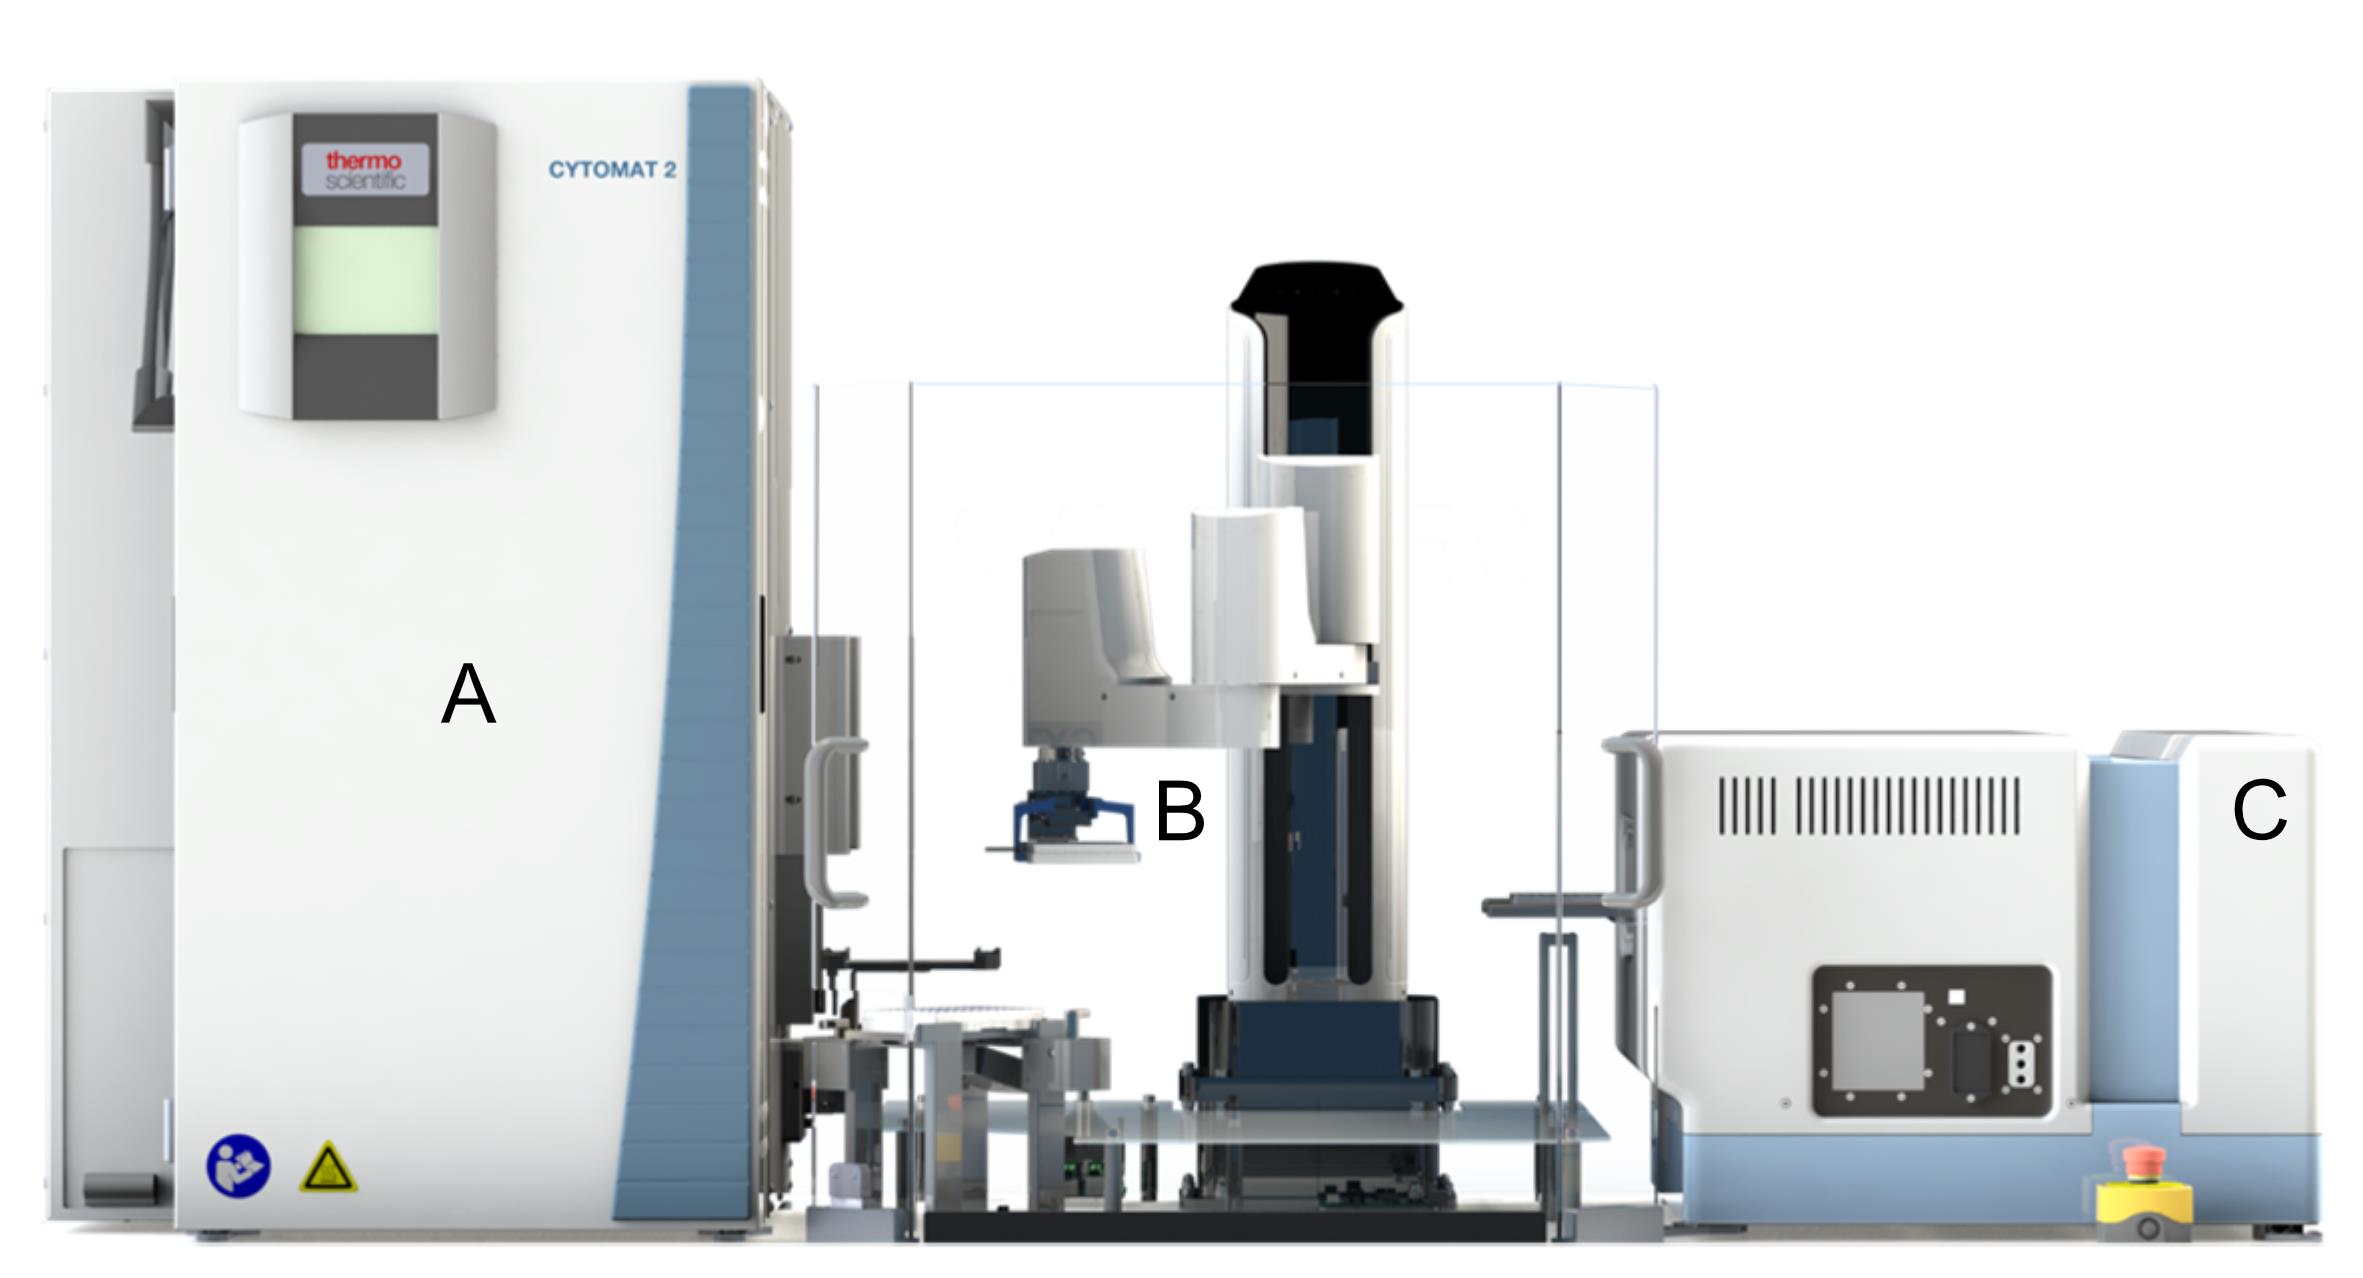
Figure 2. Schematic representation of the imaging system. The system is composed of a CYTOMAT 2 C-LiN incubator (A) that is connected via a SYBOT X-1000 robotic arm (B) to a high-throughput CELLAVISTA 4 automated cell imager (C).
7. Schedule daily imaging of all wells until 96 h after treatment initiation. It is critical to adhere to the following points:
a. Include a t0 measurement for later calculations.
Note: When plates are imaged directly after being transferred, the resulting condensate will make auto-focusing difficult. In these cases, schedule the first time point after 1 h.
b. As organoids are distributed throughout the ECM droplets, include three different Z values (0, -100 μm, +100 μm) per channel.
c. Organoids are detected more efficiently when the brightfield channel is overexposed. Therefore, include optimized brightfield settings for publication and overexposed settings. We have used the following settings for brightfield imaging:
Brightfield_low:
Intensity (%): 50
Exposure time (ms): 2
Gain (%): 0
Brightfield_high:
Intensity (%): 75
Exposure time (ms): 4
Gain (%): 0
d. Use two different settings for the detection of CellTox Green cytotoxicity assay, as the emission of fluorescence might vary per organoid line and entity. We have used the following settings for fluorescence imaging:
Green_low:
Intensity (%): 100
Exposure time (ms): 10
Gain (%): 50
Green_high:
Intensity (%): 100
Exposure time (ms): 40
Gain (%): 80
e. Use one template for each plate type, as well locations and sizes all vary slightly.
f. Furthermore, we use the following imaging settings:
Auto focus: Each well
X movement: Default
Y movement: Default
X precision: Default
Y precision: Default
Resolution: (2×2) High sensitivity
Objective: Olympus 4×/0.13
Image processor: Spheroid Quantification (1F) (v. 0.9) (2 channels)
Channels
Brightfield:
Exc: Brightfield
Dichro: UV-Dichro
Emi: Violet_433
Green:
Exc: Blue
Dichro: Blue-Dichro
Emi: Green_530
Centered: Checked
1/9 subwells: Checked
Note: The template with the imaging parameters is available as Supplementary File S1.
8. After live cell imaging: Before starting, warm up CellTiter-Glo 3D cell viability assay reagent to room temperature and let it equilibrate for 30 min.
9. After 96 h, transfer the plate to the biosafety cabinet again.
10. Remove the supernatant by aspiration.
11. Add 50 μL of CellTiter-Glo 3D cell viability assay reagent to the wells.
12. Mix contents well and allow to stabilize at room temperature for 60 min.
Note: Lysis and the resulting luciferase reaction do need incubation times ≥30 min to allow for comparable readouts.
13. Measure luminescence using a plate reader, including a 5-s shaking step before the measurement.
Note: In this protocol, the Sparks system by Tecan was used. We expect that any other plate reader that is able to perform luminescence detection is suitable for this purpose, but we have not tested other systems. Luminescence readings should be performed following the manufacturer’s guidelines of the CellTiter-Glo 3D cell viability assay and should include a 5–20 s shaking step and luminescence readings with approximately 500 ms integration time.
Data analysis
A. Analysis of viability data
Analysis of viability data can be performed in Excel. For this, normalize all wells to the mean of the negative control per plate and then pool normalized values per organoid line. We recommend using three technical triplicates per patient whenever cells are sufficiently available. Dose–response curves can be calculated in Prism (GraphPad) or R (R Core Team [14]). Exemplary data is shown in Figure 3 using Prism (GraphPad) with the least square fit nonlinear regression using the [inhibitor] vs. normalized response – Variable slope analytical derivative with default settings.
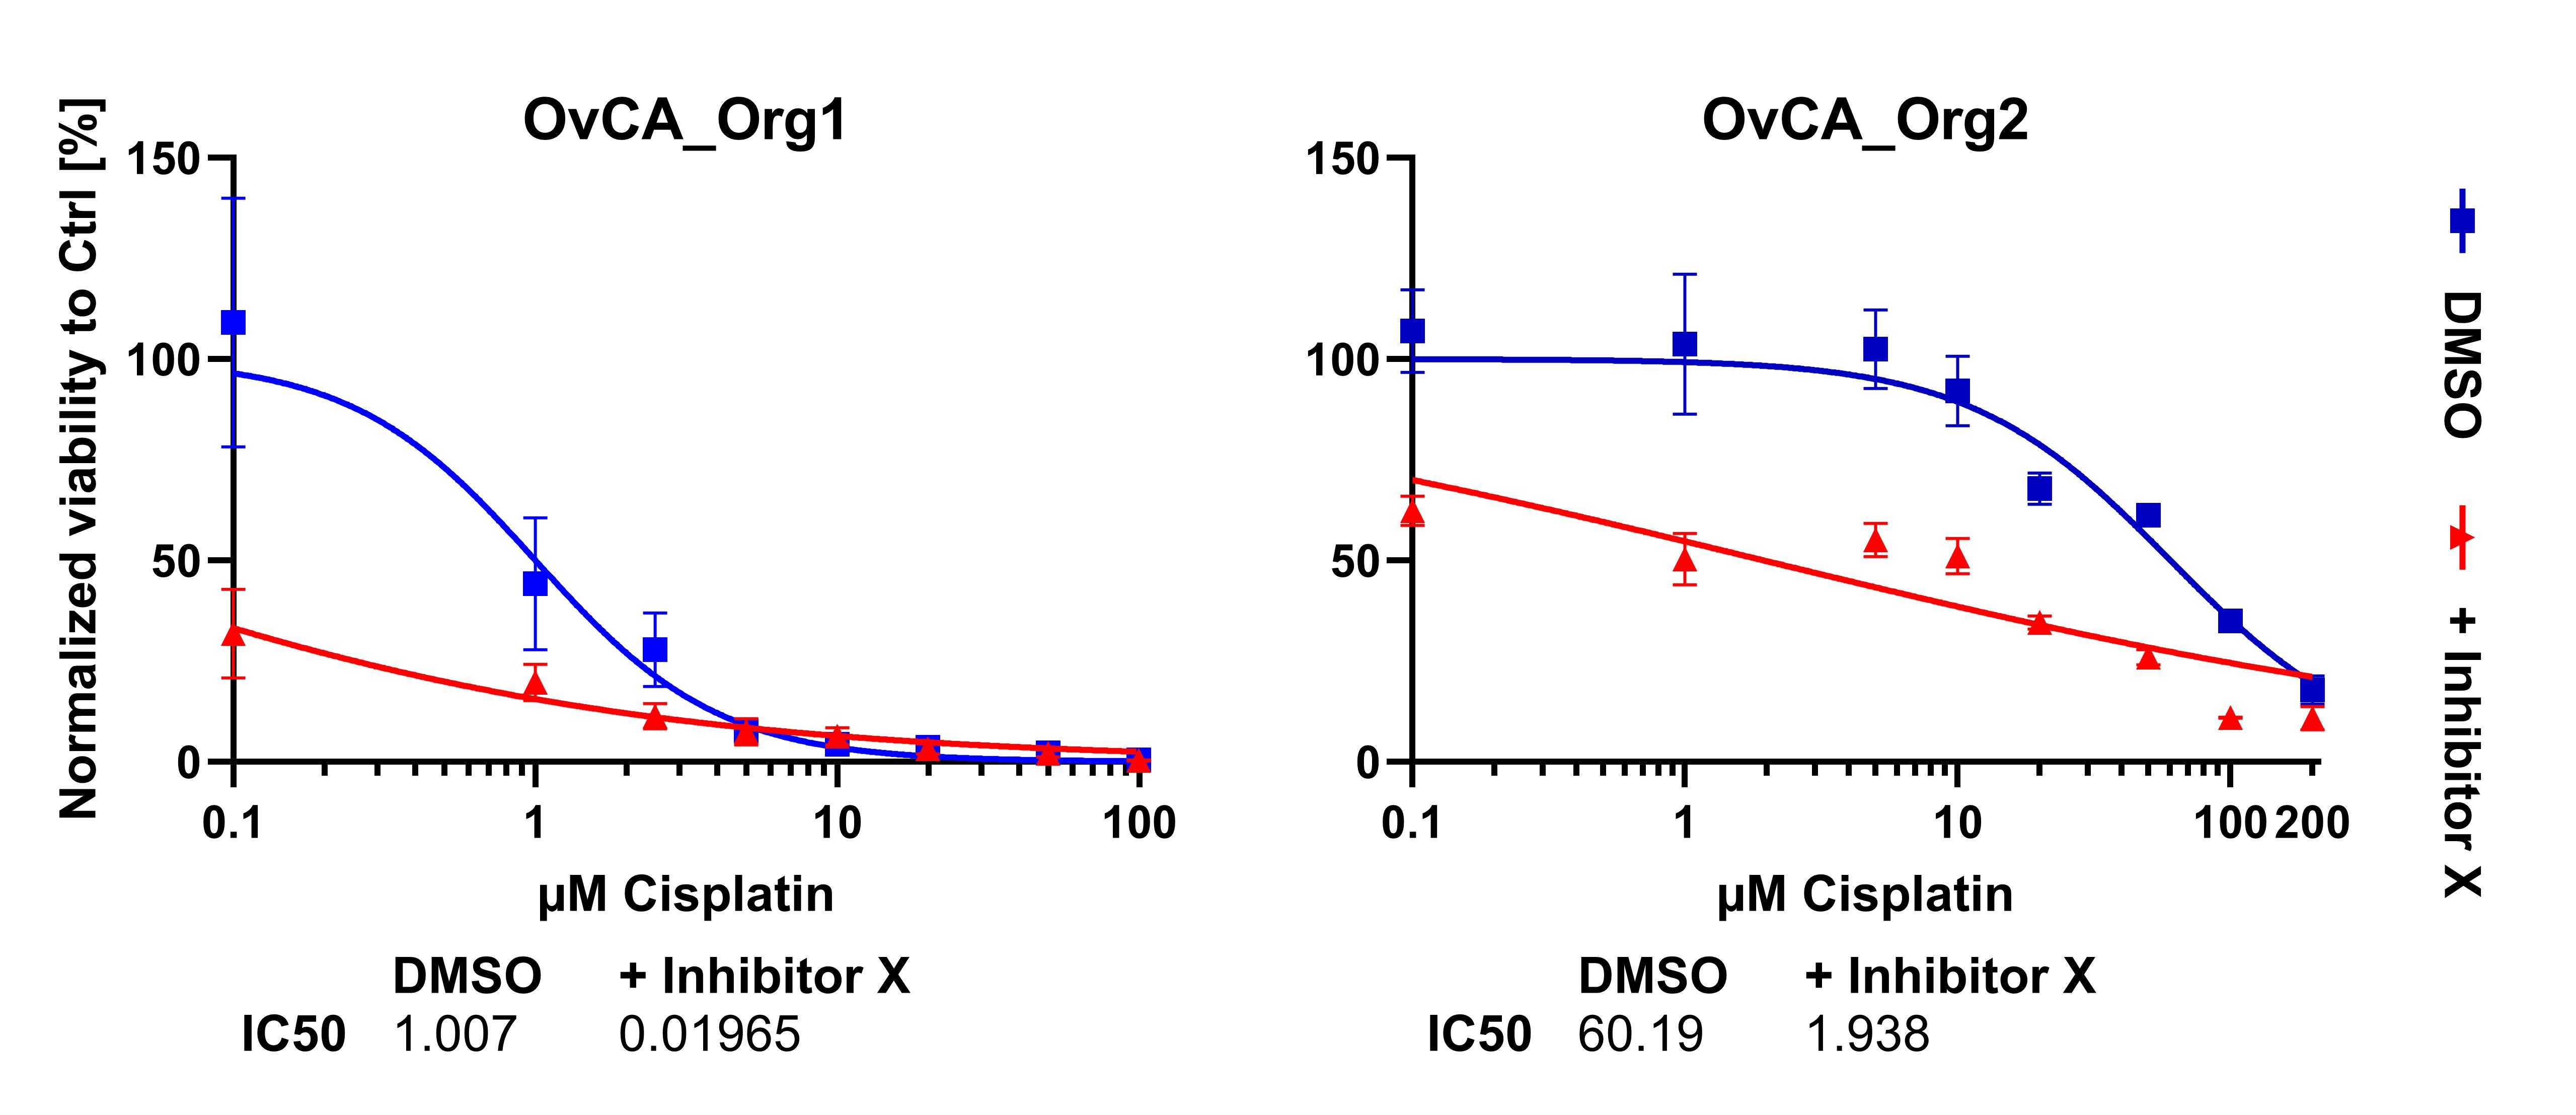
Figure 3. Representative calculations of end-point measurements of viability data using the Cell Titer Glo 3D viability assay. Normalized viability data of one cisplatin-sensitive (OvCa_Org1) and one resistant (OvCa_Org2) ovarian cancer cell line. Mean ± SEM of three technical replicates is shown.
B. Analysis of imaging data using the YT-SOFTWARE
1. Open YT-SOFTWARE and click on Evaluation.
2. Click on View Experiment.
3. Go to Experiment and click on Load Experiment.
4. Open the .xml file in your experiment folder.
5. Go to Image Processor and click on Spheroid Quantification (1F) (v. 0.9) (2 channels).
6. Go to Processing Channel Map and choose Brightfield → [your overexposed brightfield channel, z channel X] and Fluorescence 1 → [one of your green channels, z channel X].
7. Click on Evaluation.
8. Click on Processing. Either:
a. Load your optimized parameters or our exemplary .ops file template (Supplementary File S2) via Load and open the .ops file in the respective folder.
or
b. Use the following parameters:
Image processing [Spheroid Quantification (1F) (v. 0.9)]
Edge distance (μm): 0
Adaptive dark edge detection (1): 0
Spheroids near well center (μm): -1
Internal 2×2 binning: 1
Brightfield
Multiple cell layers expected: Checked
Dark core detection (%): -1
Morph. Opening width (μm): 0
Sensitivity: -4
Obj. min. intensity: 0
Obj. max. intensity: 255
Obj. min. Std. Dev.: 0
Obj. max. Std. Dev.: 255
Obj. min. size (μm2): 5000
Obj. max. size (μm2): 1500000
Obj. min. compactness: 0.2
Obj. max. compactness: 1
Obj. min. longishness: 15
Obj. max. longishness: 100
Obj. min. roughness: 0
Obj. max. roughness: 100
Obj. min. contrast: 0
Obj. max. contrast: 1
Spheroid max. distance (μm): 0
Spheroid min. area (μm2): 5000
Spheroid min. quality (%): 10
Critical: Sensitivity is the most important parameter in this list and is dependent on the contrast between the background and organoids. If dense organoids are imaged, sensitivity can be reduced; if cystic organoids are imaged, sensitivity should be increased.
Fluorescence 1
Fluo threshold BC (Color): 30
Binding factor (%): 30
BG estimation factor (%): 5
Fix BG value (color): -1
9. Click on Process visible.
10. Check results. Compare the results with Figure 4A, B to check whether all organoids were detected.
11. Click on Process all measurements.
Note: The processing is very CPU-dependent. As an example, a 12-core Ryzen 3900X supported by 32 GB RAM takes approximately 2 min to process a full 96-well plate with five measurements using all cores at maximum capacity. We therefore recommend a dedicated computer for image analysis.
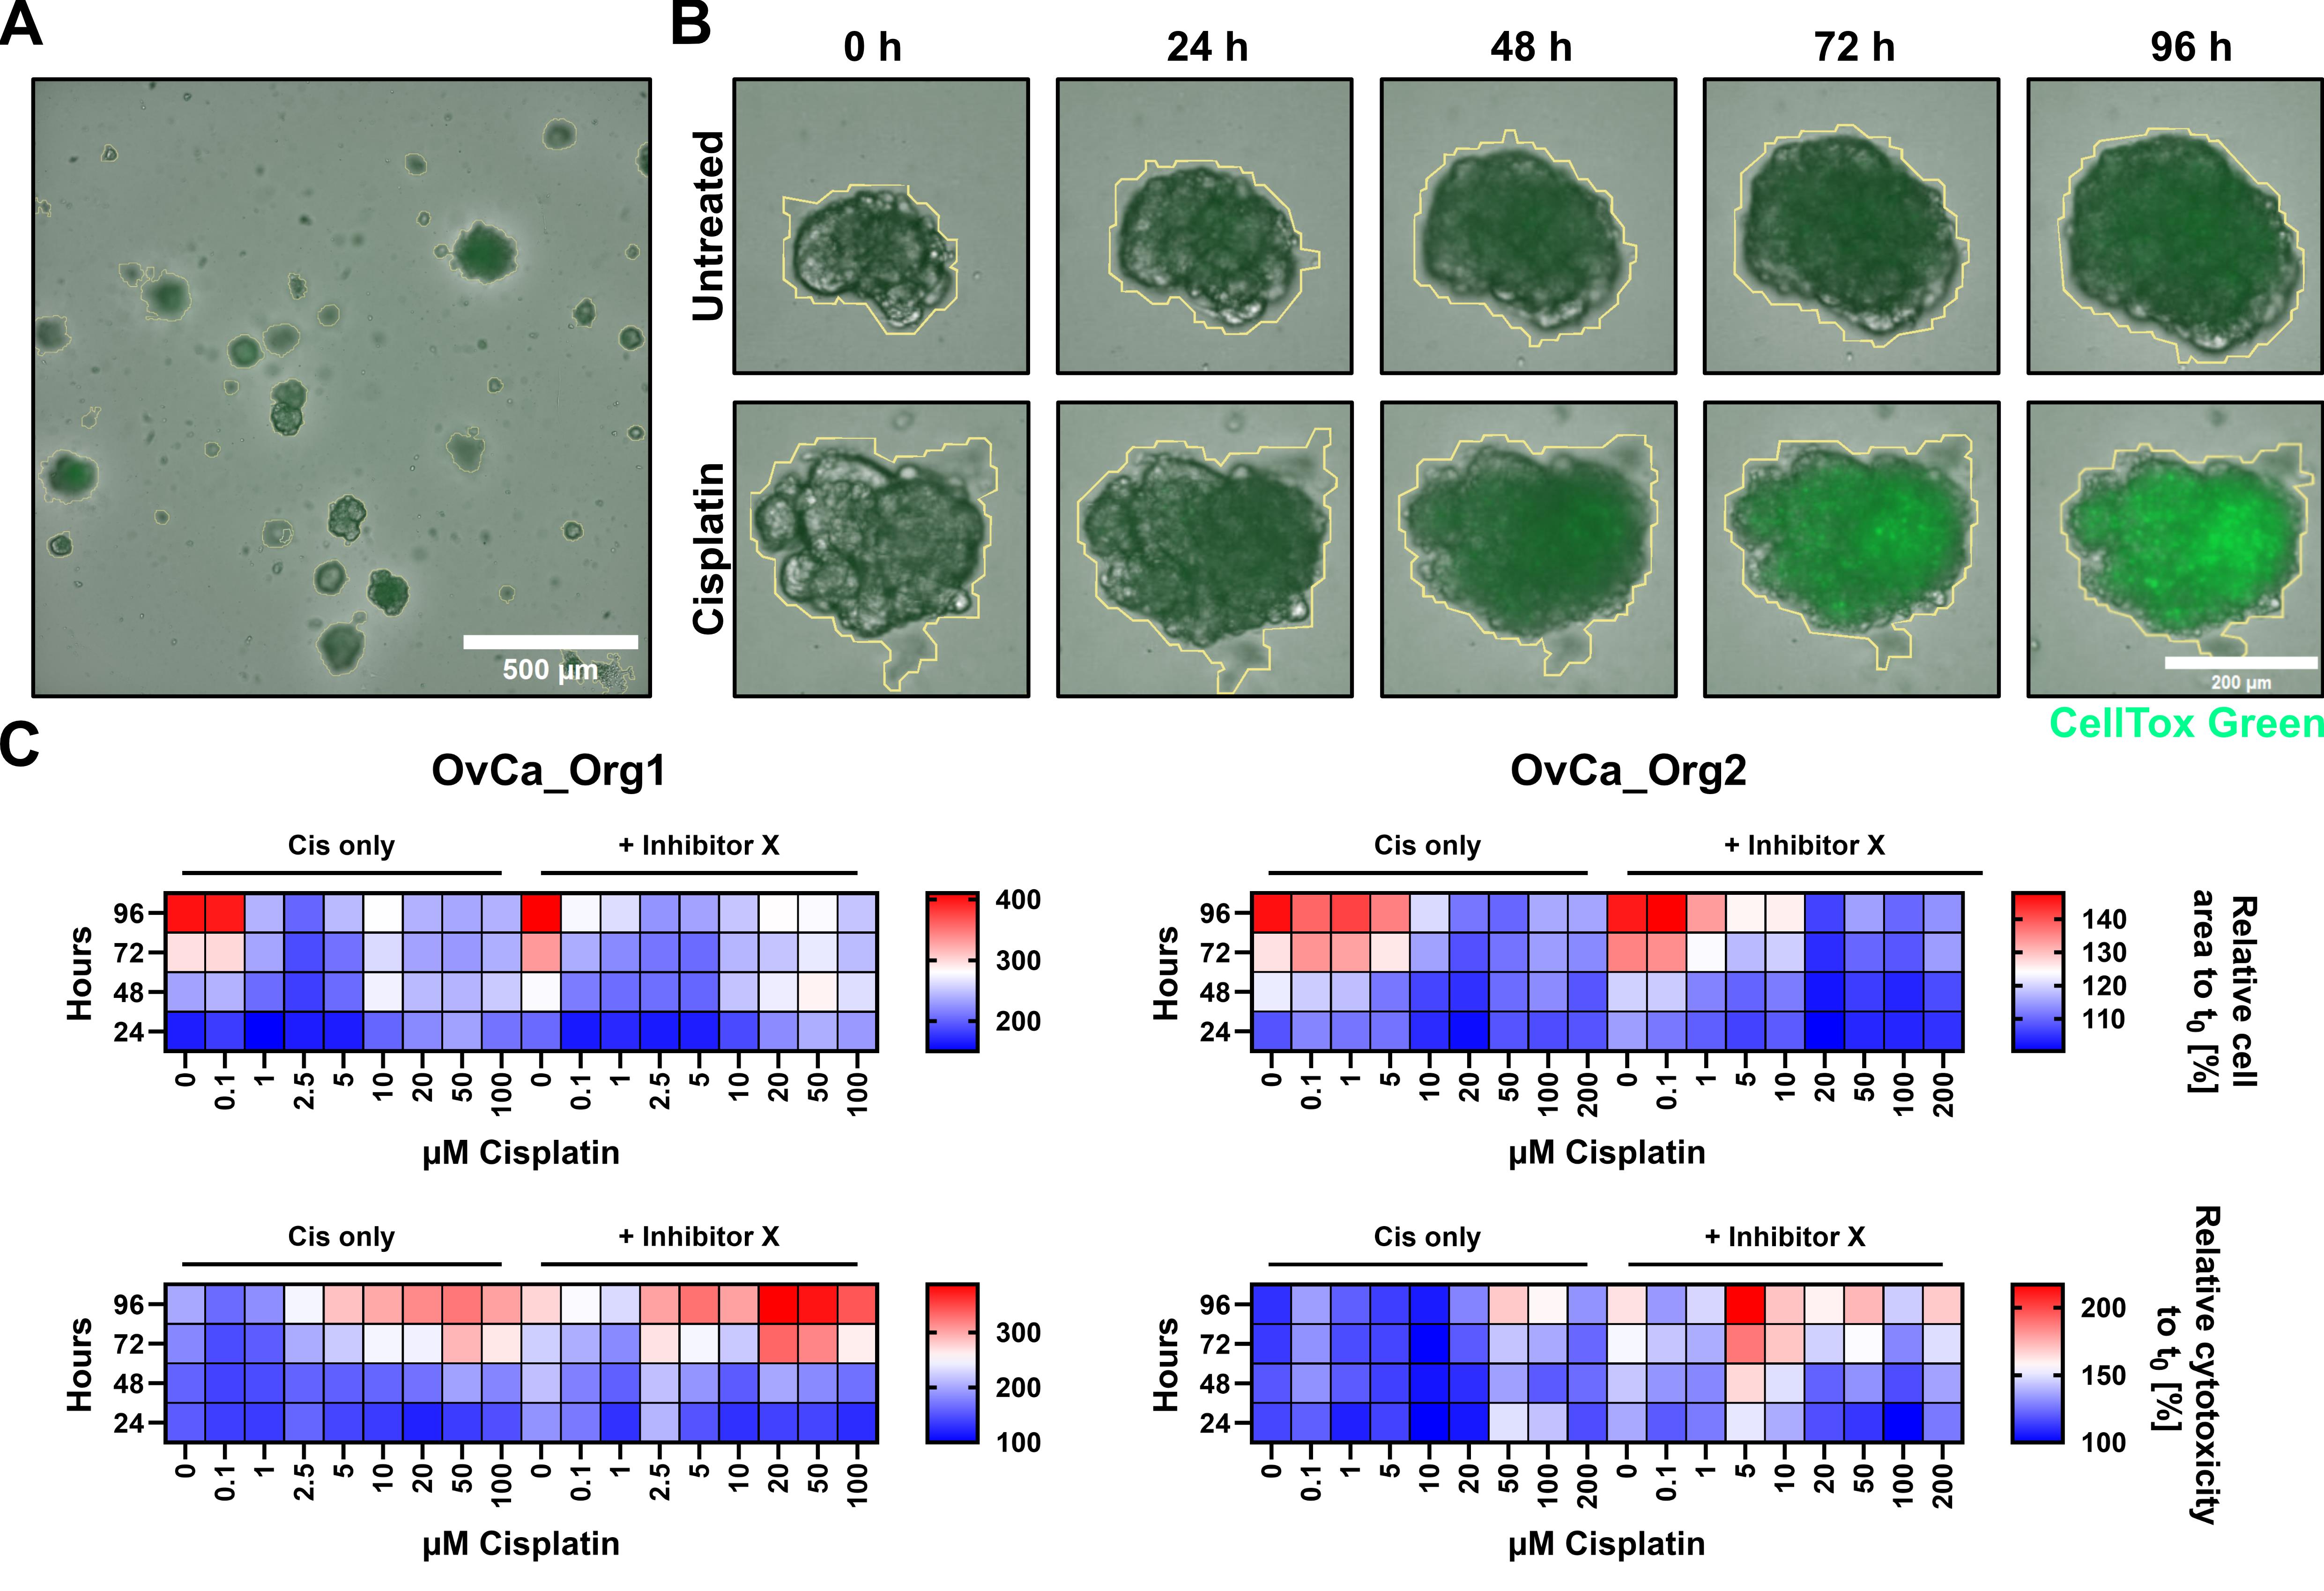
Figure 4. Representative results of the automated live cell imaging readout part of the multiplex workflow. (A, B) Representative images of OvCa_Org1 are shown. The overview image shows optimal seeding density in 96-well plates (A) and the effect of the chemotherapeutic cisplatin over the course of 96 h (B). Yellow lines mark detection by YT-SOFTWARE (SYNENTEC) using the Spheroid Quantification 1F operator. Images were taken with the CELLAVISTA4 automated imaging system. (C) Means of three technical replicates for t0-normalized values for cell area and cytotoxicity (as shown by CellTox Green) are shown for OvCa_Org1 and OvCa_Org2. Data was analyzed and visualized in Prism (GraphPad, v11.0.0) and assembled in Affinity Designer 2 (Serif, v2.6.5).
12. Click on Analyst.
13. Compare results on the heat map with your expected results.
Critical: If the results are satisfactory, proceed to export. Otherwise, use different Processing settings.
14. Click on Export.
15. Use the following parameters for the export or adjust if necessary:
Export files: Choose your path for export
Selection: check All measurements
check All wells
Format: Image files → .tiff
Data files → .csv
Data to export: check Result table
check One file per measurement
Note: It is possible to extract single organoid data here via checking Object data.
16. Click on Export. The resulting data exported as a .csv file can either be imported into Prism via Excel (Figure 5C) or directly analyzed in free bioinformatic tools like R [14] using packages like pheatmap [18]. Refer to Figure 5C for exemplary visualizations.
Validation of protocol
This protocol (or parts of it) has been used and validated in the following research articles. Refer to the Data Analysis section for exemplary data of the protocols for drug panel applications and Holthaus et al. [19]. We have additionally used this protocol for the combinatorial treatments of cisplatin and A Disintegrin And Metalloprotease (ADAM) 10/17 inhibitors. The combination of the CellTox Green dye and the Cell Titer Glo 3D viability assay is recommended by the manufacturer (Promega), and the anti-proportional relation of both is accessible on the respective product websites.
Whole workflow:
1. Holthaus, D., Le, H. D., Matzner, L., Kellers, F., Rogmans, C., Winkler, V., Bastian, L., Fliedner, S., Weimer, J. P., Busch, H., et al. (2026). Organoids serve as viable in vitro model for functional precision medicine for mesonephric-like adenocarcinoma of the ovary. JCO Precision Oncology. https://doi.org/10.1200/PO-26-00661 [19] Figure 3.
2. Holthaus, D., Rogmans, C., Gursinski, I., Quevedo-Olmos, A., Ehsani, M., Mangler, M., Florkemeier, I., Weimer, J. P., Meyer, T. F., Maass, N., et al. (2024). Inhibition of ADAM17 increases the cytotoxic effect of cisplatin in cervical spheroids and organoids. Front Oncol 14: 1432239. https://doi.org/10.3389/fonc.2024.1432239. [20] Figures 3–5.
Live cell imaging:
3. Dong, J., Holthaus, D., Peters, C., Koster, S., Ehsani, M., Quevedo-Olmos, A., Berger, H., Zarobkiewicz, M., Mangler, M., Gurumurthy, R. K., et al. (2023). γδ T cell-mediated cytotoxicity against patient-derived healthy and cancer cervical organoids. Frontiers in immunology 14: 1281646. https://doi.org/10.3389/fimmu.2023.1281646. [21] Figure 2.
4. Hedemann, N., Herz, A., Schiepanski, J. H., Dittrich, J., Sebens, S., Dempfle, A., Feuerborn, J., Rogmans, C., Tribian, N., Florkemeier, I., et al. (2021). ADAM17 Inhibition Increases the Impact of Cisplatin Treatment in Ovarian Cancer Spheroids. Cancers (Basel) 13(9). https://doi.org/10.3390/cancers13092039. [22] Figures 2, 5, and 6.
General notes and troubleshooting
General notes
This protocol has been successfully applied to organoids derived from low-grade serous ovarian cancer (LGSOC) [19], high-grade serous ovarian cancer (HGSOC) [19], mesonephric-like adeno carcinoma (MLA) of the ovary [19], cervical squamous cell carcinoma (CSSC) [20], head and neck squamous cell carcinoma (HNSCC), pancreatic ductal adenocarcinoma (PDAC), healthy fallopian tubes [19], and the ectocervix.
Key practical recommendations:
1. Work on ice whenever handling ECM.
2. Controlled production and subsequent quality control of conditioned media are essential before their use as media components. Closely follow published literature [23,24] or commercial protocols (ATCC, CRL-3276 and CRL-2647; ENZO LIFE SCIENCES, ENZ-61002) for production and testing.
3. Coat all surfaces that may come into contact with cells with coating solution to avoid loss of cells.
4. Do not harvest more than 12 wells in a single 15-mL tube, as this may result in the loss of cells due to incomplete pelleting.
5. Passage and seeding ratios strongly depend on the organoid lines and entity. We recommend a narrow observation of each individual organoid culture by the respective researchers. For beginners, we recommend documenting confluency, number, and size of organoids before and after subcultivation (possible via imaging) and noting dates and ratios of subcultivation.
6. Use, at best, a 2:1 ratio of ECM to media when seeding organoids.
7. Do not place negative or positive controls on the edges of the 96-well plate, as these wells often show deviation from the rest of the plate.
8. Do not store prepared plates with chemotherapeutics for prolonged times, as the activity of the drugs may be altered.
9. Differentiating cytostatic and cytotoxic responses of organoids from live cell imaging data is performed by comparing the fluorescence signal of the CellTox Green and organoid growth characteristics (like cell area) over time. Cytotoxic effects are characterized by an increase in fluorescence signal, while cytostatic drugs are characterized by a stable cell area with no increase in fluorescence.
Troubleshooting
Problem 1: Organoids are overcrowded, and the medium turns yellow in color.
Possible cause: Excess number of epithelial cells seeded.
Solution: Seed an appropriate number of cells per ECM droplet. Higher density of organoids in the ECM may induce stress to epithelial cells and sudden death of organoids due to inadequate availability of growth components from the medium. Collect and reseed at a lower density.
Problem 2: Collapsed ECM and adherent cells.
Possible cause 1: ECM was not adequately mixed during aliquoting.
Solution 1: Completely thaw the ECM stock overnight at 4 °C in ice. Mix properly before aliquoting. Harvest the cells and passage as described above.
Possible cause 2: Ratio of ECM to medium is too low.
Solution 2: Add more ECM to the cell–medium mixture before seeding. Harvest the cells and passage as described above.
Problem 3: No organoid growth.
Possible cause 1: Cells were diluted at too high a ratio.
Solution 1: Seed a higher density of epithelial cells in the initial culture.
Possible cause 2: Growth factor missing in the 3D medium or inactive.
Solution 2: Ensure that the growth factors were reconstituted at the recommended concentration and used within the expiry date, and double-check each growth factor addition during 3D medium preparation.
Problem 4: Fewer organoids after harvest.
Possible cause: Organoids lost during aspiration, or organoids stuck to the tube or pipette tip.
Solution: Coat all plastic with 0.1% BSA and/or use low-binding tubes.
Problem 5: Organoids suspended in the ECM after centrifugation.
Possible cause 1: ECM was not cold during harvest.
Solution 1: Use ice-cold ADF+++ to harvest organoids and mix ECM three to four times with ADF+++.
Possible cause 2: ECM sticking to the tubes.
Solution 2: Coat all plastic with 0.1% BSA and/or use low-binding tubes.
Possible cause 3: Collected more than 12 wells in one 15-mL Falcon tube.
Solution 3: Divide the suspension into multiple 15-mL Falcon tubes. Collect less than 12 wells per tube.
Possible cause 4: Insufficient digestion.
Solution 4: Increase incubation time with TrypLE Express or the amount of up-and-down pipetting.
Supplementary information
The following supporting information can be downloaded here:
1. Supplementary File S1: BF_Green_Organoids_3Z_Corning, .ztp file for Scheduler-software (SYNENTEC)
2. Supplementary File S2: OrganoidQuant_Standard, .ops file template for live cell analysis using YT-SOFTWARE (SYNENTEC)
Acknowledgments
We thank the whole SYNENTEC team for providing their automation system and helping with imaging and analysis. The authors thank Gudrun Kliem from FG16 at the Robert-Koch Institute in Berlin for help with quality control of the conditioned media for the culture of organoids used in representative images. We thank the Gyn Biobank and TRIBank via the P2N network for providing the samples used for organoid establishment. We acknowledge financial support by Land Schleswig-Holstein within the funding program Open Access Publikationsfonds.
This protocol was used in [19–22].
Author contributions:
Methodology: D.H., N.H. Resources: M.T.v.M., J.P.W., N.M., S.Se., D.O.B., N.H. Conceptualization: D.H., A.B., D.O.B., N.H. Investigation: D.H., A.B., Fi.G., Fr.G., C.V. Writing—Original Draft: D.H., A.B. Writing—Review & Editing: D.H., A.B., N.H., S.Se. Funding acquisition: D.H., A.B., M.T.v.M., S.Se., D.O.B., N.H. Supervision: D.H., N.H.
Funding:
D.H., A.B., and N.H. acknowledge support from the University Cancer Centre Schleswig-Holstein (UCCSH) and the University Cancer Centre Hamburg (UCCH) via the Twinning and CONNECT Initiatives. D.H. and N.H. thank UKSH-Gemeinsam Gutes tun! Förderstiftung des UKSH (017_2023) for funds enabling ovarian organoid cultures. N.H. acknowledges funding by the German Research Society (DFG, ID 558466534). A.B., S.Se., and N.H. acknowledge funding from the Kiel Oncology Network (KON).
Competing interests
The authors declare no conflicts of interest. SYNENTEC, or other referred companies, were not involved in study design, data interpretation, manuscript preparation, or publication decision for this protocol or any associated publication.
Ethical considerations
Human cancer samples were provided by the departments of the University Hospital Schleswig-Holstein, Kiel, Germany, via the P2N network and associated biobanks Gyn Biobank and TRIBank. Scientific usage of the samples for experimental purposes was ethically approved by the commission of the medical faculty of Kiel University (Ovarian cancers: D631/24, PDAC: D601/25, HNSCC: D576/24); all subjects gave informed consent to their tissue being used in scientific research.
References
- Siegel, R. L., Kratzer, T. B., Wagle, N. S., Sung, H. and Jemal, A. (2026). Cancer statistics, 2026. CA Cancer J Clin. 76(1): e70043. https://doi.org/10.3322/caac.70043
- Drost, J. and Clevers, H. (2018). Organoids in cancer research. Nat Rev Cancer. 18(7): 407–418. https://doi.org/10.1038/s41568-018-0007-6
- Tiriac, H., Belleau, P., Engle, D. D., Plenker, D., Deschênes, A., Somerville, T. D. D., Froeling, F. E. M., Burkhart, R. A., Denroche, R. E., Jang, G. H., et al. (2018). Organoid Profiling Identifies Common Responders to Chemotherapy in Pancreatic Cancer. Cancer Discov. 8(9): 1112–1129. https://doi.org/10.1158/2159-8290.cd-18-0349
- Kayser, C., Brauer, A., Susanne, S. and Wandmacher, A. M. (2023). The challenge of making the right choice: patient avatars in the era of cancer immunotherapies. Front Immunol. 14: e1237565. https://doi.org/10.3389/fimmu.2023.1237565
- Sato, T., Vries, R. G., Snippert, H. J., van de Wetering, M., Barker, N., Stange, D. E., van Es, J. H., Abo, A., Kujala, P., Peters, P. J., et al. (2009). Single Lgr5 stem cells build crypt-villus structures in vitro without a mesenchymal niche. Nature. 459(7244): 262–265. https://doi.org/10.1038/nature07935
- Boilève, A., Cartry, J., Goudarzi, N., Bedja, S., Mathieu, J. R., Bani, M. A., Nicolle, R., Mouawia, A., Bouyakoub, R., Nicotra, C., et al. (2024). Organoids for Functional Precision Medicine in Advanced Pancreatic Cancer. Gastroenterology. 167(5): 961–976.e13. https://doi.org/10.1053/j.gastro.2024.05.032
- Millen, R., De Kort, W. W., Koomen, M., van Son, G. J., Gobits, R., Penning de Vries, B., Begthel, H., Zandvliet, M., Doornaert, P., Raaijmakers, C. P., et al. (2023). Patient-derived head and neck cancer organoids allow treatment stratification and serve as a tool for biomarker validation and identification. Med 4(5): 290–310.e12. https://doi.org/10.1016/j.medj.2023.04.003
- Maenhoudt, N. and Vankelecom, H. (2021). Protocol for establishing organoids from human ovarian cancer biopsies. STAR Protoc. 2(2): 100429. https://doi.org/10.1016/j.xpro.2021.100429
- Hoffmann, K., Berger, H., Kulbe, H., Thillainadarasan, S., Mollenkopf, H., Zemojtel, T., Taube, E., Darb‐Esfahani, S., Mangler, M., Sehouli, J., et al. (2020). Stable expansion of high‐grade serous ovarian cancer organoids requires a low‐Wnt environment. EMBO J. 39(6): e2019104013. https://doi.org/10.15252/embj.2019104013
- Wang, H. M., Zhang, C. Y., Peng, K. C., Chen, Z. X., Su, J. W., Li, Y. F., Li, W. F., Gao, Q. Y., Zhang, S. L., Chen, Y. Q., et al. (2023). Using patient-derived organoids to predict locally advanced or metastatic lung cancer tumor response: A real-world study. Cell Rep Med. 4(2): 100911. https://doi.org/10.1016/j.xcrm.2022.100911
- Driehuis, E., Kretzschmar, K. and Clevers, H. (2020). Establishment of patient-derived cancer organoids for drug-screening applications. Nat Protoc. 15(10): 3380–3409. https://doi.org/10.1038/s41596-020-0379-4
- Kopper, O., de Witte, C. J., Lõhmussaar, K., Valle-Inclan, J. E., Hami, N., Kester, L., Balgobind, A. V., Korving, J., Proost, N., Begthel, H., et al. (2019). An organoid platform for ovarian cancer captures intra- and interpatient heterogeneity. Nat Med. 25(5): 838–849. https://doi.org/10.1038/s41591-019-0422-6
- Driehuis, E., Kolders, S., Spelier, S., Lõhmussaar, K., Willems, S. M., Devriese, L. A., de Bree, R., de Ruiter, E. J., Korving, J., Begthel, H., et al. (2019). Oral Mucosal Organoids as a Potential Platform for Personalized Cancer Therapy. Cancer Discov. 9(7): 852–871. https://doi.org/10.1158/2159-8290.cd-18-1522
- R Core Team (2021). R: A language and environment for statistical computing.
- Trillsch, F., Czogalla, B., Kraus, F., Burges, A., Mahner, S. and Kessler, M. (2023). Protocol to optimize the biobanking of ovarian cancer organoids by accommodating patient-specific differences in stemness potential. STAR Protoc. 4(3): 102484. https://doi.org/10.1016/j.xpro.2023.102484
- Holthaus, D., Hedemann, N., Geweniger, S., Le, H., Alkatout, I., Kessler, M. and Meyer, T. (2025). Establishing and Maintaining 3D Organoid Cultures From Human Fallopian Tube Epithelium. Bio Protoc. 15(1378): e5412. https://doi.org/10.21769/bioprotoc.5412
- Mahe, M. M., Sundaram, N., Watson, C. L., Shroyer, N. F. and Helmrath, M. A. (2015). Establishment of Human Epithelial Enteroids and Colonoids from Whole Tissue and Biopsy. J Visualized Exp. : e3791/52483. https://doi.org/10.3791/52483
- Kolde, R. (2025). pheatmap: Pretty Heatmaps. (Accessed on)
- Holthaus, D., Le, H. D., Matzner, L., Kellers, F., Rogmans, C., Winkler, V., Bastian, L., Fliedner, S., Weimer, J. P., Busch, H., et al. (2026). Organoids serve as viable in vitro model for functional precision medicine for mesonephric-like adenocarcinoma of the ovary. JCO Precision Oncology. e717457 https://doi.org/10.1200/PO-26-00661
- Holthaus, D., Rogmans, C., Gursinski, I., Quevedo-Olmos, A., Ehsani, M., Mangler, M., Flörkemeier, I., Weimer, J. P., Meyer, T. F., Maass, N., et al. (2024). Inhibition of ADAM17 increases the cytotoxic effect of cisplatin in cervical spheroids and organoids. Front Oncol. 14: e1432239. https://doi.org/10.3389/fonc.2024.1432239
- Dong, J., Holthaus, D., Peters, C., Koster, S., Ehsani, M., Quevedo-Olmos, A., Berger, H., Zarobkiewicz, M., Mangler, M., Gurumurthy, R. K., et al. (2023). γδ T cell-mediated cytotoxicity against patient-derived healthy and cancer cervical organoids. Front Immunol. 14: e1281646. https://doi.org/10.3389/fimmu.2023.1281646
- Hedemann, N., Herz, A., Schiepanski, J. H., Dittrich, J., Sebens, S., Dempfle, A., Feuerborn, J., Rogmans, C., Tribian, N., Flörkemeier, I., et al. (2021). ADAM17 Inhibition Increases the Impact of Cisplatin Treatment in Ovarian Cancer Spheroids. Cancers (Basel). 13(9): 2039. https://doi.org/10.3390/cancers13092039
- VanDussen, K. L., Sonnek, N. M. and Stappenbeck, T. S. (2019). L-WRN conditioned medium for gastrointestinal epithelial stem cell culture shows replicable batch-to-batch activity levels across multiple research teams. Stem Cell Res. 37: 101430. https://doi.org/10.1016/j.scr.2019.101430
- Warschkau, D., Delgado-Betancourt, E., Holthaus, D., Müller, A., Kliem, G., Krug, S., Schulzke, J., Aebischer, T., Klotz, C., Seeber, F., et al. (2022). From 3D to 2D: Harmonization of Protocols for Two-dimensional Cultures on Cell Culture Inserts of Intestinal Organoids from Various Species. Bio Protoc. 12(2): e4295. https://doi.org/10.21769/bioprotoc.4295
Article Information
Publication history
Received: Jun 23, 2026
Accepted: Aug 2, 2026
Available online: Aug 13, 2026
Published: Dec 20, 2026
Copyright
© 2026 The Author(s); This is an open access article under the CC BY license (https://creativecommons.org/licenses/by/4.0/).
How to cite
Brauer, A., Grundt, F., Grohmann, F., Verkooyen, C., Weimer, J. P., Maass, N., Van Mackelenbergh, M. T., Sebens, S., Bauerschlag, D. O., Hedemann, N. and Holthaus, D. (2026). Semi-Automated Multiplex Workflow for Functional In Vitro Testing of Chemotherapeutic Treatments in Primary, Patient-Derived Cancer Organoids. Bio-protocol 16(24): e5803. DOI: 10.21769/BioProtoc.5803.

 Download Citation in RIS Format
Category
Cancer Biology
Cell Biology > Cell viability > Cell survival
Do you have any questions about this protocol?
Post your question to gather feedback from the community. We will also invite the authors of this article to respond.
 Post a Question


