


- Protocols

- Articles and Issues
- For Authors
- About
- Become a Reviewer


Quantitative Analysis of Axonal Degeneration and TDP-43 Aggregation in Compartmentalized Human iPSC-Derived Motor Neuron–Myotube Co-cultures

(§Technical contact: gsanand09@gmail.com; talpery@tauex.tau.ac.il) Published: Vol 16, Iss 17, Sep 5, 2026 DOI: 10.21769/BioProtoc.5801 Views: 340
Reviewed by: Marion HoggThirupugal Govindarajan
 PDF
PDF  Ask a question
Original research article
The authors used this protocol in:

Nov 2025
Advertisement


Protocol Collections
Comprehensive collections of detailed, peer-reviewed protocols focusing on specific topics




Abstract
Amyotrophic lateral sclerosis (ALS) is characterized by early and spatially restricted pathology in motor axons, including distal degeneration and accumulation of aggregation-prone proteins such as TDP-43. However, a major limitation in the field has been the lack of approaches that enable robust, quantitative, and compartment-specific analysis of these early axonal events, particularly in human-relevant systems. Here, we describe an integrated experimental and analytical framework that enables quantitative dissection of axonal degeneration and protein aggregation, specifically within distal motor axons. By combining compartmentalized human co-cultures with a dedicated image analysis strategy, this approach enables selective and quantitative analysis of pathological processes specifically within axons, independent of surrounding tissues such as muscle and other cellular compartments. This framework captures both structural degeneration and protein aggregation dynamics at subcellular resolution, enabling spatially resolved quantitative analysis of disease-relevant changes along axons. Importantly, the analytical framework is not limited to TDP-43 but is broadly applicable to diverse aggregation-prone proteins, thereby providing a generalizable platform to study axonal pathology across neurodegenerative diseases. Together, this work provides a scalable approach for investigating axonal pathology as an early and measurable feature of neurodegeneration, with potential applications in mechanistic studies and therapeutic targeting in ALS and related disorders.
Key features
• Compartmentalized human induced pluripotent stem cell (iPSC)-derived motor neuron–myotube co-cultures for modeling distal axonal pathology.
• Microfluidic separation of somatic and distal axonal compartments enabling spatial perturbation and analysis.
• Quantitative imaging of neurofilament heavy chain (NFH)-associated axonal degeneration and pTDP-43 accumulation.
• Semi-automated workflow for a reproducible, scalable, and modular pipeline for image quantification.
Keywords: Human iPSC-derived motor neuron–myotube co-culture Axonal degeneration
TDP-43 aggregation
Microfluidic co-culture
Automated image analysis
Amyotrophic lateral sclerosis
Axonal degeneration
TDP-43 aggregation
Microfluidic co-culture
Automated image analysis
Amyotrophic lateral sclerosis
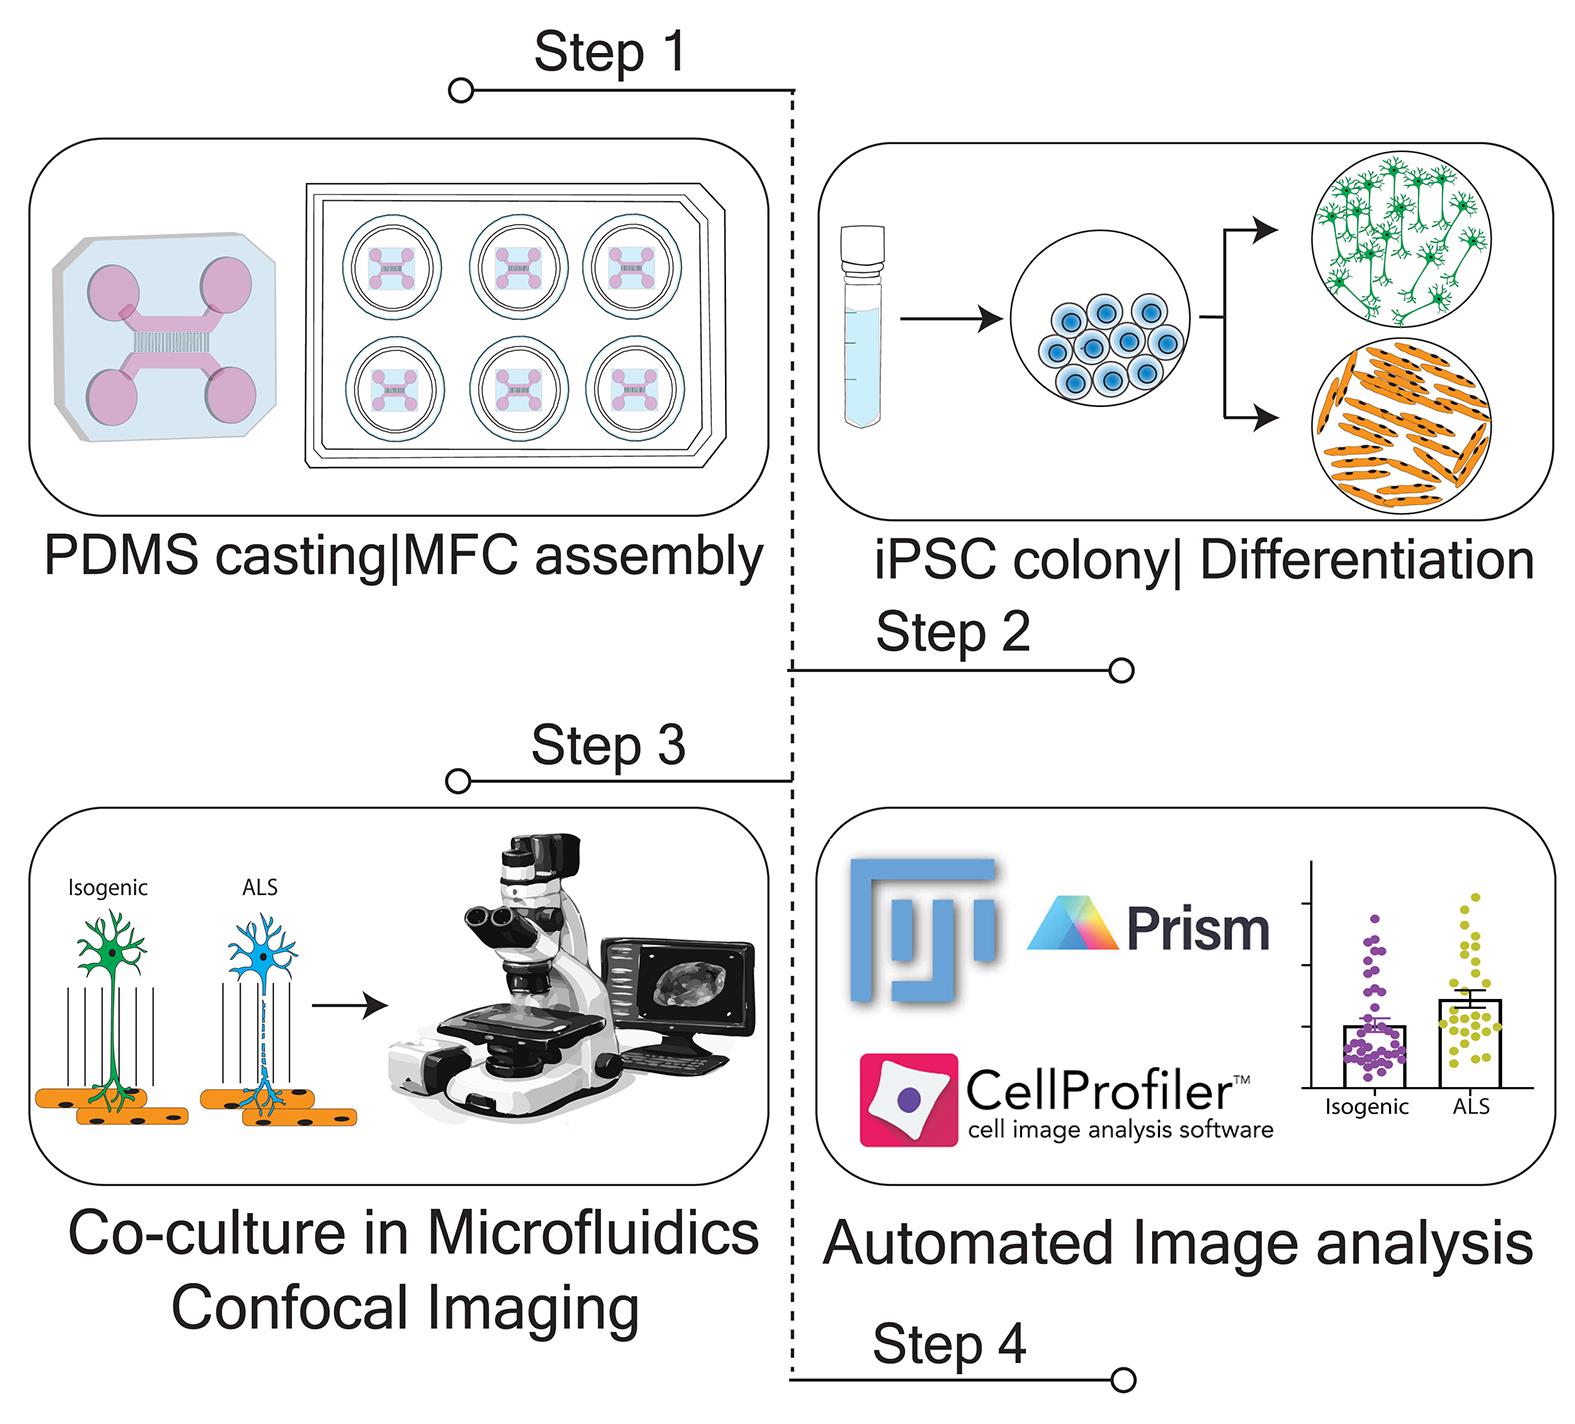
Graphical overview
Background
Distal axonal degeneration is among the earliest pathological features of amyotrophic lateral sclerosis (ALS). Evidence from animal models and induced pluripotent stem cell (iPSC)-derived neurons indicates that motor axons undergo progressive distal retraction and cytoskeletal disruption, consistent with a “dying-back” mechanism of neurodegeneration [1–6]. At the molecular level, cytoplasmic mislocalization and aggregation of TDP-43 within motor axons has emerged as a pathological hallmark of ALS, with phosphorylated TDP-43 (pTDP-43) accumulating in distal axonal compartments [7,8] and intramuscular nerve bundles during early disease stages [9,10]. We have previously shown that axonal TDP-43 condensates impair local protein synthesis and contribute to neurodegeneration, underscoring the relevance of quantifying axonal TDP-43 pathology in disease models [7,11]. Notably, axon-localized protein aggregation extends beyond TDP-43 and ALS and is also observed in other neurodegenerative disorders, including tau aggregation in tauopathies [12,13], α-synuclein accumulation in Parkinson’s disease [14,15], and SOD1 aggregates [1,6] or neurofilament accumulation in familial forms of ALS [6,16–19]. Together, these findings highlight the necessity of not only detecting but rigorously quantifying axonal phenotypes, including protein aggregation and structural degeneration within human model systems, to facilitate both mechanistic studies and therapeutic development.
Human iPSC-derived neuromuscular models, including self-organizing 2D systems, rapid differentiation-based co-cultures, and 3D organoids, have improved scalability and provided valuable insight into motor neuron–muscle connectivity [20–23]. However, many of these models lack physical compartmentalization, limiting quantitative analysis of distal axonal pathology. In non-compartmentalized co-cultures, neuronal somata, proximal neurites, distal axons, and myotubes are intermingled within contractile muscle cultures, making it difficult to assign pathology specifically to distal axons. This heterogeneity also renders morphology-based features, such as fragmentation or punctate protein accumulation, difficult to segment reproducibly against the underlying muscle background [24–26]. Consequently, most existing models are better suited for endpoint functional readouts than for spatially resolved tracking of progressive distal axonal pathology.
To address these limitations, we developed a compartmentalized human iPSC-derived motor neuron–myotube co-culture in microfluidic chambers, integrated with a semi-automated, compartment-resolved image analysis workflow. Similar human co-culture systems in microfluidic devices have been used to model ALS-relevant phenotypes and therapeutic responses, supporting the broader utility of this platform design [27]. In this system, motor neuron somata are confined to a proximal compartment, while chemotactic and volumetric gradients direct axons through microgrooves into a distal chamber containing myotubes [28,29]. Both motor neurons and myotubes were differentiated from the corresponding isogenic or ALS genotypes and cultured in a compartment-specific manner. Cultures are maintained for approximately 4–6 weeks, sufficient for co-culture maturation and emergence of ALS-relevant phenotypes, including neurofilament heavy chain (NFH)-associated axonal degeneration and pTDP-43 accumulation. A practical challenge in image-based analysis of neuromuscular co-cultures is that axons extend across or over myotubes, creating a heterogeneous background that interferes with signal detection and feature segmentation. Our workflow addresses this by employing channel-specific segmentation and spatial masking to restrict quantification to NFH-positive axonal regions. By integrating Fiji/ImageJ preprocessing with CellProfiler-based object identification, the pipeline effectively isolates axonal signal from underlying muscle background, enabling reproducible quantification of axonal phenotypes even in dense co-culture regions. This semi-automated approach reduces manual bias and supports blinded analysis across large imaging datasets.
We previously applied this microfluidic neuromuscular system and image analysis workflow to demonstrate that muscle-derived miR-126 regulates axonal TDP-43 condensates in ALS models [30]. As a proof-of-principle, modulation of miR-126 levels in ALS and isogenic co-cultures showed that the semi-automated pipeline can sensitively quantify resulting distal axonal degeneration and axonal pTDP-43 pathology. Furthermore, the workflow is highly modular. The segmentation approach uses thresholding, object identification, and spatial masking rather than a single predefined marker. This allows the pipeline to be adapted to quantify other aggregation-prone proteins, including SOD1, tau, and α-synuclein, by adjusting segmentation parameters. Overall, this platform provides a practical and versatile framework for investigating compartment-specific axonal pathology across a broad spectrum of neurodegenerative conditions.
Materials and reagents
Biological materials
Human iPSC lines used in this study included the KOLF2.1J parental/isogenic control line and a CRISPR/Cas9-engineered KOLF2.1J-derived TARDBP/TDP-43M337V homozygous mutant line (The Jackson Laboratory, catalog numbers: JIPSC001000 for KOLF2.1J and JIPSC001106 for TARDBP/TDP-43M337V SNV/SNV).
1. For the motor neuron differentiation system, stable iPSC lines (KOLF2.1J and TDP-43M337V) of doxycycline-inducible expression of human NGN2, ISL1, and LHX3 (hNIL) were generated using the PiggyBac Tet-On PB-TO-hNIL plasmid.
2. For myogenic differentiation, stable lines (KOLF2.1J and TDP-43M337V) of doxycycline-inducible expression of human MyoD1, together with Oct3/4 silencing, were generated using the PiggyBac Tet-On PB-TO-MYOD1-shOct4 plasmid.
3. PB-TO-hNIL (Addgene plasmid #172113) and PB-TO-MYOD1-shOct4 (Addgene plasmid #182309) were gifts from the iPSC Neurodegenerative Disease Initiative (iNDI) and Michael Ward.
Reagents
1. Accutase (Merck, catalog number: SCR005); store aliquots (5 mL) at -20 °C
2. Agrin (R&D, catalog number: 6624-AG-050); prepare as a 100 μg/mL solution by reconstituting 50 μg in 500 μL of filtered 1× PBS; store aliquots (10, 20, and 50 μL) at -80 °C
3. AR-grade Ethanol 70% (Biolab-chemicals, catalog number: 000522030500); store at room temperature
4. AR-grade 2-propanol (Biolab-chemicals, catalog number: 001626052100); store at room temperature
5. B27 (50×) (Gibco, catalog number: 17504044); store aliquots at -20 °C
6. B27 plus supplement (50×) (Gibco, catalog number: A3582801); store aliquots at -20 °C
7. BDNF (Alomone Labs, catalog number: B-250); prepare as a 10 μg/mL stock solution by dissolving 10 μg in 1 mL of nuclease-free water containing 2.5 μL of 4% BSA (final concentration: 0.01% w/v) dissolved in 1× PBS; store aliquots at -80 °C
8. Bovine serum albumin (BSA) (Sigma, catalog number: A3311); for immunofluorescence (IF) staining procedures, prepare as 50 mg/mL in filtered 1× PBS and store aliquots (500 μL) at -20 °C; use a final concentration of 1 mg/mL
9. Beta-mercaptoethanol, 55 mM (Gibco, catalog number: 21985023); store at 4 °C; Caution: Light-sensitive and irritant.
10. BrdU (5-Bromo-2′-deoxyuridine) (Sigma, catalog number: B9285); prepare as a 40 mM stock solution by dissolving 50 mg in 4.07 mL of nuclease-free water; store aliquots at -20 °C
11. CHIR99021 (Cayman, catalog number:13122-5); prepare as 2.5 mg/mL in 100% DMSO; store aliquots at -20 °C
12. Compound E (Stem Cell Technologies, catalog number: 73952); prepare as a 1 mM solution by dissolving 1 mg in 2.03 mL of DMSO; light-sensitive; store aliquots at -20 °C
13. Cryostor10 (Biolife, catalog number: 210102); store at 2–8 °C, protected from light; once opened, aliquot aseptically into 10 mL volumes in sterile 15 mL tubes and use before the product expiry date, provided sterility is maintained
14. CultureOne Supplement (Gibco, catalog number: A3320201); store aliquots at -20 °C
15. Dulbecco's phosphate-buffered saline (DPBS), 10×; no calcium, no magnesium; (Gibco, catalog number: 1420067); store at room temperature; Dilute with ultrapure water to prepare a 1× working solution
16. DMEM/F12, HEPES (Gibco, catalog number: 31330038); store at 4 °C
17. Dimethyl Sulfoxide (DMSO) (Sigma-Aldrich, catalog number: D5879); store at room temperature
18. Doxycycline hyclate (Sigma, catalog number: D9891); prepare as a 2 mg/mL solution by dissolving powder in nuclease-free water; light-sensitive; store aliquots at -20 °C
19. EDTA, 0.5 M, pH 8.0 (Gibco, catalog number:15575020); store at room temperature
20. ECM gel (Sigma, catalog number: E6909-5 ml); store aliquots at -20 °C; for coating, thaw one aliquot on ice or at 4 °C; dilute the 100 μL ECM by adding 900 μL of DMEM, achieving to a final volume of 1 mL; transfer this solution to a 15 mL conical tube and add an additional 9 mL of DMEM to obtain a final volume of 10 mL (1:100 dilution); ECM-coated culture surface is used for myogenic differentiation
21. GDNF (Alomone Labs, catalog number: G-240); prepare as a 10 μg/mL stock solution by dissolving 10 μg in 1 mL of nuclease-free water containing 2.5 μL of 4% BSA (final concentration: 0.01% w/v) dissolved in 1× PBS; store aliquots at -80 °C
22. Goat serum (Jackson ImmunoResearch, catalog number: 005-000-121); rehydration using 10 mL of double-distilled water yields 100% serum (60 mg/mL); for IF, use 5% (v/v) solution (1:20 dilution from rehydrated volume); store aliquots at -20 °C
23. GlutaMAX (Gibo, catalog number: 35050038); store at 4 °C
24. IGF-1 (Peprotech, catalog number: 100-11); prepare as 100 μg/mL by reconstituting 100 μg in 1 mL of nuclease-free water (+2.5 μL of 4% BSA); store aliquots at -80 °C
25. Insulin, human recombinant (Sigma, catalog number: 11376497001); prepare as 50 mg/mL by reconstituting in nuclease-free water; store aliquots at -20 °C
26. Laminin (Gibco, catalog number: 23017015); store aliquots at -80 °C; prepare a 15 μg/mL solution from 1 mg/mL stock solution for coating solution
27. L-ascorbic acid (Sigma, catalog number: A4403); prepare as 500 μg/mL in nuclease-free water; store aliquots at -20 °C
28. Matrigel (Corning, catalog number: 356234); store aliquots (100 μL) at -20 °C; for coating, thaw one aliquot on ice or at 4 °C; dilute the 100 μL Matrigel in cold DMEM (900 μL) to a final volume of 1 mL; transfer this solution to a 15 mL conical tube and add an additional 9 mL of DMEM to obtain a final volume of 10 mL (1:100 dilution); Matrigel-coated culture surfaces are used for routine iPSC colony culture and maintenance
29. Complete mTeSR1TM 1 medium (Stem cell technologies, catalog number: 85850); contains basal medium and 5× supplement; follow manufacturer’s instruction for preparing complete medium; store aliquots (40 mL) at -20 °C; before use, thaw overnight at 4 °C
30. N2 supplement (Gibco, catalog number: 17502048); store aliquots at -20 °C
31. NEAA (Biological Industries, catalog number: 01-340-1B); store aliquots at 4 °C
32. Neurobasal A (Gibco, catalog number:10888022); store at 4 °C
33. Neurobasal (Gibco, catalog number: 21103049)
34. NT-3, human recombinant (Alomone, catalog number: N-260); prepare as 5 μg/mL stock solution by dissolving 5 μg in 1 mL of nuclease-free water containing 2.5 μL of 4% BSA (0.1 mg/mL) dissolved in filtered 1× PBS; store aliquots at -20 °C
35. Paraformaldehyde aqueous (PFA) solution, EM grade (Electron Microscopy Sciences, catalog number: BN15714); inside fume hood, open a 32% ampule (10 mL) of PFA, divide into 0.5 mL aliquots, and store at -20 °C; to prepare the required volume of 4% PFA, thaw an aliquot at room temperature inside the fume hood and dilute 32% with 1× PBS
36. Penicillin/streptomycin (Pen-Strep) (10,000 U/mL) (Gibco, catalog number: 15140-122); store aliquots (5 mL) at -20 °C; thaw aliquots at 4 °C overnight, store at 4 °C, and use for media preparation within 1–2 weeks; 1% (v/v) is generally recommended
37. Poly-DL-ornithine hydrobromide (Sigma, catalog number: P8638); prepare as 1.5 mg/mL stock solution by dissolving 25 mg of powder in 16.67 mL of 1× PBS; store aliquots at -20 °C
38. Puromycin dihydrochloride (Sigma, catalog number: P8833); prepare as 10 mg/mL in nuclease-free water; store aliquots at -80 °C for up to 1 year
39. ProLong Gold Antifade Mountant ± DAPI [Molecular Probes, catalog numbers: P36934 (-DAPI), P36935 (+DAPI)]
40. Sodium pyruvate (Gibco, catalog number:11360070); store at 4 °C
41. Sonic Hedgehog (Peprotech, catalog number:100-45); prepare as 50 μg/mL in nuclease-free water; store aliquots at -80 °C
42. TritonTM X-100 (Sigma-Aldrich, catalog number: T8787-250)
43. Sylgard 184 Silicone Elastomer kit (Dow, catalog number: 4019862)
44. Y-27632 dihydrochloride (ROCK1/2 inhibitor) (Cayman, catalog number: 10005583); prepare as a 10 mM stock solution by dissolving 5 mg in 1.561 mL of nuclease-free water; store aliquots at -80 °C; ROCK1/2 inhibitor is added only to the plating medium on the day of cell seeding; it is omitted from all subsequent medium changes unless otherwise stated
45. Mouse anti-Titin (DSHB, catalog number: 9d10); store aliquots at -20 °C
46. Chicken anti-neurofilament heavy chain NFH (Abcam, catalog number: ab72996); store aliquots at -20 °C
47. Rabbit anti-pTDP43 (Proteintech, catalog number: 22309-1-AP); store aliquots at -20 °C
48. DAPI (4′,6-Diamidino-2-phenylindole dihydrochloride) (Sigma, catalog number: D8417); prepare as 1 mg/mL stock solution with nuclease-free water; store aliquots at -20 °C
49. Goat anti-rabbit 405 (Abcam, catalog number: ab175654); store aliquots at -20 °C
50. Goat anti-chicken 488 (Abcam, catalog number: ab150173); store aliquots at -20 °C
51. Goat anti-rabbit 647 (Abcam, catalog number: ab150083); store aliquots at -20 °C
52. Goat anti-rabbit 594 (Jackson ImmunoResearch, catalog number: 111-585-144); store aliquots at -20 °C
Solutions
1. Blocking solution (see Recipes)
2. DMEM/F12 + P/S (see Recipes)
3. mTeSR1, iPSC culture medium (see Recipes)
4. Myotube induction medium (IM-Myo) (see Recipes)
5. Myotube maturation medium (MM-Myo) (see Recipes)
6. Neuronal induction medium (IM-MN) (see Recipes)
7. Neuronal maturation medium (MM-MN) (see Recipes)
8. Polydimethylsiloxane (PDMS) mixture (see Recipes)
9. Triton permeabilization solution (see Recipes)
Recipes
1. Blocking solution
| Reagent | Final concentration | Quantity or volume |
|---|---|---|
| BSA (50 mg/mL) | 1 mg/mL | 20 μL |
| Normal goat serum, 6% (w/v), stock | 5% (v/v) | 50 μL |
| 1× PBS | 1× | 930 μL |
| Total | 1 mL |
For IF staining procedures.
2. DMEM/F12+ P/S 1%
| Reagent | Final concentration | Quantity or volume |
|---|---|---|
| DMEM/F12 | 1× | 49.5 mL |
| Pen-Strep | 1% (v/v) | 500 μL |
| Total | 50 mL |
Prepare this exclusively to flush PDMS debris in microfluidic chamber (MFC) assembly and store at 4 °C. Do not use this for cell culture purposes.
3. mTeSR1TM 1 + P/S 1%
| Reagent | Final concentration | Quantity or volume |
|---|---|---|
| mTeSRTM 1 | 1× | 40 mL |
| Pen-Strep | 1% (v/v) | 500 μL |
| Total | ~40 mL |
4. Induction medium for myotube (IM-Myo), days 1–6, distal compartment of co-culture
| Reagent | Final concentration | Quantity or volume | |
| Basal | DMEM/F12 with HEPES | 1× | 49 mL |
| Sodium pyruvate, 100× | 1× | 0.5 mL | |
| NEAA, 100× | 1× | 0.5 mL | |
1. Prepare basal medium, filter, and store at 4 °C for a maximum of 1 week. | |||
| Factor cocktail | aβ-mercaptoethanol, 55 mM | 110 μM | 100 μL |
| Insulin, 10 mg/mL | 10 μg/mL | 50 μL | |
| Doxycycline, 1,000× | 1× | 50 μL | |
| bROCK inhibitor (RI), Y-27632, 1,000× | 1× | 50 μL | |
| Total | 50 mL | ||
aAdd freshly before use.
bAdd Rock inhibitor for plating on day 0 and day 3.
5. Induction medium for myotube (IM-Myo), days 7–9, distal compartment of co-culture
Add 10 μL of CHIR99021 (15 mM stock) to 50 mL of IM-Myo medium (without ROCK inhibitor) to achieve a final concentration of 3 μM.
6. Maturation medium for myotubes (MM-Myo), distal compartment of co-culture
| Reagent | Final concentration | Quantity or volume | |
| Basal | Neurobasal A | 1× | 48 mL |
| B27 plus supplement, 100× | 1× | 1 mL | |
| NEAA, 100× | 1× | 0.5 mL | |
| Gluta-MAX, 100× | 1× | 0.5 mL | |
1. Prepare basal medium, filter, and store at 4 °C for a maximum of 1 week. | |||
| Factor cocktail | aCultureOne supplement, 100× | 1× | 500 μL |
| NT-3 (5 μg/mL) | 20 ng/mL | 200 μL | |
| Doxycycline, 1,000× | 1× | 50 μL | |
| aSonic Hedgehog, Shh (50 μg/mL) | 50 ng/mL | 50 μL | |
| Agrin (100 μg/mL) | 100 ng/mL | 50 μL | |
| L-ascorbic acid, 200 mM | 200 μM | 50 μL | |
| IGF-1 (100 μg/mL) | 10 ng/mL | 5 μL | |
| Laminin (50 μg/mL) | 50 ng/mL | 50 μL | |
| Total | 50 mL | ||
aRemove CultureOne and Shh from basal medium after 2 weeks.
7. Induction medium for motor neuron (IM-MN); proximal compartment of co-culture
| Reagent | Final concentration | Quantity or volume | |
| Basal | DMEM/F12 with HEPES | 1× | 48.5 mL |
| N2 supplement, 100× | 1× | 0.5 mL | |
| NEAA, 100× | 1× | 0.5 mL | |
| Gluta-MAX, 100× | 1× | 0.5 mL | |
1. Prepare basal medium, filter, and store at 4 °C for a maximum of 1 week. | |||
| Factor cocktail | aROCK inhibitor, Y-27632, 1,000× | 1× | 50 μL |
| Doxycycline, 1,000× | 1× | 50 μL | |
| Compound E, 1mM | 0.2 μM | 10 μL | |
| bBrdU, 40 mM | 40 μM | 50 μL | |
| Total | 50 mL | ||
aAdd Rock inhibitor for plating on DIV 0–3.
bAdditional components only for plating on DIV 3.
8. Maturation medium for motor neuron (MM-MN); proximal compartment of co-culture
| Reagent | Final concentration | Quantity or volume | |
| Basal | Neurobasal | 1× | 47.5 mL |
| B27 supplement, 50× | 1× | 1 mL | |
| N2 supplement, 100× | 1× | 0.5 mL | |
| NEAA, 100× | 1× | 0.5 mL | |
| Gluta-MAX, 100× | 1× | 0.5 mL | |
1. Prepare basal medium, filter, and store at 4 °C for a maximum of 1 week. | |||
| Factor cocktail | Laminin (1mg/mL) | 1 μg/mL | 50 μL |
| CultureOne supplement, 100× | 1× | 500 μL | |
| BDNF (10 μg/mL) | 10 ng/mL | 50 μL | |
| GDNF (10 μg/mL) | 10 ng/mL | 50 μL | |
| NT-3 (5 μg/mL) | 10 ng/mL | 100 μL | |
| Total | 50 mL | ||
9. PDMS mixture (9:1 mix)
| Reagent | Final concentration | Quantity or volume |
|---|---|---|
| PDMS base (part A) | n/a | 45 g |
| PDMS curing reagent (part B) | n/a | 5 g |
| Total | 50 g |
Note: SylgardTM 184 Silicone Elastomer kit contains two highly viscous PDMS components. When dispensing the PDMS into a 50 mL polypropylene tube for weighing, the material may flow slowly; proceed patiently. Creating a small hole in the bottle cap can help improve control and facilitate dispensing.
10. Triton permeabilization solution (0.1%)
| Reagent | Final concentration | Quantity or volume |
|---|---|---|
| BSA, (50 mg/mL) | 1 mg/mL | 20 μL |
| Normal goat serum, 6% (w/v), stock | 5% (v/v) | 50 μL |
| 1× PBS | 1× | 930 μL |
| Triton (20%) | 0.1% | 5 μL |
| Total | 1 mL |
Laboratory supplies
1. P2, P20, P200, and P1000 micropipettes (Gilson)
2. Pipette-holder (O-pette, ORNAT)
3. Stripette 5, 10, and 25 mL serological pipettes, polystyrene, individually wrapped (Corning, catalog numbers: 4487, 4101, and 4489, respectively)
4. Sterile polystyrene 6-well, 24-well plates (Corning, catalog numbers: 3516, 3526)
5. Sterile 1.5-mL polypropylene microcentrifuge tubes (Axygen, catalog number: MCT-175-C)
6. Sterile glass coverslips, thickness 1.0 (0.13–0.16), 22 × 22 mm (Marienfeld, catalog number: 0101050)
7. Sterile, FluoroDish, glass bottom, clear wall, individually wrapped (WPI, catalog number: FD35-100)
8. Sterile surgical forceps
9. Pasteur pipette 15 cm glass (Beith Dekel, catalog number: 9411015)
10. 100 μL to 1,250 mL filter pipette tips (Axygen, catalog number: TF-1000-R-S)
11. 20–200 μL filter pipette tips (SRS-17370-X)
12. 2–20 μL filter pipette tips (SRS-30370T)
13. 1–10 μL filter pipette tips (SRS-30340)
14. Syringe driven filters, disposable, 0.22 μm, cellulose acetate (Cytiva, catalog number:10462200)
15. Vacuum bottle filter, 250 mL, 0.22 μm, PES (Corning, catalog number: 431097)
16. Vacuum bottle filter, 500 mL, 0.22 μm, PES (SORFA, catalog number: SPE-22-500)
17. Centrifuge for 15-mL and 50-mL conical tubes (Corning, catalog numbers: 430052 and 430290)
18. Cryotube vials (Thermo Scientific, catalog number: NU-368632)
19. Mr. FrostyTM freezing container (Thermo Scientific, catalog number: 5100-0001)
20. ibidi Immersion Oil 2 (ibidi, catalog number: 50102)
21. Lint-free tissue for optical lenses
Equipment
Cell culture
1. -20 °C and -80 °C freezers
2. 5% CO2, 95% humidity cell culture incubator (Thermo Scientific, model: Heracell 150i)
3. Hemocytometer Neubauer Improved, depth 0.1 mm 0.0025 mm2, glass (Bar Naor, catalog number: BN442-2)
4. Class II, Type A2 biological safety cabinet (Thermo Scientific, model: 1300 Series)
5. Vacuum aspirator and aspirating pipettes
6. Water bath set at 37 °C (Lab Companion, model: BW-10H)
7. High-speed centrifuge (iCen-24)
MFC preparation
8. Vertical rotating mixer
9. HB-500 Minidizer Oven (Biolab, catalog number: 85996695033002)
10. Vacuum desiccator (Nalgene, catalog number: D2797-1EA)
11. Biopsy punch 6-mm (WPI, catalog number: 504533)
12. Intelli-mixer rotator (ELMI, catalog number: RM-2L)
13. Plasmatic Systems, Inc. Plasma Preen II #973
Imaging systems
14. EVOS FL imaging system (Invitrogen, catalog number: AMF300)
15. FLoid Cell Imaging Station (Invitrogen, catalog number: 4471136)
16. Olympus Benchtop CKX31 inverted microscope equipped with phase-contrast 10× objective (Olympus)
17. Andor BC-43 benchtop spinning disk confocal system controlled by Andor Fusion software version 2.3a; equipped with on-stage humidified incubation chamber maintaining 37 °C, 5% CO2
Software and datasets
1. Fiji (ImageJ v1.54p), released February 2025; used for image visualization and preprocessing [31]
2. CellProfiler (v4.2.8); used for segmentation and quantitative image analysis. Both previous versions (v4.2.6 or v4.2.8) were tested and found to be functionally equivalent and fully compatible with the analysis pipeline. The most recent release (v4.2.8) was issued in September 2024
3. CellProfiler [32] is a free, open-source software for cell image analysis and supports the development of custom image-processing modules.
4. All analysis code has been deposited on GitHub: https://github.com/PerlsonLab/Bioprotocol
Procedure
A. Microfluidic mold fabrication and PDMS casting
For detailed step-wise instructions on how to perform 1) mold fabrication and 2) PDMS casting in primary molds, please follow the protocols as previously described [33,34]. These steps can be performed in a nanofabrication facility in your institute as described. MFCs that are suitable for this co-culture protocol are also commercially available in the Xona microfluidics SND450 model. Here, we describe a method for generating in vitro human iPSC-derived neuromuscular co-culture in MFCs that can be maintained for 1–1.5 months, enabling quantitative assessment of ALS-relevant axonal phenotypes.
Notes:
1. This protocol applies to MFCs placed on glass coverslips or 35 mm glass-bottom dishes.
2. Unless otherwise specified, the terms “chambers,” “microfluidic chambers,” “PDMS devices,” and “MFCs” are used interchangeably throughout this protocol to refer to the microfluidic chamber of 300 μm groove length described in [34].
3. The term “assembly” refers to the PDMS microfluidic chamber bonded to a glass coverslip or glass-bottom dish.
4. For coating, cell culture, and routine medium changes in MFCs, follow proximal and distal compartment terminology as illustrated in Figure 1.
5. First, begin with iPSC thawing and culture. After 5–6 days of culturing, once well-defined colonies have formed, initiate preparation of MFCs and perform the required coating and co-culture steps.
6. For consistency, day 1 is defined as the day on which induction medium (IM) is first added to cultures of motor neurons or myotubes; DIV (days in vitro) refers to the number of days elapsed since this induction step.
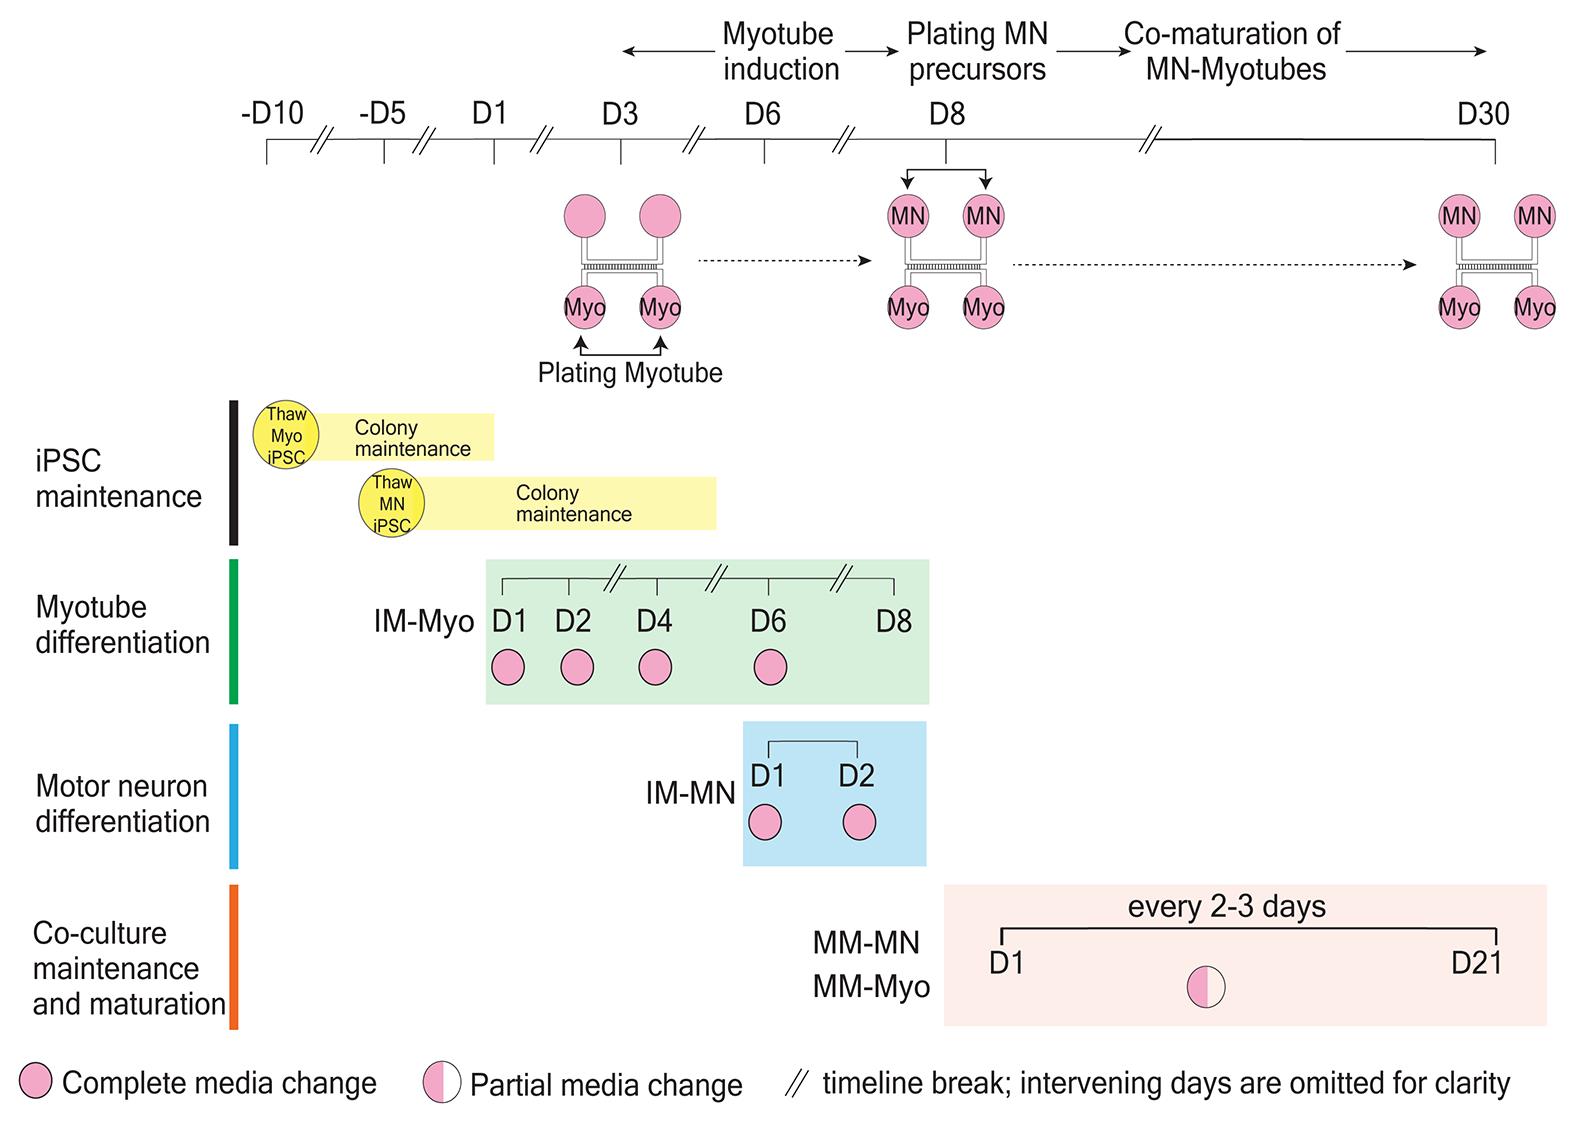
Figure 1. Protocol timeline and schematic for generating human motor neuron–myotube co-cultures in microfluidic chambers. The schematic illustrates the workflow for culturing human induced pluripotent stem cell (iPSC)-derived motor neurons and myotubes to establish a compartmentalized co-culture in microfluidic chambers (MFCs). The timeline includes thawing and expansion of hNIL (human NGN2, ISL1, and LHX3) and hMyoD-shOct3/4 iPSC colonies in 6-well plates, followed by two days of differentiation prior to sequential seeding into distinct compartments of the MFCs (proximal compartment: motor neurons; distal compartment: myotubes) at defined time points. This arrangement allows the two cell types to co-mature in vitro, which is evident by the expression of cell-specific markers at day 30. IM, induction medium; MM, maturation medium; MN, motor neuron; Myo, myotube; CC, co-culture.
B. PDMS casting in epoxy molds
Notes:
1. Begin the process at least 2–3 days before cell culture. PDMS chambers should not be stored for extended periods; keep them free from dust and contaminants.
2. Store for up to 1–2 weeks at room temperature in a sealed plastic dish (e.g., parafilm-sealed).
3. The following procedures apply for silicon molds that produce nine chambers with dimensions as described in [34]; these are routinely used in our lab for dissociated monocultures and co-cultures.
1. Mold cleaning before casting
a. Use pressurized air or N2 on the surface to remove dirt or any remains of PDMS from previous usage of the epoxy mold. Rinse the mold area twice with isopropanol inside a fume hood.
b. For the third rinse, fill the mold area with isopropanol and incubate it on an orbital shaker for 10 min. Discard the isopropanol, then dry the mold using compressed air or N2. Alternatively, place the mold in a 70 °C oven until completely dry.
Note: Follow safety procedures when working with and discarding isopropanol.
2. PDMS preparation and casting
a. Mix the Sylgard PDMS base and Sylgard curing agent at a 9:1 ratio in a 50 mL polypropylene tube, using the pre-calculated mold volume to determine the total PDMS volume required.
b. Place the tube on a rotator at low speed (~7–10 rpm) for 20 min or until the mixture becomes homogeneous.
c. Pour the PDMS mixture into the mold area, starting at one corner and allowing the mixture to flow across the surface to completely fill the mold.
d. Place all filled molds in a vacuum desiccator at full suction for 2–4 h or until the PDMS becomes clear and free of air bubbles. Visually inspect the mixture during degassing to assess bubble removal.
Critical: Ensure that the PDMS surface remains flat and leveled, as uneven surfaces will affect the final thickness of the mold.
e. Once degassing is complete, gradually release the vacuum and carefully remove the molds, as the PDMS will remain in a liquid state.
f. Transfer the molds to a 70 °C oven and cure for a minimum of 5 h or overnight to ensure complete polymerization.
Critical: The base-to-curing agent ratio affects the flexibility of the PDMS chamber. Start with the recommended 9:1 ratio and then optimize based on your application or experimental requirements.
3. Preparation of casted PDMS into an MFC
a. Following overnight baking, PDMS will be completely cured and hardened. Turn off the oven and carefully remove the plastic dish containing the epoxy mold.
Caution: The plastic dish will be hot. Allow it to cool for a few minutes before taking it out of the oven.
b. Using a flat, tapered-end spatula, carefully lift the cured PDMS from the mold.
c. Place the PDMS cast on the cutting board, with microfluidic elements facing up.
d. Use a 6-mm circular punch to hollow wells at both ends of both channels, in a total of four wells per chamber.
e. Cut the casted PDMS into single microfluidic chamber units.
Critical:
1. Handle the PDMS cast with care during removal; avoid applying excessive force, as the molds are fragile.
2. Perform punching and cleaning gently, not to damage the fine structure of microgrooves.
4. Cleaning and sterilizing the microfluidic chamber
a. Use cellophane tap or transparent adhesive tape to remove dust and debris from both sides of the microfluidic chambers. Place the clean chambers in a clean 10 or 15 cm dish.
Critical: Avoid applying excessive pressure directly over the microgroove structures.
b. Pour 70% ethanol into the dish to fully submerge the chambers and place the dish on an orbital shaker for 10 min.
c. Discard the ethanol and allow the chambers to air-dry inside a biosafety cabinet (BSC).
d. Expose the chambers to UV light for 15 min.
5. Assembly of MFCs for culturing cells
Notes:
1. Perform all the following steps inside a biosafety cabinet, unless otherwise stated.
2. Depending on the experimental setup, MFCs can be placed on glass coverslips, glass-bottom dishes, or directly onto plastic cell culture ware.
3. The steps described below apply to MFCs placed on sterile glass coverslips.
4. To save time, preheat the oven to 70 °C before starting this step.
a. Inside a biosafety cabinet, invert the lid of a sterile 6-well plate to use as a working surface.
b. Gently place the MFC onto glass coverslips with the microfluidic grooves facing downward.
c. Apply gentle pressure along the edges and center of each chamber to promote contact between the MFC and the coverslip surface.
d. Inspect the attachment carefully; if large air bubbles or partial detachment are observed, carefully peel off the MFC and reattach it to the coverslip.
e. Place each assembly (MFC-coverslip unit) into an individual well of a sterile 6-well plate and close with its lid.
f. Place the 6-well plate inside the preheated oven at 70 °C for 10–15 min. Bring it back to the BSC and reapply pressure to strengthen the attachment to the coverslip.
g. Expose the chambers again to UV light for 15 min.
Notes:
1. Alternatively, plasma treatment of glass coverslips and the chambers can be performed inside a plasma chamber to promote binding to each other.
2. Brief recipe: Start with ~20–30 s of oxygen plasma on both the PDMS and the coverslip, at 0.5–0.8 Torr, then bring them into contact immediately (within 1–2 min). Bake the assembly at 70 °C for 10–15 min to strengthen the seal.
3. We did not observe any differences in co-culture outcomes when comparing both attachment methods.
4. At this stage, proceed directly with cell culture or store the coverslips with attached MFCs in a parafilm-sealed dish at room temperature for up to 1 week.
5. On the day of cell culture, briefly bake the assemblies again (5 min), perform UV sterilization, place them inside a 6-well plate, and proceed with the subsequent culturing steps.
6. Pre-experimental DMEM incubation and leak testing of microfluidic assemblies
a. To remove any PDMS debris, add sterile DMEM+P/S 1% to both the proximal and distal wells.
b. Starting with the proximal compartment, use a 200 μL pipette to dispense 100–150 μL of medium toward the channel entrance of one well; gently pipette back and forth until the medium exits into the opposite well.
c. Repeat the same procedure for the distal compartment.
d. Maintain 110–120 μL of medium in the proximal compartment and 90–100 μL in the distal compartment, maintaining a volume difference of approximately 10 μL.
e. Place the plate in a vacuum desiccator for 15–20 min to remove any air bubbles created during the procedure.
f. After vacuum treatment, inspect the microgroove and channel regions under a light microscope (using a 10× or 20× objective) to confirm the absence of air bubbles and verify that the microgrooves are open to liquid flow.
g. Incubate the medium for 2–3 h to allow efficient removal of residual debris.
h. Proceed with the subsequent coating steps.
i. This step of pre-experimental incubation serves as an indirect assessment of microfluidic assembly integrity and fluidic isolation prior to coating and cell seeding if the volume difference is maintained during the incubation step.
Critical:
1. To assess microfluidic isolation, add DMEM+ P/S 1% to the proximal compartment and add either Opti-MEM or DMEM + P/S 1% (without phenol red) to the distal compartment.
2. Confirm intact fluidic isolation by verifying the absence of color mixing between compartments. Alternatively, perform a dye-based leakage test and sterilize the assembly before proceeding with subsequent coating steps.
3. The ~20 μL volume difference between compartments is maintained to establish a hydrostatic pressure gradient. The higher fluid level in the proximal compartment generates a slow, passive convective flow from the proximal to the distal compartment, thereby opposing diffusion of soluble factors from the treated distal compartment across the microgroove barrier. This helps maintain fluidic isolation between compartments and ensures that distally applied treatments remain spatially restricted to the distal side.
C. Thawing, culture, and maintenance of iPSCs
Notes:
1. The procedures for iPSC maintenance, passaging, and cryopreservation were adapted from [35] and carried out in our laboratory with minor modifications.
2. Unless stated otherwise, the following steps involved in culturing and maintenance are the same for both hNIL and MyoD- shOCT3/4 iPSCs.
1. Thawing iPSCs
Notes:
1. Before thawing, prewarm 4 mL of DMEM-F12 per cryovial in a 15 mL tube using a 37 °C water bath. Resuspending cells in prewarmed medium improves post-thaw cell survival.
2. High cell density improves post-thaw survival. It is recommended to plate one cryovial (typically 0.5–1 × 10⁶ cells) into one well of a 6-well plate.
a. Prepare 1–2 wells of a 6-well plate precoated with Matrigel (100 μg/mL). Incubate the coated plate in a 37 °C incubator for a minimum of 30 min to 1 h (coating may be extended to overnight if required).
b. Transfer the iPSC cryovial from liquid nitrogen to ice and thaw in a 37 °C water bath. When a small ice crystal remains, spray the outside of the vial with 70% ethanol and transfer it to a biosafety cabinet.
c. Add 1 mL of prewarmed DMEM-F12 to the cryovial and gently mix with the cell suspension. Transfer the contents to a 15 mL tube containing 3 mL of DMEM-F12.
d. Centrifuge at 300× g for 5 min at room temperature to pellet the cells.
e. Transfer the tube to the BSC, carefully discard the supernatant, and gently resuspend the pellet a few times in 1 mL of mTeSR1 freshly supplemented with 10 μM ROCK inhibitor (RI).
f. Seed the cells into one or two wells, depending on pellet size and post-thaw viability, which may vary between iPSC lines. Add an additional 1 mL of mTeSR1 (with ROCK inhibitor) to the well and distribute the cells evenly by gently moving the plate front-to-back and side-to-side.
g. Return the plate to the 37 °C incubator.
h. After 24 h, perform a full-medium change with 2 mL of mTeSR1 (without RI); replace the medium daily with fresh mTeSR1 to maintain cell health and promote colony formation. Representative iPSC colony morphology is shown in Figure 2.
Critical:
1. Do not triturate the cell suspension vigorously or repeatedly, as this increases single-cell formation and negatively impacts cell viability.
2. Because DMSO and other cryoprotectants are toxic to cells at room temperature, complete the following steps as quickly as possible.
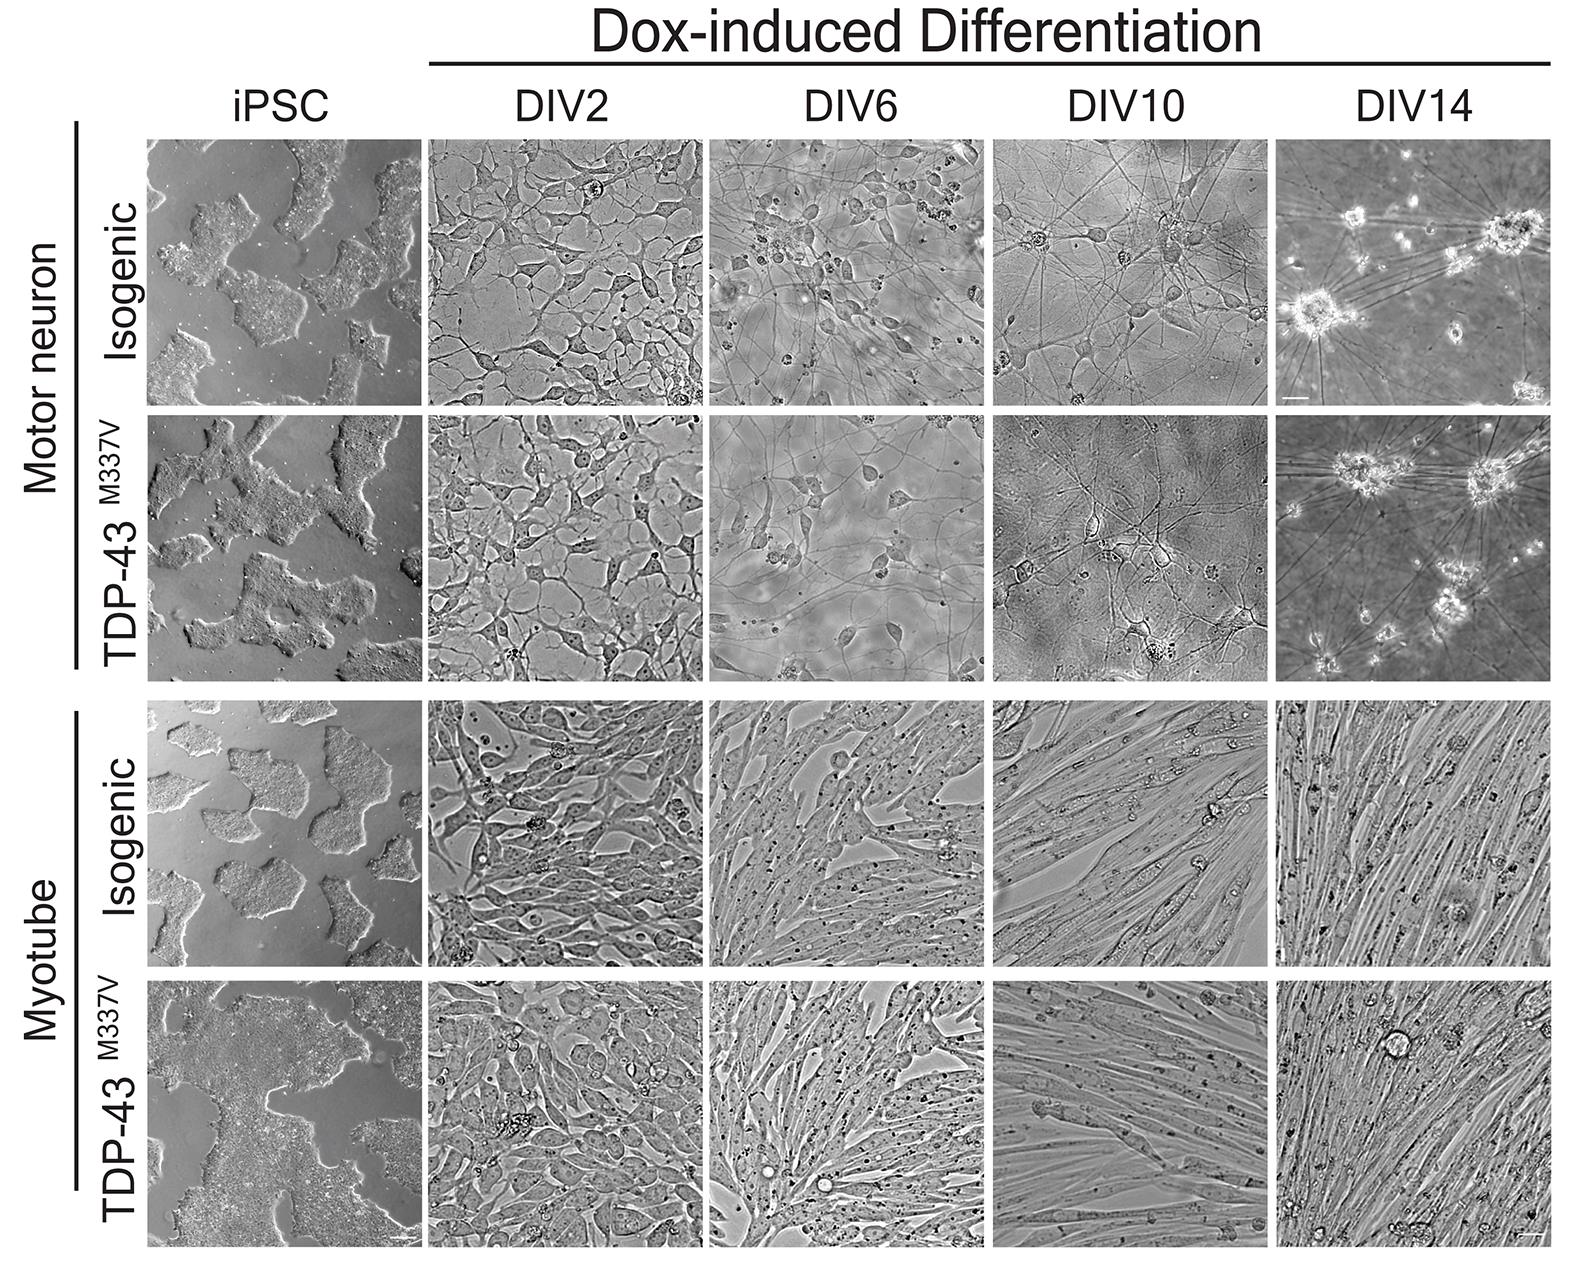
Figure 2. Differentiation of motor neurons and myotubes from human induced pluripotent stem cells (iPSCs). Human iPSC-derived motor neurons (MN) and myotubes (Myo) were generated using doxycycline-inducible plasmids PB-TO-hNIL and PB-TO-MYOD1-shOct3/4, respectively. Representative phase-contrast images show morphological changes during differentiation from iPSCs to motor neurons and myotubes in the isogenic control KOLF2.1J and TDP-43M337V lines. Images illustrate the progression of differentiation and the comparable morphology of isogenic and amyotrophic lateral sclerosis (ALS) cultures across key stages. For optimal visualization, iPSC colonies of MN, myotubes, and DIV14- differentiated MN images were acquired at 10× magnification, whereas all other images were acquired at 20× magnification. Scale bars, 50 μm.
2. Routine passaging of iPSC colonies (timing: 1 week to 10 days): Maintain iPSCs by passaging colonies at ~70%–80% confluency to preserve robust growth and pluripotency. For routine maintenance, we dissociate iPSCs using an EDTA-based method. Prior to initiating differentiation, Accutase is used to generate a single-cell suspension suitable for differentiation.
3. EDTA-based dissociation (timing: 10–15 min)
a. Remove mTeSR1 media and wash with 1× PBS.
b. Add 400 μL of EDTA for 4–5 min inside the incubator.
Note: Based on the iPSC colony, this timing may vary.
c. Observe under a 10× or 20× objective to check if colonies look more refractile/opaque and edges begin to loosen without extensive single-cell dissociation.
d. Gently tap the plate 3–5 times to dislodge colonies into suspension.
e. Add 1 mL of DMEM/F12 to the well, gently pipette 2–3 times (avoid over-trituration), and transfer to a 15 mL conical containing additional DMEM/F12.
f. Centrifuge at 200–300× g for 5 min at room temperature.
g. Aspirate the supernatant carefully. Resuspend the pellet in mTeSR1 ± ROCK inhibitor (RI optional after EDTA; use RI if your line is sensitive or if survival is poor). Mix gently 2–3 times to retain small clumps.
h. Plate onto fresh Matrigel-coated wells. Distribute by gently moving the plate front-to-back and side-to-side.
i. Return the plate to a 37 °C, humidified, 5% CO2 incubator.
Critical:
1. Typical split ratios in 6-well plates fall in the 1:6 to 1:20 range (optimize by line).
2. Persistently high spontaneous differentiation suggests issues with line quality and/or culture conditions; adjust density, feeding schedule, and handling accordingly to reach intact, distinct colony morphology.
4. Accutase treatment for applications requiring single cells (timing: 10–15 min)
Note: Use enzymatic dissociation when you require a single-cell suspension (e.g., cell counting, sorting, clonal work). Because single-cell dissociation increases apoptosis susceptibility, supplement the maintenance medium with ROCK inhibitor after Accutase treatment.
a. Remove mTeSR1 media and wash with 1× PBS.
b. Incubate colonies with 300–400 μL of Accutase at 37 °C for ~3–5 min (optimize per line).
c. Dilute with DMEM/F12 with HEPES, pellet cells (200–300× g, 5 min), and remove supernatant thoroughly.
d. Proceed with differentiation or perform cryopreservation as required.
Critical: To reduce residual undifferentiated cells, colonies may be treated with puromycin (10 μg/mL) for 24 h prior to Accutase dissociation to enrich for cells carrying the plasmid cassette. This step is applicable only to iPSC lines that harbor a puromycin-resistance selection cassette.
5. Cryopreservation of iPSC colonies (EDTA-based harvesting) (timing: 20 min hands-on plus controlled-rate freezing overnight): for step-wise instructions, please refer to [35].
Notes:
1. Long-term passaging can increase genetic drift. Freeze low-passage stocks and maintain multiple vials per line at defined passage numbers to support reproducibility across experiments.
2. Prepare cells as for an EDTA-based split (see above). During EDTA incubation, label cryovials and prepare cryopreservation medium by supplementing culture medium (mTeSR1) with 10% DMSO, or use a commercially available cryopreservation medium (e.g., CryoStor® 10).
D. Myotube differentiation from human iPSCs
Notes:
1. For one batch of co-culture experiment, we usually take one well of a 6-well plate at ~80% confluency for differentiation. For details on upscaling based on surface area, refer to [35].
2. We describe the protocol specifically for myogenic differentiation and myotube formation.
3. Doxycycline induces expression of the hMyoD-shOct3/4 construct and initiates differentiation. Morphological changes should be evident within 24–48 h.
1. (Day 0) Plating for myotube induction
a. Coat a 6-well plate well with 1 mL of Matrigel (1:100 dilution in DMEM/F12).
b. Incubate at 37 °C for at least 30 min to 1 h (incubation may be extended overnight, if required).
c. Wash myogenic iPSCs cultured in a 6-well plate 1–2 times with 1× PBS to remove dead cells and debris.
d. Add 400 μL of Accutase to dissociate iPSCs and incubate at 37 °C for ~3–5 min.
e. Monitor dissociation under a microscope; cells should appear as small clumps of ~5–10 cells. Gently triturate 2–3 times using 1 mL of DMEM/F12 to further disperse clumps and transfer to a 15 mL tube.
f. Dilute with 3 mL of DMEM/F12, pellet cells (200–300× g, 5 min), and remove supernatant thoroughly.
g. Resuspend the cell pellet in 1 mL of induction medium-myotube (IM-Myo) and count cells using a hemocytometer. Plate 200,000–250,000 cells onto Matrigel-coated wells, then add an additional 2 mL of prewarmed induction medium-Myo.
Critical:
1. The exact seeding density within this range should be adjusted according to the quality and behavior of the starting iPSC culture, including colony morphology, attachment efficiency after splitting, line-specific survival, and early proliferative capacity.
2. Since iPSCs typically undergo one to two rounds of replication during the first 1–2 days of differentiation, the lower end of the range can be used for healthy, robustly expanding cultures, whereas the higher end is recommended for lines with poorer survival, slower early growth, or increased sensitivity during differentiation initiation. The chosen density should also take into account the culture surface area and the number of motor neurons required for downstream experiments. For further information on cell plating density, refer to [35].
3. Similar considerations and optimizations apply to MN differentiation as well.
2. (Day 1) Myotube induction
a. The following day, gently swirl the plate to resuspend debris. Aspirate medium and wash once with prewarmed 1× PBS.
b. Add 2 mL of prewarmed IM-Myo, freshly supplemented with factors.
3. (Day 2) Early differentiation stage and substrate preparation
a. Wash once with prewarmed 1× PBS. Refresh with prewarmed IM-Myo freshly supplemented with factors. Examine cells under a 10× or 20× microscope. Cells should start to show morphological differences compared to colony morphology.
b. To proceed with subsequent differentiation steps, prepare MFC assemblies as described above and perform the coating steps accordingly.
Pause point: Two-day differentiated myotubes can be frozen in cryovials and stored in liquid nitrogen using a protocol similar to iPSC cryopreservation. When the next co-culture experiment is planned, the cells can be thawed and seeded into the chambers. As post-thaw cell loss is expected, increase the plating number accordingly in the distal compartment.
E. Coating and culturing iPSC-derived myotubes and motor neurons
Timing: 1–2 days
E1. Coating of the distal compartment
1. Before initiating the coating step, remove the pre-incubated DMEM from the distal compartment and add diluted extracellular matrix (ECM).
2. Using a 200 μL pipette, gently dispense the ECM solution toward the channel entrance and confirm flow through the microchannels into the opposite distal well. Maintain a final ECM volume of 90–100 μL in the distal compartment, while leaving 80–90 μL of DMEM in the proximal compartment to maintain the volumetric gradient.
3. Incubate the chambers for 1–2 h in a humidified CO2 incubator. Overnight incubation does not alter coating efficiency or experimental outcome.
E2. Plating myotube precursors in the distal compartment
Timeline: Day 3 of culture timeline (refer to Figure 2).
1. At this stage, two-day differentiated human iPSC-derived myotubes should be ready in one well of a 6-well plate and display morphological changes distinct from the undifferentiated stem cell colonies.
2. Add 400 μL of Accutase to dissociate the cells and place the plate inside a humidified CO2 incubator for 4–5 min.
3. After incubation, observe the cells under a 10× or 20× microscope objective to confirm dissociation.
4. Add 1 mL of DMEM/F12 to the well and gently resuspend the medium to detach the cells. Add an additional 3 mL of DMEM/F12, then collect the cell suspension (total volume 4 mL) into a 15 mL tube.
5. Centrifuge at 200–300× g for 4 min at room temperature to pellet the cells.
6. Transfer the tube to a biosafety cabinet, carefully discard the supernatant, add 1 mL of IM-Myo medium to the pellet, and gently resuspend the cells.
Caution: Avoid the formation of air bubbles by incomplete release of the full media volume.
7. Count cells using a hemocytometer. Based on the number of MFC assemblies required, aliquot the appropriate volume containing 60,000–70,000 cells per MFC chamber into 1.5 mL microcentrifuge tubes. Centrifuge again at 200× g for 3 min. Resuspend the pellet in a volume appropriate for the number of MFC assemblies to be seeded. For instance, for six MFCs, resuspend cells to a total volume of 24 μL.
8. Using a 20 μL pipette tip, aspirate 4 μL from the total suspension. Slowly dispense approximately half of the volume (~2 μL) into one side of the distal channel. Allow the cells to settle for a few seconds, then reorient the plate and dispense the remaining volume (~2 μL) into the opposite side of the channel to reduce flow and maximize cell retention within the channel.
9. Verify cell entry into the channel using a 10× light microscope objective, then place the chamber in the incubator for 15–20 min without adding additional medium for the cells to attach.
10. After incubation, slowly add ~15–20 μL of IM-Myo into each distal well and return the chamber to the incubator for an additional 15 min.
11. Under the 20× microscope objective, confirm cell attachment by noticing subtle changes in their morphology from a rounded to a flattened shape, then gently add 80–85 μL of IM-Myo to each distal well.
Notes:
1. Subsequent medium changes for myotube differentiation throughout the co-culture period are performed in the distal compartment.
2. Maintain a volumetric gradient between the two compartments.
3. During media changes, avoid complete aspiration of medium from either compartment. Maintaining a small residual volume of medium helps preserve cell health and compartmental integrity.
12. After 24 h, replace the medium in the distal wells with fresh IM-Myo without RI. Continue medium changes every two days until day 6.
13. On day 6, add IM-Myo supplemented with CHIR99021 (3 μM) and maintain the cells for 48 h.
14. After 48 h, completely remove IM-Myo and replace it with MM-Myo medium supplemented with the factor cocktail.
Note: On the same day (which is D8; refer to Figure 2 for the timeline), coat the proximal compartment with laminin and plate motor neurons into the compartment. It is important to note that the proximal compartment should have been precoated with PLO on the previous day before laminin coating.
15. From this stage onward, refresh MM-Myo medium every 2–3 days, freshly supplemented with appropriate factor cocktail throughout the co-culture period. Shh, Dox, and CultureOne are omitted after 14 days of myotube maturation.
F. Motor neuron differentiation from human iPSCs
Note: Doxycycline induces expression of the hNIL construct and initiates motor neuron differentiation. Morphological changes should be evident within 24–48 h.
1. (Day 0) Plating for motor neuron induction
a. Perform the same steps as described for D0 in the myotube section from steps (E2; 1–6).
b. Resuspend the cell pellet in 1 mL of mTESR1 and count cells using a hemocytometer. Plate 200,000–250,000 cells onto Matrigel-coated wells, then add 2 mL of mTesR1 with RI to the well.
2. (Day 1) Motor neuron induction
a. The following day, gently swirl the plate to resuspend debris. Aspirate medium and wash once with 1× PBS.
b. Add 2 mL of prewarmed induction medium-MN (IM-MN), freshly supplemented with factor cocktail.
3. (Day 2) Early differentiation stage and substrate preparation
a. Examine cells under a 10× or 20× microscope; cells should begin spreading and extending processes. Wash once with prewarmed 1× PBS and replace with prewarmed IM-MN freshly supplemented with factors.
b. To proceed with subsequent differentiation steps, prepare MFC assemblies as described above and perform coating steps.
Pause point: Two-day differentiated motor neurons can be frozen in cryovials and stored in liquid nitrogen using a protocol similar to iPSC cryopreservation. When the next co-culture experiment is planned, the cells can be thawed and seeded into the chambers. As post-thaw cell loss is expected, increase the plating number accordingly in the proximal compartment.
4. Coating of the proximal compartment
Critical: At this stage, myotubes are in the distal compartment. Gently perform coating and culturing of motor neurons in the proximal compartment.
a. Add 90 μL of 1.5 μg/mL Poly-DL-ornithine (PLO) solution to each proximal well.
b. Perform steps similarly to the coating of the distal compartment and ensure that the coating solution flows through the channel.
c. Incubate overnight in a humidified CO2 incubator.
d. Following overnight incubation, remove PLO solution, wash the channel twice with 1× PBS, and perform the second coating with 90 μL of laminin solution (15 μg/mL) to the proximal wells.
e. Incubate in a humidified CO2 incubator for 2–4 h.
Critical: Laminin stored at -20 °C may form a gel when thawed too rapidly. To avoid this, thaw slowly for a minimum of 30 min at 4 °C before use.
5. Plating motor neuron precursors in the proximal compartment (timeline: day 8 of culture timeline; refer to Figure 2)
a. At this stage, two-day differentiated human iPSC-derived motor neurons should be present in one well of a 6-well plate and display morphological features distinct from undifferentiated stem cell colonies.
b. Plate motor neurons in the proximal compartment by following the same procedure described for myotube plating in the distal compartment (steps E2; 7–11).
c. After seeding and incubation for 15 min, confirm attachment of motor neurons in the proximal compartment and simultaneously verify that myotubes in the distal compartment remain intact and healthy.
d. Gently add 70–75 μL of medium to each proximal well to reach a final volume of 90 μL. Refill the distal compartment with MM-Myo medium to maintain a final volume of 100 μL.
e. From this stage onward, refresh MM-MN medium every 2–3 days, freshly supplemented with appropriate factor cocktail throughout the co-culture period.
Critical:
1. Before culturing motor neurons in the proximal well, remove approximately 75%–80% of the medium volume from both distal wells, leaving a minimal volume inside the wells to cover the myotubes. This step is performed to prevent the unintended flow of motor neurons from the proximal to the distal compartment while culturing.
2. At this stage, myotubes are already differentiated and sensitive to minor handling changes. Perform MN culturing gently and quickly to avoid myotube integrity.
3. When culturing a large number of MFC assemblies, perform motor neuron (MN) seeding in batches. For example, if preparing 6–8 MFCs for an experiment, seed MNs in 2–3 chambers at a time and allow them to attach before proceeding with the remaining assemblies.
4. If the myotube medium dries accidentally, replenish with MM-Myo medium and continue incubation for an additional 1–2 days. In some cases, myotubes may recover and continue to mature, as assessed by morphology. If proper differentiation is not observed after several days, or if cell health remains compromised, exclude the affected chamber from downstream experiments.
G. Maturation and maintenance of motor neuron–myotube co-cultures
Timing: 3 weeks
1. This protocol enables the compartmentalized co-culture of motor neurons and myotubes within the same microfluidic chamber system throughout the maturation period. All co-cultures were genotype matched: WT MNs with WT myotubes and TDP-43M337V mutant MNs with TDP-43M337V mutant myotubes.
2. Media and supplements are added in a compartment-specific manner according to the differentiation or maturation stage of each cell type. From DIV9 to DIV30, both compartments are maintained under maturation conditions for approximately 21 days, with routine medium changes every 2–3 days. No additional procedural change is introduced between DIV9 and DIV16.
3. After approximately one week in maturation medium, around DIV16, motor neurons typically extend axons through the microgrooves into the distal myotube compartment, where early axon–myotube innervation can be observed. With continued maturation until DIV30, axonal outgrowth becomes more extensive, with longer axons spreading throughout the myotube compartment. Representative co-cultures in microfluidic chambers are shown in Figure 3.
4. ALS-relevant phenotypes were first observed after approximately 3 weeks of co-culture and became more pronounced with prolonged maintenance. Using this procedure, co-cultures were successfully maintained for up to ~1.5 months, after which experiments were terminated.
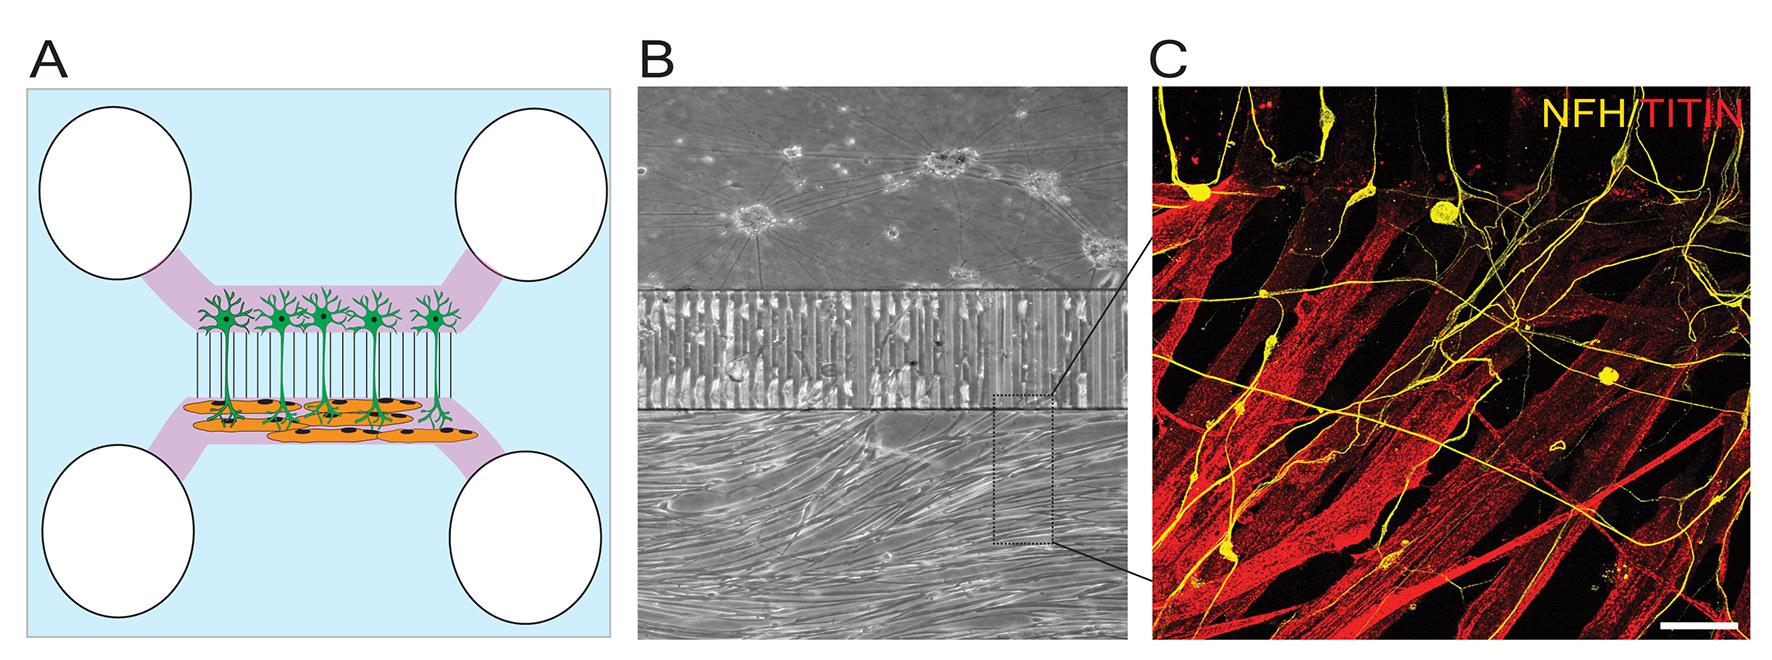
Figure 3. Characterization of human induced pluripotent stem cell (iPSC)-derived motor neuron–myotube co-culture. (A) Diagram showing a model of compartmentalized microfluidic chamber culturing motor neurons (green) in upper compartment and myotubes (orange) in lower compartment. (B) Phase contrast and (C) (inset) representative immunofluorescent image showing motor axons (neurofilament heavy chain, NFH) and innervating myotube (Titin, TTN) compartment. Scale bar, 20 μm.
H. Fixation and immunofluorescence staining
H1. Neuromuscular co-culture markers
We stained human iPSC-derived neuromuscular co-cultures in a compartment- and cell type–specific manner. In the proximal compartment, we labeled motor neurons and axons with neurofilament heavy chain (NFH) pTDP-43 as the protein of interest. In the distal compartment, we stained axons with NFH, myotubes with Titin, and pTDP-43 to assess protein (mis)localization.
H2. Compartmentalized immunofluorescence staining of microfluidic co-cultures
1. Fixation
a. Inside a chemical fume hood, prepare fresh 4% PFA diluted in 1× PBS.
b. Carefully replace culture medium with 50–100 μL of PFA per well (volumes may differ between wells to maintain compartmental gradients) and incubate for 20 min at room temperature.
c. Wash chambers three times with ~100 μL of 1× PBS, 5 min per wash, maintaining appropriate volumes in each well.
Notes:
1. PFA-fixed chambers can be stored at 4 °C for up to 1–2 weeks before proceeding with the immunofluorescence (IF) procedure.
2. Maintain compartment-specific volumes, including consistent volumes between wells, to facilitate efficient diffusion and distribution of staining reagents.
2. Immunostaining
a. Transfer the chambers to your workbench for staining procedures.
b. Add Triton-based blocking solution to each chamber, ensuring that all wells are fully covered.
c. Incubate for 30 min at room temperature (do not exceed this time).
d. Wash chambers three times with ~100 μL of 1× PBS, 5 min per wash.
Note: Use Triton-free blocking solution for subsequent steps.
e. Incubate chambers for 30 min at room temperature with blocking solution.
f. Dilute primary antibodies for NFH and Titin (1:500), pTDP-43 (1:1,000) in blocking solution, and add to the appropriate compartments.
g. Incubate overnight at 4 °C.
h. Wash chambers three times with ~100 μL of 1× PBS, 5 min per wash.
i. Dilute secondary antibodies (1:1,000) in blocking solution and incubate chambers for 2 h at room temperature (protect from light).
j. Following incubation, wash chambers three times with 1× PBS, 10 min per wash.
k. Samples were mounted with ProLong Gold antifade mountant ± DAPI, with the refractive index (RI) of 1.47.
l. Leave it to dry overnight at room temperature and store the samples at 4 °C until imaging.
m. Representative confocal images of co-culture, describing pre- and post- synaptic markers, are shown in Figure 3.
I. Imaging human neuromuscular co-cultures
Imaging of human neuromuscular co-cultures was performed using an Andor BC-43 benchtop spinning-disk confocal microscope, controlled by Andor Fusion software (v2.3a). Samples were imaged using excitation laser lines at 405, 488, 561, and 638 nm, with corresponding emission filters (445/20, 529/24, 595/31, and 708/75). Images were acquired using a 60× oil-immersion Plan Apochromat objective (NA 1.42) as multichannel Z-stacks with the image size of 1,024 × 1,024, 16-bit depth, 0.1 μm/pixel, and a Z-step size of 0.3–0.5 μm.
Laser power used typically ranges from 2 to 4 mW at the source, corresponding to ~10–40% power; exposure times range from 100 to 500 ms. Identical imaging settings were maintained across experimental conditions. Co-cultures were immunostained for NFH, pTDP-43, DAPI, and Titin. Image deconvolution was performed using the built-in option of Andor Fusion software. For more details on the microscope, refer to https://andor.oxinst.com/downloads/view/bc43-user-guide.
1. Using bright-field imaging mode (10× or 20×), identify regions of axonal innervation in the distal compartment.
2. Switch to a 60× oil immersion objective lens.
3. Apply a small drop of immersion oil onto the lens surface.
4. Identify regions containing axons positive for NFH and/or pTDP-43. Axonal coverage is typically higher near the microgroove exit and extends toward the central region of the distal compartment.
5. Acquire images following a systematic scanning pattern (e.g., left to right or vice versa) to facilitate tracking of imaged axonal regions and to avoid repeated imaging of the same area.
6. Acquire 10–15 images from the distal compartment per MFC to enable robust quantification of axonal integrity.
7. Analyze 3–4 MFC assemblies per experimental group, ensuring that each image contains sufficient axonal and myotube coverage for downstream analysis.
J. Image analysis
Caution: It is important to be familiar with the cell morphology and the specific phenotypes being analyzed prior to performing this analysis.
To quantify ALS-relevant phenotypes observed, including NFH degeneration and axonal pTDP-43 accumulation in human neuromuscular co-culture (Figure 4), we developed a semi-automated image analysis pipeline using Fiji and Cell Profiler. Refer to Figures 5–9 to perform analysis in the Cell profiler workspace, and refer to the table attached in the Github link to know the action required for each function.
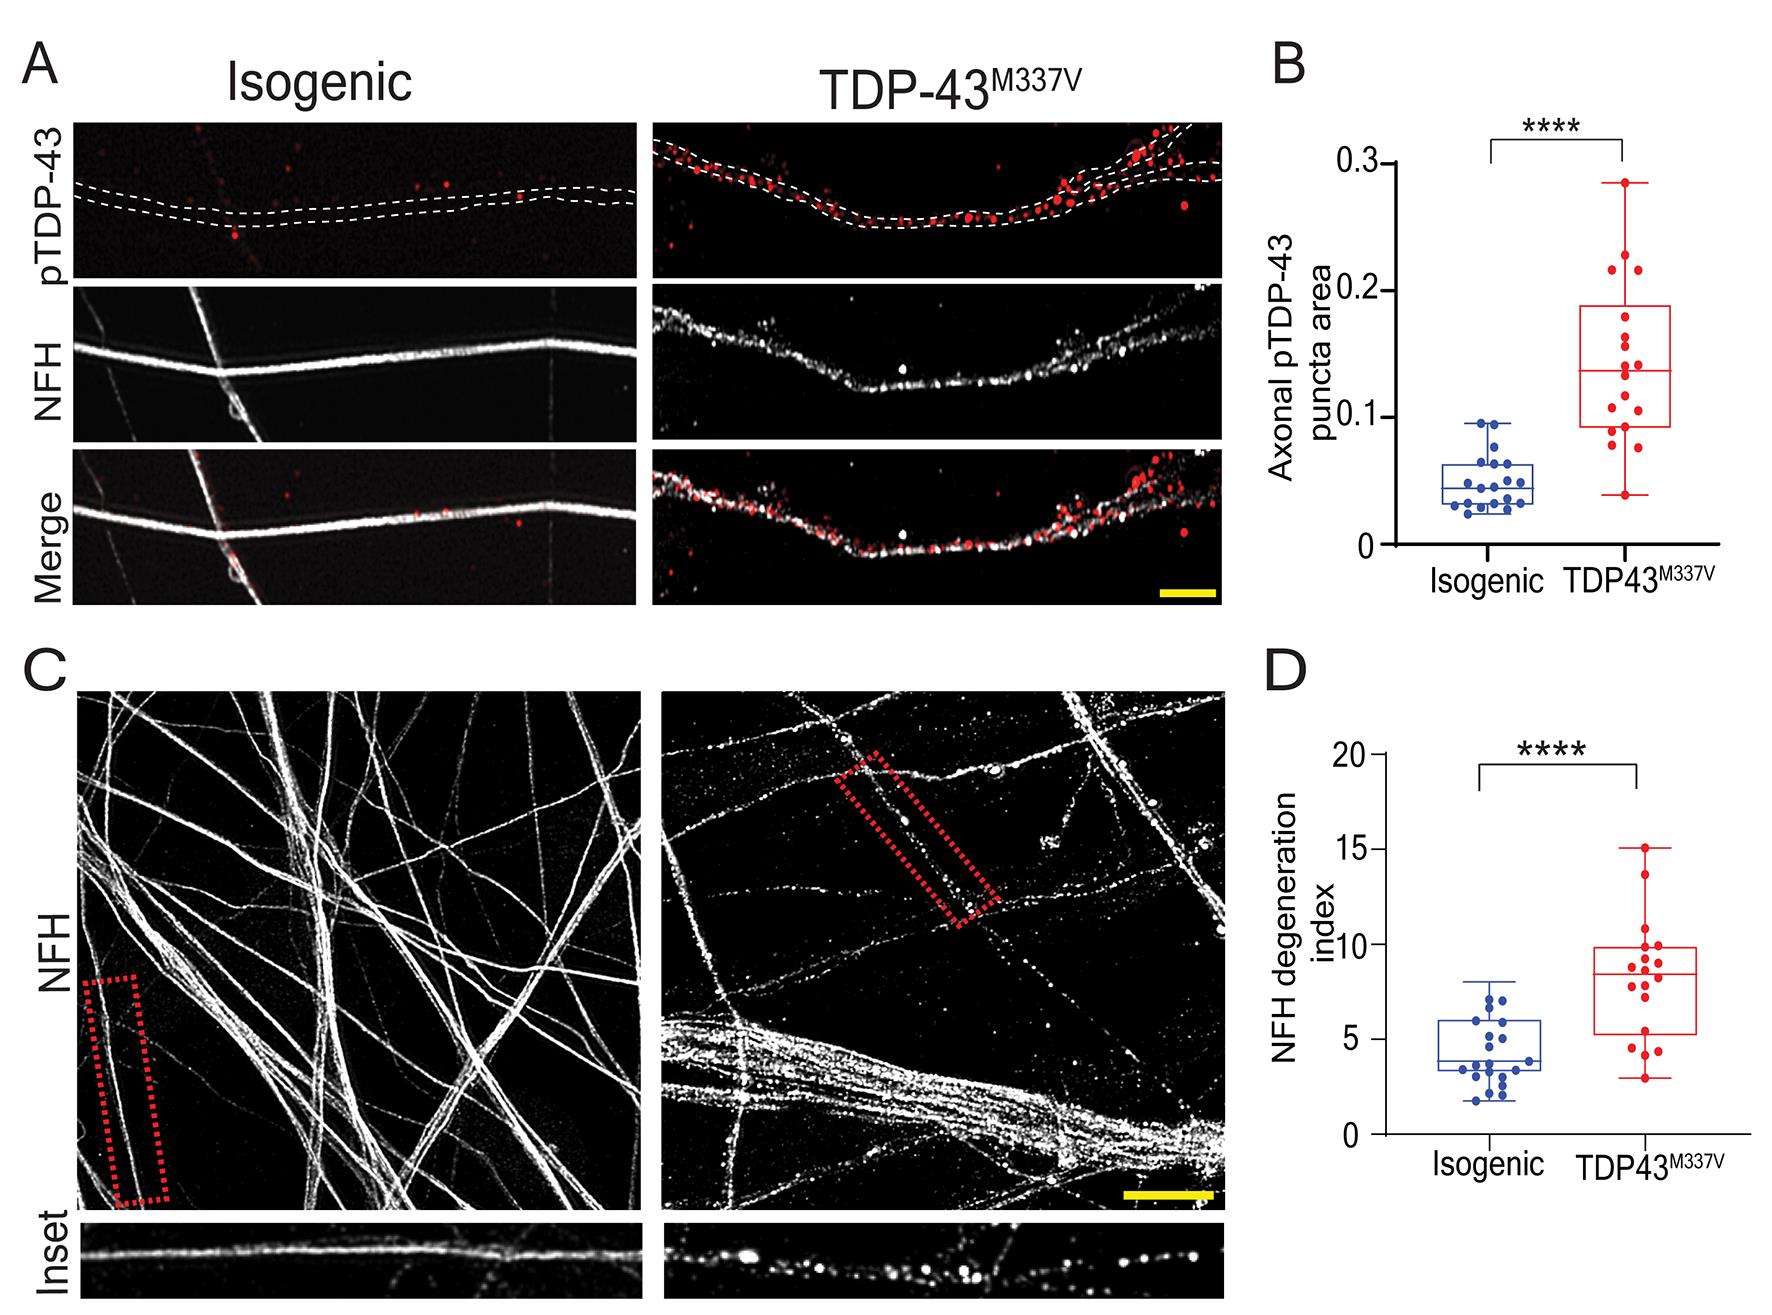
Figure 4. Quantification of amyotrophic lateral sclerosis (ALS) phenotypes in human induced pluripotent stem cell (iPSC)-derived motor neuron–myotube co-cultures. (A, B) Representative images and analysis of pTDP-43 area in distal axons of isogenic control and TDP-43M337V co-cultures; Scale bar, 5 μm. (C, D) Representative images and analysis of neurofilament heavy-chain (NFH) degeneration index in the distal compartment of isogenic control and TDP-43M337V co-cultures. Scale bar, 10 μm. Data in (b) and (d) are shown in box-and-whisker plots showing all individual data points. n = 28, 18 imaging fields from 3 independently grown neuromuscular co-cultures. Unpaired, two-tailed t-tests were performed; ****p = 0.0001. Data adapted from [30] and modified for presentation. Color schemes and representative images were adjusted while preserving the original quantitative outcomes.
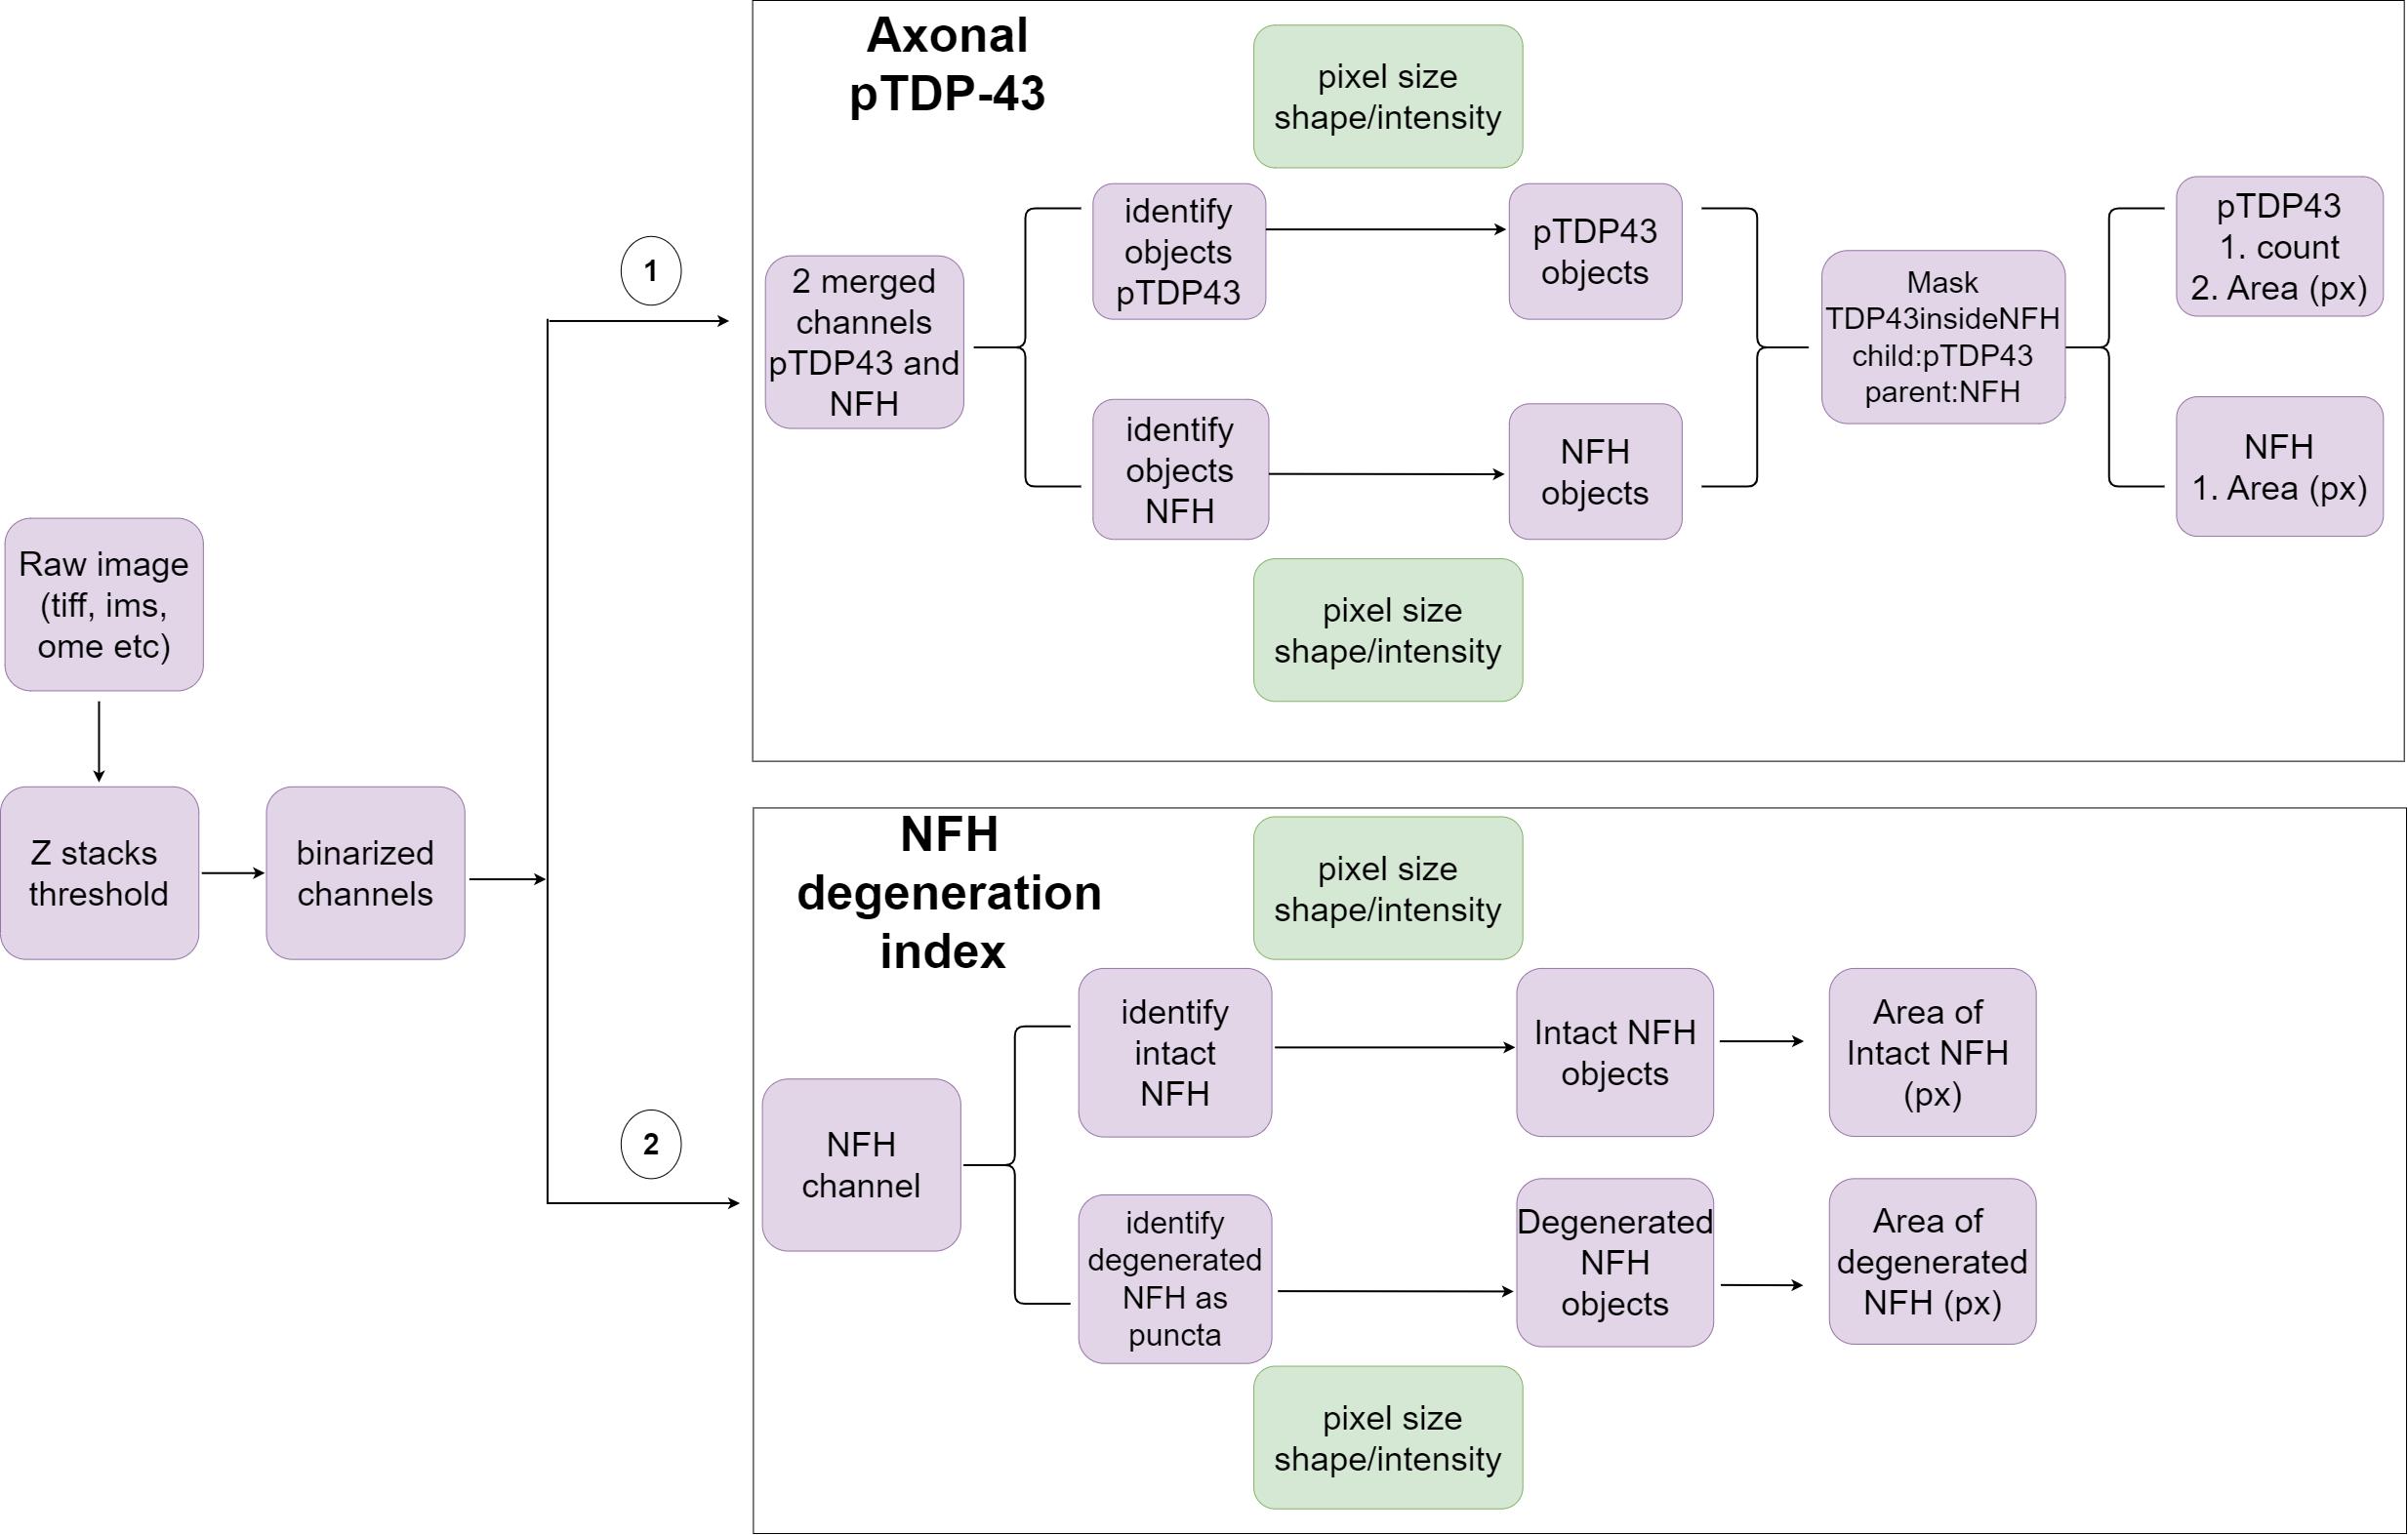
Figure 5. Pipeline scheme for semi-automated image analysis. For both analysis pipelines (1, 2), first, images are thresholded and binarized to merge all Z stacks using Fiji. For axonal TDP-43 analysis (1), merged imaged channels (pTDP-43|NFH) are fed into the CellProfiler pipeline to identify objects (NFH and pTDP-43) separately using the IdentifyPrimaryobjects module. Using the parent-child module, pTDP-43 objects inside the masked NFH are segmented, and the output is used to quantify the area and count of pTDP-43 objects and the area of NFH (pixels). For NFH degeneration index (2), the NFH channel is fed into the pipeline to identify both intact and degenerated objects. Using MeasureObjectSizeshape in CellProfiler, the count and area of intact and degenerated axons (pixels) are quantified.
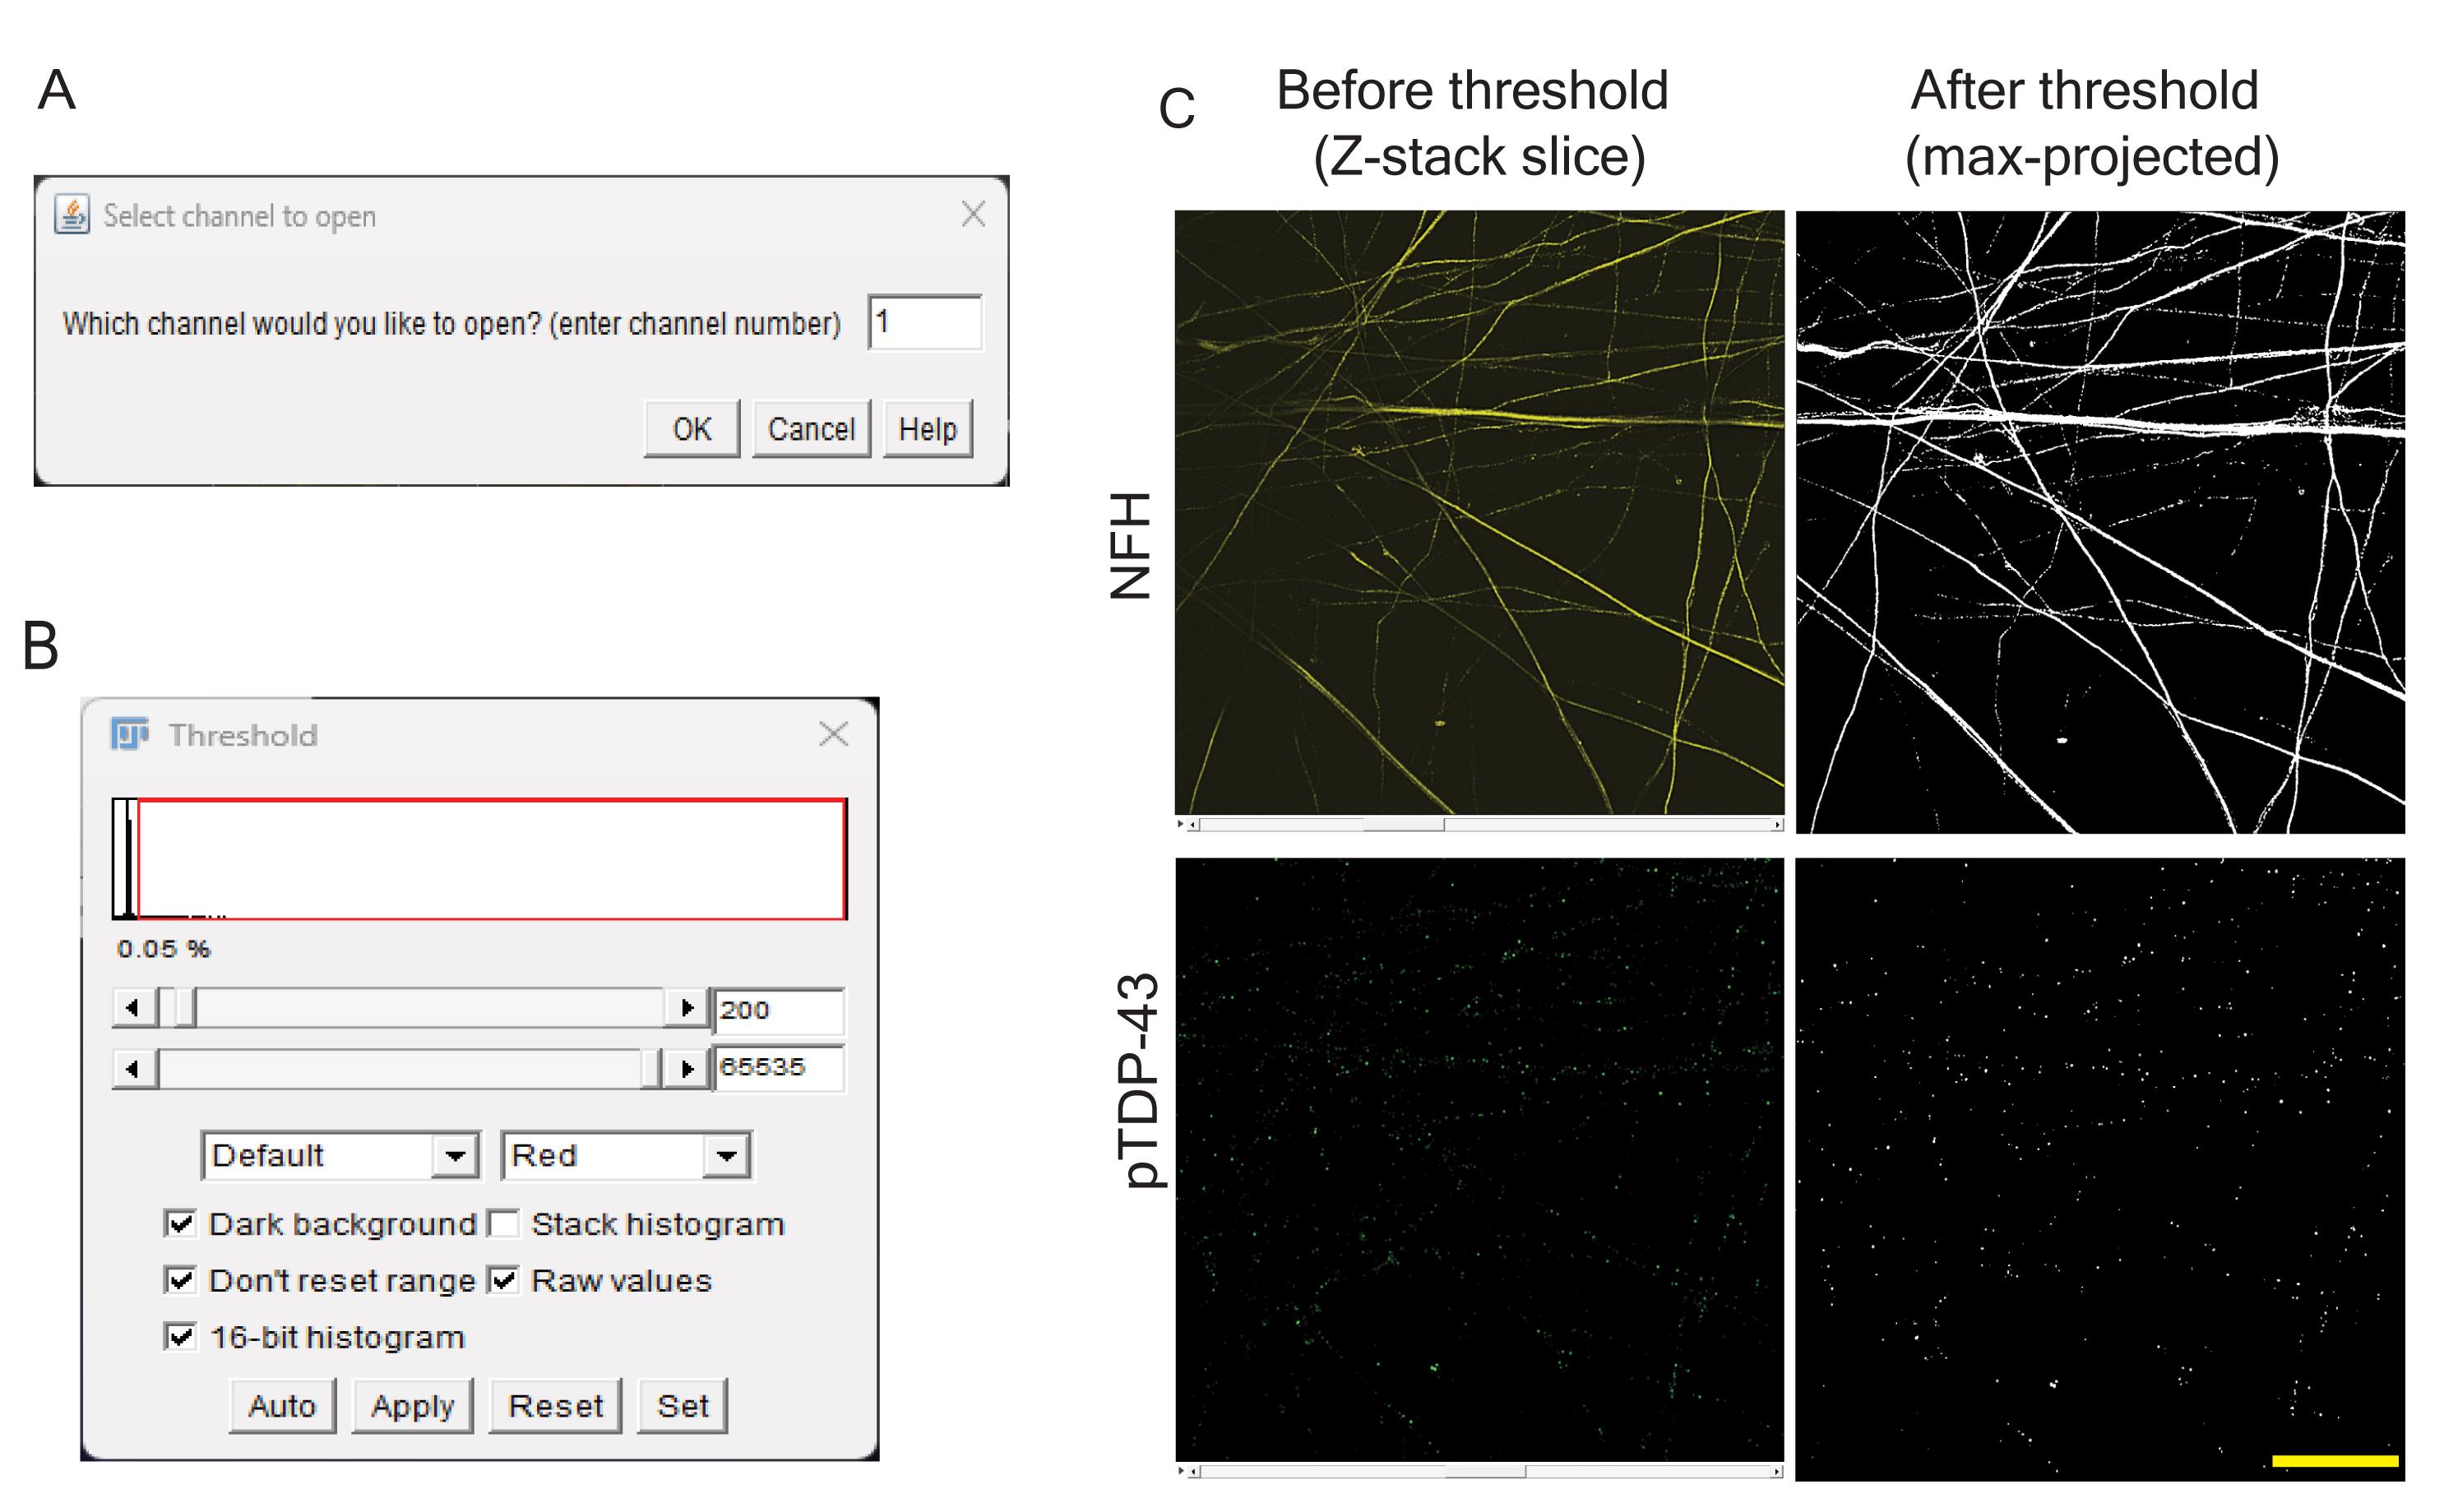
Figure 6. Image preprocessing in Fiji/ImageJ. (A, B) Representative screenshots of the Fiji/ImageJ module illustrating the selection of the appropriate image channel and thresholding parameters, using the NFH channel. These steps allow users to inspect intensity distributions and determine suitable threshold values prior to channel binarization for both NFH and pTDP-43 channels. (C) Representative optical sections from a Z-stack showing NFH and pTDP-43 channels before thresholding and after threshold application, displayed as maximum intensity projections. Scale bar, 10 μm.
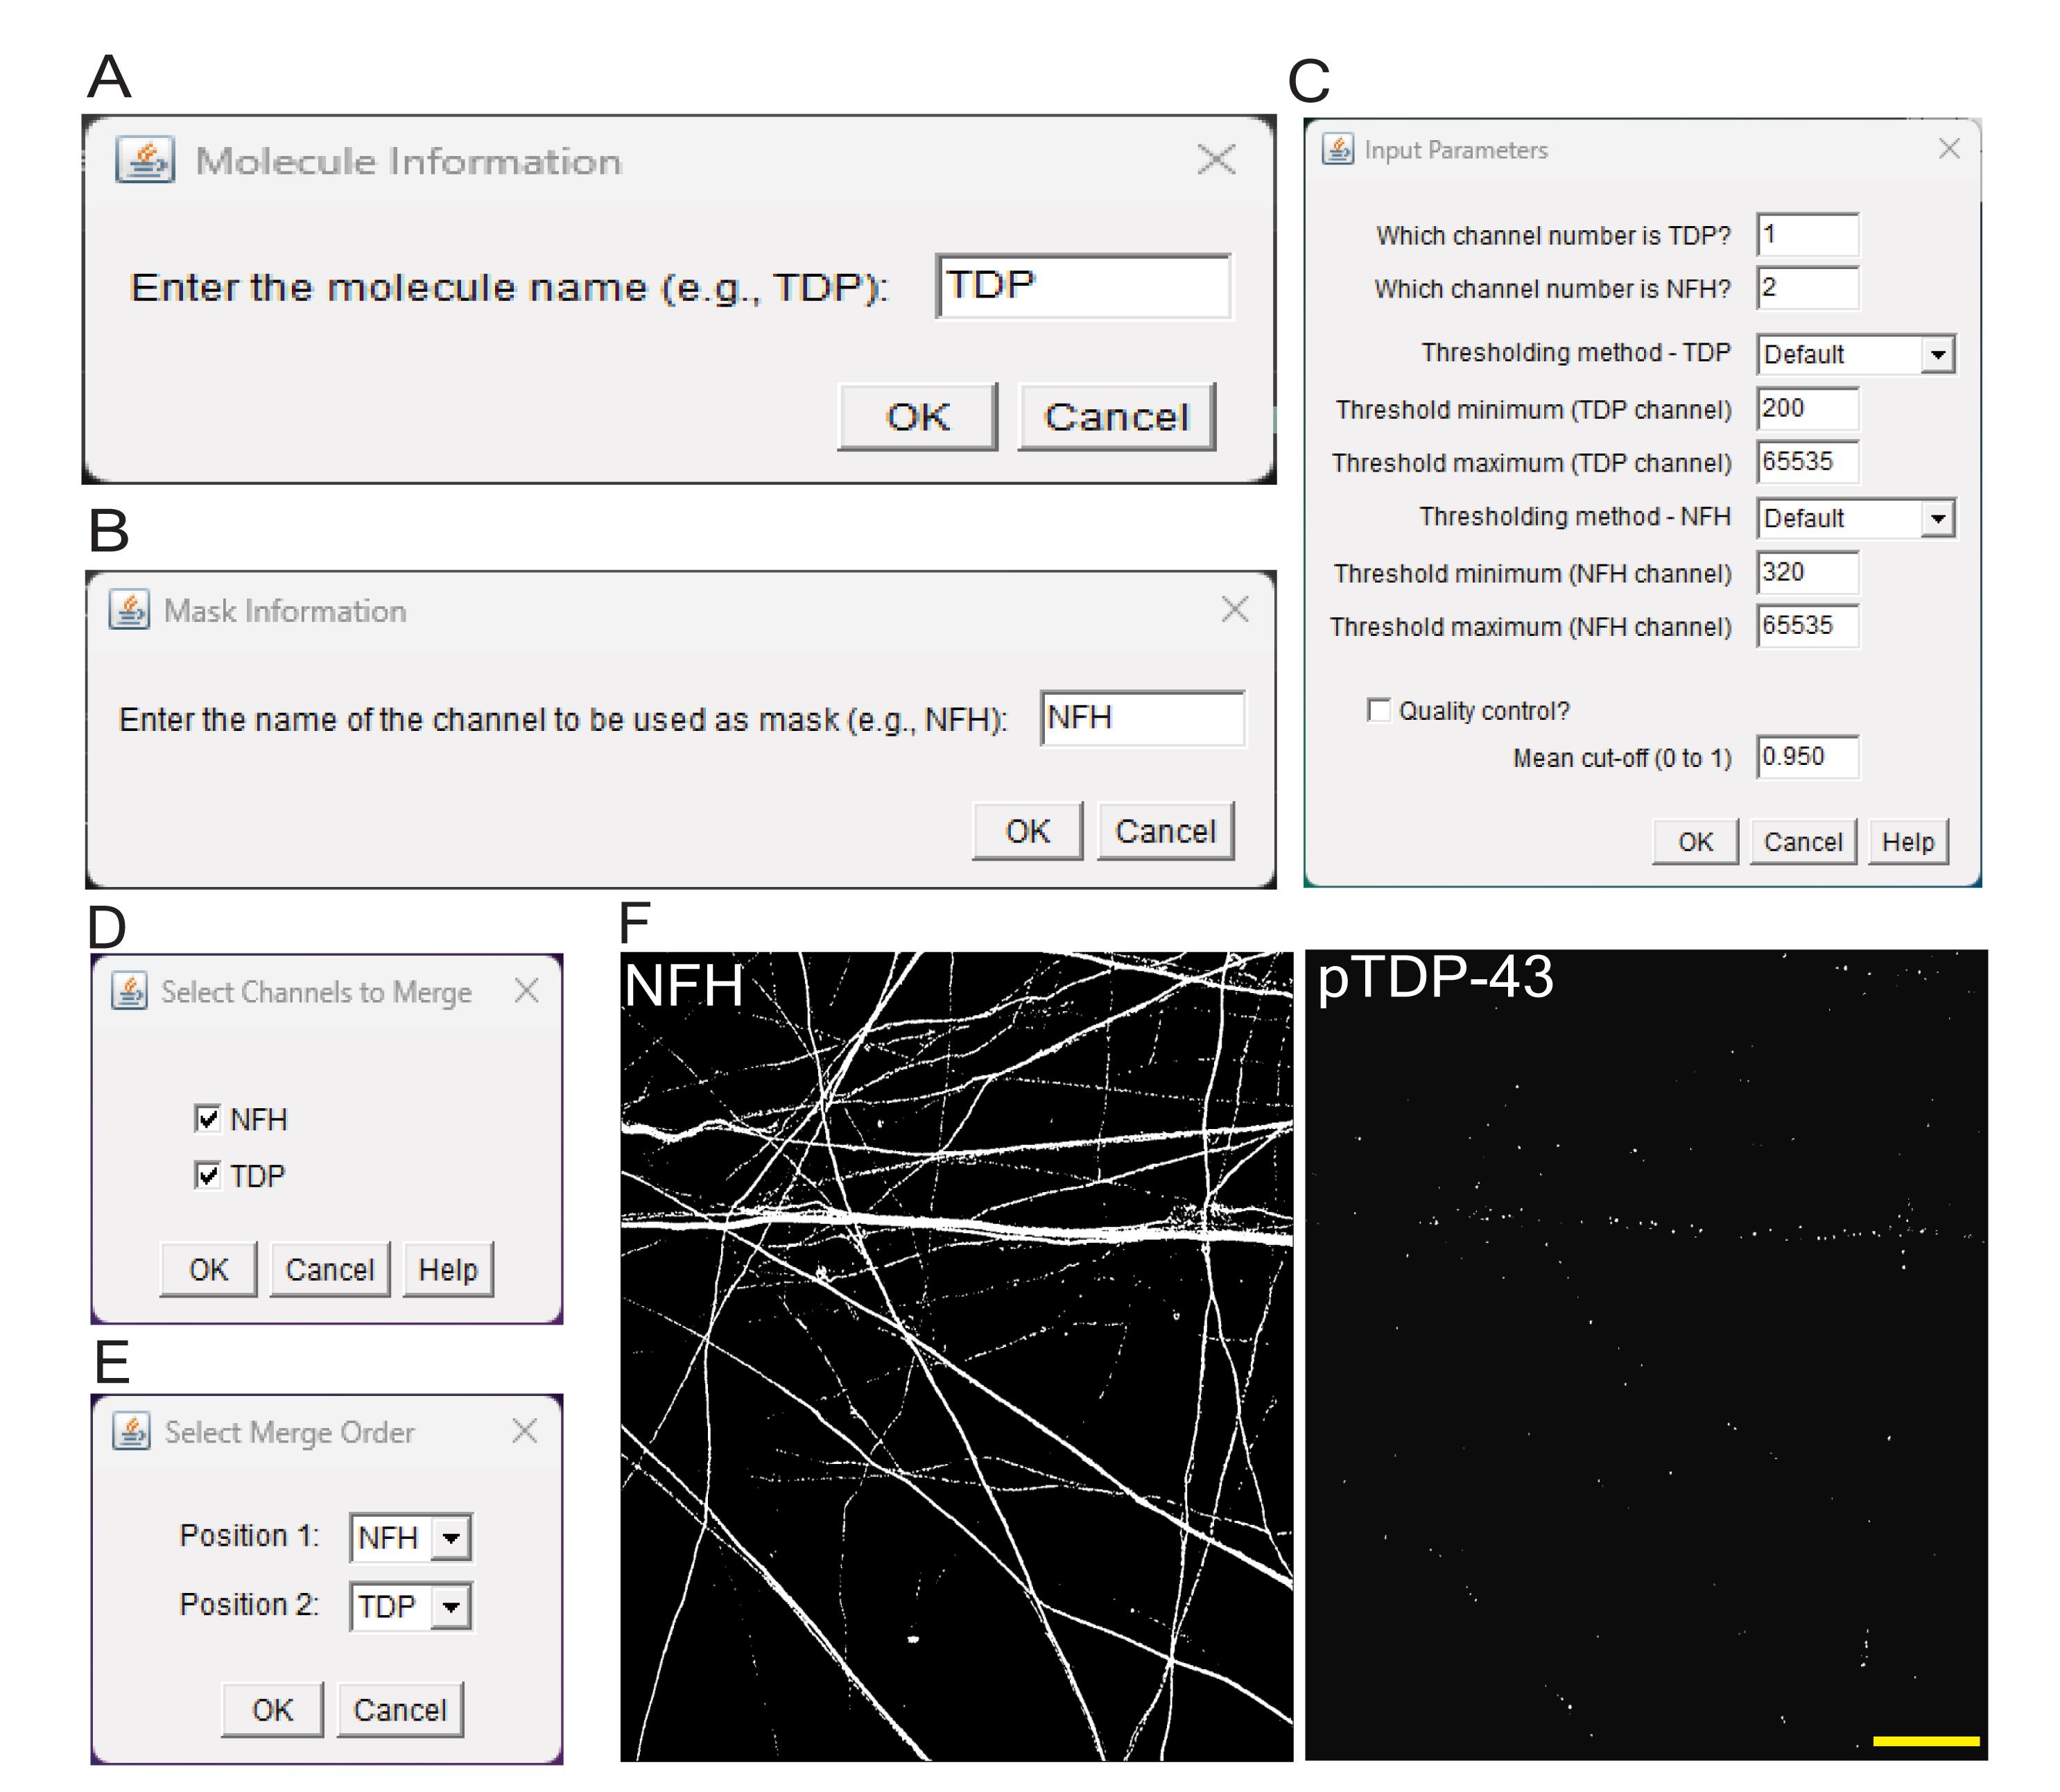
Figure 7. Masking and remerging channels. (A–E) Representative screenshots of the Fiji/ImageJ workflow illustrating selection of the masking channel (NFH) and molecular target channel (pTDP-43). These steps allow users to input threshold values determined during prior image inspection and to define the order of channel merging. This step is critical, as the resulting binarized output serves as the initial input for channel splitting and object identification in CellProfiler. (F) Representative binarized images of NFH and pTDP-43 (identified only in intact axons) following the steps of Mask channels.ijm and Remerge Channels.py. At the final stage of the pipeline, channels are pseudo-colored (NFH: red; pTDP-43: green; not shown) to facilitate visualization and structural differentiation; during CellProfiler analysis, channels are subsequently split for object identification using the ColorToGray module. Scale bar, 10 μm.
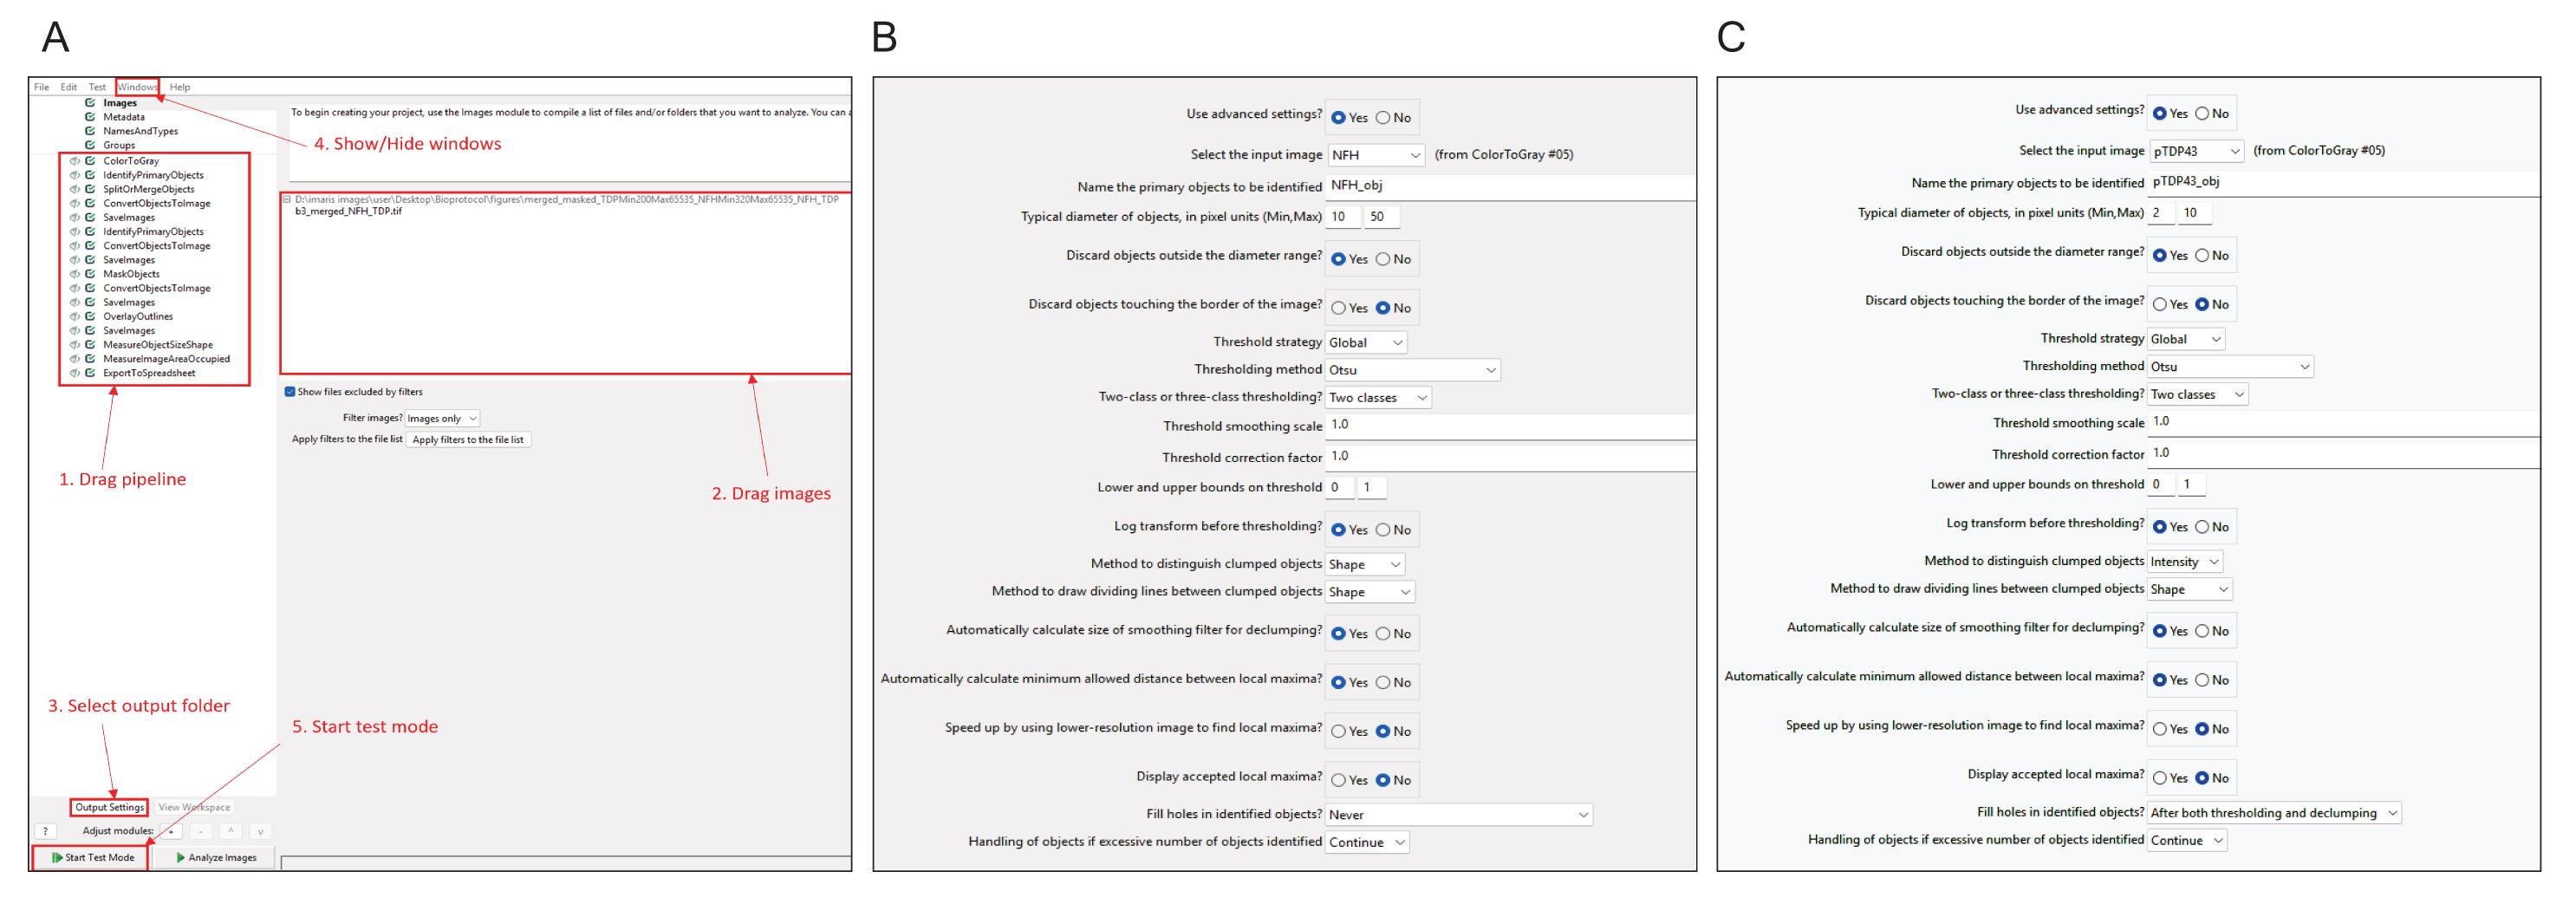
Figure 8. Identifying primary objects in CellProfiler. (A) Representative examples illustrating the CellProfiler interface, including the home screen and the module used for segmentation of (B) NFH and (C) pTDP-43. Panels show the key steps and parameter settings selected to identify objects of interest.
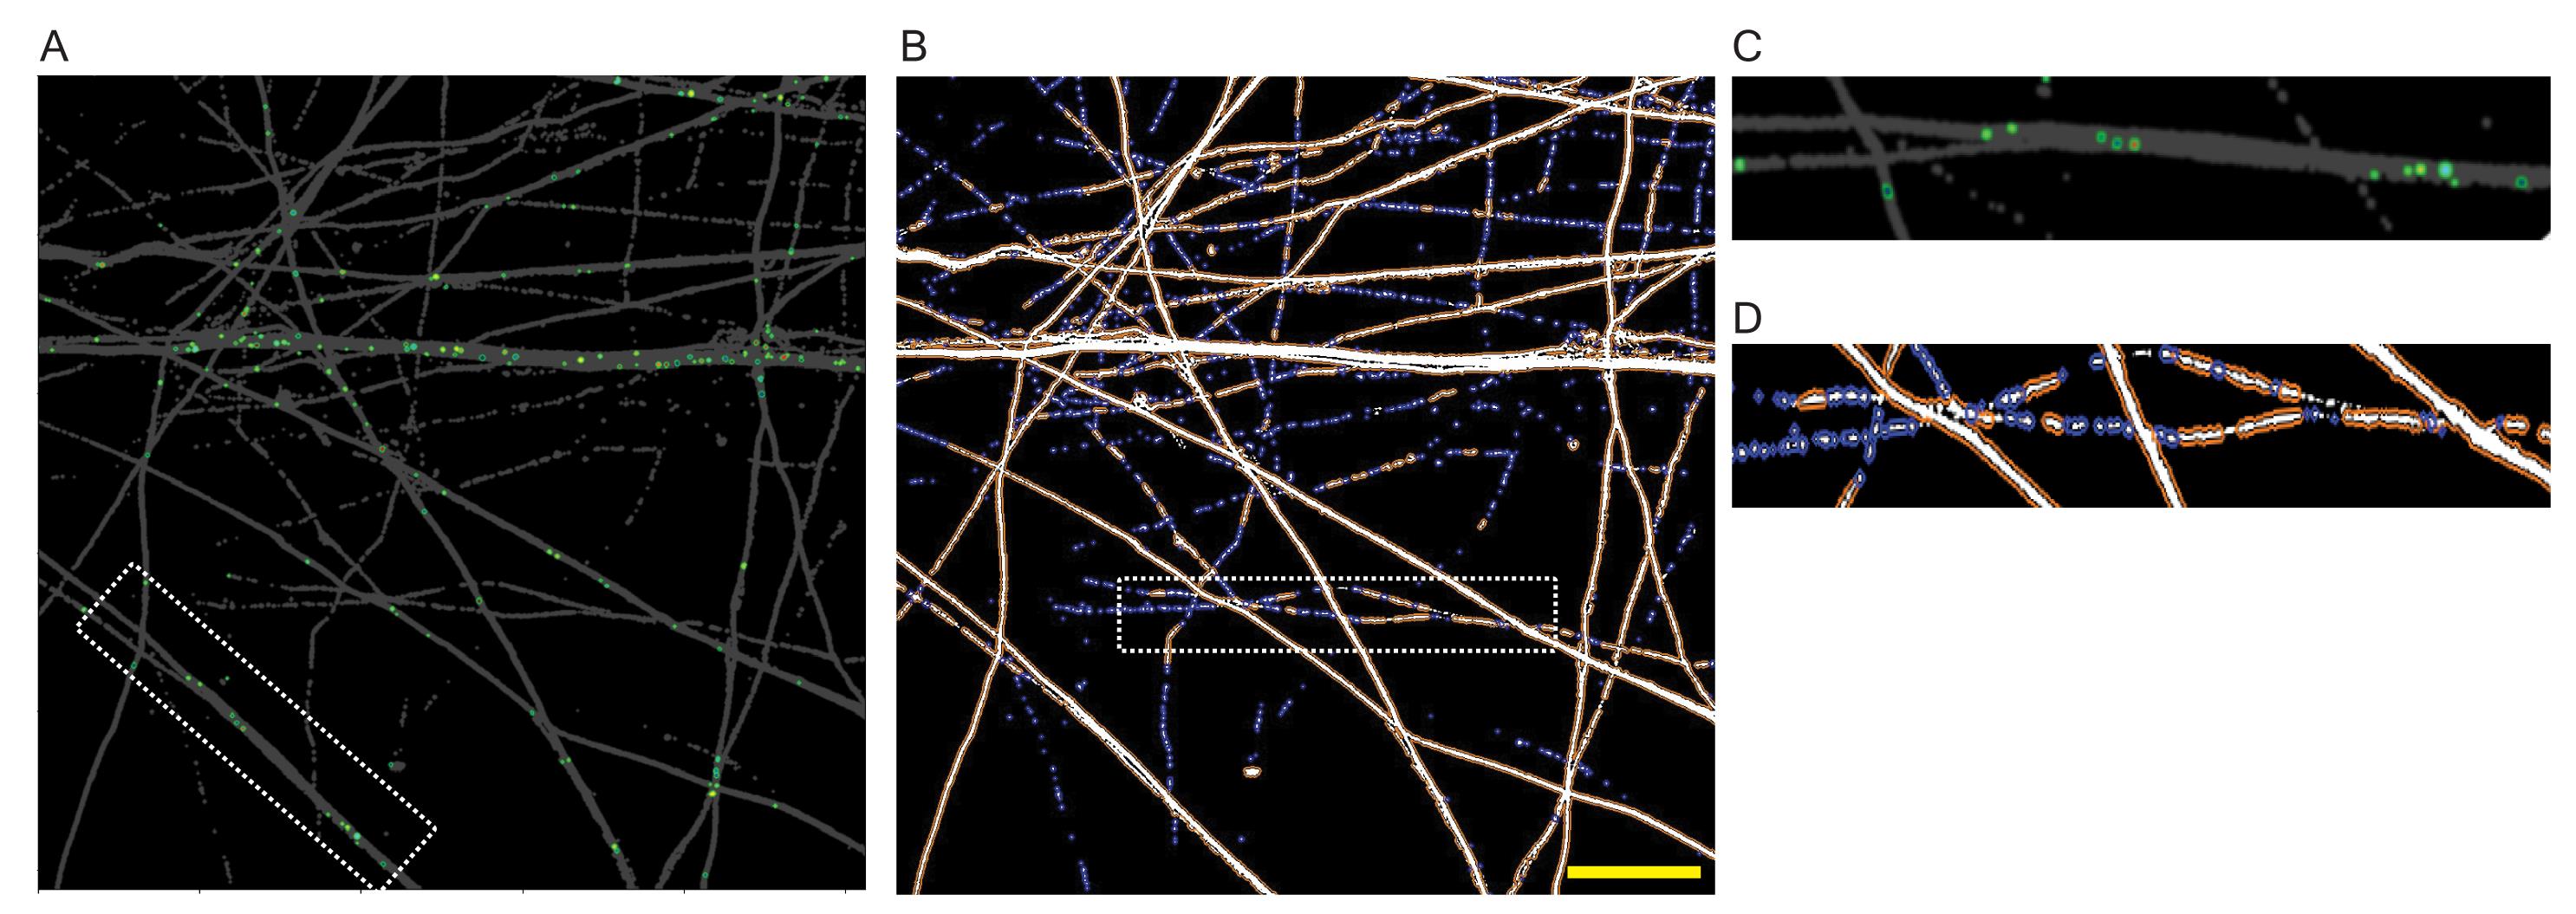
Figure 9. Representative segmentation outputs in CellProfiler. (A) CellProfiler output from the axonal pTDP-43 analysis pipeline following application of the MaskObjects module, illustrating the identification of pTDP43 objects localized per intact neurofilament heavy chain (NFH) (parent objects). (B) CellProfiler output showing identification of intact (orange outline) and degenerated (blue) NFH-positive axons in the distal compartment of the neuromuscular co-culture. (C, D) Zoomed images of the insets showing output examples following the MaskObjects step. Scale bar, 10 μm.
1. The analysis pipeline is organized into two principal workflows: (i) segmentation of NFH-positive axons into intact and degenerated classes, and (ii) detection of pTDP-43 puncta within the segmented intact NFH regions. These outputs are used to calculate the NFH degeneration index [30], defined as the relative proportion of intact to degenerated NFH. In parallel, two quantitative metrics describing axonal pTDP-43 can be extracted: (1) the total pTDP-43 puncta signal localized within NFH, normalized to the total NFH area per image (referred to as axonal TDP-43 puncta area), published in [30] and (2) the number of pTDP-43 puncta, normalized to NFH area and reported as TDP-43 puncta density per μm2, which is a recent additional step in the pipeline. Analysis results are stored as Excel file outputs under corresponding folders as selected by the user.
2. Phenotype criteria: Intact and degenerated axonal objects were distinguished using object size, shape, and intensity-based features. Intact axons were defined as larger, continuous NFH-positive structures, whereas degenerated axons were defined as smaller, fragmented, or discontinuous NFH-positive objects. The NFH channel was used both to calculate the NFH degeneration index and to generate an axonal mask for TDP-43 puncta analysis. For TDP-43 puncta quantification, only intact NFH-positive axonal regions were included, while degenerated axonal fragments were excluded.
3. Image preprocessing steps performed in Fiji are critical for accurate NFH axon segmentation and mask generation, and serve as a prerequisite for subsequent object segmentation and quantitative analysis in CellProfiler.
4. Conceptually, the workflows for mask generation, object identification, segmentation, and quantification are largely shared between the NFH and pTDP-43 analyses. Common thresholding and segmentation parameters (and not values) are applied across both pipelines. The key distinction lies in the analytical focus: the NFH degeneration pipeline differentiates intact from degenerated axons, whereas the axonal pTDP-43 pipeline specifically restricts analysis to intact axons and quantifies pTDP-43 signal and puncta within those regions.
Critical: Although a larger number of axonal pTDP-43 puncta may be visible in raw images, quantification was restricted to pTDP-43 signals localized within intact NFH-positive axons, as clearly distinguished during the preprocessing and segmentation steps of the pipeline. This distinction is essential to ensure biologically meaningful measurements and should be carefully considered when applying the workflow to other molecular targets.
5. After threshold values are defined and applied for each channel, the output images are automatically saved with filenames that encode the corresponding threshold parameters to facilitate traceability. For example, masked_TDPMin200Max65535_NFHMin320Max65535.
6. Depending on the experimental question, preprocessing and segmentation steps can be applied independently or in combination. The pipeline is modular and can be readily adapted to different neuronal axon types and molecular targets by adjusting segmentation parameters.
7. Following initial validation of the analysis pipeline, image datasets were blinded and independently analyzed to assess reproducibility and confirm the robustness of the quantification.
K. Axonal TDP-43 analysis
K1. Preprocessing in Fiji
This workflow outlines the analysis pipeline for the identification and quantification of TDP-43 (pTDP-43) localization within NFH structures.
The process consists of two primary stages: image preprocessing in Fiji/ImageJ to generate masks and object identification in CellProfiler.
Stage 1: Image preprocessing in Fiji/ImageJ
Note: Images should be in the following types: .ims, .tif, .tiff, .czi, .lif, .dcm, .ome.tif, .nd2, or .svs.
1. Open Fiji and run the threshold selection macro (choose threshold.ijm) on the input image folder. This macro opens a random subset of images to allow the user to determine optimal thresholding parameters.
2. Select Plugins > Macros > Run....
3. Select the macro Choose threshold.ijm in the pop-up window and click Open.
4. In the prompt window, input the channel number corresponding to the channel of interest (e.g., enter 1 if TDP is the first channel).
5. Select the input folder containing the raw images.
6. Enter the number of random images to open for testing (the maximum available count will be displayed).
7. Wait until the selected images are opened, channels are split, and the channel of interest is displayed.
Stage 2: Determine the optimal threshold method and range
Note: This macro is intended solely for visual inspection and parameter optimization and does not generate output files. Use this step to identify and record the thresholding method, as well as the minimum and maximum threshold values, required for the subsequent processing macro. This step may be repeated as needed.
1. Select Image > Adjust > Threshold... (or press Shift + Control + T).
2. Adjust the threshold method and range to capture the maximum amount of NFH signal while minimizing noise.
Note: Ensure that the chosen parameters distinguish signal from background noise; if intensities are identical or similar, segmentation may fail.
3. Record the Threshold Method, Threshold Minimum, and Threshold Maximum values.
4. Close all images (press Shift + W).
5. Repeat steps in stage 1 and 2 for the NFH channel.
Stage 3: Preparing mask
1. Run the processing macro (Mask channels.ijm) to generate a masked molecule image. This macro applies the parameters determined in Stage 2 of this section to the entire image dataset.
2. Select Plugins > Macros > Run....
3. Select the macro Mask channels.ijm and click Open.
4. In the prompt window, input the name of the channel to be used as a mask (e.g., NFH) and the target molecule name (e.g., TDP).
5. For each channel, enter the parameters recorded in Stage 2 of this section:
a. Channel number
b. Threshold method, min, and max
6. Enter the Mean Cutoff value (default is 0.95).
Note: The Mean Cutoff parameter is a quality control step. It calculates the mean intensity (0 to 1) for each slice. Slices with a mean intensity higher than the set value (e.g., 0.95) are automatically deleted to remove artifacts where thresholding is calculated incorrectly. The default value is typically sufficient to ensure the removal of artifact slices.
7. Click OK to run the script. Upon completion of this step, two output directories are created: a mask folder labeled “Channel_X_MASKNAME” (for example, “Channel_1_NFH”) and a molecule-specific folder labeled “Channel_X_MOLECULENAME” (for example, “Channel_2_TDP”).
Stage 4: Remerging channel masks
1. Run the macro Remerge Channels.py in order to remerge the split images from the previous steps into one multichannel image.
2. Select Plugins > Macros > Run....
3. Select the macro "Remerge channels.py" and click Open.
4. In the pop-up window, select the folder containing the output from the previous step.
5. Mark the channels you want to include in the output image (e.g., NFH and TDP).
6. Select the order in which the channels should be organized. (Suggestion: 1: NFH; 2: TDP-43.)
7. A new folder named “merged [folder name]” will be created, containing the final composite images, in which each channel mask is displayed in a distinct color to differentiate their structures (in this case, NFH and TDP-43).
K2. Analysis using CellProfiler
Note: For a step-by-step guide, refer to the Github link.
Timing: ~5–10 min to set optimal parameters; ~10–20s to analyze each file.
This section outlines the analysis pipeline for the segmentation and quantification of intact and degenerated NFH.
Stage 1: Initialize the CellProfiler project and load the pipeline
1. Open CellProfiler.
2. Import the pipeline file MoleculeInsideNFH.cppipe by dragging and dropping it into the pipeline panel.
3. Select the Images tab and drag and drop the preprocessed image folders (from the previous section) into the file list.
Stage 2: Configure output directory
1. Select View output settings to define the destination directory for the output images and for the generated .csv spreadsheet.
2. Optimize segmentation parameters in Test Mode. Select Start Test Mode to begin stepwise optimization.
Stage 3: Cell Profiler modules
1. Upload images from the previous preprocessing step.
2. Certify that the assigned name is “nfh_ptdp43.”
3. Make sure “Channel number” matches the chosen order from Stage 4, sub-section K1.
4. Adjust Typical diameter of objects until TDP is selected (IdentifyPrimaryObjects module).
5. Adjust Typical diameter of objects until NFH is selected (IdentifyPrimaryObjects module).
6. Run the analysis.
7. Once settings are optimized in Test Mode, select Exit Test Mode.
8. Select Analyze Images to execute the pipeline on the full dataset.
9. Upon completion, the data will be exported as .csv files (e.g., Image.csv) in the designated output directory.
L. Pipeline for NFH degeneration index
Stage 1: Image preprocessing in Fiji/ImageJ
1. Open Fiji and run the threshold selection macro (Choose threshold.ijm) on the input image folder. This macro opens a random subset of images to allow the user to determine optimal thresholding parameters.
2. Select Plugins > Macros > Run....
3. Select the macro Choose threshold.ijm in the pop-up window and click Open.
4. In the prompt window, input the channel number corresponding to NFH (e.g., enter 3 if NFH is the third channel).
5. Select the input folder containing the raw.ims images.
6. Enter the number of random images to open for testing (the maximum available count will be displayed).
7. Wait until the selected images are opened, channels are split, and the channel of interest is displayed.
Stage 2: Determine the optimal threshold method and range
Note: This macro is solely intended for visual inspection and parameter optimization only; no output files are generated. Use this step to identify and record the threshold method, minimum, and maximum values required for the subsequent processing macro.
1. Select Image > Adjust > Threshold... (or press Shift + Control + T).
2. Adjust the threshold method and range to capture the maximum amount of NFH signal while minimizing noise.
Note: Ensure that the chosen parameters distinguish signal from background noise; if intensities are identical or similar, segmentation may fail.
3. Record the Threshold Method, Threshold Minimum, and Threshold Maximum values.
4. Close all images (Press Shift + W).
Stage 3: Preparing mask
Note: Run the processing macro ("Process Threshold.ijm") to generate masks. This macro applies the parameters determined in Step 2 to the entire dataset.
1. Select Plugins > Macros > Run....
2. Select the macro Process Threshold.ijm and click Open.
3. In the prompt window, input the name of the channel to be used as a mask (e.g., NFH).
4. Enter the parameters recorded in Stage 2 of this section:
a. Channel number.
b. Threshold method, min, and max.
c. Enter the mean cutoff value (default is 0.95).
d. Click OK to run the script.
5. This will output a folder named “Channel_X_MASKNAME” (e.g., “Channel_1_NFH”).
Note: The mean cutoff parameter is a quality control step. It calculates the mean intensity (0 to 1) for each slice. Slices with a mean intensity higher than the set value (e.g., 0.95) are automatically deleted to remove artifacts where thresholding is calculated incorrectly. The default value is typically sufficient to ensure the removal of artifact slices.
Stage 4: Initialize the CellProfiler project and load the pipeline
Note: A step-by-step guide can be found on GitHub.
1. Open CellProfiler
2. Import the pipeline file NFHdeg.cppipe by dragging and dropping it into the pipeline panel.
3. Select the Images tab and drag and drop the preprocessed image folders (from Stage 3 of this section) into the file list.
Stage 5: Configure output directory
1. Select View output settings to define the destination directory for the output images and for the generated .csv spreadsheet.
2. Optimize segmentation parameters in Test Mode. Select Start Test Mode to begin stepwise optimization.
Stage 6: Cell Profiler modules
1. Upload images from the Stage 4 of this previous preprocessing step.
2. Certify that the assigned name is “NFHimage_”.
3. Make sure Channel number is set to 1 and Image name is set to “NFH”.
4. Assign values for the threshold method, as well as lower and upper bounds and smoothing/correction factor.
5. Make sure neurites are chosen as the feature type.
6. Adjust Typical diameter of objects until intact NFH is selected (IdentifyPrimaryObjects module).
7. Adjust Typical diameter of objects until degenerated NFH is selected (IdentifyPrimaryObjects module).
8. Run the analysis.
9. Once settings are optimized in Test Mode, select Exit Test Mode.
10. Select Analyze Images to execute the pipeline on the full dataset.
11. Upon completion, the data will be exported as .csv files (e.g., "Image.csv") in the designated output directory.
Notes:
1. For statistical analysis, the AreaOccupied and Count columns in the output spreadsheet should be used. To convert pixel area to μm2, multiply the pixel count by the pixel area value from the image metadata file. Objects that are not segmented properly can be identified by reviewing the output overlay images and should be excluded from downstream analysis.
2. For more detailed explanations on each module and function for both analyses, refer to the Github link (https://github.com/PerlsonLab/Bioprotocol) and CellProfiler Help.
Validation of protocol
This protocol has been used and validated in the following research article:
• Ionescu et al. [30]. Muscle-derived miR-126 regulates TDP-43 axonal local synthesis and NMJ integrity in ALS models. Nature Neuroscience 28, 2201–2216 (2025); Figure 7h–o; Extended Figure 10a–e. https://doi.org/10.1038/s41593-025-02062-6
General notes and troubleshooting
General notes
A. iPSC culture, differentiation, and immunofluorescence
1. Guidelines for iPSC colony maintenance
a. After thawing iPSCs, maintain the cells for at least two passages prior to each differentiation batch to ensure robust colony formation, high proliferative capacity, and minimal spontaneous differentiation.
b. Post-thaw recovery varies between iPSC lines and depends on cell health prior to freezing. For optimal recovery, freeze iPSC colonies during robust proliferation at approximately 70%–80% confluency.
c. Change the medium the day after cell passaging or thawing. Record and increase the passage number after each passage, cryopreservation, and thawing event.
d. Following thawing, iPSCs may require 1–2 days to recover from thawing and form colonies in 4–5 days. By the second passage, we typically observe well-defined and intact colonies that are suitable for colony expansion or differentiation.
e. If cultures are not scheduled for maintenance over the weekend, use double the routine volume of iPSC medium (4–5 mL of mTESR1 per well of a 6-well plate) at the last medium change before the weekend.
f. All media and reagents that come into contact with cells should either be filter-sterilized or handled under sterile conditions.
g. All discarded media and wash solutions should be considered potentially biohazardous and disposed of according to the waste disposal policy of the institute.
h. Avoid initiating differentiation from colonies that are partially differentiated or overly confluent, as these conditions frequently lead to inefficient differentiation and increased experimental variability.
i. For differentiation experiments, we recommend using iPSCs between passages 3 and 4 after thawing. Prolonged culture or repeated passaging may increase the risk of genomic instability or spontaneous mutations [30].
j. Cells received from other labs should be quarantined for at least two passages and tested for mycoplasma and other in-house quality control measures.
2. Microfluidic mold fabrication and PDMS casting
This protocol applies to MFCs placed on glass coverslips or 35 mm glass-bottom dishes. Proper preparation and coating of PDMS microfluidic chambers are critical for consistent axonal growth across microchannels. For additional troubleshooting related to chamber preparation and coating conditions, refer to the Troubleshooting section of [35].
3. Antibody validation
Validate each new lot of primary and secondary antibodies with a small-scale test before full use, as performance can vary between suppliers and batches.
4. Fixation and staining consistency
Maintain consistent fixation conditions (fixative concentration, incubation time, and temperature) across experiments, as variations can significantly influence NFH morphology and pTDP-43 signal detection.
5. Microfluidic culture handling
Media changes should be performed gently and gradually to avoid generating pressure differences between compartments, which may disrupt axons extending through the microchannels.
B. Image analysis
6. Applicability and adaptability of the pipeline
This pipeline is modular. The analysis steps can be directly applied to images acquired on different microscope systems, provided that input images are first processed into the required input format. Users should follow the initial steps of the pipeline and, once the threshold of the images is set, the subcellular segmentation component (TDP-43) of the workflow can be executed directly. More broadly, the preprocessing and training steps described here provide a general framework that can be implemented to build new segmentation and analysis pipelines for other structures/molecules across diverse cell types.
7. Sources of variability in segmentation
Variability in quantitative outcomes primarily arises from the selection of thresholding parameters used during object identification and segmentation. Minor differences in boundary definition, such as distinguishing intact from degenerated NFH-positive axons, can influence downstream measurements. To reduce this variability, threshold parameters should be established using representative images and applied consistently across the entire dataset.
8. Segmentation validation
Prior to full dataset analysis, segmentation outputs should be visually validated by overlaying NFH masks and detected objects onto the original images to confirm accurate identification of axonal structures and subcellular puncta.
9. User consistency
Initial annotations and parameter optimization should be performed by a single trained user, followed by the dissemination of standardized annotation guidelines to other users once consistency is established. Image quality represents an additional source of variability. Variations in signal-to-noise ratio, illumination uniformity, or focal stability across images may affect segmentation performance. Consistent imaging conditions across experiments are therefore strongly recommended to ensure robust and reproducible analysis.
10. Image quality control
Variations in signal-to-noise ratio, illumination uniformity, or focal stability across images may affect segmentation accuracy. Images with poor focus, excessive background fluorescence, or uneven illumination should be excluded prior to batch analysis.
C. Estimated time for the protocol
| Procedure | Estimated time |
|---|---|
| Preparation of microfluidic chambers and surface coating | 2–3 days |
| Differentiation of motor neurons from neuronal precursors | 3 days |
| Differentiation of myotubes from myogenic precursors | 3 days |
| Seeding of motor neurons and myotubes into compartmentalized microfluidic chambers | 1 day |
| Establishment and maintenance of neuromuscular co-culture | 4–6 weeks |
| Immunostaining and Image acquisition (confocal microscopy) | 4–5 days |
| Image preprocessing in Fiji/ImageJ | 1–2 h per dataset |
| Object identification and quantification in CellProfiler | 1–2 h per dataset |
| Data quality control and statistical analysis | 1–2 h per dataset |
Troubleshooting
A. Microfluidic co-culture
| Problem | Possible cause | Solution |
|---|---|---|
| Inconsistent cell seeding density across MFC replicates | Cell counting error; sedimentation of the cell suspension during serial loading of multiple devices; variable dead volumes in pipette tips | 1. Resuspend the cell pellet thoroughly and count in duplicates immediately before seeding; gently triturate the suspension between each device loading to prevent settling. 2. Use positive-displacement pipettes for viscous or low-volume suspensions; seed all replicate devices within a narrow time window (≤15–20 min). |
| Reduced survival of motor neurons or myotubes during long-term culture | Inadequate ECM coating, infrequent or irregular medium exchange schedule, or mechanical stress during handling, drying of the culture surface due to evaporation, nutrient depletion due to low media volumes relative to cell density, or insufficient substrate support during prolonged culture | 1. Perform gentle, partial (50%) medium exchanges, replacing approximately 50% of the medium every 48–72 h. 2. Supplement media with appropriate growth factors at each exchange; minimize turbulence by pipetting slowly against the reservoir wall 3. Ensure appropriate substrate coating: PLO/laminin coating for motor neurons and ECM coating for myotubes. 4. For long-term myotube cultures, supplement with laminin during each medium change to support prolonged attachment and culture stability. |
| High batch-to-batch variability in differentiation efficiency | Inconsistent starting iPSC quality (e.g., higher passage number, residual spontaneous differentiation, variable confluency at passaging) | 1. Use iPSC stocks of earlier passage numbers if available; passage colonies before they exceed ~80% confluency. 2. Keep differentiation timings and reagent lot consistent across batches. |
| Mycoplasma contamination altering cell behavior or differentiation | Introduction of mycoplasma through contaminated reagents, shared media, or handling in a multi-user facility; mycoplasma is not visible by light microscopy and may go undetected | 1. Test all cell lines for mycoplasma by PCR-based or colorimetry at least every 3–4 weeks and before any experiment. 2. Quarantine new cell lines until cleared; if myco-positive, discard and thaw a clean vial for the recommended course before re-testing. |
| Cell clumping near wells obstructing efficient media flow in channels | Incomplete enzymatic dissociation before seeding; cell suspension density too high at the loading step | 1. Ensure a single-cell suspension before seeding and optimize seeding density per compartment to avoid overcrowding. 2. Coat the channel region with an appropriate ECM/laminin concentration, allowing efficient cellular spreading and attachment. |
| Loss of fluidic isolation between compartments | Incomplete bonding of the PDMS device to the glass substrate | 1. Ensure the MFC and dish bottom are clean and apply gentle pressure before and after oven incubation. 2. Alternatively, plasma-treat both the PDMS and glass surfaces immediately before bonding. |
| Poor axonal extension into the distal compartment | Suboptimal PLO/laminin coating, immature or stressed motor neurons, weak myotube maturation in the distal compartment, or disruption of compartment-specific culture conditions | 1. Optimize PLO/laminin coating, seed neurons after sufficient maturation (3 days). 2. Ensure healthy myotube maturation in the distal compartment; muscle-derived cues are expected to support axonal growth toward the myotubes. 3. Avoid disrupting the compartmentalized media conditions during media changes. |
| Complete failure of axonal extension | Incomplete PLO/laminin coating inside the microgrooves, air bubbles or blocked grooves, unhealthy motor neurons at seeding, or major disruption of compartment-specific media conditions | 1. Ensure complete microgroove coating; inspect chambers for bubbles or blockage before seeding. 2. Seed only healthy, sufficiently mature motor neurons; maintain stable media levels and avoid disturbing the compartments. |
| Excessive evaporation from low-volume reservoirs causing osmolality shifts | Small media volumes (≤50 μL per well) exposed to incubator atmosphere with imperfect humidification; frequent incubator door openings | Maintain volumes ≥80 μL per well; place a sterile water-filled dish adjacent to devices inside the incubator to maintain local humidity |
B. Image analysis pipeline (Fiji/CellProfiler)
| Problem | Possible cause | Solution |
|---|---|---|
| NFH segmentation masks appear fragmented or incomplete | Thresholding algorithm or threshold value poorly suited to local signal intensity; weak or non-uniform neurofilament heavy chain (NFH) fluorescence across the field of view | 1. Empirically determine the optimal thresholding method (e.g., Otsu, Triangle, or adaptive/local) using a representative subset of images. 2. Ensure adequate NFH signal by optimizing antibody concentration, exposure time, and illumination uniformity during acquisition. |
| Excessive background objects falsely detected as pTDP-43 puncta | High nonspecific fluorescence or tissue autofluorescence in the detection channel; object size and intensity filters set too permissively during segmentation | Tighten object diameter and mean intensity thresholds based on validated positive-control images |
| pTDP-43 objects detected outside axonal regions | Puncta segmentation performed on the entire field of view without restricting detection to axon-containing areas | 1. Use NFH-positive masks as parent objects and restrict pTDP-43 puncta detection to within these masks using CellProfiler’s RelateObjects or MaskObjects modules. 2. Verify spatial restriction by overlaying detected puncta on the NFH mask in a visual QC step. |
| Over-segmentation: single puncta or cells split into multiple objects | Intensity-based segmentation overly aggressive for closely spaced or irregularly shaped objects; local intensity changes within a single structure misinterpreted as object boundaries | 1. Smooth the input image with a Gaussian filter before segmentation to fill minor intensity gaps. 2. Adjust the declump method in CellProfiler’s IdentifyPrimaryObjects (e.g., switch from “Intensity” to “Shape” declumping, or increase the smoothing filter size for declumping). 3. Merge objects below a minimum area threshold using FilterObjects. |
| Under-segmentation: adjacent puncta or clustered objects merged into a single object | Insufficient resolution to resolve closely spaced structures; thresholding captures a contiguous bright region without splitting it; declumping disabled or under-parameterized | 1. Increase spatial resolution at acquisition (higher magnification objective, Nyquist-compliant pixel size). 2. Enhance punctate signals before thresholding and validate segmentation against manual counts on a subset of images. |
| Segmentation results vary across datasets acquired on different days, instruments, or users | Threshold parameters manually readjusted between experiments; variable illumination intensity, detector gain, or camera offset settings across acquisitions | 1. Define all segmentation parameters on a representative calibration image set and lock them for the entire analysis. 2. Standardize microscope acquisition settings (laser power, exposure, gain, binning) across all imaging sessions. |
| Photobleaching during acquisition causes progressive signal loss across images | Prolonged or repeated excitation of fluorophores during multi-tile or sequential z-stack acquisition; high laser power or long exposure times | 1. Minimize total light exposure by reducing laser power and increasing detector gain (while monitoring noise). 2. Reorder channel acquisition so that the most photosensitive fluorophore is imaged first. 3. Use anti-fade mounting media. |
| Batch effects in fluorescence intensity between staining or imaging sessions confound quantitative comparisons | Day-to-day variability in antibody incubation conditions, staining reagent age, or laser power drift; different cover glass thickness or mounting medium batches | 1. Include an internal reference sample (e.g., a control-condition slide from a single batch) in every staining and imaging session to enable inter-session normalization. 2. Process all experimental conditions in parallel within the same staining run wherever possible. |
| Morphological measurements (e.g., puncta area, axonal width) inaccurate due to incorrect pixel-size calibration | Metadata pixel size does not match the actual acquisition (e.g., after cropping, binning change, or export from a different software); calibration bar not verified for the objective used | 1. Verify pixel dimensions at the start of each experiment for every objective/ROI in use. 2. If metadata is absent, find appropriate μm per pixel of your images, manually enter them in Fiji, and perform the remaining image analysis steps. |
Acknowledgments
The authors would like to acknowledge Daniel Hagendorf, a member of our laboratory, for initial assistance in developing Fiji macros codes for the bulk conversion of image files for downstream analysis. The authors would like to thank Israel Science Foundation (ISF), Sieratzki Fellowship, Drimmer Fischler Family Scholarship, Muscular Dystrophy Association (MDA), Target ALS, Sagol Center for Regenerative Medicine, Ministry of Science, Israel. This protocol was described and validated in the following research article: Ionescu et al. [30]. Protocols involved for mold fabrication [34] and PDMS device preparation for cell culture have been adapted from Ionescu et al. [28] and Altman et al. [33].
Author contributions
Author conceptualization: Conceptualization: A.G.S. and E.P.; Investigation and data analysis: A.G.S. and L.K.A.G.; Writing—Original Draft: A.G.S.; Writing—Review & Editing: A.G.S., L.K.A.G., T.P., and E.P.
Competing interests
The authors declare that they have no competing interests.
References
- Chen, H., Qian, K., Du, Z., Cao, J., Petersen, A., Liu, H., Blackbourn, L. W., Huang, C. L., Errigo, A., Yin, Y., et al. (2014). Modeling ALS with iPSCs Reveals that Mutant SOD1 Misregulates Neurofilament Balance in Motor Neurons. Cell Stem Cell. 14(6): 796–809. https://doi.org/10.1016/j.stem.2014.02.004
- Dadon-Nachum, M., Melamed, E. and Offen, D. (2010). The “Dying-Back” Phenomenon of Motor Neurons in ALS. J Mol Neurosci. 43(3): 470–477. https://doi.org/10.1007/s12031-010-9467-1
- Fischer, L. R., Culver, D. G., Tennant, P., Davis, A. A., Wang, M., Castellano-Sanchez, A., Khan, J., Polak, M. A. and Glass, J. D. (2004). Amyotrophic lateral sclerosis is a distal axonopathy: evidence in mice and man. Exp Neurol. 185(2): 232–240. https://doi.org/10.1016/j.expneurol.2003.10.004
- Moloney, E. B., de Winter, F. and Verhaagen, J. (2014). ALS as a distal axonopathy: molecular mechanisms affecting neuromuscular junction stability in the presymptomatic stages of the disease. Front Neurosci. 8: e00252. https://doi.org/10.3389/fnins.2014.00252
- Piotrkiewicz, M. and Hausmanowa-Petrusewicz, I. (2013). Amyotrophic lateral sclerosis: a dying motor unit?. Front Aging Neurosci. 5: e00007. https://doi.org/10.3389/fnagi.2013.00007
- Sun, X., Song, J., Huang, H., Chen, H. and Qian, K. (2018). Modeling hallmark pathology using motor neurons derived from the family and sporadic amyotrophic lateral sclerosis patient-specific iPS cells. Stem Cell Research & Therapy 9(1): 315. https://doi.org/10.1186/s13287-018-1048-1
- Altman, T., Ionescu, A., Ibraheem, A., Priesmann, D., Gradus-Pery, T., Farberov, L., Alexandra, G., Shelestovich, N., Dafinca, R., Shomron, N., et al. (2021). Axonal TDP-43 condensates drive neuromuscular junction disruption through inhibition of local synthesis of nuclear encoded mitochondrial proteins. Nat Commun. 12(1): e1038/s41467–021–27221–8. https://doi.org/10.1038/s41467-021-27221-8
- Hergesheimer, R. C., Chami, A. A., de Assis, D. R., Vourc’h, P., Andres, C. R., Corcia, P., Lanznaster, D. and Blasco, H. (2019). The debated toxic role of aggregated TDP-43 in amyotrophic lateral sclerosis: a resolution in sight?. Brain 142(5): 1176–1194. https://doi.org/10.1093/brain/awz078
- Kurashige, T., Morino, H., Murao, T., Izumi, Y., Sugiura, T., Kuraoka, K., Kawakami, H., Torii, T. and Maruyama, H. (2022). TDP-43 Accumulation Within Intramuscular Nerve Bundles of Patients With Amyotrophic Lateral Sclerosis. JAMA Neurol. 79(7): 693. https://doi.org/10.1001/jamaneurol.2022.1113
- Riva, N., Gentile, F., Cerri, F., Gallia, F., Podini, P., Dina, G., Falzone, Y. M., Fazio, R., Lunetta, C., Calvo, A., et al. (2022). Phosphorylated TDP-43 aggregates in peripheral motor nerves of patients with amyotrophic lateral sclerosis. Brain 145(1): 276–284. https://doi.org/10.1093/brain/awab285
- Ionescu, A., Altman, T. and Perlson, E. (2023). Looking for answers far away from the soma—the (un)known axonal functions of TDP-43, and their contribution to early NMJ disruption in ALS. Mol Neurodegener. 18(1): 35. https://doi.org/10.1186/s13024-023-00623-6
- Tai, H. C., Serrano-Pozo, A., Hashimoto, T., Frosch, M. P., Spires-Jones, T. L. and Hyman, B. T. (2012). The Synaptic Accumulation of Hyperphosphorylated Tau Oligomers in Alzheimer Disease Is Associated With Dysfunction of the Ubiquitin-Proteasome System. Am J Pathol. 181(4): 1426–1435. https://doi.org/10.1016/j.ajpath.2012.06.033
- Zhou, L., McInnes, J., Wierda, K., Holt, M., Herrmann, A. G., Jackson, R. J., Wang, Y. C., Swerts, J., Beyens, J., Miskiewicz, K., et al. (2017). Tau association with synaptic vesicles causes presynaptic dysfunction. Nat Commun. 8(1): e1038/ncomms15295. https://doi.org/10.1038/ncomms15295
- Ulusoy, A., Rusconi, R., Pérez‐Revuelta, B. I., Musgrove, R. E., Helwig, M., Winzen‐Reichert, B. and Monte, D. A. D. (2013). Caudo‐rostral brain spreading of α‐synuclein through vagal connections. EMBO Mol Med. 5(7): 1051–1059. https://doi.org/10.1002/emmm.201302475
- Yang, Q., Wang, Y., Zhao, C., Pang, S., Lu, J. and Chan, P. (2022). α‐Synuclein aggregation causes muscle atrophy through neuromuscular junction degeneration. J Cachexia Sarcopenia Muscle. 14(1): 226–242. https://doi.org/10.1002/jcsm.13123
- Bye, C. R., Qian, E., Lim, K., Daniszewski, M., Garton, F. C., Trần-Lê, B. C., Liang, H. H., Lin, T., Lock, J. G., Crombie, D. E., et al. (2025). Large-scale drug screening in iPSC-derived motor neurons from sporadic ALS patients identifies a potential combinatorial therapy. Nat Neurosci. 29(1): 40–52. https://doi.org/10.1038/s41593-025-02118-7
- Didonna, A. and Opal, P. (2019). The role of neurofilament aggregation in neurodegeneration: lessons from rare inherited neurological disorders. Mol Neurodegener. 14(1): e1186/s13024–019–0318–4. https://doi.org/10.1186/s13024-019-0318-4
- Liu, Q. (2011). Neurofilamentopathy in Neurodegenerative Diseases. Open Neurol J. 5(1): 58–62. https://doi.org/10.2174/1874205x01105010058
- Zucchi, E., Bonetto, V., Sorarù, G., Martinelli, I., Parchi, P., Liguori, R. and Mandrioli, J. (2020). Neurofilaments in motor neuron disorders: towards promising diagnostic and prognostic biomarkers. Mol Neurodegener. 15(1): 58. https://doi.org/10.1186/s13024-020-00406-3
- Afshar Bakooshli, M., Lippmann, E. S., Mulcahy, B., Iyer, N., Nguyen, C. T., Tung, K., Stewart, B. A., van den Dorpel, H., Fuehrmann, T., Shoichet, M., et al. (2019). A 3D culture model of innervated human skeletal muscle enables studies of the adult neuromuscular junction. eLife. 8: e44530. https://doi.org/10.7554/elife.44530
- Osaki, T., Uzel, S. G. M. and Kamm, R. D. (2018). Microphysiological 3D model of amyotrophic lateral sclerosis (ALS) from human iPS-derived muscle cells and optogenetic motor neurons. Sci Adv. 4(10): eaat5847. https://doi.org/10.1126/sciadv.aat5847
- Osaki, T., Uzel, S. G. M. and Kamm, R. D. (2020). On-chip 3D neuromuscular model for drug screening and precision medicine in neuromuscular disease. Nat Protoc. 15(2): 421–449. https://doi.org/10.1038/s41596-019-0248-1
- Uzel, S. G. M., Platt, R. J., Subramanian, V., Pearl, T. M., Rowlands, C. J., Chan, V., Boyer, L. A., So, P. T. C. and Kamm, R. D. (2016). Microfluidic device for the formation of optically excitable, three-dimensional, compartmentalized motor units. Sci Adv. 2(8): e1501429. https://doi.org/10.1126/sciadv.1501429
- Menduti, G. and Boido, M. (2023). Recent Advances in High-Content Imaging and Analysis in iPSC-Based Modelling of Neurodegenerative Diseases. Int J Mol Sci. 24(19): 14689. https://doi.org/10.3390/ijms241914689
- Wu, C., Schulte, J., Sepp, K. J., Littleton, J. T. and Hong, P. (2010). Automatic Robust Neurite Detection and Morphological Analysis of Neuronal Cell Cultures in High-content Screening. Neuroinformatics. 8(2): 83–100. https://doi.org/10.1007/s12021-010-9067-9
- Yoshioka, K., Ito, A., Kawabe, Y. and Kamihira, M. (2020). Novel neuromuscular junction model in 2D and 3D myotubes co-cultured with induced pluripotent stem cell-derived motor neurons. J Biosci Bioeng. 129(4): 486–493. https://doi.org/10.1016/j.jbiosc.2019.10.004
- Stoklund Dittlau, K., Krasnow, E. N., Fumagalli, L., Vandoorne, T., Baatsen, P., Kerstens, A., Giacomazzi, G., Pavie, B., Rossaert, E., Beckers, J., et al. (2021). Generation of Human Motor Units with Functional Neuromuscular Junctions in Microfluidic Devices. J Visualized Exp. 175: e3791/62959. https://doi.org/10.3791/62959
- Ionescu, A., Zahavi, E. E., Gradus, T., Ben-Yaakov, K. and Perlson, E. (2016). Compartmental microfluidic system for studying muscle–neuron communication and neuromuscular junction maintenance. Eur J Cell Biol. 95(2): 69–88. https://doi.org/10.1016/j.ejcb.2015.11.004
- Zahavi, E. E., Ionescu, A., Gluska, S., Gradus, T., Ben-Yaakov, K. and Perlson, E. (2015). Spatial aspects of GDNF functions revealed in a compartmentalized microfluidic neuromuscular co-culture system. J Cell Sci. : e167544. https://doi.org/10.1242/jcs.167544
- Ionescu, A., Ankol, L., Ganapathy Subramaniam, A., Altman, T., Magen, I., Cohen, Y., Danino, Y., Gradus-Pery, T., Niv, Y., Bar Avi, O., et al. (2025). Muscle-derived miR-126 regulates TDP-43 axonal local synthesis and NMJ integrity in ALS models. Nat Neurosci. 28(11): 2201–2216. https://doi.org/10.1038/s41593-025-02062-6
- Schindelin, J., Arganda-Carreras, I., Frise, E., Kaynig, V., Longair, M., Pietzsch, T., Preibisch, S., Rueden, C., Saalfeld, S., Schmid, B., et al. (2012). Fiji: an open-source platform for biological-image analysis. Nat Methods. 9(7): 676–682. https://doi.org/10.1038/nmeth.2019
- Stirling, D. R., Swain-Bowden, M. J., Lucas, A. M., Carpenter, A. E., Cimini, B. A. and Goodman, A. (2021). CellProfiler 4: improvements in speed, utility and usability. BMC Bioinf. 22(1): e1186/s12859–021–04344–9. https://doi.org/10.1186/s12859-021-04344-9
- Altman, T., Maimon, R., Ionescu, A., Pery, T. G. and Perlson, E. (2020). Axonal Transport of Organelles in Motor Neuron Cultures using Microfluidic Chambers System. J Visualized Exp. 159: e3791/60993. https://doi.org/10.3791/60993
- Gluska, S., Chein, M., Rotem, N., Ionescu, A. and Perlson, E. (2016). Tracking Quantum-Dot labeled neurotropic factors transport along primary neuronal axons in compartmental microfluidic chambers. Methods Cell Biol. 131: 365–387. https://doi.org/10.1016/bs.mcb.2015.06.016
- Fernandopulle, M. S., Prestil, R., Grunseich, C., Wang, C., Gan, L. and Ward, M. E. (2018). Transcription Factor–Mediated Differentiation of Human iPSCs into Neurons. Curr Protoc Cell Biol. 79(1): e51. https://doi.org/10.1002/cpcb.51
Article Information
Publication history
Received: Mar 22, 2026
Accepted: Jul 22, 2026
Available online: Aug 6, 2026
Published: Sep 5, 2026
Copyright
© 2026 The Author(s); This is an open access article under the CC BY-NC license (https://creativecommons.org/licenses/by-nc/4.0/).
How to cite
Subramaniam, A. G., de Andrade Gensas, L. K., Gradus-Pery, T. and Perlson, E. (2026). Quantitative Analysis of Axonal Degeneration and TDP-43 Aggregation in Compartmentalized Human iPSC-Derived Motor Neuron–Myotube Co-cultures. Bio-protocol 16(17): e5801. DOI: 10.21769/BioProtoc.5801.

 Download Citation in RIS Format
Category
Neuroscience > Nervous system disorders > Neurodegeneration
Cell Biology > Cell isolation and culture > Microfluidic culture
Stem Cell > Pluripotent stem cell > Cell-based analysis
Do you have any questions about this protocol?
Post your question to gather feedback from the community. We will also invite the authors of this article to respond.
 Post a Question


