


- Protocols

- Articles and Issues
- For Authors
- About
- Become a Reviewer


A Simple and Reproducible ImageJ Workflow for Measuring Areas of Irregularly Shaped Necrotic Lesions on Plant Leaves

Published: Vol 16, Iss 16, Aug 20, 2026 DOI: 10.21769/BioProtoc.5788 Views: 342
Reviewed by: Shweta PanchalPawan KumarAnonymous reviewer(s)
 PDF
PDF  Ask a question
Advertisement


Protocol Collections
Comprehensive collections of detailed, peer-reviewed protocols focusing on specific topics




Related protocols
Abstract
Accurately quantifying the areas of necrotic lesions on plant leaves is essential for evaluating plant–pathogen interactions and disease resistance. Although digital image analysis methods using ImageJ are widely employed, they often require case-specific optimization and may not be readily applicable across different experimental conditions. Furthermore, many studies have used ImageJ for lesion measurement without providing methodological details, which limits reproducibility. Here, we present a simple, step-by-step ImageJ workflow for measuring irregular necrotic lesions using a standard personal computer and mouse. The procedure relies on manual lesion selection using the freehand selection tool, followed by Gaussian smoothing, binarization, and automated particle analysis to extract lesion area measurements. By balancing manual isolation with computational thresholding, this protocol eliminates the need for extensive parameter tuning. This approach provides an accessible, reliable alternative to time-consuming color thresholding methods, thereby improving transparency and reproducibility in lesion quantification. The workflow's reproducibility has been confirmed through both intra-user and inter-user analyses.
Key features
• Relies on simple manual freehand selection combined with minimal image processing, requiring only a standard computer and mouse without specialized software or advanced training.
• Enables accurate quantification of irregular necrotic lesions in conditions where automated thresholding methods require time-consuming optimization.
• Provides a fully detailed, reproducible ImageJ workflow addressing common gaps in published methods, facilitating direct implementation.
• Demonstrates high reproducibility, validated by intra-user and inter-user statistical analyses, ensuring reliable lesion quantification regardless of the operator.
Keywords: ImageJ/Fiji Necrotic lesion quantification
Lesion area measurement
Leaf disease analysis
Plant phenotyping
Plant pathology
Necrotic lesion quantification
Lesion area measurement
Leaf disease analysis
Plant phenotyping
Plant pathology
Background
Quantification of lesion area is widely used in plant pathology to assess disease severity, compare pathogen virulence, and evaluate host resistance in plant–pathogen interaction studies [1]. Necrotic lesions on leaves are common readouts in experimental systems involving viral, bacterial, and fungal pathogens, making accurate and reproducible lesion measurement important for comparative analyses across genotypes, treatments, and time points [2].
Several approaches have been used to quantify lesion areas, including visual scoring, manual tracing, and, more recently, digital image analysis, which has become the conventional method [3]. Among digital tools, ImageJ has become widely adopted because it is easy to use, freely available, and frequently used for color-based segmentation approaches such as global thresholding [4]. However, color-based threshold methods can perform poorly when lesions are heterogeneous in color, have diffuse or irregular borders, or are captured under non-uniform lighting conditions. Under such conditions, lesions may be incompletely detected, adjacent lesions may be merged, or healthy tissues with similar color may be misclassified as diseased areas. While advanced machine learning and automated segmentation tools offer powerful alternatives to thresholding [5], they frequently require specialized computational expertise, extensive training datasets, or high-end hardware. Furthermore, studies reporting ImageJ-based lesion quantification often describe the software without specifying workflows or parameters, hampering reproduction by readers.
The protocol described here addresses these gaps by providing a highly controlled and standardized manual ImageJ workflow for quantifying irregular necrotic lesions on plant leaves. It requires no specialized equipment beyond standard image acquisition and freely available software and is well-suited for experiments involving individual lesions or a moderate number of lesions per sample. Compared with automated color thresholding–based methods, this approach offers controlled precision in lesion boundary selection, particularly when lesion shape, color, or contrast complicates segmentation. Although the workflow becomes labor-intensive when lesions are extremely numerous, it remains well-suited to datasets with several tens of lesions per leaf. This manual ImageJ-based approach can be adapted to quantify other visible, localized plant symptoms on the leaves of different plant species. For example, the workflow can measure symptoms caused by diverse pathogens that induce localized tissue damage, necrosis, or pathogen-associated mycelial growth. It is also applicable to distinct discolorations on leaves of varying colors (such as chlorotic spots), as well as physical deformations like hypertrophic regions or insect herbivory (chewing damage). However, the suitability of this approach depends on how clearly symptom boundaries can be defined.
Materials and reagents
Biological materials
1. Nicotiana tabacum plants harboring the N′ resistance gene [6]
2. Tomato mosaic virus (ToMV).
Note: Necrotic lesions were generated by mechanical inoculation using carborundum as an abrasive and applying 20 μL of ToMV solution at 1 μg/mL on the fourth true leaves of Nicotiana tabacum. Plants were maintained at 25 °C under a 16 h light/8 h dark photoperiod with a light intensity of 60–100 μmol/m2/s. Leaves were scanned at 7 days post-inoculation, when necrotic lesions were clearly visible.
Equipment
1. CCD-type flatbed scanner (e.g., Epson, model: GT-X820)
2. Standard metric ruler
3. Computer systems: User A, CPU: Intel® CoreTM i7-8650U @ 1.90 GHz; RAM: 16 GB; GPU: Intel® UHD Graphics 620; OS: Windows 11 Pro (64-bit); monitor: Acer KA242Y, 23.8-inch (connected via HDMI); and User B, CPU: Intel® CoreTM i7-11800H @ 2.30 GHz; RAM: 16 GB; GPU: NVIDIA® GeForce RTX 3050 Laptop GPU (4 GB); OS: Windows 11 Pro (64-bit); monitor: Philips 234E SoftBlue, 23-inch (connected via HDMI).
Note: Use of a large display screen is recommended to facilitate accurate visualization and manual tracing of lesion boundaries. Zooming in during selection improves precision, particularly for irregular lesion edges.
4. Standard computer mouse (highly recommended over a laptop trackpad for accurate freehand selection).
Note: Use of a mouse pad is recommended to improve cursor stability during manual lesion tracing.
Software and datasets
1. ImageJ or Fiji, a package of ImageJ; Available for free download at https://imagej.net/ij/ or https://imagej.net/software/fiji/ (v1.54s)
Procedure
The workflow is summarized in Figure 1, and the complete workflow is demonstrated in the supplementary video (Video S1).
A. Image acquisition
1. Place the leaves flat on the scanner surface on a uniform, non-reflective black background, ensuring that they do not overlap. Include a ruler in the field of view for scale calibration.
2. Scan the samples at 1,200 dpi.
Note: Higher-resolution settings are recommended, as they result in more defined lesion boundaries.
3. Save the images in a high-quality format (JPEG or TIFF).
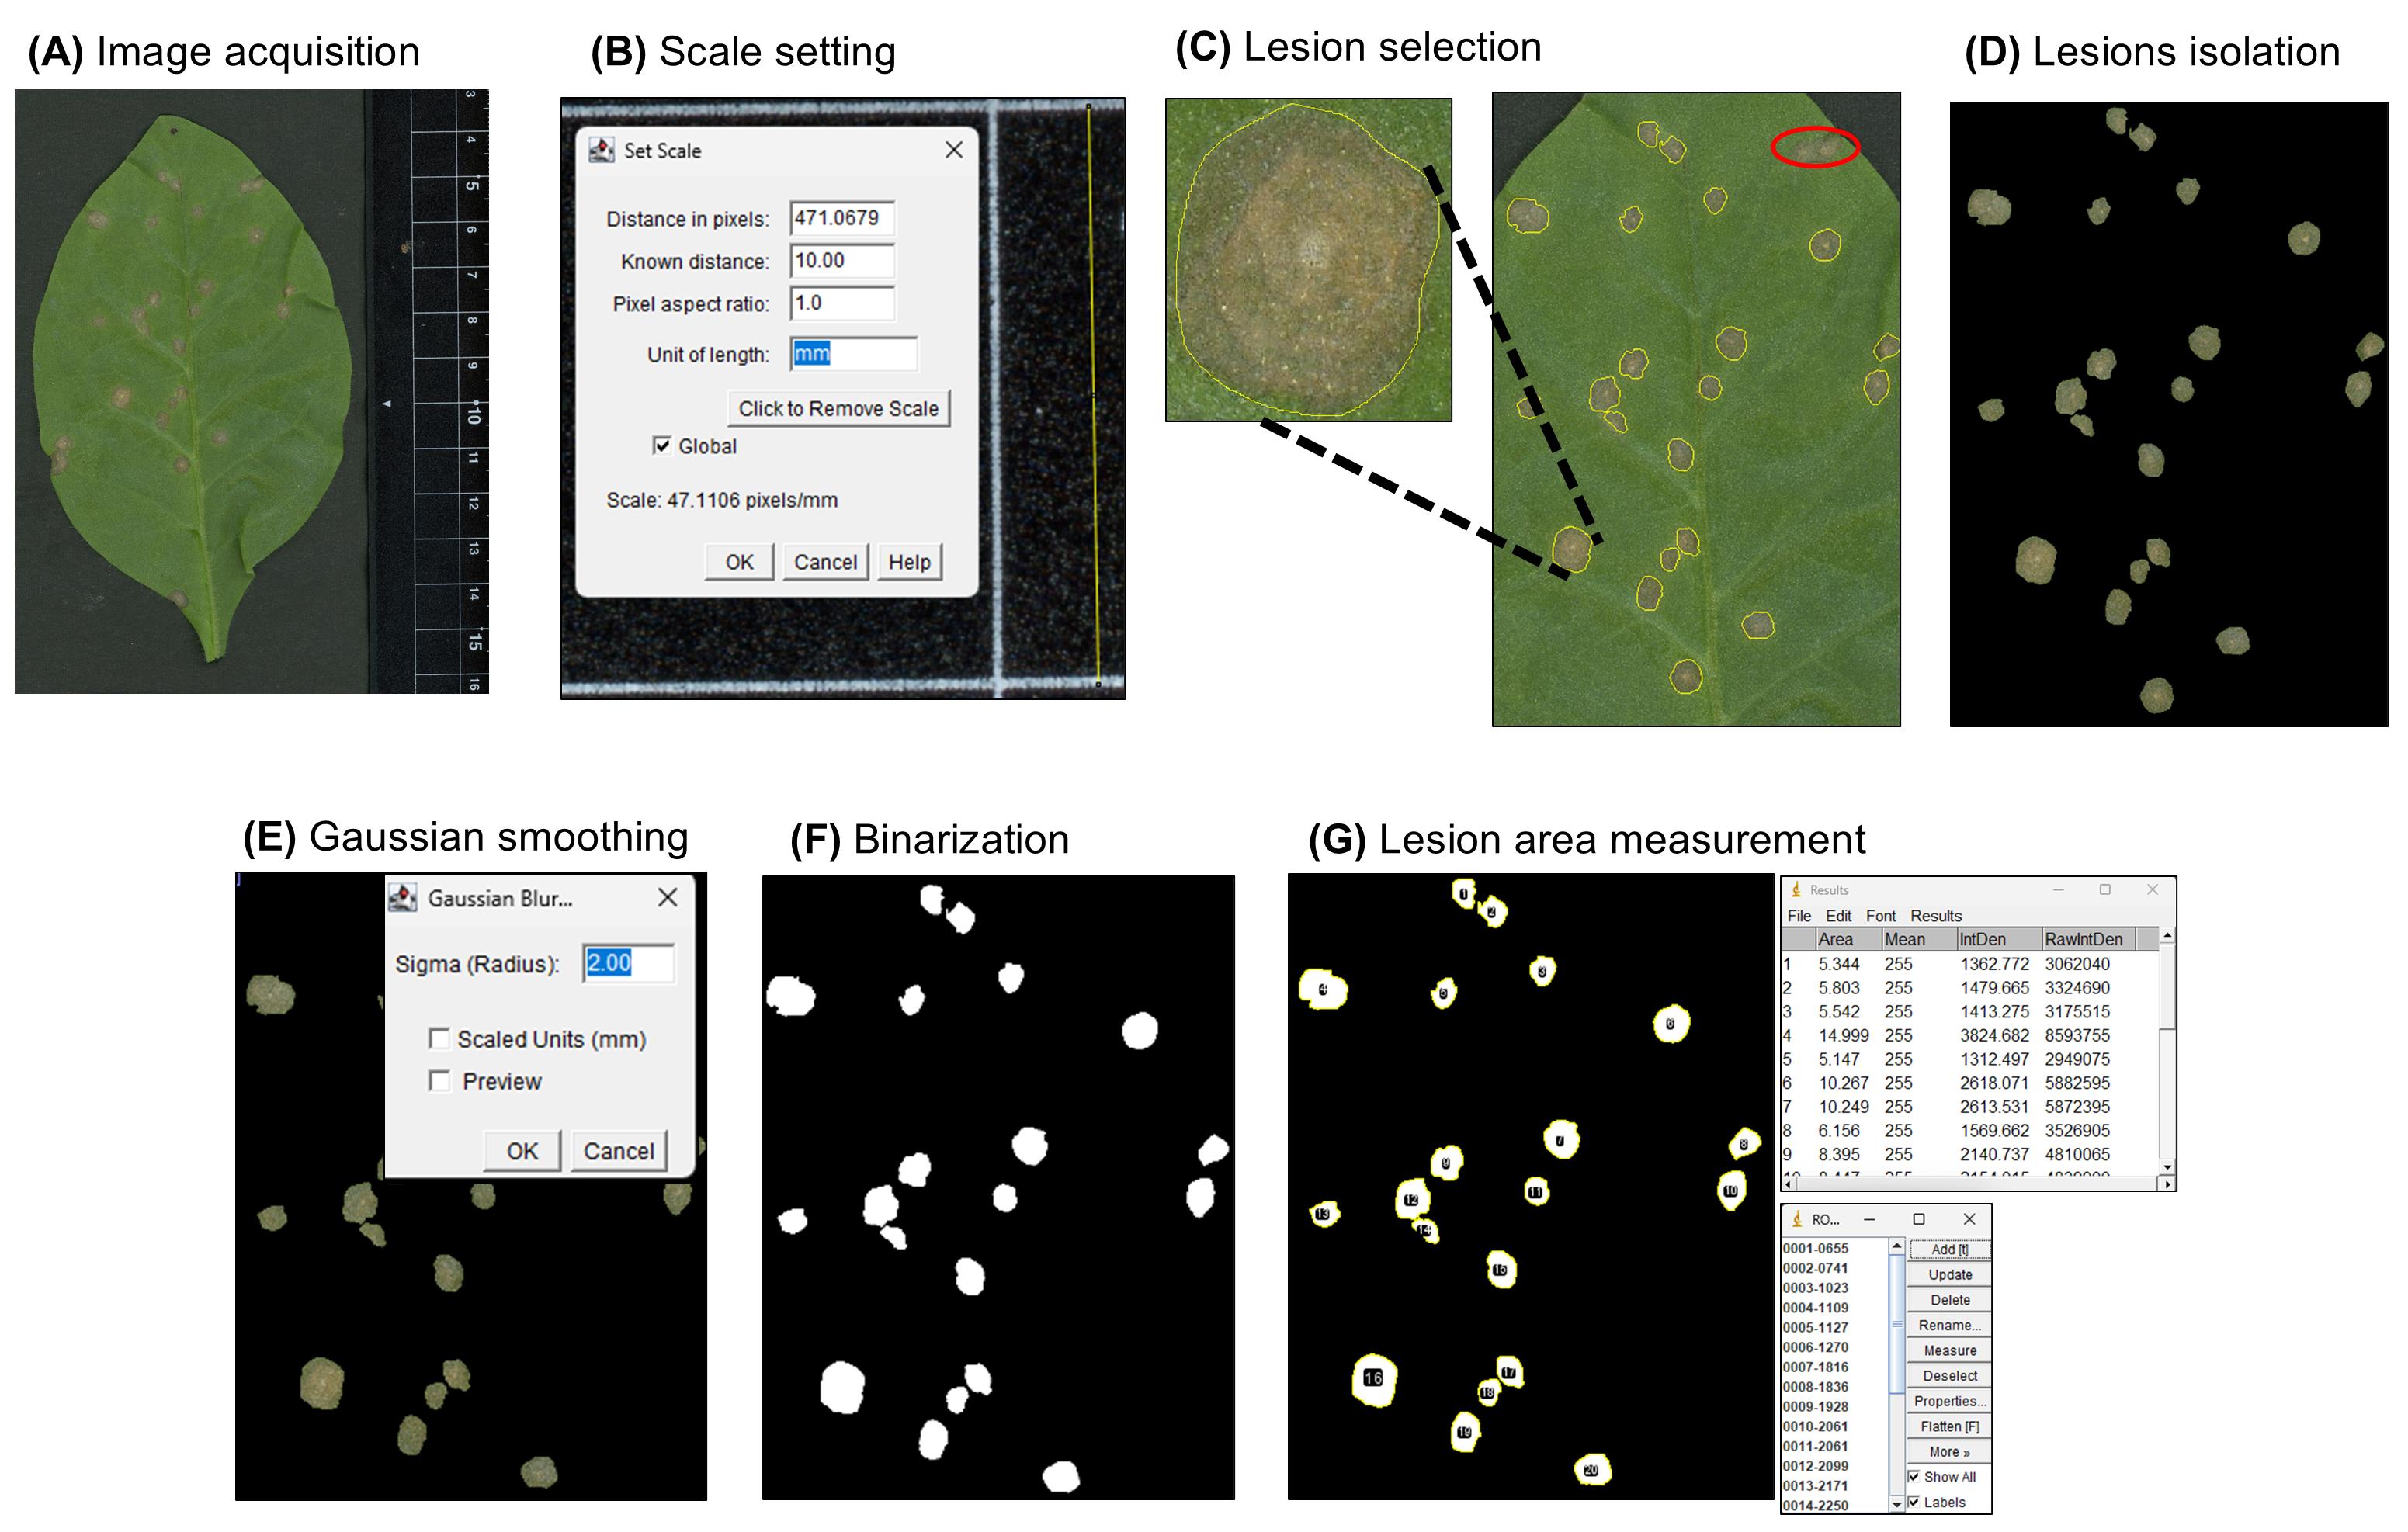
Figure 1. Workflow for quantification of necrotic lesion area using ImageJ. (A) Image acquisition. Representative Nicotiana tabacum leaf showing necrotic lesions harvested at 7 days post-inoculation following tomato mosaic virus (ToMV) inoculation is used for this protocol. A ruler is included for scale calibration. (B) Scale setting. The Set Scale function in ImageJ is used to calibrate the pixel-to-millimeter ratio based on a known distance measured on the scanned ruler. (C) Lesion selection. Individual lesions are manually delineated using the Freehand Selection tool. Fused lesions, indicated by a red circle, are excluded from analysis. The inset shows a magnified view of a representative lesion selection. (D) Isolation of selected lesions. Selected lesion areas are retained while the surrounding regions are removed. (E) Image smoothing. A Gaussian blur filter (Sigma = 2) is applied to reduce edge irregularities and improve boundary definition. (F) Binarization. The processed image is converted to a binary format, where lesions appear as white objects on a black background. (G) Lesion analysis and measurement. Lesion areas are automatically quantified, and each lesion is recorded as an individual region of interest (ROI) in the ROI Manager, with corresponding area values displayed in the results table.
B. Scale setting
1. Open ImageJ.
2. Open the scanned leaf image in ImageJ (File > Open) or drag and drop the image into the ImageJ window.
3. Select the Straight tool.
4. Draw a line corresponding to a known distance (e.g., 1 cm) on the ruler included in the image.
5. Click Analyze > Set Scale.
6. Enter 10 in the Known distance field and set the unit to mm.
7. (Optional) Select Global to apply the same scale to multiple images only when all images were acquired under identical conditions, including the same magnification, resolution, and scanner/camera settings; differences in acquisition parameters may lead to incorrect scaling and reduced measurement accuracy.
8. Click OK.
C. Lesion selection
1. Select the Rectangle selection tool.
2. Draw a selection around the region containing the lesions designated for analysis.
3. Duplicate the selected region (Image > Duplicate) to create a separate image containing only the selected area.
4. Select the Freehand selection tool.
5. Carefully trace each lesion manually. Zoom in or out as needed to improve tracing accuracy.
Note: You can easily zoom in or out during this process by holding the Ctrl key and using the mouse scroll wheel.
6. Hold the Shift key to select multiple lesions simultaneously.
D. Lesion isolation
1. After selecting desired lesions, click Edit > Clear Outside.
2. Confirm that only the selected lesion regions remain visible.
3. Before proceeding to image processing, click outside the selection area to deselect all active selections (see Troubleshooting).
Note: Alternatively, individual lesions can be manually traced and added to the ROI Manager by pressing “T” after each selection. The ROI Manager window will display the stored lesions. By selecting a lesion (ROI) from the list and clicking Measure, the Results window will appear, displaying the lesion area. This approach is suitable for a small number of lesions.
E. Image smoothing
1. Click Process > Filters > Gaussian Blur.
2. Set Sigma = 2 and click OK.
Note: Gaussian smoothing is applied to reduce small image noise and minor pixel-level irregularities that may make lesion edges appear fragmented. If lesion edges appear fragmented, increase the Sigma value slightly. Sigma values up to 3 can be used without affecting lesion area measurements (see Troubleshooting). The same Sigma value should be applied consistently across all images within the analysis.
F. Binarization
1. Click Process > Binary > Make Binary.
2. Confirm that lesion areas appear as white objects against a dark background.
Note: Binarization is used to visualize and distinguish the selected lesion regions from surrounding leaf tissue or background.
G. Lesion area measurement
1. Click Analyze > Analyze Particles.
2. In the dialog window, set the following parameters:
a. Size (mm2): 0–Infinity
b. Circularity: 0.00–1.00
c. Show: Nothing
d. Enable Display Results
e. Enable Exclude on Edges
f. Enable Include Holes
g. Enable Add to Manager
3. Click OK.
4. Confirm that lesions are automatically detected and listed in the Results table.
5. Each row corresponds to an individual lesion.
6. Verify that each detected lesion appears in the ROI Manager for inspection.
7. Export the Results table and copy the Area values into spreadsheet software for further analysis.
Note: Inspect ROI selections to ensure that all lesions are correctly detected.
Validation of protocol
A. Intra-user repeatability
Lesion area values obtained from ImageJ were exported and analyzed using spreadsheet software and GraphPad Prism. The raw data used for analysis are provided in Dataset S1. To evaluate measurement repeatability, lesion areas from the same sample were quantified across three independent repetitions, and the measurement variability was visualized using a box plot (Figure 2A). Intra-user variability was assessed by calculating the coefficient of variation (CV) for repeated measurements of the same lesions (Figure 2B). Measurement consistency was further evaluated by performing linear regression of repeated measurements, and the coefficient of determination (R2) was calculated to assess the strength of agreement (Figure 2C).
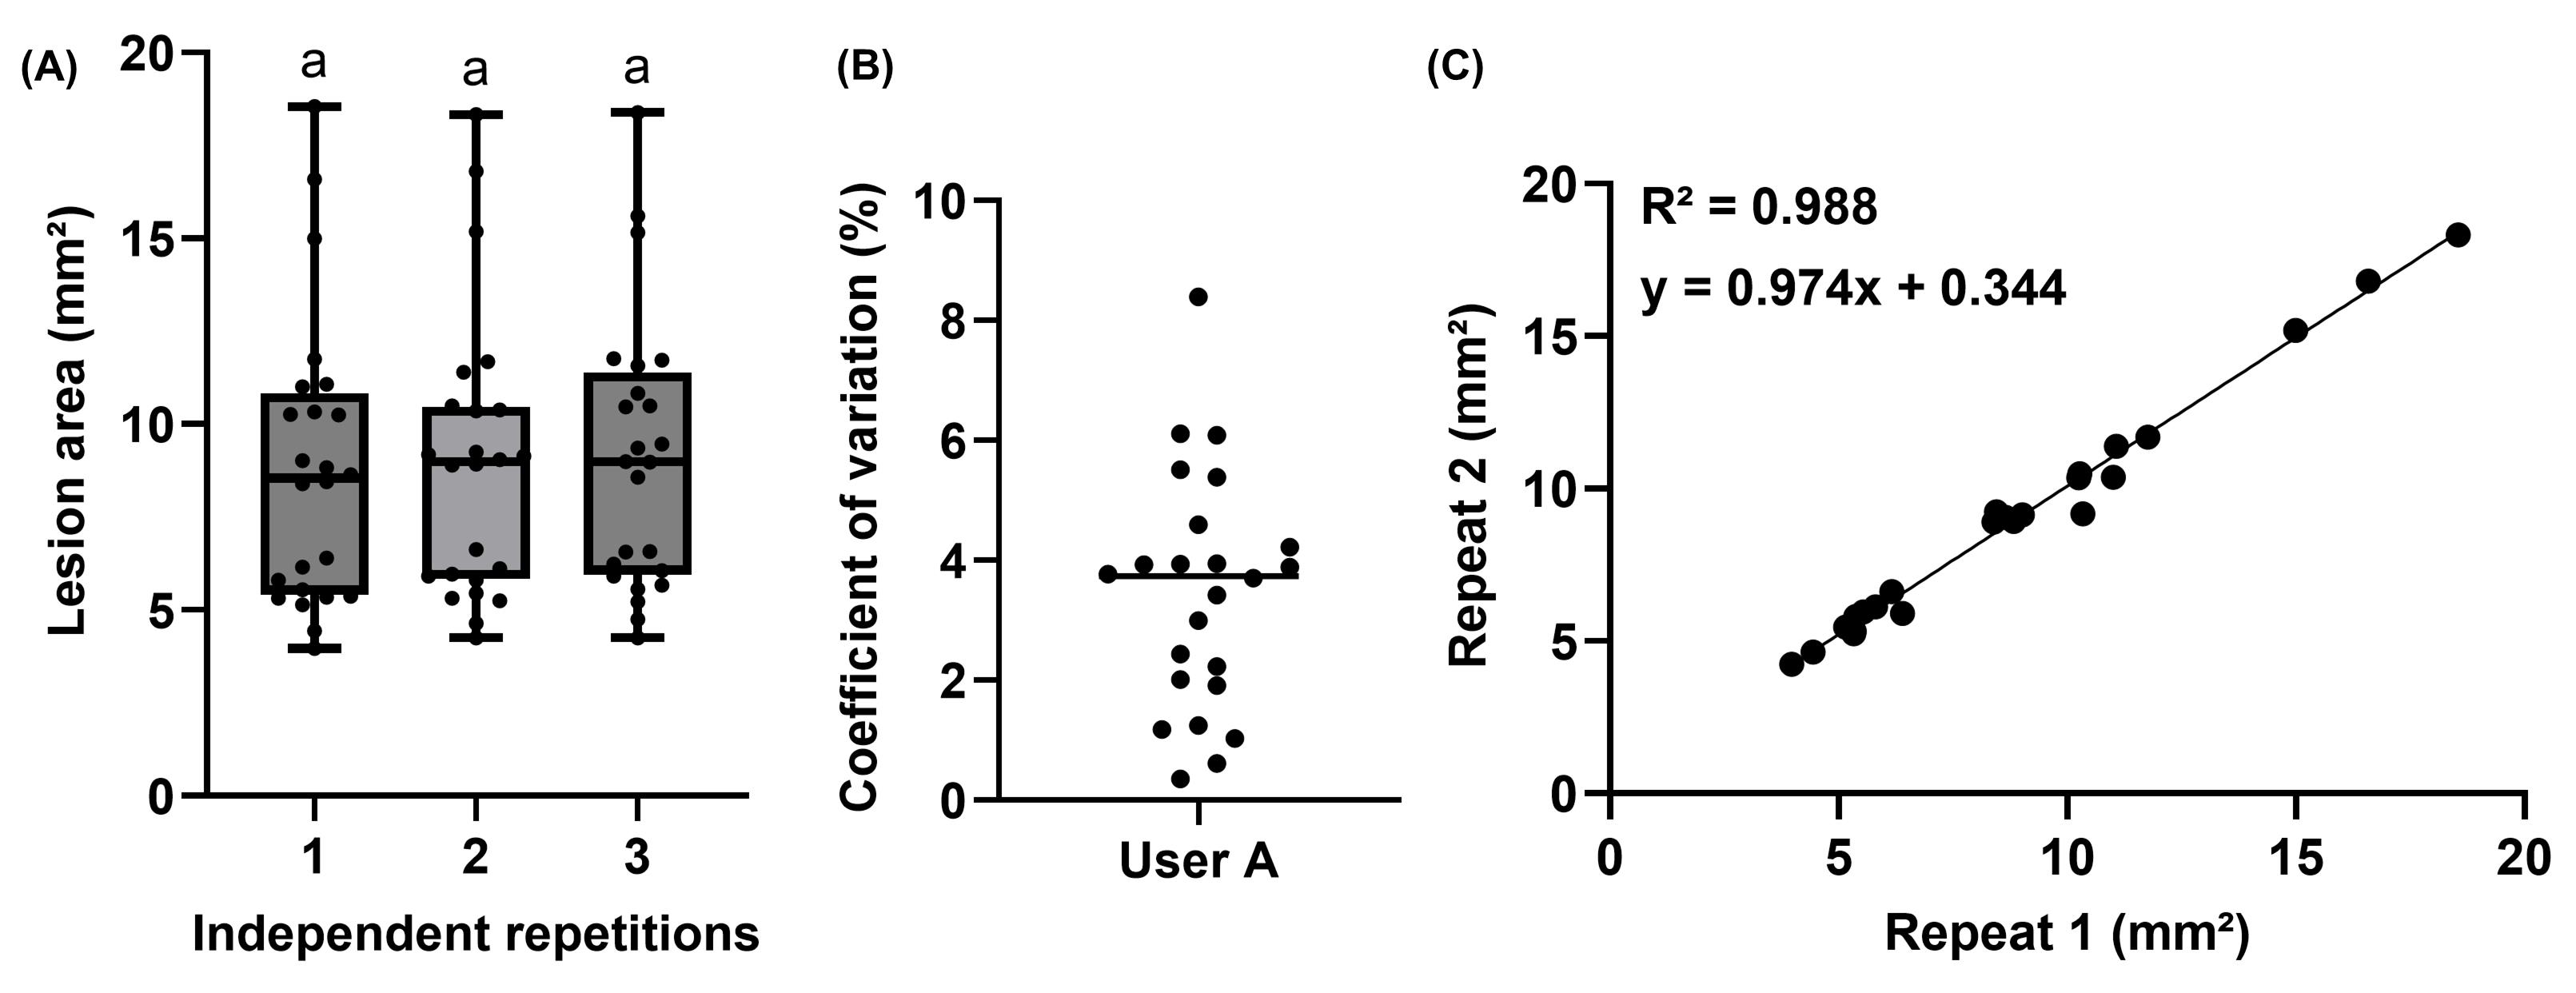
Figure 2. Intra-user repeatability of lesion area measurements. (A) Distribution of lesion area measurements (mm2) across three independent repetitions of the same sample (n = 24 lesions). The boxes indicate the interquartile range, the horizontal line within each box indicates the median, and the whiskers indicate the minimum and maximum values. Each point represents an individual lesion. Statistical differences were assessed using one-way ANOVA followed by Tukey’s multiple comparison test. Groups sharing the same lowercase letter are not significantly different (P > 0.05). (B) Coefficient of variation (CV %) calculated for repeated measurements by the same user (User A), representing intra-user variability. Each point corresponds to an individual lesion. (C) Linear regression analysis comparing lesion area measurements between two repetitions. Each point represents an individual lesion, and the regression line is shown with the corresponding equation and coefficient of determination (R2).
The results demonstrate high repeatability in lesion area measurements obtained with this workflow. The distribution of measurements across independent repetitions showed minimal variability, indicating consistent quantification of lesion areas. Low coefficients of variation further confirmed limited intra-user variability. In addition, strong linear correlations (high R2 values) between repeated measurements indicate high agreement, supporting the method's reliability for repeated assessments of the same sample.
B. Inter-user reproducibility
To assess inter-user reproducibility, two users independently measured lesion areas from the same image set. User A was familiar with the ImageJ/Fiji workflow and the plant–virus system, whereas User B had no prior experience with this specific workflow or experimental system and performed the measurements for the first time by following the protocol. The measurements obtained by the two users were highly consistent, indicating that the protocol can be reproducibly applied by users with different levels of prior experience when the procedure and lesion-selection criteria are clearly followed.
High agreement between users, as indicated by strong correlation and low bias (Figure 3), demonstrates that the protocol is reproducible and can be reliably applied by users with minimal prior experience.
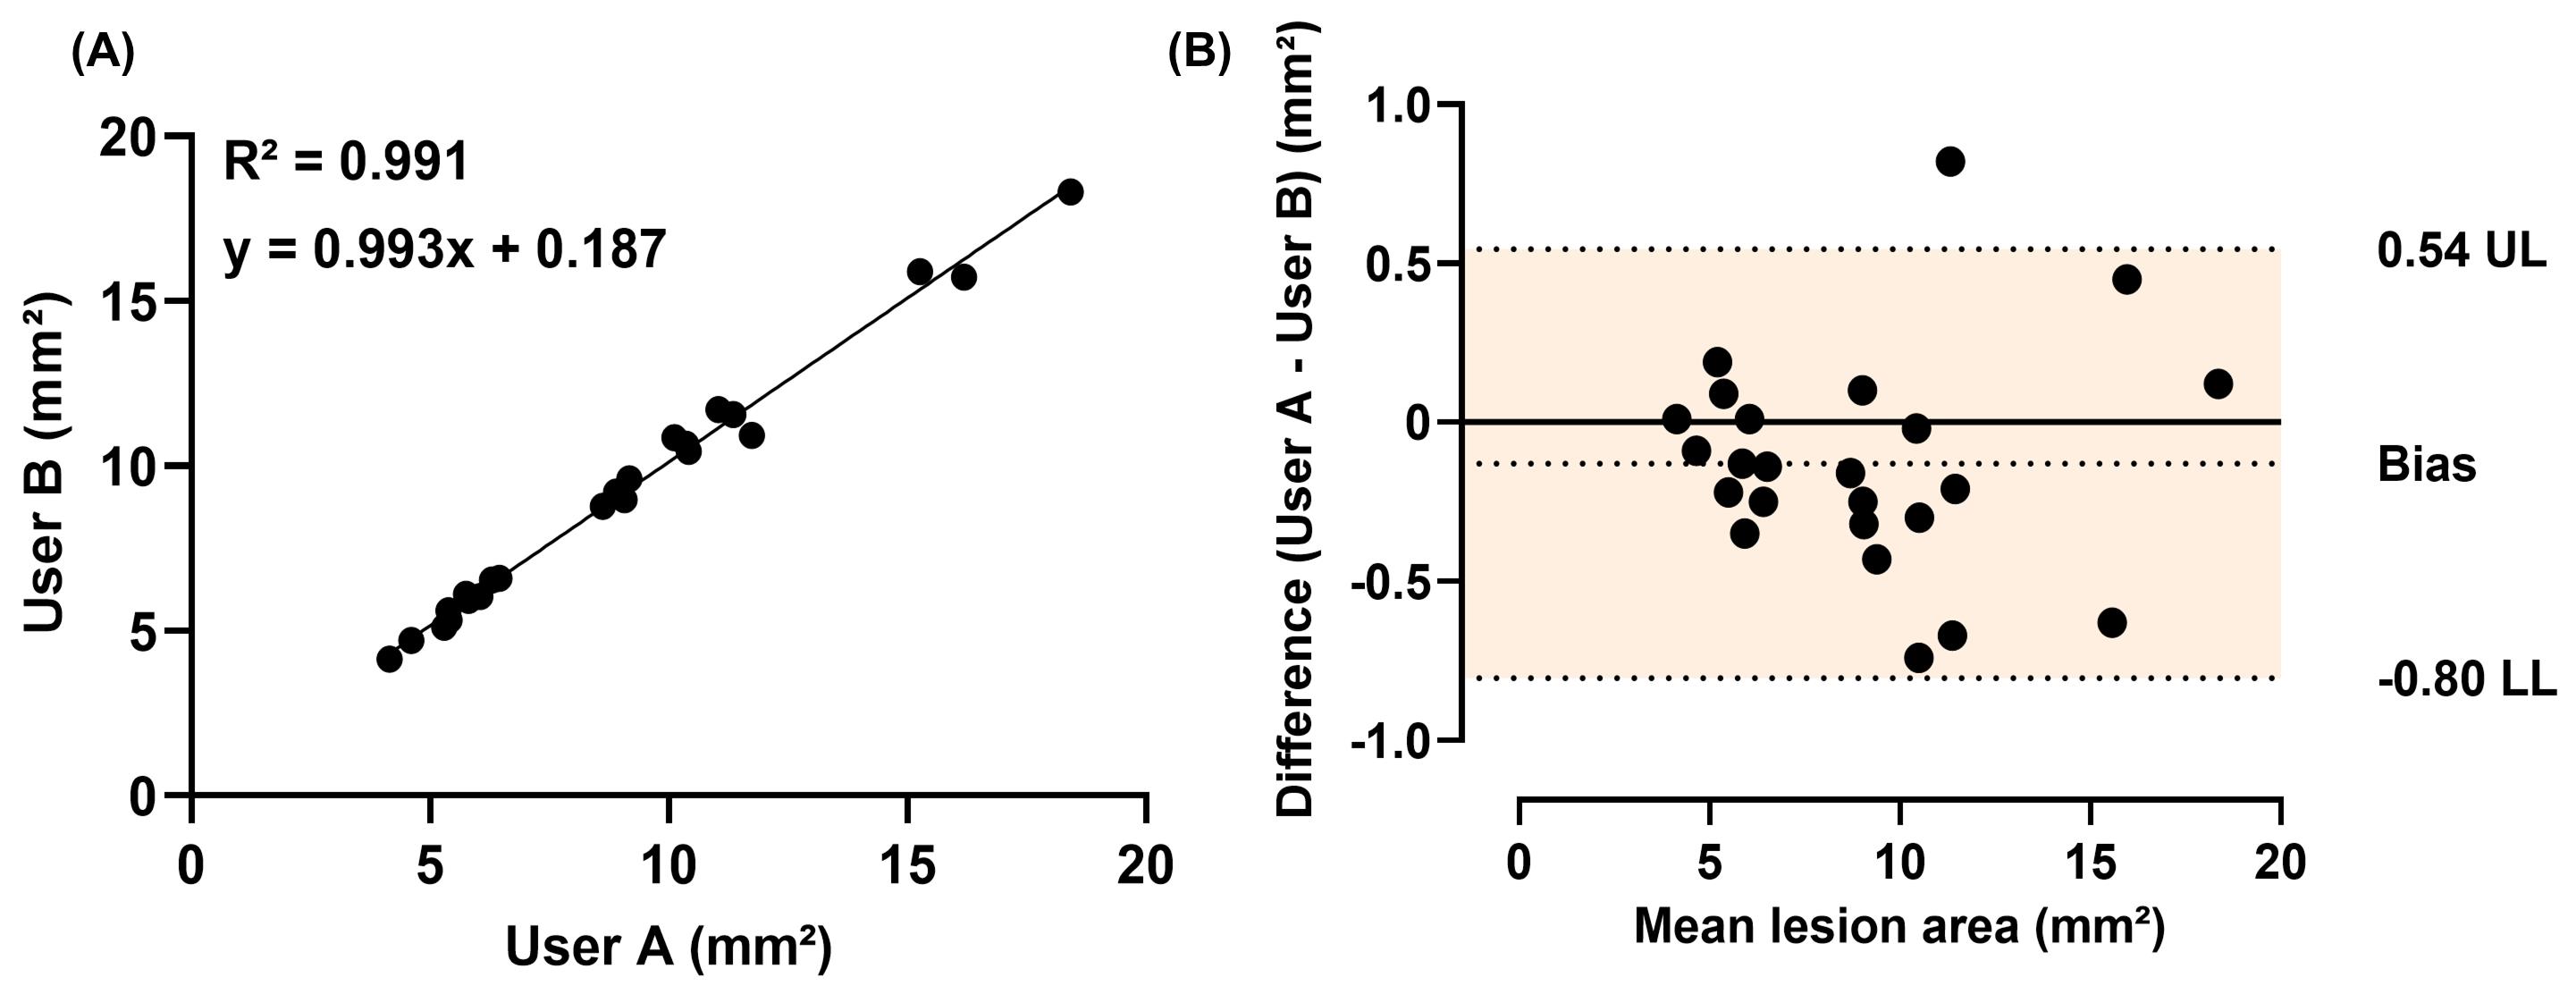
Figure 3. Inter-user reproducibility of lesion area measurements. (A) Linear regression analysis between measurements obtained by User A and User B. The regression line is shown with the corresponding equation and coefficient of determination (R2). (B) Bland–Altman plot showing agreement between the two users. The mean difference (bias) and 95% limits of agreement are indicated (UL, upper limit of agreement; LL, lower limit of agreement).
General notes and troubleshooting
General notes
1. All images within the same experiment should be acquired under identical scanning conditions.
2. A ruler should be included in each scanned image to allow accurate scale calibration.
3. It is recommended to duplicate images or save intermediate steps during analysis, as certain image processing operations cannot be easily undone.
4. To ensure consistency, measurable lesions are defined as localized necrotic regions with a visible boundary that are clearly distinguishable from healthy tissue. The practical detection threshold depends on image resolution, lesion contrast, and boundary clarity; therefore, only lesions that can be reproducibly outlined should be included.
5. Users should exclude lesions that are completely fused. In this protocol, fused lesions are defined as adjacent necrotic areas whose margins have coalesced to the point where individual boundaries are no longer distinguishable. Overlapping lesions can only be analyzed individually if their distinct outlines remain visually separable; otherwise, they should be excluded or measured as a single confluent symptomatic area. Lesions that are diffuse, weakly contrasted, too small to outline reliably, or difficult to separate from artifacts (e.g., shadows, damaged areas, leaf edges) must be excluded.
6. Because lesion selection is performed manually, users should define and apply the same selection criteria before starting the measurements. Similar lesion-selection standards can be expected across different laboratories when image acquisition conditions, lesion boundary criteria, and exclusion rules are clearly specified and applied consistently. However, for new plant–pathogen systems, different leaf colors, or symptoms with ambiguous margins, laboratories should first validate the criteria using representative images and, where possible, compare measurements among users using a shared image set before analyzing the full dataset.
Troubleshooting
Problem 1: Fused lesions.
Possible cause: High Gaussian blur Sigma (Radius).
Solution: Sigma (Radius) should be adjusted to an optimal value to preserve lesion boundaries and prevent fusion of adjacent lesions. Excess radius results in the fusion of lesions and affects measurements (Figure 4A and B).
Problem 2: Multiple fragmented false regions are detected after binarization.
Possible cause: The active selection was not deselected before applying image processing steps.
Solution: Before applying Gaussian blur or binarization, click outside the selection area to deselect all active selections. Then, proceed with image processing. Failure to do so may result in multiple fragmented or degraded lesion regions after binarization (Figure 4C).
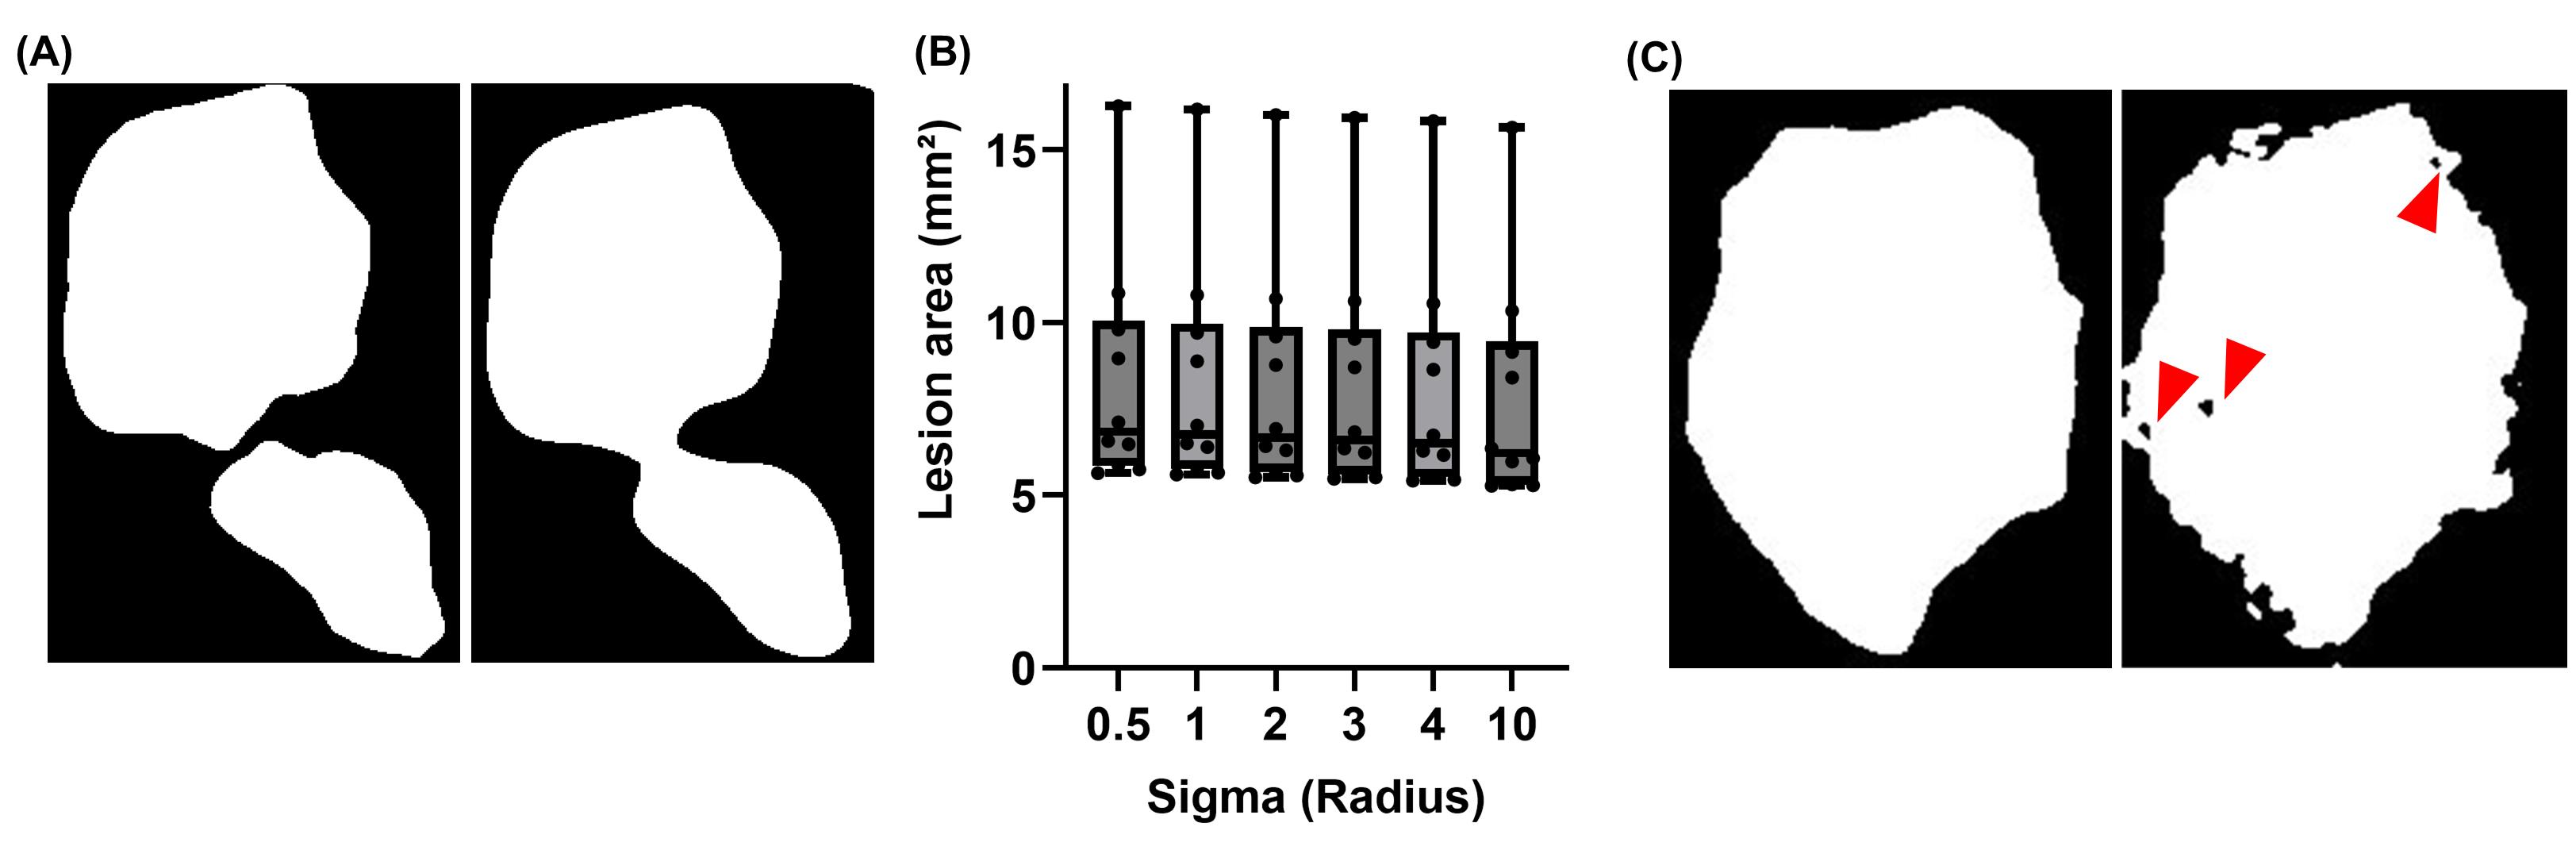
Figure 4. Troubleshooting common artifacts in lesion segmentation during ImageJ-based analysis. (A) Representative binarized images showing the effect of different Gaussian blur sigma (radius) values on lesion segmentation. Left image: lower sigma (2.0), lesions remain clearly separated. Right image: higher sigma (10), adjacent lesions become fused. (B) Distribution of lesion area measurements (mm2) across different sigma (Radius) values (0.5–10) (n = 10 lesions). Box plots indicate the median and interquartile range, showing the impact of smoothing intensity on lesion quantification. (C) Effect of selection handling on lesion segmentation. Left: correctly processed lesion following Gaussian smoothing and binarization after proper deselection. Right: failure to deselect the active selection before processing results in fragmented lesion boundaries and spurious detection of multiple small particles (red arrowheads).
Supplementary information
The following supporting information can be downloaded here:
1. Dataset S1. Raw lesion area measurements used for analysis.
2. Video S1. Demonstration of the full ImageJ workflow for lesion area measurements.
Acknowledgments
The authors used an AI-based tool to assist with English editing and clarity. All scientific content was reviewed and approved by the authors. Conceptualization, B.H.E.S.; Investigation, B.H.E.S.; Writing—Original Draft, B.H.E.S.; Writing—Review & Editing, B.H.E.S., C.O.K.; Validation, C.O.K. This protocol was developed based on a previously described ImageJ-based approach for measuring leaf disease damage [4]. This work was supported by JST SPRING, Japan Grant Number JPMJSP2162.
Competing interests
The authors declare no conflict of interest.
References
- Bock, C. H., Chiang, K. S. and Del Ponte, E. M. (2021). Plant disease severity estimated visually: a century of research, best practices, and opportunities for improving methods and practices to maximize accuracy. Trop Plant Pathol. 47(1): 25–42. https://doi.org/10.1007/s40858-021-00439-z
- Paauw, M., Hardeman, G., Taks, N. W., Lambalk, L., Berg, J. A., Pfeilmeier, S. and van den Burg, H. A. (2024). ScAnalyzer: an image processing tool to monitor plant disease symptoms and pathogen spread in Arabidopsis thaliana leaves. Plant Methods. 20(1): 80. https://doi.org/10.1186/s13007-024-01213-3
- Arnal Barbedo, J. G. (2013). Digital image processing techniques for detecting, quantifying and classifying plant diseases. Springerplus. 2(1): 660. https://doi.org/10.1186/2193-1801-2-660
- Pride, L., Vallad, G. and Agehara, S. (2020). How to Measure Leaf Disease Damage Using Image Analysis in ImageJ. EDIS. 2020(5): e32473/edis–hs1382–2020. https://doi.org/10.32473/edis-hs1382-2020
- Mohanty, S. P., Hughes, D. P. and Salathé, M. (2016). Using Deep Learning for Image-Based Plant Disease Detection. Front Plant Sci. 7: e01419. https://doi.org/10.3389/fpls.2016.01419
- Miyoshi, S., Unung, O. O., Kaya, H., Yaeno, T. and Kobayashi, K. (2024). CRISPR/Cas9-mediated resurrection of tobacco NB-LRR class virus resistance gene from a susceptible allele with partial duplication. J Gen Plant Pathol. 90(6): 322–332. https://doi.org/10.1007/s10327-024-01189-x
Article Information
Publication history
Received: May 2, 2026
Accepted: Jul 8, 2026
Available online: Jul 24, 2026
Published: Aug 20, 2026
Copyright
© 2026 The Author(s); This is an open access article under the CC BY-NC license (https://creativecommons.org/licenses/by-nc/4.0/).
How to cite
Bensedira, H. E. S. and Chehaba, O. K. (2026). A Simple and Reproducible ImageJ Workflow for Measuring Areas of Irregularly Shaped Necrotic Lesions on Plant Leaves. Bio-protocol 16(16): e5788. DOI: 10.21769/BioProtoc.5788.

 Download Citation in RIS Format
Category
Plant Science > Plant immunity > Disease symptom
Plant Science > Plant immunity > Disease bioassay
Plant Science > Plant physiology
Do you have any questions about this protocol?
Post your question to gather feedback from the community. We will also invite the authors of this article to respond.
 Post a Question


