


- Protocols

- Articles and Issues
- For Authors
- About
- Become a Reviewer


4D Imaging of Brown Algal Cells

Published: Vol 16, Iss 13, Jul 5, 2026 DOI: 10.21769/BioProtoc.5730 Views: 326
Reviewed by: Favour Chukwudumebi OnoniwuAnonymous reviewer(s)
 PDF
PDF  Ask a question
Original research article
The authors used this protocol in:
Oct 2025
Advertisement


Protocol Collections
Comprehensive collections of detailed, peer-reviewed protocols focusing on specific topics




Abstract
In vivo imaging of brown algal cells in 3D is extremely challenging because of the presence of pigments, such as fucoxanthin and chlorophyll, that diffract light. Moreover, brown algae live in seawater, a high ionic environment that can change the fluorochrome behavior or cause aggregates. Despite the importance of in vivo monitoring the developmental process of brown algal tissues, 4D imaging (x, y, z, t) on a conventional fluorescence microscope is limited. Here, we propose a detailed protocol using a new orange-emitting fluorochrome, styryl benzoindoleninium sulfonate (SBIS), suitable for labeling the plasma membrane of brown algal cells and multicolor in vivo imaging in 3D using confocal and light sheet microscopy. Unlike calcofluor white (CFW), SBIS enables the observation of brown algal cells at thicknesses up to 25 μm and over periods up to 7 days on brown algae such as Ectocarpus sp., Sphacelaria rigidula, and Saccharina latissima. This step-by-step protocol includes labeling of brown algal tissues, mounting for 3D confocal time-lapse microscopy, and mounting for 3D time-lapse light sheet microscopy. The imaging setup and parameters have been optimized for minimizing toxicity for brown algal tissues, improving signal-to-noise ratio, and enabling detailed visualization of cell shape. Therefore, this protocol provides robust and multiplexed imaging with 4D visualization of brown algal cell shape throughout the brown algae growth, offering broad applications to brown algae study at the cellular level.
Key features
• Introducing a new orange-emitting fluorochrome, styryl benzoindolenium sulfonate (SBIS), labeling the plasma membrane of brown algae.
• A step-by-step protocol to visualize brown algal cell shape in 3D using confocal and light sheet microscopy, suitable for live in vivo imaging.
• Live 4D imaging without interfering with the brown algae growth.
• Adaptable to different brown algae, including Ectocarpus sp., Sphacelaria rigidula, and Saccharina latissima.
Keywords: Brown algae Plasma membrane probe
In vivo imaging
3D
Confocal microscope
Light sheet microscope
Plasma membrane probe
In vivo imaging
3D
Confocal microscope
Light sheet microscope
Background
The study of cell shapes and sizes in 3D during embryogenesis and growth is a widely studied topic in metazoans, plants, and brown algae. Brown algae (Phaeophyceae) are photosynthetic organisms and one of the five groups of eukaryotes that have acquired complex multicellularity and evolved independently of red algae, green plants (including green algae and land plants), animals, and fungi. In multicellular organisms, 3D growth is considered an intricate morphogenetic process. In metazoans, cellular migration commonly drives the establishment of growth axes in multicellular eukaryotes growing in 3D. However, brown algal cells, like plant cells, are surrounded by a semi-rigid cell wall that cements them together. Consequently, the orientation of 3D growth relies on changes in the cell division planes at specific locations. The abundant natural carotenoid and chlorophyll a pigments present in the thylakoid membranes of brown algal chloroplasts [1] absorb blue-green light (excitation wavelength, 480–500 nm) and emit red light (emission wavelength, 646–655 nm for carotenoid and 677–680 nm for chlorophyll a [2]); this characteristic makes in vivo imaging challenging. Moreover, despite the emergence of genome editing tools in brown algae, which have enabled a knockout to be achieved in Ectocarpus sp. [3], knock-ins are not yet feasible. Therefore, along with the development of microscopy techniques enabling time-lapse studies of these organisms in 3D, research aiming at developing fluorochromes labeling specific compartments of brown algal cells is essential. Several fluorescent dyes have been used to label cellular structures in brown algal tissues, but each presents limitations for long-term 4D imaging. Calcofluor white (CFW), a UV-absorbing and blue-emitting fluorochrome, is capable of forming hydrogen bonds with β (1→4) and β (1→3) polysaccharides, thus binding mainly to the chitin and cellulose present in the cell wall of brown algal cells [4,5]. However, the use of CFW reaches a limit when imaging living organisms in 3D over a long period of time, as UV increases the generation of reactive oxygen species that are toxic to living organisms. Furthermore, blue light is less penetrating into the living tissues than longer wavelengths. Fluorochromes labeling the plasma membrane, like FM1-43 [N-(3-Triethylammoniumpropyl)-4-(4-(Dibutylamino) Styryl) Pyridinium Dibromide] and FM4-64 [dibromure de N-(3-triethylammoniumpropyl)-4-(6-(4-(diethylamino) phenyl) hexatrienyl) pyridinium] are internalized by endocytosis within minutes after labeling Ectocarpus sp., S. rigidula, and S. latissima cells. As a result, they are not suitable for a 4D study of brown algae embryogenesis and growth. The aim of this study is to propose a protocol for visualizing brown algal cells in 4D by optimizing mounting for confocal and light sheet microscopy, adjusting acquisition parameters to minimize phototoxicity, and carefully selecting a fluorochrome that allows clear visualization of the plasma membrane.
Materials and reagents
Biological materials
1. Ectocarpus sp. produced from fragmentation of the wild-type male strain Ec32 (CCAP 1310/335; origin: San Jan de Marcona, Peru) parthenosporophytes
2. Embryos of S. latissima, produced from fertilization of the female gametophyte strain F1 with the male strain M1 as described by [6]
3. Female gametophytes of S. rigidula, grown from the fragmentation of adult cultures
Note: All alga thalli were grown in full-strength Provasoli-enriched [7] autoclaved natural or artificial seawater (pH 7.8) (Tropic Marin®) in a culture cabinet at 13 °C with a 12:12 light:dark cycle (light intensity, 29 μmol photon/m2/s) [8].
Reagents
1. Sea salt (Tropic Marin® classic sea salt)
2. Low-melting agarose (Sigma-Aldrich, catalog number: A9045)
Solutions
1. Artificial sea water (ASW) (see Recipes)
2. Low-melting agarose (see Recipes)
3. styryl benzoindoleninium sulfonate (SBIS) (see Recipes)
Recipes
1. Artificial sea water (ASW)
| Reagent | Final concentration | Quantity or volume |
|---|---|---|
| Tropic Marin® classic sea salt | 35 g/L | 35 g |
| MilliQ water | n/a | 1 L |
Filter ASW with a 0.2 μm filter to remove big salt crystals and other particles, then autoclave and store at 4 °C.
2. Low-melting agarose
| Reagent | Final concentration | Quantity or volume |
|---|---|---|
| Low-melting agarose Sigma-Aldrich #A9045 | 1% | 1 g |
| ASW | n/a | 100 mL |
Store at 4 °C.
3. SBIS
| Reagent | Final concentration | Quantity or volume |
|---|---|---|
| SBIS | 10 μM | 10 μL |
| ASW | n/a | 990 μL |
Store at 4 °C.
Laboratory supplies
1. 20 mm diameter glass-bottom cell culture dish, with glass of standard thickness 0.16–0.19 mm (NEST Biotech, catalog number: 801001)
2. Petri dish (Greiner, Standard, sterile, 20 PCS/BAG, catalog number: 632181)
3. Parafilm (Amcor, Parafilm “M” All-Purpose Laboratory film, catalog number: PM-996)
4. Glass capillary (Brand, transferpettor caps 10 μL, catalog number: 701902)
5. Glue (Leroy Merlin®, catalog number: 62928642)
Equipment
1. Confocal microscope (Zeiss, model: LSM 880)
2. Light sheet microscope (Zeiss, model: Light sheet 7)
Software and datasets
1. Zen Blue, Carl Zeiss Microscopy, LLC software
2. Fiji (open source, available at http://fiji.sc/Fiji; [9])
Procedure
A. Labeling of the brown algal tissues in ASW
1. Isolate the desired brown algal tissue (filament or embryo) for the experiment and place it in new ASW. For Ectocarpus sp. and S. rigidula, select a bundle of filaments; each filament will consist of numerous cells. Keep in mind that the denser the bundle of filaments you select, the more information will be visible under the microscope, but the fluorescence will also be more intense, which may make observation of each cell challenging. The rectangular cells of Ectocarpus sp. measure 40 μm in length and 10 μm in width, whilst the rounded cells are 20 μm in diameter. S. rigidula cells are tubular and measure 20 μm in length and 15 μm in width [10]. For S. latissima embryos, the cells are square and measure 15 μm [10]. Select an embryo at the developmental stage of interest to you, from the zygote (day 1) to the 3D-shaped embryo (day 20). For reference, at the 8-cell stage, the S. latissima embryo measures 50–60 μm in length [6]. See Troubleshooting (Problem 1).
a. Work under a laminar flow hood and sterilize any tools used to isolate brown algae using a 70% ethanol solution.
b. Measure the temperature of the ASW. It should be at 13 °C. This temperature keeps brown algae in good condition.
2. In a Petri dish filled with seawater, add an adequate volume of SBIS (10 μm final concentration). Pipette up and down to thoroughly mix SBIS in the seawater.
Note: Pipetting up and down ensures that SBIS is homogenously dissolved in the seawater, which helps for a homogeneous labeling. Therefore, no aggregates should remain visible after this step.
3. Transfer the previously isolated brown algal tissues to the Petri dish containing seawater and SBIS.
4. Incubate in the dark and at 13 °C for at least 30 min to overnight.
5. After incubation, remove the labeling medium composed of ASW containing SBIS and replace it with fresh ASW.
a. Avoid touching the brown algal tissues with the pipette when removing the medium.
b. After adding fresh ASW, carefully swirl the Petri dish in a circular motion to wash the brown algal tissue.
c. Change the ASW at least three times with 5 min intervals.
Note: Always keep the brown algal tissues immersed in ASW.
B. Preparing the sample for confocal live in vivo imaging
1. Transfer the labeled brown algal tissues to a 20 mm diameter glass-bottom cell culture dish, with glass of standard thickness 0.16–0.19 mm. To ensure that the brown algal tissue does not move during live acquisition, use a coverslip to maintain the sample in place (Figure 1A).
a. In a glass-bottom Petri dish, add 200 μL of fresh ASW droplet containing brown algae.
b. Gently place the brown algal sample in the middle of the glass-bottom part of the Petri dish.
c. Using tweezers, carefully place the coverslip in the middle of the glass-bottom Petri dish, thus covering the brown algal tissues and securing it in place in the middle (Figure 1Ba).
Note: Placing the sample in the center of the glass-bottom Petri dish limits the phenomenon of chromatic aberration that occurs when the sample is located at the edges of the glass-bottom Petri dish [10].
2. Once the brown algal tissues are mounted under the coverslip, slowly add 2 mL of ASW to completely fill the glass-bottom Petri dish.
3. Put the lid on and seal with parafilm. See Troubleshooting (Problem 2).
4. Under a stereomicroscope, locate the brown algae you want to image and use a marker to mark their positions on the cover (Figure 1Bb).
5. Keep the sample in the dark and at 13 °C until the beginning of the acquisition.
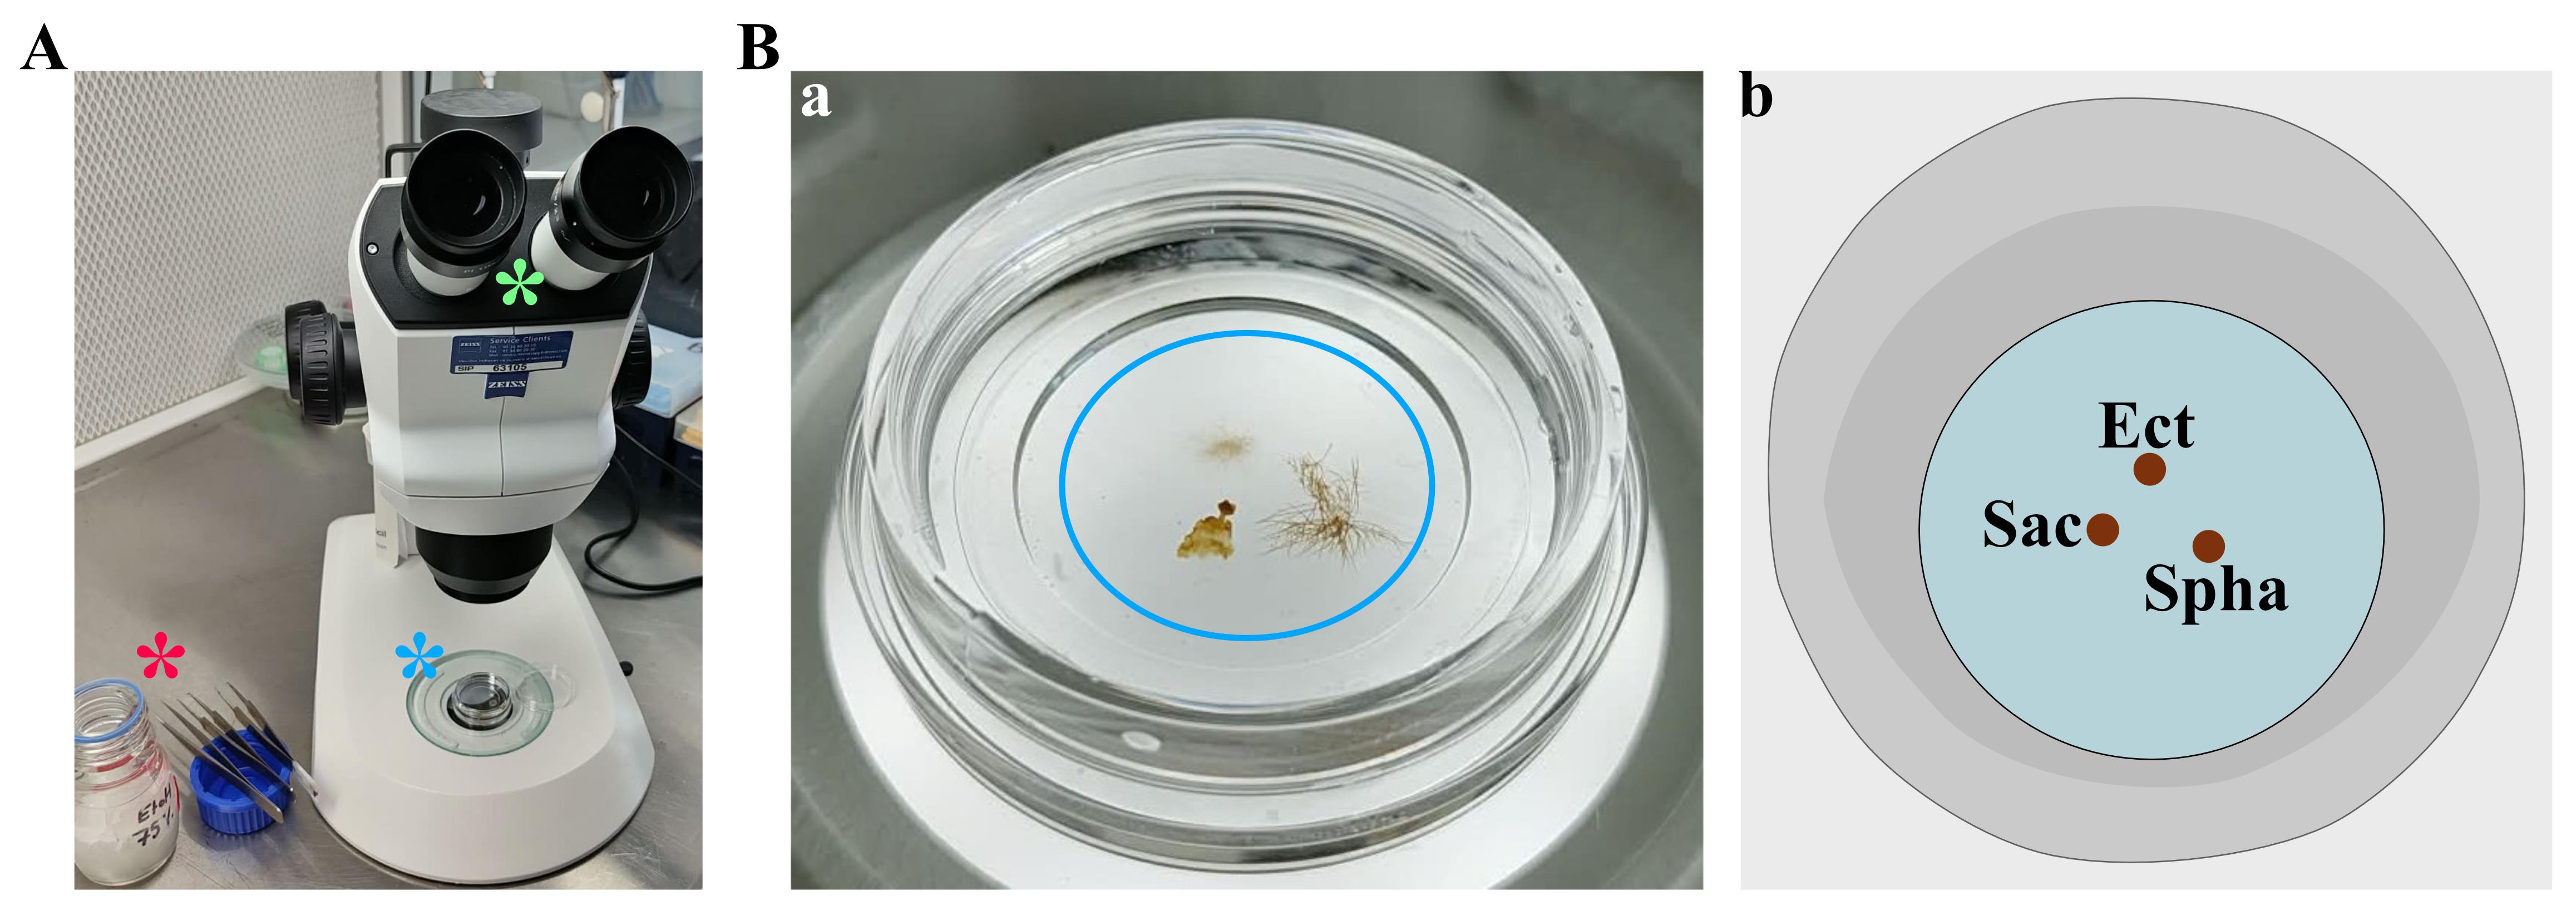
Figure 1. Brown algal tissue preparation for in vivo confocal microscopy. (A) Material used for mounting brown algal tissues. Stereoscopic microscope (green asterisk), sterilized forceps (red asterisk), glass-bottom cell culture dish, and coverslip (blue asterisk). (B) Brown algae mounted for in vivo confocal microscopy. a) Glass-bottom cell culture dish containing the labeled Ectocarpus sp., S. latissima, and S. rigidula placed in the middle and under the coverslip (outlined in blue) and filled with ASW. b) Schematic representation to localize the Ectocarpus sp. filaments (Ect), S. latissima embryo (Sac), and the S. rigidula filaments (Spha).
C. Preparing the sample for light sheet live in vivo imaging
1. Mounting for light sheet imaging requires embedding the brown algal tissues in low-melting agarose.
a. Prepare 1% low-melting agarose dissolved in ASW. Heat up the preparation until low-melting agarose melts (Figure 2A).
b. Add a small droplet of low-melting agarose to a Petri dish (Figure 2Ba).
Note: This step helps the low-melting agarose to cool down more easily.
c. Let the low-melting agarose cool down for 1 min (Figure 2Bb).
Note: The low-melting agarose is at the right temperature when condensation stops forming around the droplet. However, allowing it to cool for too long will cause the low-melting agarose to become too rigid.
d. Transfer the labeled brown algal tissues to the droplet of cool low-melting agarose (Figure 2Bb). See Troubleshooting (Problem 3).
e. Insert the metal wire inside the glass capillary (transferpettor).
f. Draw the melted agarose containing the brown algal tissues into the glass capillary by pulling on the metal wire (Figure 2Bc).
2. Once the agarose has solidified and you obtain a stable and stiff mounting device, push the agarose plug with the tissues out of the glass capillary and immerse it in ASW (Figure 2Bd).
Note: For samples that are bigger than the glass capillary diameter and thus cannot be embedded in low-melting agarose, use glue to stick the brown algal tissues to the tip of the glass capillary.
3. Keep the sample in the dark and at 13 °C until the start of acquisition.
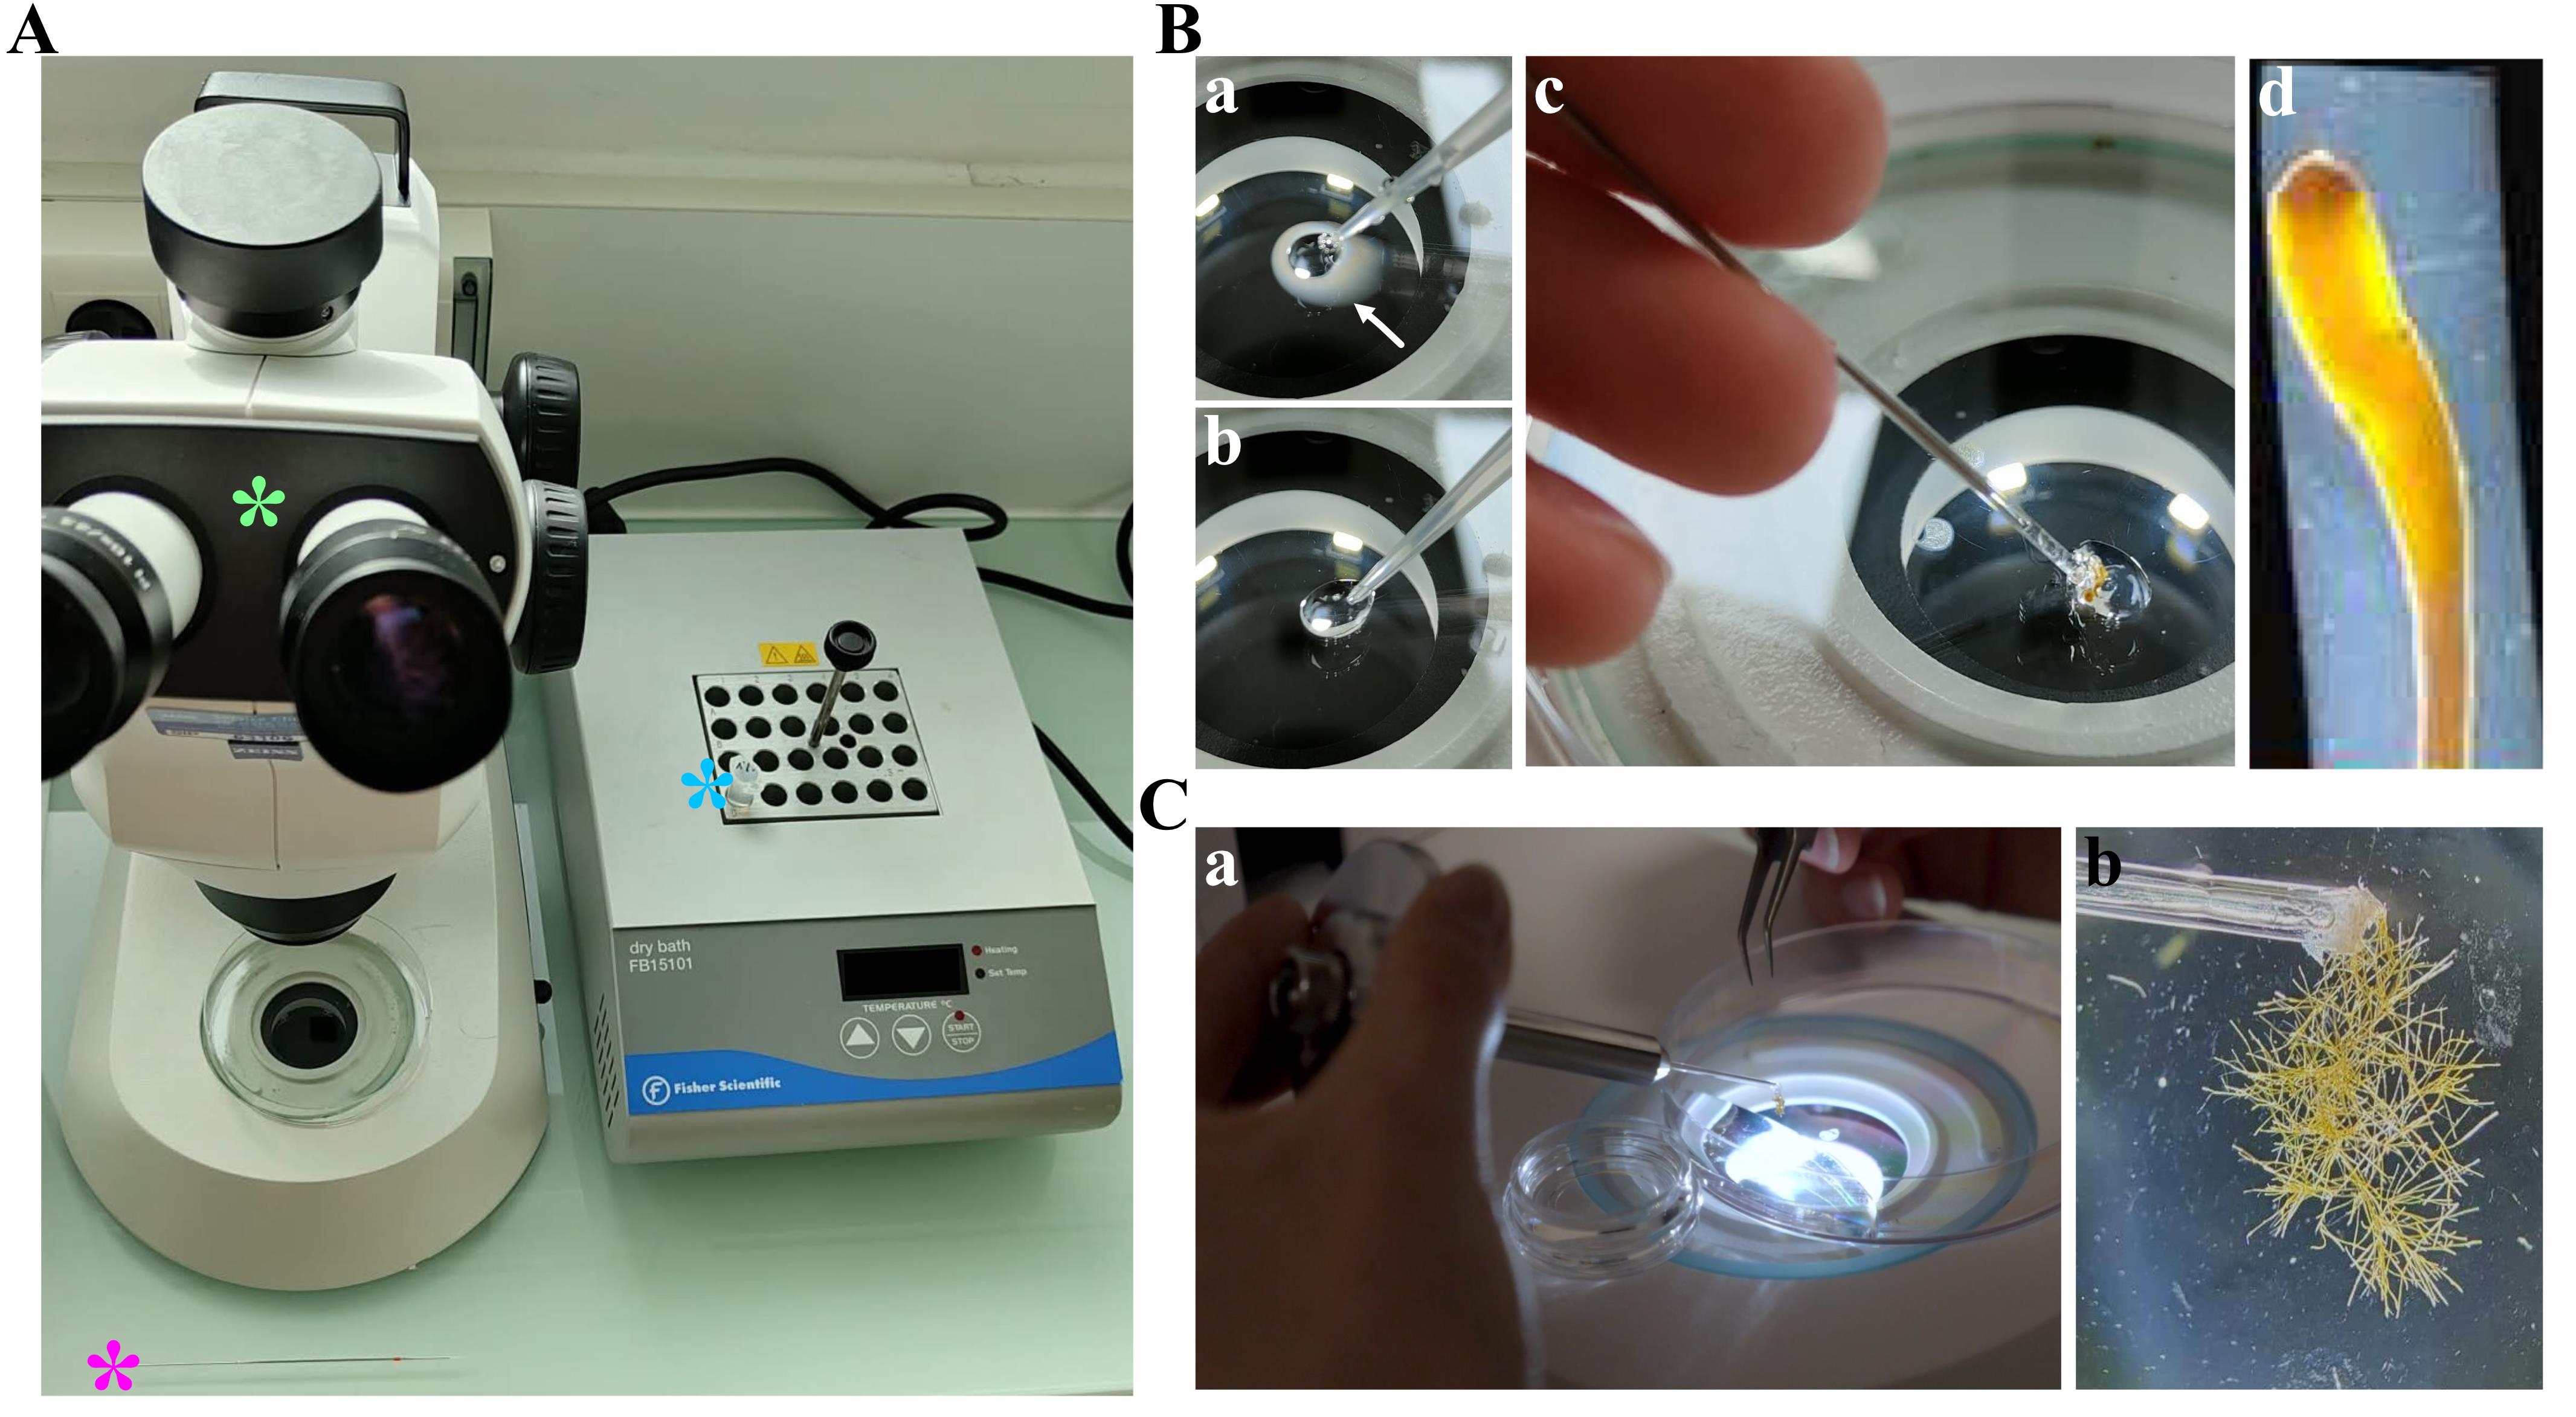
Figure 2. Brown algal tissue preparation for in vivo light sheet microscopy. (A) Material used for mounting brown algal tissues. Stereoscopic microscope (green asterisk), glass capillary containing a metal wire (pink asterisk), and 1% low-melting agarose heated using a heating block (blue asterisk). (B) Mounting S. latissima embryo in 1% low-melting agarose. a) Condensation forms around the low-melting agarose droplet, indicating that the agarose is too hot. b) There is no condensation formed around the low-melting agarose drop, meaning that the agarose is at the correct temperature. c) Embedding of S. latissima embryo in low-melting agarose into the glass capillary by pulling on the metal wire inserted inside the capillary. d) Embedded S. latissima embryo in 1% low-melting agarose and immersed in ASW. The brown color indicates that the tissue is still alive, and hence, that the agarose temperature was not too hot. (C) a) Mounting S. rigidula filaments by gluing them on one side of the glass capillary. b) Glued S. rigidula embryo immersed in ASW.
D. 4D imaging of SBIS-labeled brown algal tissues on a confocal microscope
1. Image brown algal tissues on an inverted confocal Zeiss LSM 880 microscope (Figure 3A).
a. Power on the confocal microscope and the computer and open the Zen Blue software.
Note: Ensure that all lasers needed for the acquisition are turned on at least 1 h before the start of the experiment. Keep the room temperature at 16 °C to enable brown algae to develop normally and remain in good condition.
b. Select the LD C-Apochromat 40×/1.1 W Corr M27 objective and use water as the immersion medium.
c. Place the sealed glass-bottom Petri dish filled with the mounted and labeled brown algal tissues in the middle of the objective (Figure 3B).
2. On the Zen Blue software, select multi position.
3. Use white light to localize on the oculars the multiple tissues and save them as different positions.
4. On Zen Blue, set the Z-stack. Choose the range of your Z-stack, select Top and Bottom, and place the stage in the central position. Repeat this step for every position (Figure 3C).
Note: A 0.6 μm thickness interval allows to obtain high quality images.
5. Set the wavelength parameters to visualize:
a. In the white light channel: brightfield. Select the T-PMT with a low laser power of 0.5% and a gain of 150.
b. In the orange channel: SBIS. Use an excitation wavelength of 561 nm and a band emission of 578–632 nm. Use a low laser power of 3% and a gain of 600 to minimize photobleaching.
c. In the red channel: Autofluorescence of chloroplasts. Use an excitation wavelength of 561 nm and a band emission of 668–721 nm. Use a low laser power of 3% and a gain of 600 to minimize photobleaching.
Note: Use minimal laser power and gain to minimize phototoxicity.
6. Set the time lapse with the desired light exposure. For brown algal tissues, we follow a cycle of 12 h of dark and 12 h of light at 30 μmol photons m-2·s-1.
Note: Zeiss developed a home-made white light ring for the Zeiss LSM 880 microscope. In the Time series tab, select the interval between each illumination and the number of cycles.
7. Launch the automated stages for multiple position acquisition.
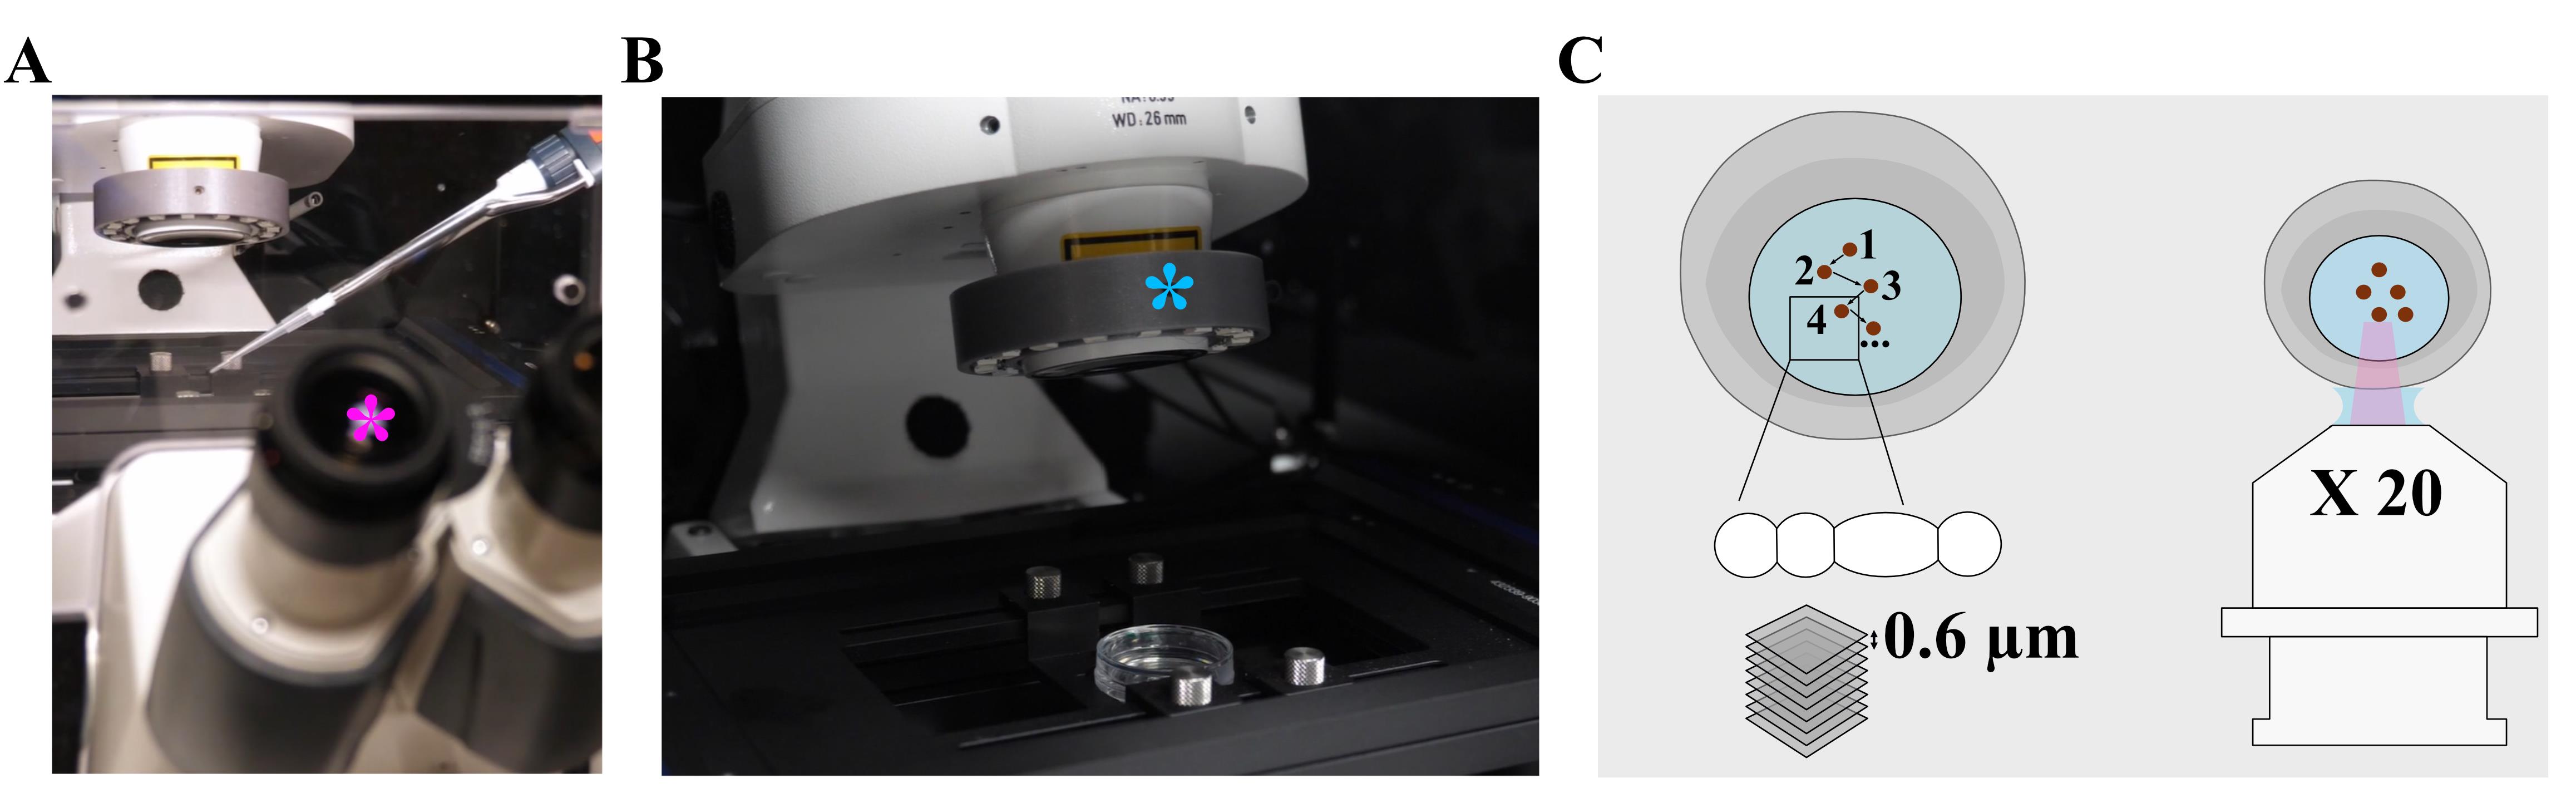
Figure 3. Confocal microscope setup for imaging brown algal tissues in 4D. (A) Brown algal tissues are imaged on an inverted confocal Zeiss LSM 880 microscope (pink asterisk) W Plan-Apochromat 20×/1.0 DIC M27 objective. Add a droplet of water as the immersion medium between the objective and the glass-bottom cell culture dish containing the labeled brown algal tissues. (B) Homemade ring light (Zeiss) (blue asterisk). (C) Schematics of multi-position (1, 2, 3, 4, … positions), Z-stack of 0.6 μm interval, and inverted microscope setup. Brown algal tissues are schematized with brown circles; number 4 represents an Ectocarpus sp. filament.
E. 4D imaging of SBIS-labeled brown algal tissues on a light sheet microscope
1. Image brown algal tissues on a Zeiss Light sheet 7 microscope using a W Plan-Apochromat 20×/1.0 DIC M27 objective (Figure 4Aa).
a. Power on the light sheet microscope and the computer and open the Zen Blue Carl Zeiss Microscopy, LLC software.
Note: The temperature probe must be connected before starting up the Zen Blue software. Check the water level in the Temperature Module cooling block. It will beep if the float is not between Min and Max; you will need to add water and antifungal agent at a ratio of 1/1,000.
b. Install the temperature sensor on the wall of the tank and clip it into place (Figure 4B).
c. Slide the tank into the Zeiss Light sheet 7 microscope.
d. Press and screw the tank into place using the outer screw in the center.
Note: Screwing it in place creates a seal between the tank and the lens at the rear.
e. Screw the temperature controller of the Pelletier system (part under the tank) with the red marks facing each other. Turn to unclip if necessary to reposition it.
f. Clip the two white cold water supply tubes. Push to clip on and unclip.
g. Fill the syringe with approximately 10 mL of ASW, connect the syringe tube to the tank, and fill it slowly until the meniscus is no longer visible.
h. Clip on the light ring (Figure 4C).
Note: Zeiss developed a home-made light ring for the Zeiss Light sheet 7 microscope.
g. Close the door of the light sheet microscope.
Note: The Zen Blue software is initialized without opening the microscope door.
2. In the Zen Blue software, adjust the temperature and acquisition method.
a. Click on the Locate tab, then Incubation, and set the requested temperature to 13 °C. Check Pelletier to confirm the selected temperature.
b. In the Acquisition tab, choose Z stack and Time series.
Note: In the Time series tab, click on Inter Acquisition Signal and select trigger 1 so that the white light turns off automatically during acquisition and is turned back on after the acquisition. Select the interval between each illumination and the number of cycles.
c. Adjust the light sheets by clicking on the Maintain tab, Adjustment, Adjust light sheet, Verified, and Next. Select the wavelength to be aligned. If there are several colors, select the most central wavelength or the one that requires the best resolution. For each side of illumination, select Left or Right illumination, then click on Fine Adjustment to locate the light sheet on the blue marks and adjust the Y Offset to center the light sheet horizontally at the green marks. Then, adjust the Z Offset to obtain the thinnest possible light sheet. Finally, adjust the waist of the sheet so that it is centered in the middle of the image. To move the waist, manually adjust the correction rings on the illumination lenses inside the microscope. Click on Finish (Figure 4D). See Troubleshooting (Problem 4).
d. Raise the platform that will carry the sample by clicking on the Locate tab and then Load Position.
3. Insert the glass capillary containing the mounted and labeled brown algal tissues through the lid (Figure 4Ab).
4. Lock the slide holder by aligning the white lines (Figure 4Ac).
5. Using the metal wire, push the agarose gel out of the glass capillary until the brown algal tissues appear.
6. Close the cover.
7. Locate the brown algal tissues.
a. In the Locate tab, press Overview and place the brown algal tissues in front of the IR camera (located in the door of the light sheet microscope).
b. To view the brown algal tissues in white light, use min/max and refine the position of the sample using the joystick or computer keyboard.
c. In the ZEN Blue software, select Multi position, locate the different brown algal tissues, and save them as different positions.
8. Set the light path tracks.
a. Track 1 in the white light channel: click On and adjust the light brightness to 25%.
b. Track 2 in the orange channel: SBIS. Turn off the light and select the 561 laser. Select LBF 405/488/561/640; SBS LP 510; BP 575–615, and check the camera.
c. Track 3 in the red channel: autofluorescence of chloroplasts. Turn off the light and select the 561 laser. Select LBF 405/488/561/640; SBS LP 560; LP 660, and check the camera.
9. Set the acquisition parameters.
a. In the Channels tab, for each track, adjust the 561 laser intensity to 5% and 60 ms exposure time, and 0.2% and 30 m exposure time.
Note: Use minimal laser power and gain to minimize phototoxicity.
b. Readjust the position of the two light sheets separately (left/right) in live mode (not in continuous mode) using the Page down or Page up keys to adjust the position of the light sheet so that the image is clear.
c. Do the same for Track 2 by unchecking Track 1 and then checking Track 2.
10. To have both light sheets active at the same time during acquisition, select Dual Side and Online Dual Side Fusion.
Note: Fusion will occur at the time of acquisition.
11. Check Pivot scan to avoid the appearance of streaks during acquisition.
12. Set the Z-stack by clicking on set last, then set first, then click on optimal to automatically calculate the optimal thickness between each z-plane (Figure 4E).
13. Set the time lapse with the desired light-exposition around 30 μmol photons m-2·s-1. For brown algae, we follow a cycle of 12 h of dark and 12 h of light.
14. Click on start experiment to launch the acquisition (an example is shown in Video 1).
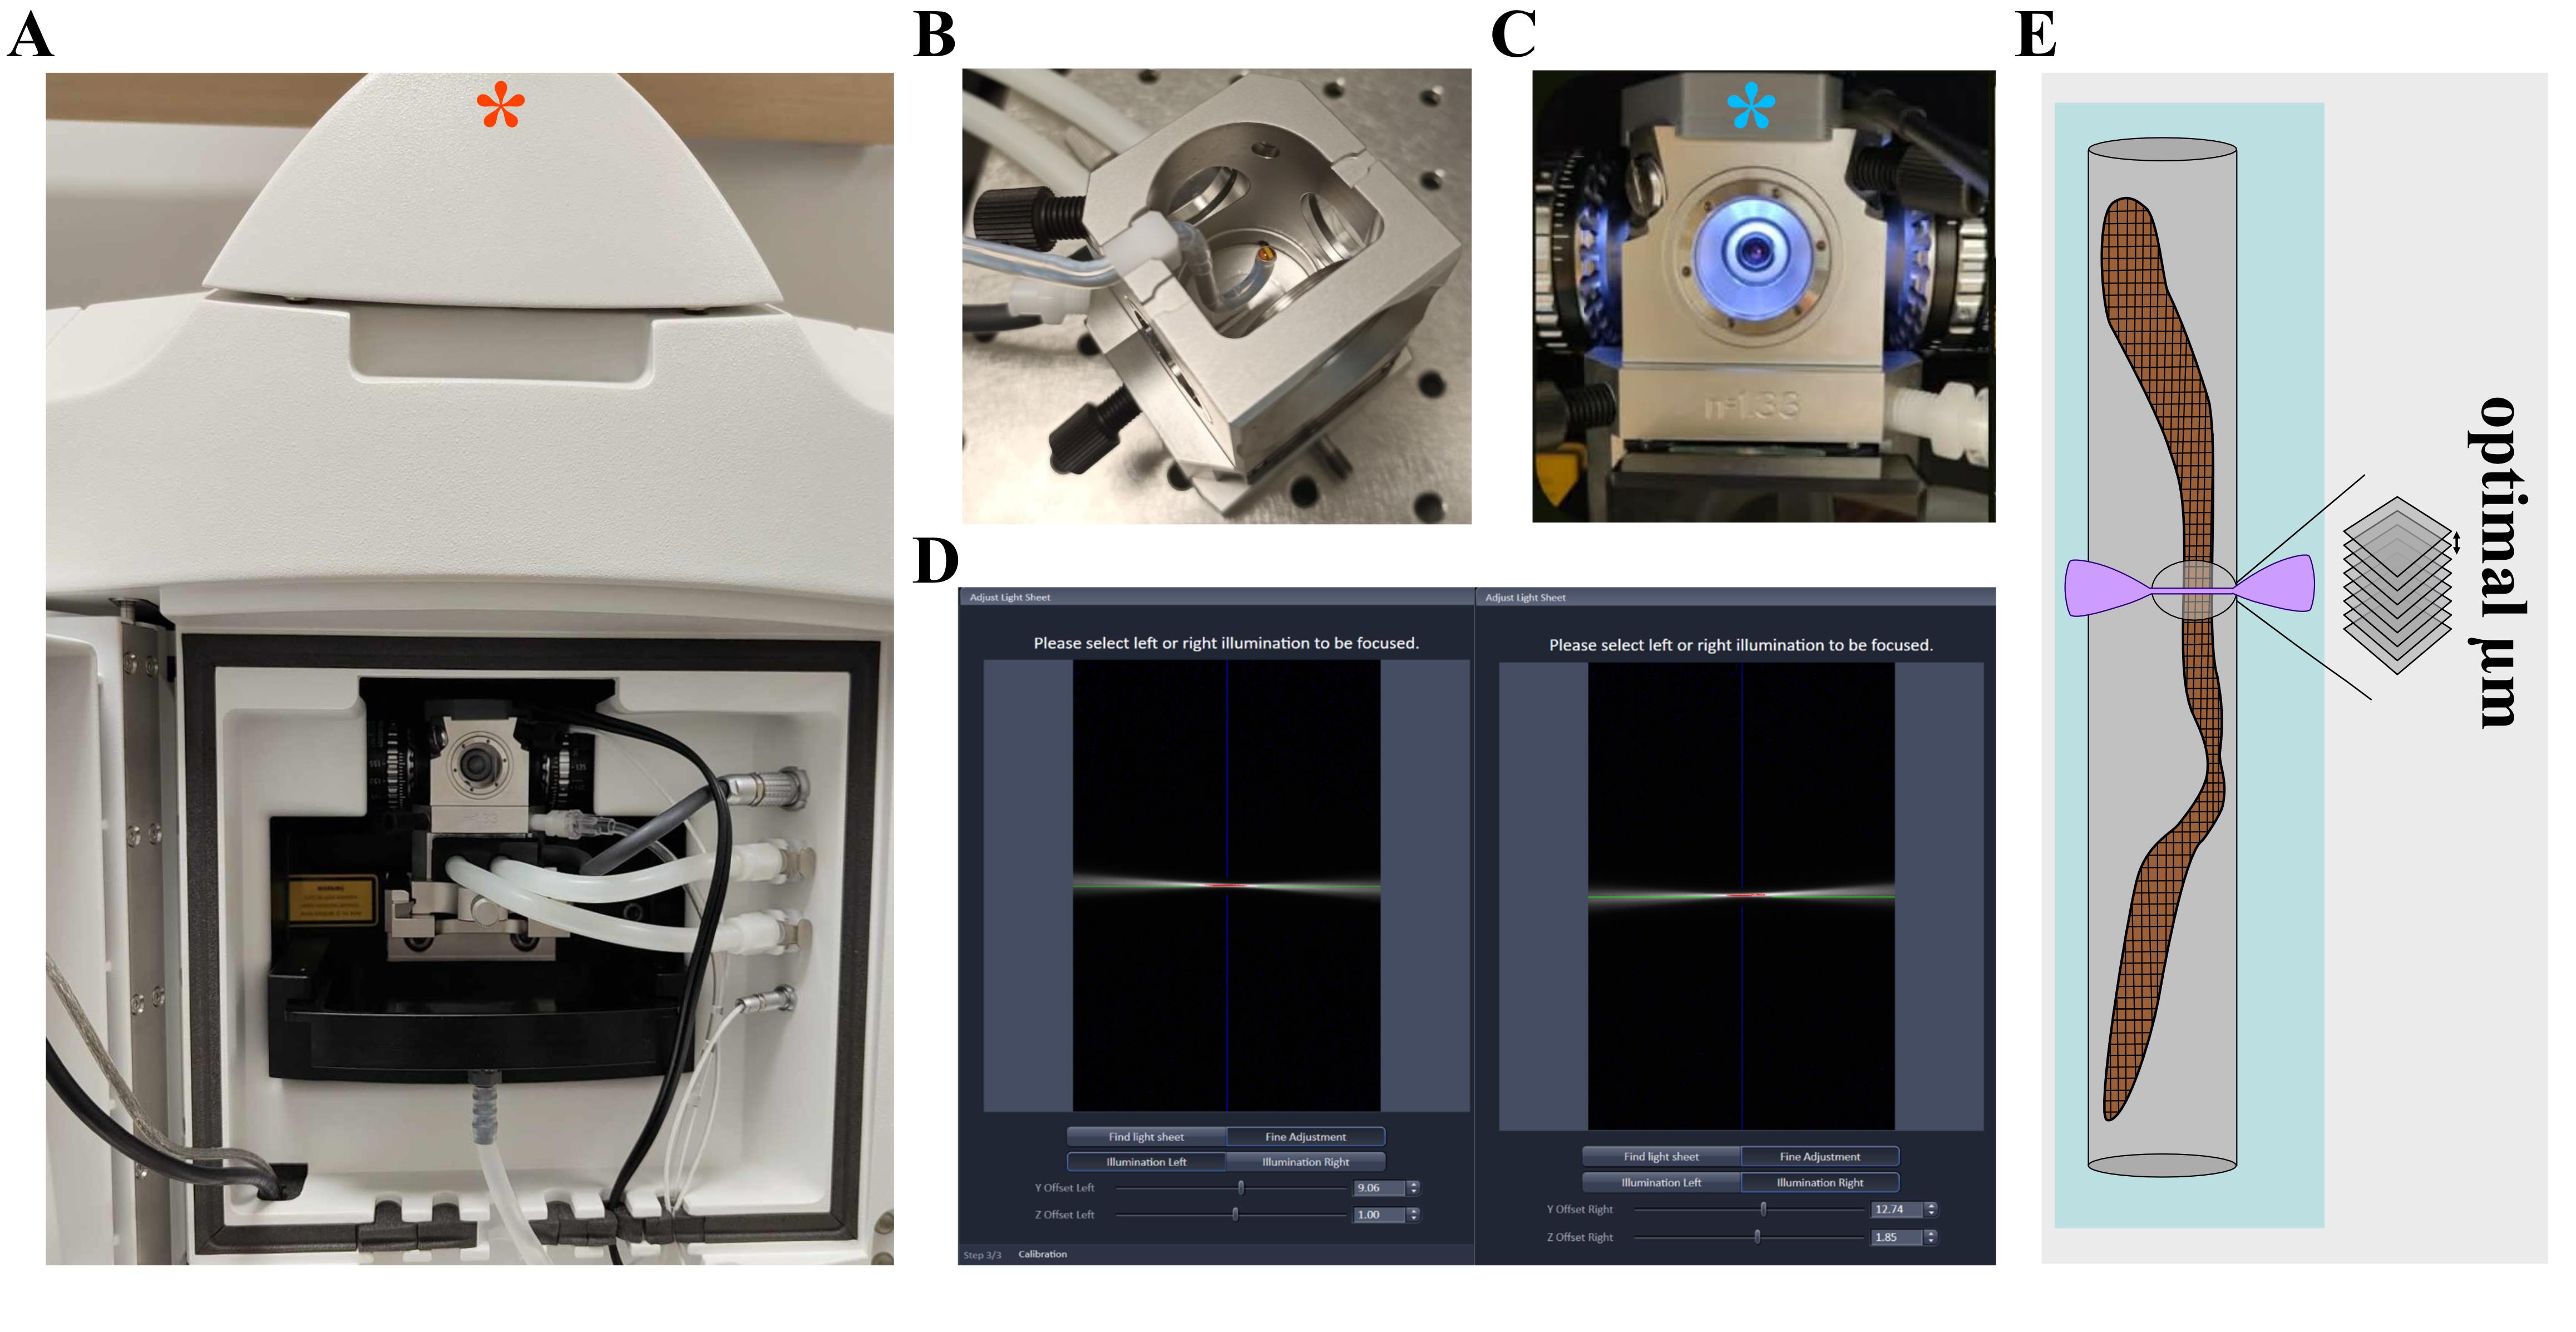
Figure 4. Light sheet microscope setup for imaging brown algal tissues in 4D. (A) a) Brown algal tissues are imaged on a Zeiss Light sheet 7 (lid of the LS7 is marked by an orange asterisk) microscope using a W Plan-Apochromat 20×/1.0 DIC M27 objective. b) Open the LS7 lid to install the mounted brown algal sample. c) Make sure that the two white marks are placed in front of each other. (B) Installation of the temperature sensor on the wall of the tank, which will measure the ASW temperature. (C) Homemade ring light by Zeiss (blue asterisk). (D) Adjusting the light sheets. (E) Scheme of Z-stack using an optimal μm interval on a region of an S. latissima embryo embedded in 1% low-melting agarose (grey) and immersed in ASW (blue). Light sheets are represented in pink.

Data analysis
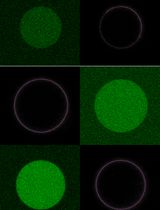
A detailed description of the data analysis method is given in [10] (Figures 2–6). The inclusion of negative controls is essential in fluorescence microscopy to validate the fluorochrome signal specificity and to distinguish fluorochrome-derived fluorescence from autofluorescence or imaging artifacts. This is especially important in brown algae and plants because of the natural presence of pigments that fluoresce when excited by specific wavelengths and could be mistaken for fluorochrome signals. Therefore, as a negative control, non-labeled S. rigidula filaments were prepared, mounted, and imaged on the confocal Zeiss LSM 880 microscope in the same conditions as SBIS-labeled ones. When visualized using the same imaging parameters and contrast settings used to visualize SBIS-labeled S. rigidula, they showed no detectable fluorescence signal (Figure 5, upper panel). This confirms that the fluorescence observed in S. rigidula labeled with SBIS does not originate from background signal, detector noise, or intrinsic autofluorescence under the chosen acquisition conditions. Only when the contrast of the negative control image was substantially increased beyond the parameters used to analyze the SBIS labeled images, a signal appearing as small spherical granules resembling physodes becomes detectable (Figure 5, lower panel). This likely reflects an extremely low background signal or minimal nonspecific interaction of the fluorochrome. It is not excluded that physodes, membrane-bound intracellular vesicles that can store and transport phenolic compounds such as phlorotannin and can be found in the cytoplasm of brown algal cells, can absorb yellow-green light and emit autofluorescence in the orange detection channel.
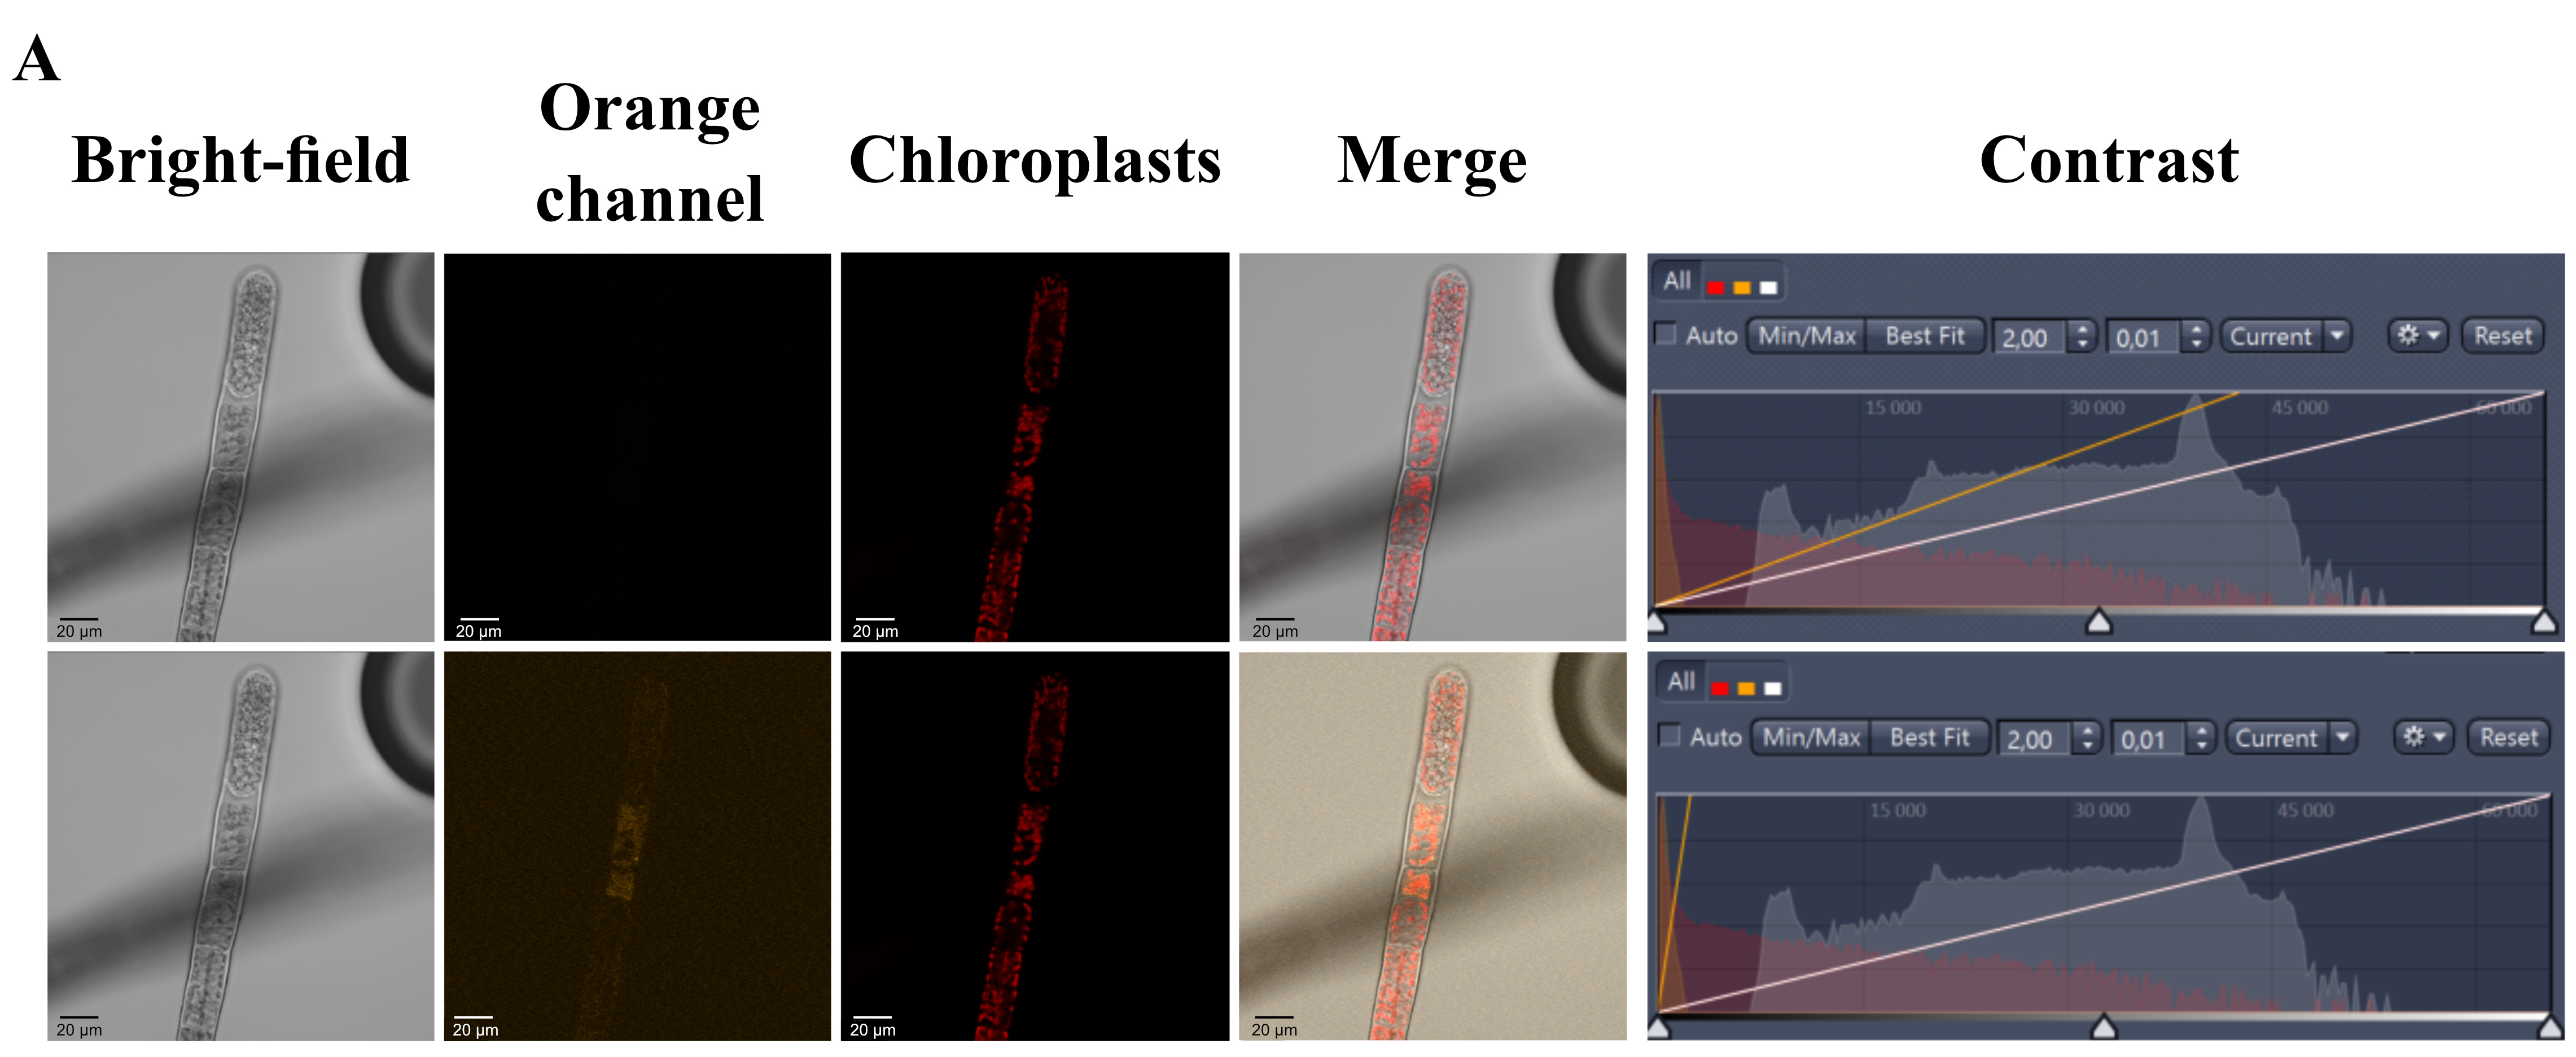
Figure 5. Negative control of styryl benzoindoleninium sulfonate (SBIS) labeling and over contrasting. S. rigidula, not labeled with SBIS, was used as a negative control; microscopy images were visualized using Fiji. Top panel: No signal fluorescence is detected in the orange channel. Bottom panel: Auto-fluorescence is detected in the orange panel when applying high contrast settings. Orange channel: Exc 561/Em 578–632; chloroplasts auto-fluorescence: Exc 561/Em 674–721. Scale bar, 20 μm.
It is important to note that applying these high-contrast settings to the SBIS-labeled samples resulted in high signal saturation (Figure 6A), demonstrating that the fluorescence intensity in labeled S. rigidula is distinctly higher than any background detected in the control (Figure 6B). The absence of a detectable signal in the negative control supports that the fluorescence signal observed in SBIS-labeled samples represents the labeling of S. rigidula plasma membrane rather than background fluorescence.
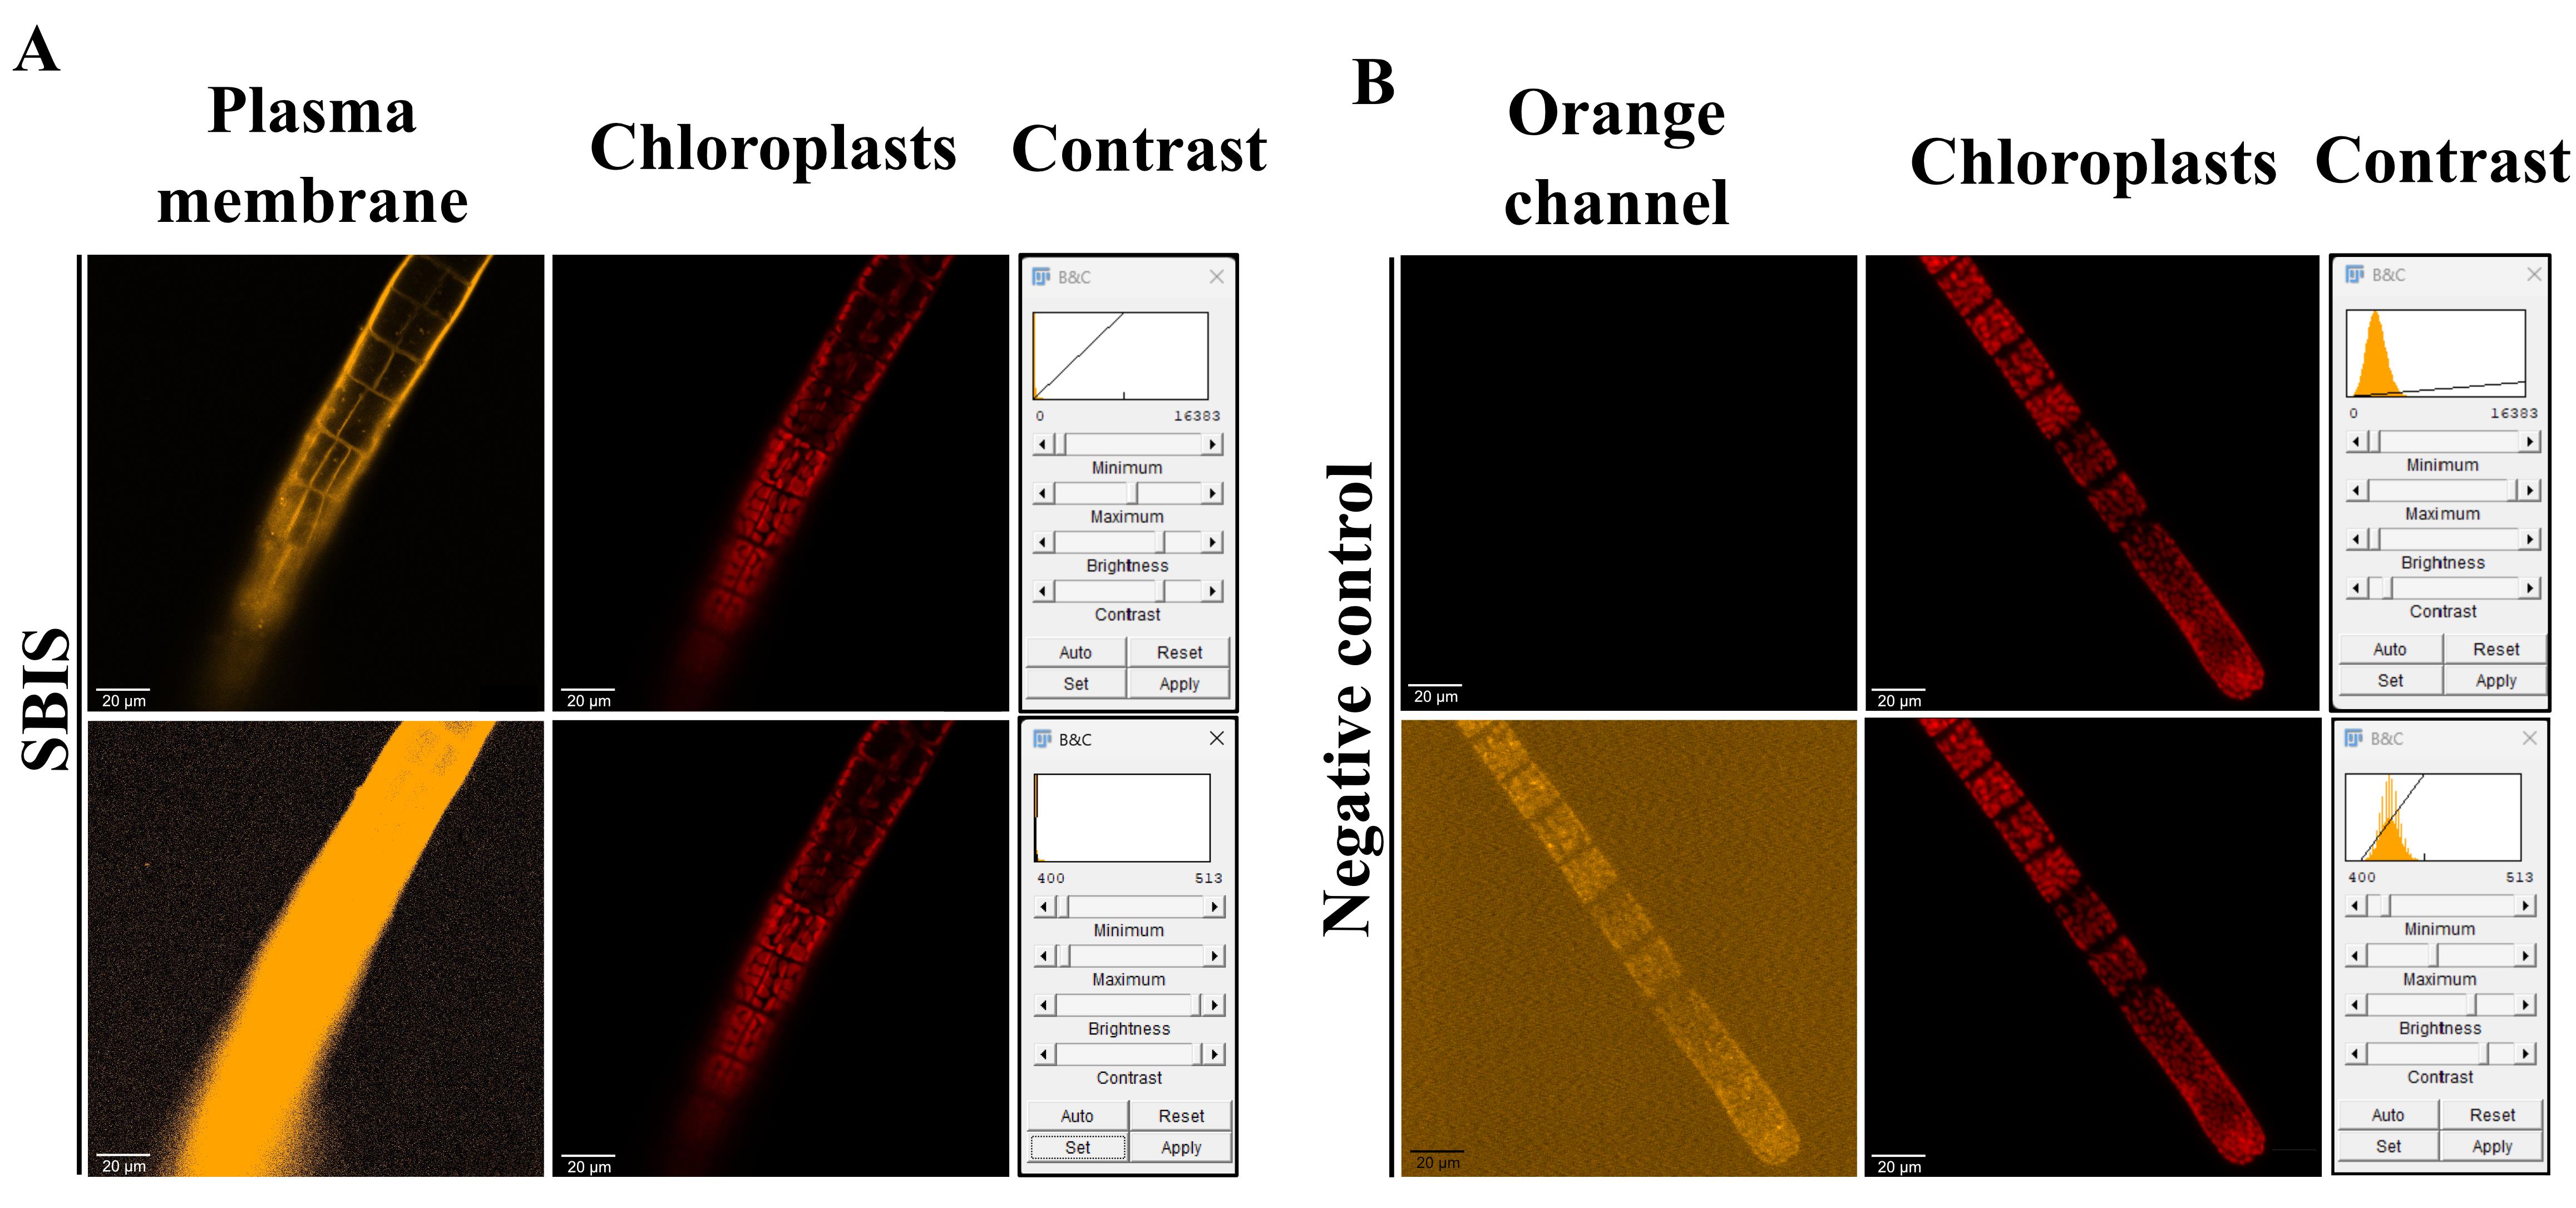
Figure 6. Negative control and styryl benzoindoleninium sulfonate (SBIS)-labeled contrast parameters. (A) Top panel: S. rigidula labeled with SBIS shows fluorescence signal in the plasma membrane (orange). Bottom panel: high-contrast parameters applied to SBIS-labeled S. rigidula resulted in an oversaturated signal. (B) S. rigidula not labeled with SBIS was used as a negative control. Top panel: No fluorescence can be observed when applying experimental contrast parameters. Bottom panel: High-contrast parameters resulted in the visualization of autofluorescence and background noise. Orange channel: Exc 561/Em 578–632; chloroplasts auto-fluorescence: Exc 561/Em 674–721. Scale bar, 20 μm.
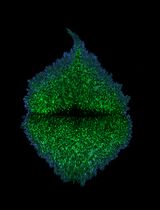
To visualize the overall shape of a brown algal tissue, we recommend using a light sheet microscope. This imaging technique allows the brown algal embryo or filament to be observed in its entirety and at the cellular level. For example, in the case of CFW and SBIS labeling of an S. rigidula filament, we are able to visualize the shape of each cell composing the S. rigidula filament. In particular, using an ortho-slice in the x,z axis (where x is the horizontal axis and z is the depth axis), we are able to visualize the entire outline of the cells without losing any information, particularly in depth, thus along the z axis. Furthermore, using a light sheet microscope allows the general structure of the S. rigidula filament to be observed. Thanks to labeling with CFW (cell wall), SBIS (plasma membrane), and the autofluorescence of the chloroplasts (which confirms that the alga is in good condition), this acquisition confirms the tubular shape of an S. rigidula filament (Figure 7B, Video 2).
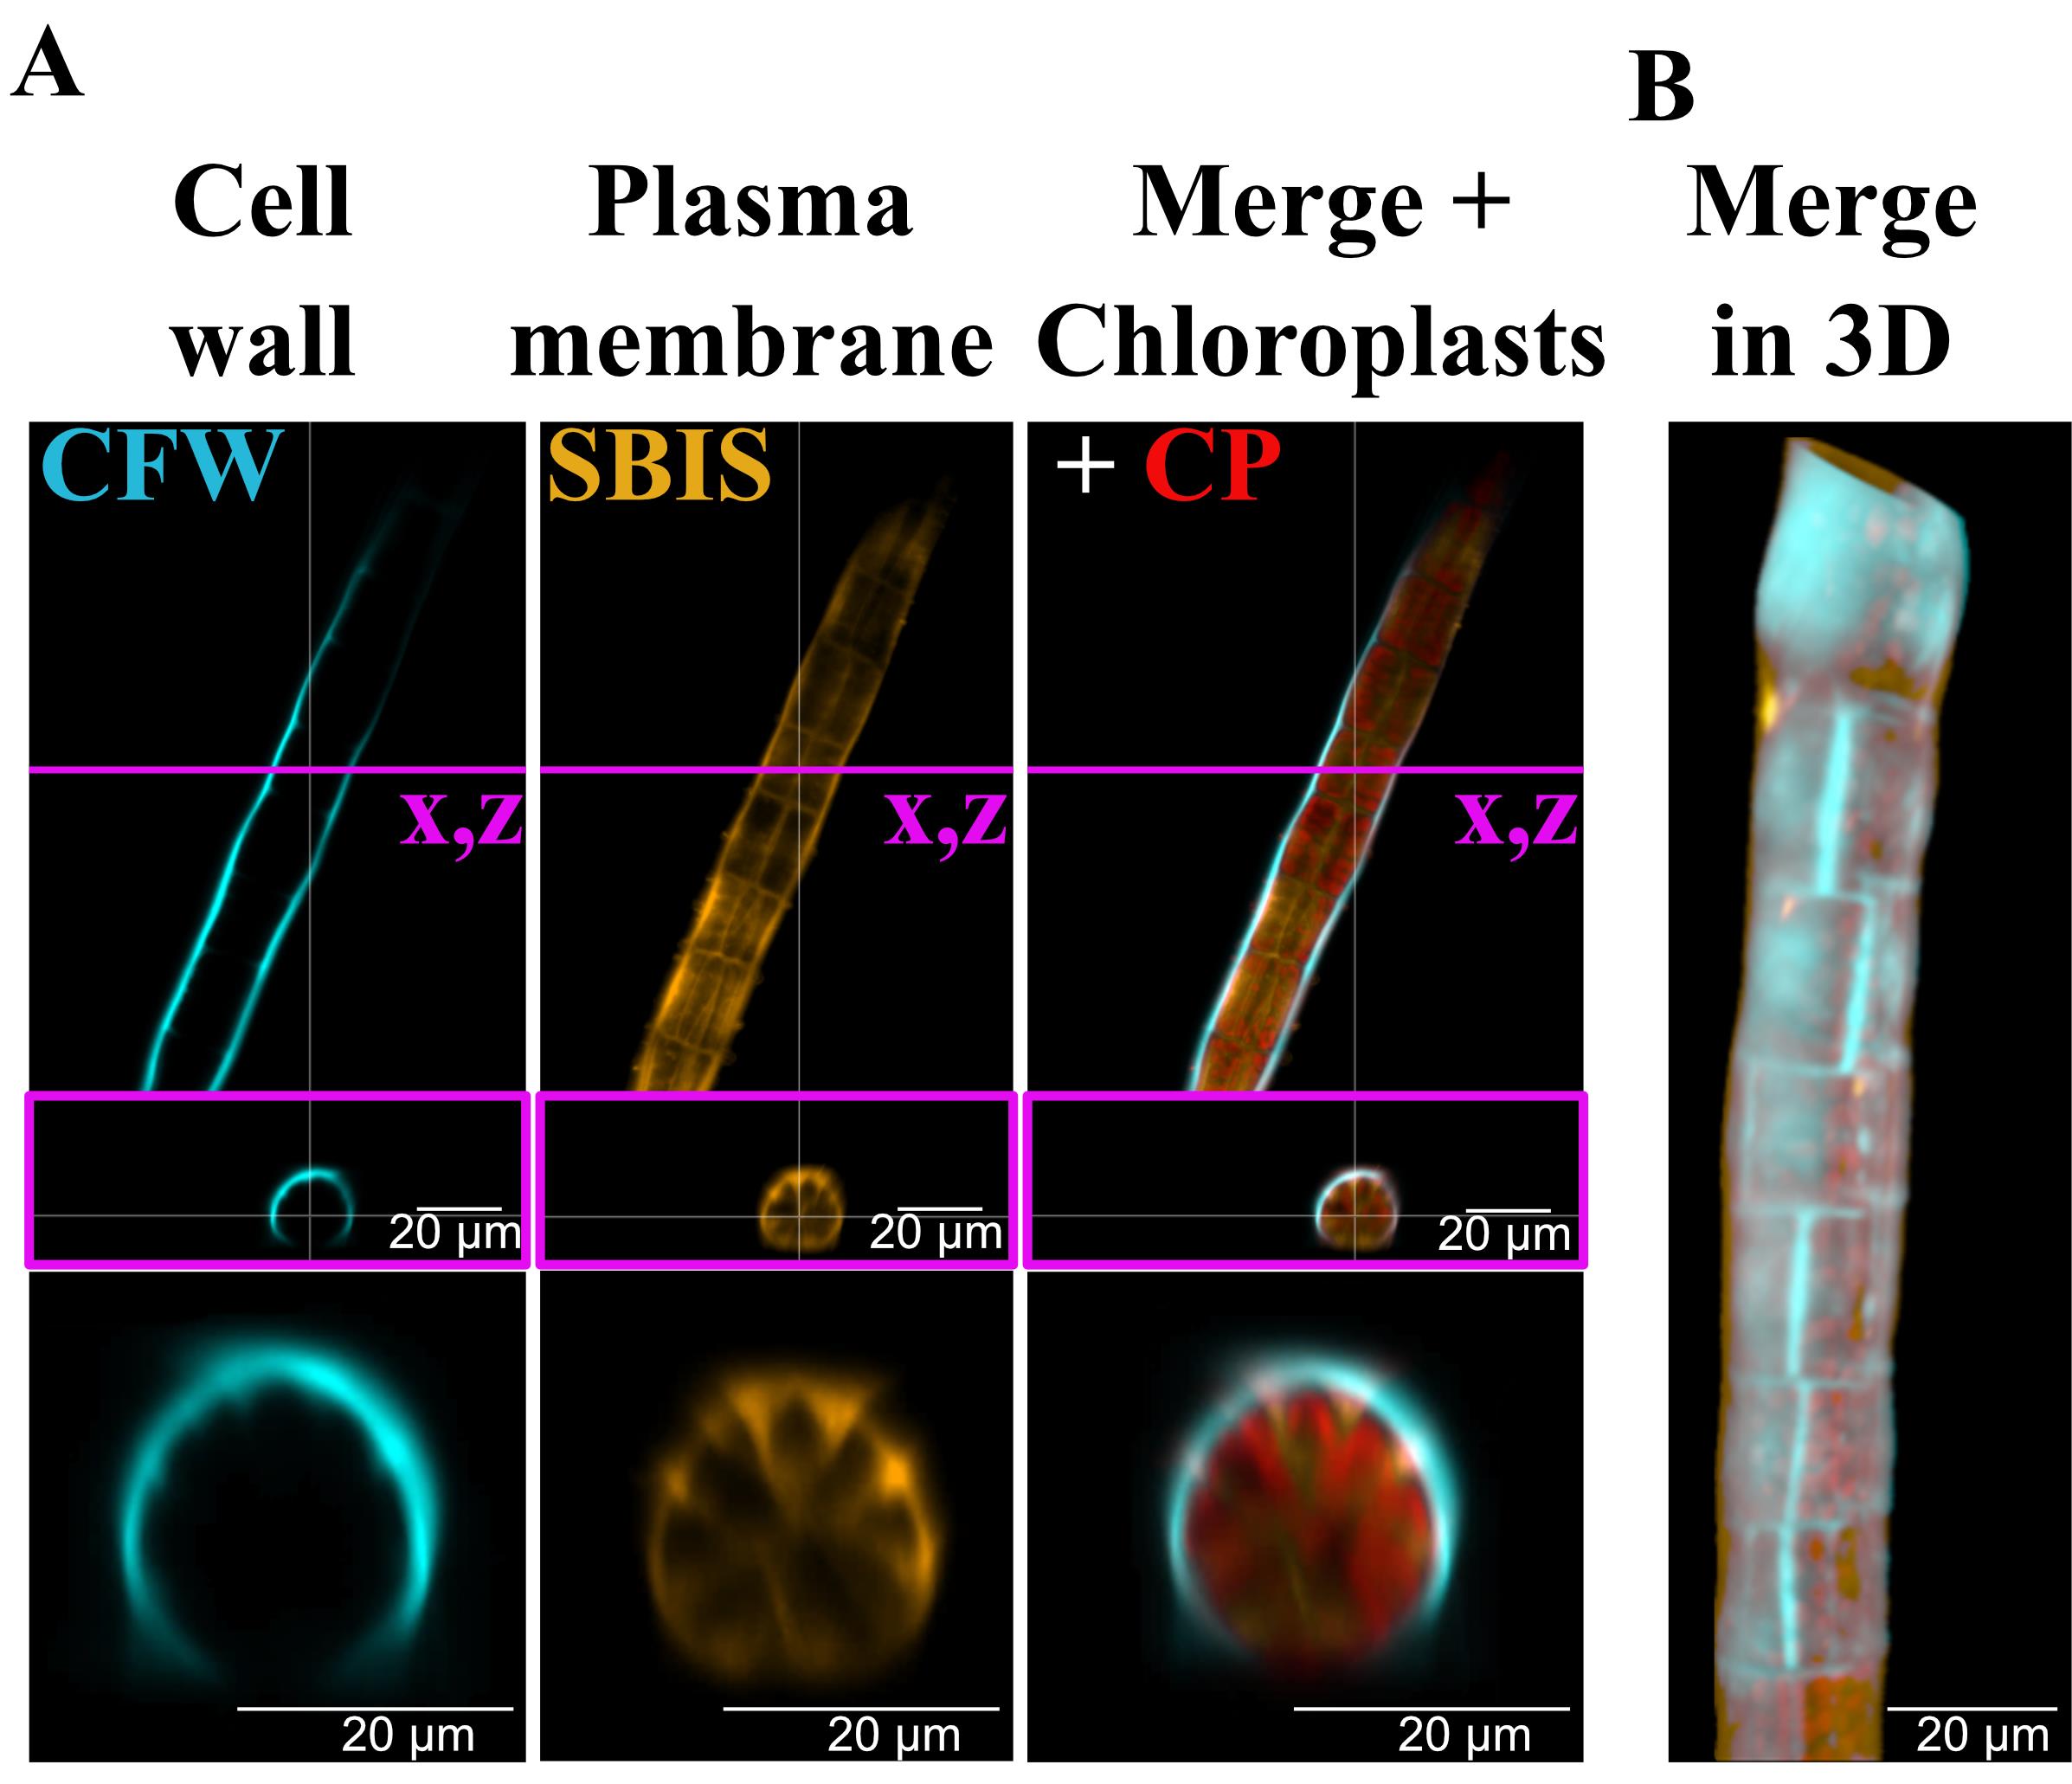
Figure 7. Calcofluor white (CFW) and styryl benzoindoleninium sulfonate (SBIS)-labeled S. rigidula acquired in 3D using a light sheet microscope. (A) Top panel: Ortho-slice in the x,z axis (outlined in magenta) of an S. rigidula filament labeled with CFW (in cyan) and SBIS (in orange) showing fluorescence signal, respectively, in the cell wall and plasma membrane. Chloroplasts’ (CP) autofluorescence is seen in red. Bottom panel: Enlargement of the ortho-slice in the x,z axis section. (B) 3D image of an S. rigidula filament acquired on the LS7 microscope. The cell wall is labeled with CFW (in cyan), the plasma membrane is labeled with SBIS (in orange), and the chloroplasts emit red autofluorescence. Scale bars, 20 μm.
Validation of protocol
The negative control for SBIS labeling can be found in the Data analysis section.
This protocol has been used and validated on Ectocarpus sp., S. rigidula, and S. latissima in the following research article:
Zilliox et al. [10]. SBIS, a new orange fluorescent vital probe for the 4D imaging of brown algal cells. Journal of Cell Science.
General notes and troubleshooting
Troubleshooting
Problem 1: The labeling of the plasma membrane is not very well defined.
Possible cause: SBIS can label bacteria that may be present on the surface of brown algal tissues.
Solution: Renew ASW in the brown algal culture 2–3 days before labeling and wash the brown algae thoroughly just before labeling. Ensure that you work under sterile conditions when handling brown algae, washing, labeling, and sealing.
Problem 2: Delays or abnormalities in tissue growth or embryonic development occur, or the tissue shows signs of apoptosis during 4D confocal imaging.
Possible cause: During the mounting of the tissue for the confocal in vivo imaging, the coverslip was pressed too hard on the tissue, resulting in injuries not visible under white light nor under the stereomicroscope.
Solution: When adding the coverslip, remove a maximum of water to help the suction of the coverslip on the glass, and gently press down to stabilize the coverslip.
Problem 3: Developmental problems occur, or the tissue shows signs of apoptosis during the light sheet 4D imaging.
Possible cause: During the mounting of the tissue for the light sheet in vivo imaging, the low-melting agarose was too hot when embedding the tissue.
Solution: When pipetting low-melting agarose, check that no condensation forms when depositing a droplet. Condensation means that the low-melting agarose is still too hot to transfer the tissues.
Problem 4: The light sheet image is blurred.
Possible cause: The light sheets are not perfectly aligned.
Solution: Make sure to align the light sheets before each experiment to ensure high-quality images.
Acknowledgments
This work was funded by the European Research Council (ALTER e-GROW, project number 101055148). Views and opinions expressed are those of the author(s) only and do not necessarily reflect those of the European Union or the European Research Council Executive Agency. Neither the European Union nor the granting authority can be held responsible for them.
Competing interests
The authors declare no conflicts of interest.
References
- Barrett, J., and Anderson, J. M., (1997). Thylakoid membrane fragments with different chlorophyll A, chlorophyll C and fuxoxanthin compositions isolated from the brown seaweed Ecklonia radiata. Plant Science Letters (9 275-283. https://doi.org/10.1016/0304-4211(77)90037-2
- Wang, W. J., Wang, G. C., Zhang, M. and Tseng, C. K. (2005). Isolation of Fucoxanthin from the Rhizoid of Laminaria japonica Aresch. J Integr Plant Biol. 47(8): 1009–1015. https://doi.org/10.1111/j.1744-7909.2005.00054.x
- Badis, Y., Scornet, D., Harada, M., Caillard, C., Godfroy, O., Raphalen, M., Gachon, C. M. M., Coelho, S. M., Motomura, T., Nagasato, C., et al. (2021). Targeted CRISPR‐Cas9‐based gene knockouts in the model brown alga Ectocarpus. New Phytol. 231(5): 2077–2091. https://doi.org/10.1111/nph.17525
- Clerc, T., Boscq, S., Attia, R., Kaminski Schierle, G. S., Charrier, B. and Läubli, N. F. (2022). Cultivation and Imaging of S. latissima Embryo Monolayered Cell Sheets Inside Microfluidic Devices. Bioengineering. 9(11): 718. https://doi.org/10.3390/bioengineering9110718
- Le Bail, A., Billoud, B., Maisonneuve, C., Peters, A. F., Mark Cock, J. and Charrier, B. (2008). Initial pattern of development of the brown alga Ectocarpus siliculosus (Ectocarpales, Phaeophyceae) sporophyte. J Phycol. 44(5): 1269–1281. https://doi.org/10.1111/j.1529-8817.2008.00582.x
- Boscq, S., Billoud, B., Theodorou, I., Joemmanbaks, T., Dufourt, T. and Charrier, B. (2024). MUM, a maternal unknown message, inhibits early establishment of the medio-lateral axis in the embryo of the kelp Saccharina latissima. Development. 151(20): e202732. https://doi.org/10.1242/dev.202732
- Starr, R. C. and Zeikus, J. A. (1993). Utex – the culture collection of algae at the University of Texas at Austin 1993 list of cultures1. J Phycol. 29: 1–106. https://doi.org/10.1111/j.0022-3646.1993.00001.x
- Le Bail, A. and Charrier, B. (2012). Culture Methods and Mutant Generation in the Filamentous Brown Algae Ectocarpus siliculosus. Methods Mol Biol. 323–332. https://doi.org/10.1007/978-1-62703-221-6_22
- Schindelin, J., Arganda-Carreras, I., Frise, E., Kaynig, V., Longair, M., Pietzsch, T., Preibisch, S., Rueden, C., Saalfeld, S., Schmid, B., et al. (2012). Fiji: an open-source platform for biological-image analysis. Nat Methods. 9(7): 676–682. https://doi.org/10.1038/nmeth.2019
- Zilliox, M., Collot, M. and Charrier, B. (2025). SBIS, a new orange fluorescent vital probe for the 4D imaging of brown algal cells. J Cell Sci. 138(19): e263932. https://doi.org/10.1242/jcs.263932
Article Information
Publication history
Received: Mar 11, 2026
Accepted: May 5, 2026
Available online: Jun 10, 2026
Published: Jul 5, 2026
Copyright
© 2026 The Author(s); This is an open access article under the CC BY-NC license (https://creativecommons.org/licenses/by-nc/4.0/).
How to cite
Zilliox, M. and Charrier, B. (2026). 4D Imaging of Brown Algal Cells. Bio-protocol 16(13): e5730. DOI: 10.21769/BioProtoc.5730.

 Download Citation in RIS Format
Category
Plant Science > Phycology > Cell analysis
Cell Biology > Cell imaging > Live-cell imaging
Cell Biology > Cell imaging > Confocal microscopy
Do you have any questions about this protocol?
Post your question to gather feedback from the community. We will also invite the authors of this article to respond.
 Post a Question


