


- Protocols

- Articles and Issues
- For Authors
- About
- Become a Reviewer


Efficiency-Corrected Relative Quantification of qPCR Data Using LinRegPCR and a Spreadsheet-Based Workflow

(§Technical contact: louis.muller@vet-alfort.fr) Published: Vol 16, Iss 13, Jul 5, 2026 DOI: 10.21769/BioProtoc.5729 Views: 339
Reviewed by: Elena A. OstrakhovitchAnonymous reviewer(s)
 PDF
PDF  Ask a question
Advertisement


Protocol Collections
Comprehensive collections of detailed, peer-reviewed protocols focusing on specific topics





Abstract
Quantitative real-time PCR (qPCR) is widely used for the quantitative assessment of relative transcript abundance in biological and medical research. Rigorous interpretation of qPCR data requires appropriate correction and normalization workflows that account for both technical variability and experimental heterogeneity. Regarding the correction step, the most used qPCR analysis relies on the 2-ΔΔCq method, which assumes identical and optimal amplification efficiencies across assays. Alternative strategies estimate amplification efficiencies using standard curves generated from serial dilutions, but these approaches require additional experimental work and may introduce serious dilution-related bias. Here, we describe a spreadsheet-based computational protocol for the correction of relative quantification of qPCR data that integrates amplification efficiencies derived directly from raw amplification curves using LinRegPCR. Cq values and per-reaction efficiency estimates are combined to calculate efficiency-corrected target quantities. Correction is then followed by normalization using the geometric mean of two reference genes. The workflow enables calculation of relative abundance fold-changes without the need for standard curves and produces output tables suitable for downstream statistical analysis. This protocol provides a transparent, dilution-free method for efficiency-corrected qPCR data analysis that can be implemented using commonly available software, facilitating reproducible and Minimum Information for Publication of Quantitative Real-Time PCR Experiments (MIQE)-compliant reporting of qPCR results.
Key features
• Enables per-reaction efficiency correction using amplification curve-derived efficiencies instead of assuming uniform PCR performance across assays.
• Offers relative quantification without standard curves, reducing experimental workload and avoiding dilution-associated bias.
• Integrates multiple reference genes using geometric mean normalization to improve robustness of abundance estimates.
• Provides a transparent, spreadsheet-based workflow compatible with routine laboratory software and downstream statistical analysis.
Keywords: Reproducible research workflows PCR data quality control
Reference gene validation
RT-qPCR normalization strategies
Biostatistical analysis of transcript abundance
PCR data quality control
Reference gene validation
RT-qPCR normalization strategies
Biostatistical analysis of transcript abundance
Graphical overview

Overview of the efficiency-corrected quantitative real-time PCR (qPCR) data analysis workflow
Background
Quantitative PCR (qPCR) is one of the most widely used techniques for assessing relative transcript abundance due to its sensitivity, broad dynamic range, and accessibility [1]. It is a central method for validation of high-throughput transcriptomic data, such as RNA-seq, by providing an independent confirmation of differentially abundant RNA species identified with omics global analyses. In most routine applications, qPCR data are summarized using cycle quantification (Cq) values, which are then converted into relative abundance estimates through mathematical models [2]. In accordance with the Minimum Information for Publication of Quantitative PCR Experiments (MIQE) guidelines, the term Cq is used in this protocol instead of the historical cycle threshold (Ct) value [3].
The 2-ΔΔCq method is the most widely used approach for relative quantification and is based on the assumption that amplification efficiencies are identical and close to optimal across all assays [4]. Although this assumption is sometimes approximately valid, amplification efficiency can vary dramatically between primer sets, samples, and even individual reactions [5]. Such variability may introduce systematic bias when efficiency differences are not taken into account [6]. To address these limitations, efficiency-corrected quantification models have been proposed to incorporate amplification efficiency into relative abundance calculations [7]. To do so, amplification efficiency is often estimated using standard curves generated from serial dilutions [8]. However, this strategy requires additional experimental steps and is sensitive to both dilution errors and variable levels of PCR inhibitors between samples [9].
An alternative method consists of estimating amplification efficiency directly from the exponential phase of individual amplification curves. Different approaches have been described, allowing estimation of per-reaction efficiency without relying on dilution series and providing a more direct representation of reaction performance [10]. Among these, LinRegPCR is a widely used and validated tool that derives efficiencies from the log-linear phase of each amplification curve [11]. In this protocol, efficiencies derived from amplification curve analyses with the LinRegPCR tool are integrated into a spreadsheet-based workflow to compute efficiency-corrected target quantities, normalize abundance using multiple reference genes, and calculate relative fold changes. This computational approach facilitates transparent and reproducible qPCR data analysis while remaining compatible with commonly available laboratory software, being completely in phase with current best practices for qPCR experiments, as summarized in the new version of MIQE guidelines [12].
Software and datasets
1. Data, qPCR amplification data (RDML format), 1.2 or newer, open standard
2. LinRegPCR (web-based application), accessed April 2026, https://v1-8-1.rdml-tools.com/linregpcr.html
3. Microsoft Excel, any version supporting basic mathematical functions, proprietary, paid
Procedure
A. Export qPCR data in RDML format
1. Open the qPCR experiment file in the instrument software used for data acquisition.
2. Navigate to the data export options and export the experiment results in the RDML (Real-time PCR Data Markup Language) format.
3. Save the RDML file locally for downstream analysis.
Note: RDML is an open, platform-independent standard. Most qPCR instrument software packages provide an RDML export option, although the exact menu pathway may vary between manufacturers.
B. Estimate amplification efficiency using LinRegPCR
1. Open the LinRegPCR web application (https://v1-8-1.rdml-tools.com/linregpcr.html) in a web browser.
2. Upload the RDML file generated previously (Figure 1, step 1).
3. Use the default analysis parameters and run the LinRegPCR analysis in the LinRegPCR section (Figure 1, step 2).
4. After completion, copy the output table containing per-reaction amplification efficiency values (Figure 1, step 3).
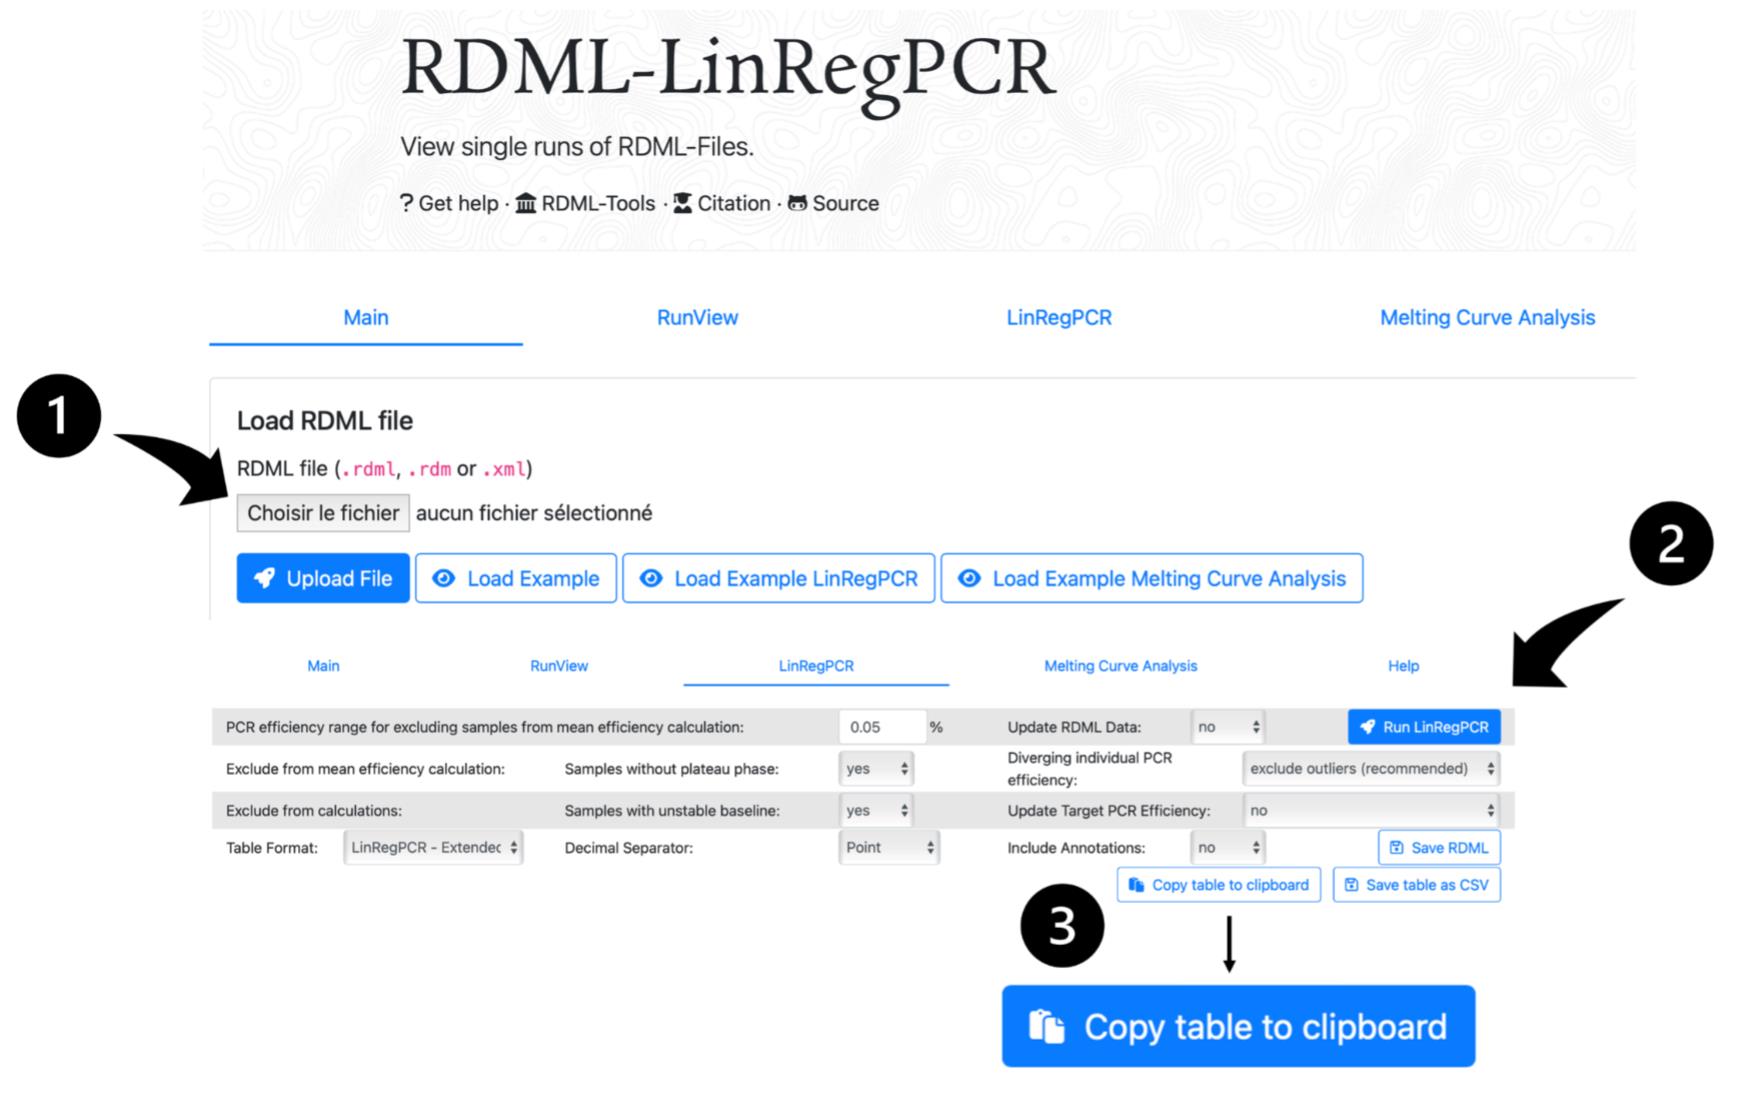
Figure 1. Overview of the LinRegPCR interface. 1. Main section to select and upload file. 2. LinRegPCR section with settings. Keep default setting and click Run LinRegPCR. 3. Click Copy table to clipboard after completion of the run.
C. Transfer amplification efficiency values to the spreadsheet
1. Open the preformatted spreadsheet template provided with this protocol (qPCR_analysis_template.xlsx), available as Supplementary File S1.
2. Paste the LinRegPCR output table into the proper LinRegPCR worksheet tab corresponding to the analyzed qPCR plate.
3. Identify the column named indiv PCR eff (Figure 2A).
4. Copy values from this column to the Efficiencies worksheet of the “qPCR_analysis_template.xlsx” file (Figure 2B).
Note: Amplification efficiency values must be manually copied from the LinRegPCR output (column indiv PCR eff) and pasted into the designated cells of the LinRegPCR worksheets. Once entered, mean efficiencies across technical replicates for each primer pair and condition are automatically calculated in the Efficiencies worksheet using predefined formulas and do not require any additional manual computation. Primer pairs should be considered acceptable only if the calculated mean efficiency falls within a reasonable range (e.g., 1.7–1.9), as recommended for efficiency-corrected qPCR analysis.
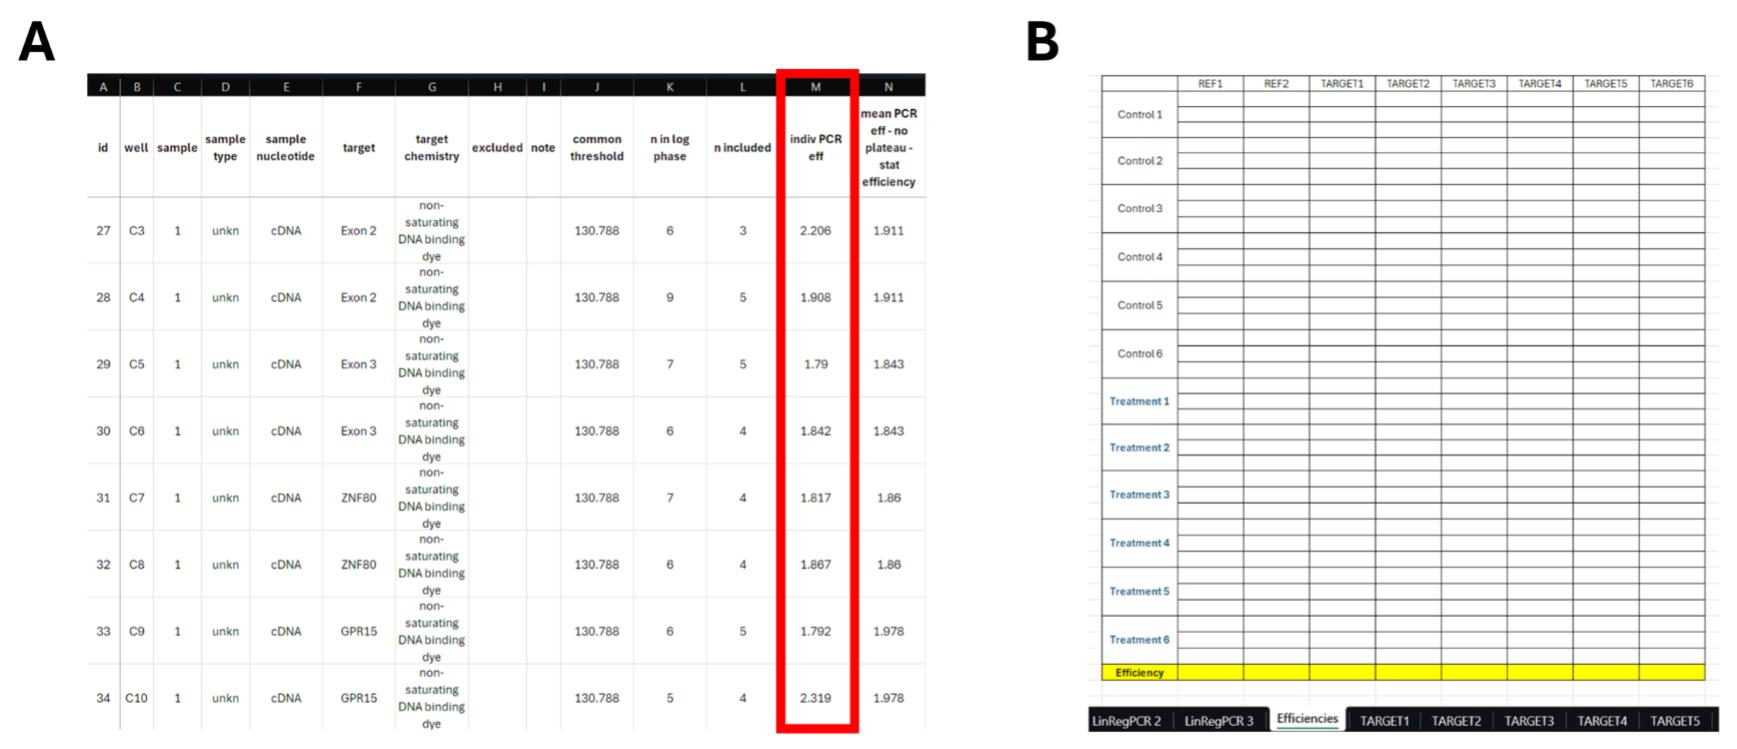
Figure 2. Overview of the LinRegPCR and Efficiencies worksheets. (A) LinRegPCR 1 worksheet. Individual PCR efficiencies are displayed in column M. (B) Efficiencies worksheet in the “qPCR_analysis_template.xlsx” file. The last line corresponds to the arithmetic mean of all individual efficiencies for a given gene.
D. Calculate efficiency-corrected relative abundance and fold changes
1. In the “qPCR_analysis_template.xlsx” file, navigate to the worksheet corresponding to each target (gene) included in the analysis (Figure 3).
2. Enter Cq values for all biological samples and technical replicates in the designated cells.
3. The spreadsheet automatically computes the relative abundance of transcripts for each gene.
4. Target transcript abundance values are normalized to the geometric mean of the reference genes to generate relative fold-change values.
Note: The spreadsheet template is preconfigured for normalization using two reference genes, as an example. If a different number of reference genes is used, normalization can be adapted by simplifying or extending the geometric mean calculation, while the overall workflow and normalization principle remain unchanged.

Figure 3. Overview of a Target worksheet. Cells inside the red box must be filled in, enabling the automatic completion of all cells to the right of the red box. The fold change for each control and each “Treatment” is equal to the individual normalized quantity (Nq) divided by the mean Nq value of the controls. The mean fold change corresponds to the average of the selected fold change values.
Result interpretation
This protocol generates efficiency-corrected relative abundance values and fold change estimates from Cq values and per-reaction amplification efficiencies. All calculations are made at the sample level using mean values derived from technical replicates.
For each gene and each sample, Cq values and amplification efficiencies obtained from technical replicates are first averaged. Relative quantities (Rq) are then calculated using these mean values:
where Efficiencygene is the mean amplification efficiency across replicates, and Cq is the corresponding mean quantification cycle.
Normalization is then performed using two reference genes. This factor is calculated as the geometric mean of the reference gene quantities:
The normalized quantity (Nq) for each target gene is then calculated as:
To express results relative to a control condition, a calibrator value is defined as the arithmetic mean of normalized quantities across all control samples:
Fold change for each sample is finally computed as:
In the template, this calibrator is computed automatically from the control group and applied directly within the fold change column. As a result, fold changes are obtained by scaling normalized quantities relative to the mean control level without needing an explicit intermediate step. By construction, the average fold change of the control group is equal to 1.
Because calculations are based on efficiency-corrected quantities, fold change values may differ from those obtained with classical methods. The protocol does not include any statistical testing or biological interpretation. Downstream analysis and interpretation should be performed separately, considering experimental design, reference gene stability, and data quality.
Validation of protocol
This protocol was validated using a representative, anonymized qPCR dataset derived from real experimental data. The validation dataset consisted of two experimental groups, designated Control and Treatment, with six biological samples per group (Control 1–6 and Treatment 1–6).
For validation purposes, one representative target gene (labeled TARGET1) and two reference genes (REF1 and REF2) were included. Raw qPCR data had been previously processed to obtain Cq values and amplification efficiencies using LinRegPCR. In the validation dataset, amplification efficiency values derived from LinRegPCR analyses were directly entered into the Efficiencies worksheet of the spreadsheet template (Figure 4A).
Cq values for all samples were entered into the preexisting worksheets corresponding to the target and reference genes. The spreadsheet template automatically computed efficiency-corrected relative quantities, performed normalization using the geometric mean of the two reference genes, and calculated fold-change values relative to the control group. No manual calculation or modification of formulas was required during validation (Figure 4B).
The validation confirmed that the workflow successfully integrates Cq values and amplification efficiencies to produce normalized relative abundance and fold-change outputs in a reproducible manner. The pre-filled spreadsheet used for validation is provided as Supplementary File S2 and illustrates the expected input format and output structure generated by the protocol.
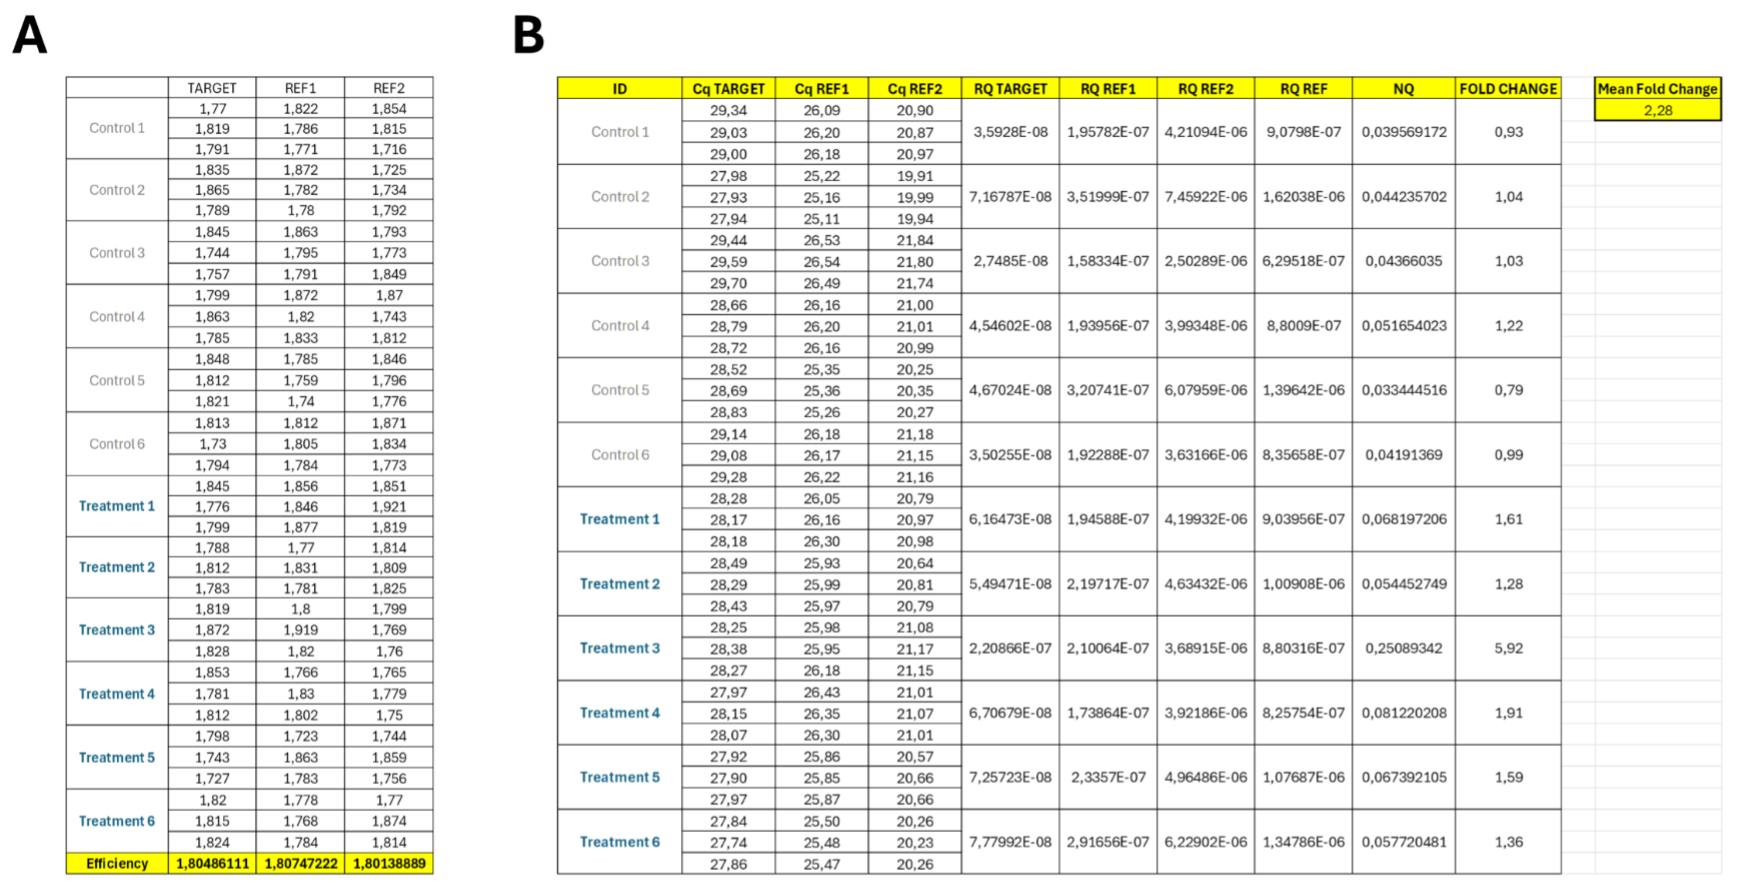
Figure 4. Validation of the spreadsheet-based workflow. (A) Efficiencies worksheet. For each sample, values obtained from LinRegPCR are pasted in the TARGET and REF columns. In this example, technical triplicates were run for each sample and gene. (B) Overview of results obtained with validation data. The mean fold change value reflects the Treatment group, where TARGET gene transcripts are 2.28-fold more abundant than in controls.
General notes and troubleshooting
General notes
1. This protocol describes a computational workflow for efficiency-corrected qPCR data analysis and does not include any wet-lab procedures. The quality of the results depends on the quality of the input qPCR data.
2. Amplification efficiencies used in this protocol are derived from LinRegPCR analyses. Efficiencies should be within a reasonable range (between 1.7 and 1.9). Values outside this range may indicate suboptimal amplification or poor curve quality and should be reviewed before inclusion [11].
3. The spreadsheet template is preconfigured for normalization using two reference genes. If a different number of reference genes is used, normalization can be adapted by simplifying or extending the geometric mean calculation, without altering the overall workflow. It is not recommended to use fewer than two reference genes for normalization [13].
4. The template is initially configured for a two-group comparison as an example. The number of biological samples per group can be adapted by duplicating or deleting rows as needed. If the number of samples in a group is changed, summary calculations that rely on fixed ranges (like control-group mean values used for normalization and fold-change calculus) must be updated accordingly, while per-sample calculations remain unchanged.
5. All calculations, including efficiency-corrected relative quantity estimation, reference gene normalization, and fold-change computation, are performed automatically by the spreadsheet template once Cq values and efficiencies are entered.
Troubleshooting
Problem 1: Amplification efficiencies fall outside the expected range.
Possible causes: Poor amplification quality or incorrect baseline determination.
Solutions: Redesign primer pairs or exclude reactions with abnormal curves and amplification efficiencies.
Problem 2: Spreadsheet outputs do not update automatically.
Possible cause: Cells containing formulas may have been overwritten during data input. This can happen, for example, when pasting data into incorrect worksheet areas or using “paste” instead of “paste values only,” which may replace existing formulas.
Solutions: Restore the original template or re-enter data only in designated input cells.
Problem 3: Additional samples or groups are needed.
Possible cause: Experimental design differs from the example configuration.
Solution: Duplicate or delete rows as needed without modifying underlying formulas.
Supplementary information
The following supporting information can be downloaded here:
1. Supplementary File S1 – qPCR_analysis_template.xlsx
2. Supplementary File S2 – qPCR_validation_dataset.xlsx
Acknowledgments
Conceptualization, Investigation and Writing—Original Draft, L.A.M.; Figures, L.A.M. and L.T.; Review & Editing, L.T.; Funding acquisition and Supervision, L.T. Financial support was obtained from the “Association Française contre les Myopathies” (AFM-Téléthon) via TRANSLAMUSCLE I and II programs (projects 19507 and 22946) and the “Fonds de dotation Patrick de Brou de Laurière.”
Competing interests
The authors declare no conflicts of interest.
References
- Arya, M., Shergill, I. S., Williamson, M., Gommersall, L., Arya, N. and Patel, H. R. (2005). Basic principles of real-time quantitative PCR. Expert Rev Mol Diagn. 5(2): 209–219. https://doi.org/10.1586/14737159.5.2.209
- Yuan, J. S., Reed, A., Chen, F. and Stewart, C. N. (2006). Statistical analysis of real-time PCR data. BMC Bioinf. 7(1): e1186/1471–2105–7–85. https://doi.org/10.1186/1471-2105-7-85
- Bustin, S. A., Benes, V., Garson, J. A., Hellemans, J., Huggett, J., Kubista, M., Mueller, R., Nolan, T., Pfaffl, M. W., Shipley, G. L., et al. (2009). The MIQE Guidelines: Minimum Information for Publication of Quantitative Real-Time PCR Experiments. Clin Chem. 55(4): 611–622. https://doi.org/10.1373/clinchem.2008.112797
- Livak, K. J. and Schmittgen, T. D. (2001). Analysis of Relative Gene Expression Data Using Real-Time Quantitative PCR and the 2−ΔΔCT Method. Methods. 25(4): 402–408. https://doi.org/10.1006/meth.2001.1262
- Lievens, A., Van Aelst, S., Van den Bulcke, M. and Goetghebeur, E. (2011). Enhanced analysis of real-time PCR data by using a variable efficiency model: FPK-PCR. Nucleic Acids Res. 40(2): e10–e10. https://doi.org/10.1093/nar/gkr775
- Bar, T. (2003). Kinetic Outlier Detection (KOD) in real-time PCR. Nucleic Acids Res. 31(17): 105e–105. https://doi.org/10.1093/nar/gng106
- Pfaffl, M. W. (2001). A new mathematical model for relative quantification in real-time RT-PCR. Nucleic Acids Res. 29(9): 45e–45. https://doi.org/10.1093/nar/29.9.e45
- Larionov, A., Krause, A. and Miller, W. (2005). A standard curve based method for relative real time PCR data processing. BMC Bioinf. 6(1): e1186/1471–2105–6–62. https://doi.org/10.1186/1471-2105-6-62
- Ruijter, J. M., Barnewall, R. J., Marsh, I. B., Szentirmay, A. N., Quinn, J. C., van Houdt, R., Gunst, Q. D. and van den Hoff, M. J. B. (2021). Efficiency Correction Is Required for Accurate Quantitative PCR Analysis and Reporting. Clin Chem. 67(6): 829–842. https://doi.org/10.1093/clinchem/hvab052
- Ruijter, J. M., Pfaffl, M. W., Zhao, S., Spiess, A. N., Boggy, G., Blom, J., Rutledge, R. G., Sisti, D., Lievens, A., De Preter, K., et al. (2013). Evaluation of qPCR curve analysis methods for reliable biomarker discovery: Bias, resolution, precision, and implications. Methods. 59(1): 32–46. https://doi.org/10.1016/j.ymeth.2012.08.011
- Untergasser, A., Ruijter, J. M., Benes, V. and van den Hoff, M. J. B. (2021). Web-based LinRegPCR: application for the visualization and analysis of (RT)-qPCR amplification and melting data. BMC Bioinf. 22(1): e1186/s12859–021–04306–1. https://doi.org/10.1186/s12859-021-04306-1
- Bustin, S. A., Ruijter, J. M., van den Hoff, M. J. B., Kubista, M., Pfaffl, M. W., Shipley, G. L., Tran, N., Rödiger, S., Untergasser, A., Mueller, R., et al. (2025). MIQE 2.0: Revision of the Minimum Information for Publication of Quantitative Real-Time PCR Experiments Guidelines. Clin Chem. 71(6): 634–651. https://doi.org/10.1093/clinchem/hvaf043
- Vandesompele, J., De Preter, K., Pattyn, F., Poppe, B., Van Roy, N., De Paepe, A. and Speleman, F. (2002). Accurate normalization of real-time quantitative RT-PCR data by geometric averaging of multiple internal control genes. Genome Biol. 3(7): e1186/gb–2002–3–7–research0034. https://doi.org/10.1186/gb-2002-3-7-research0034
Article Information
Publication history
Received: Feb 26, 2026
Accepted: May 18, 2026
Available online: Jun 3, 2026
Published: Jul 5, 2026
Copyright
© 2026 The Author(s); This is an open access article under the CC BY-NC license (https://creativecommons.org/licenses/by-nc/4.0/).
How to cite
Müller, L. A. and Tiret, L. (2026). Efficiency-Corrected Relative Quantification of qPCR Data Using LinRegPCR and a Spreadsheet-Based Workflow. Bio-protocol 16(13): e5729. DOI: 10.21769/BioProtoc.5729.

 Download Citation in RIS Format
Category
Bioinformatics and Computational Biology
Molecular Biology > RNA > qRT-PCR
Do you have any questions about this protocol?
Post your question to gather feedback from the community. We will also invite the authors of this article to respond.
 Post a Question


