


- Protocols

- Articles and Issues
- For Authors
- About
- Become a Reviewer


An In Vitro A-431 Epithelial Cell Infection Model for Studying Fungal Pathogenicity and Immune Responses Associated With Vulvovaginal Candidiasis

Published: Vol 16, Iss 10, May 20, 2026 DOI: 10.21769/BioProtoc.5693 Views: 749
Reviewed by: Alba BlesaDamián Lobato-MárquezAnonymous reviewer(s)
 PDF
PDF  Ask a question
Original research article
The authors used this protocol in:

Jul 2025
Advertisement



Protocol Collections
Comprehensive collections of detailed, peer-reviewed protocols focusing on specific topics




Related protocols
Abstract
Vulvovaginal candidiasis (VVC), also known as vaginal thrush, is an infection of the vulvovaginal mucosa caused by fungi of the Candida genus. Particularly for patients suffering from recurrent infection, the disease has a significant impact on their quality of life. The still unknown aspects of disease pathogenesis, as well as factors driving the development of infections and recurrence, represent a challenge for both clinical practitioners and patients. Mouse models and patient studies have suggested important roles of the microbiome, deployment of fungal pathogenicity mechanisms in the vagina, and dysregulated immune responses for VVC pathology. Dissecting their individual contributions can reveal specific processes associated with infection and may inspire novel therapeutic strategies. Epithelial in vitro infection models have been playing a key role in dissecting a crucial interaction during VVC, the invasion and infection of the vaginal mucosa. They have been instrumental in characterizing candidalysin as a fungal toxin that damages epithelial cells and elicits initial inflammatory responses to catalyze downstream inflammation. Moreover, they have also revealed potential protective immune pathways. Such a standardized epithelial cell infection model offers high versatility and compatibility with different downstream assays to link epithelial responses with other processes during VVC. This protocol describes a general A-431 vulvovaginal epithelial cell–Candida infection model in detail and provides several adaptations, such as live-cell imaging and mRNA silencing, as well as possible follow-up readouts, like the quantification of cytokine release, cytotoxicity, and neutrophil recruitment to study diverse processes relevant to VVC research.
Key features
• This protocol describes the use of the A-431 epidermoid carcinoma cell line as an in vitro infection model of vulvovaginal candidiasis.
• The protocol can be adapted to answer research questions relevant to vulvovaginal candidiasis (epithelial damage, release of inflammatory cytokines, recruitment and activation of neutrophils).
• Live-cell imaging can be used to study dynamic infection processes.
• mRNA silencing can be applied to interrogate the function of genes of interest in the host–pathogen interaction.
Keywords: Candida albicans Epithelial infection model
Cytotoxicity
Cytokine release
Neutrophil recruitment
Live-cell imaging
A-431 cells
In vitro
Epithelial infection model
Cytotoxicity
Cytokine release
Neutrophil recruitment
Live-cell imaging
A-431 cells
In vitro
Graphical overview
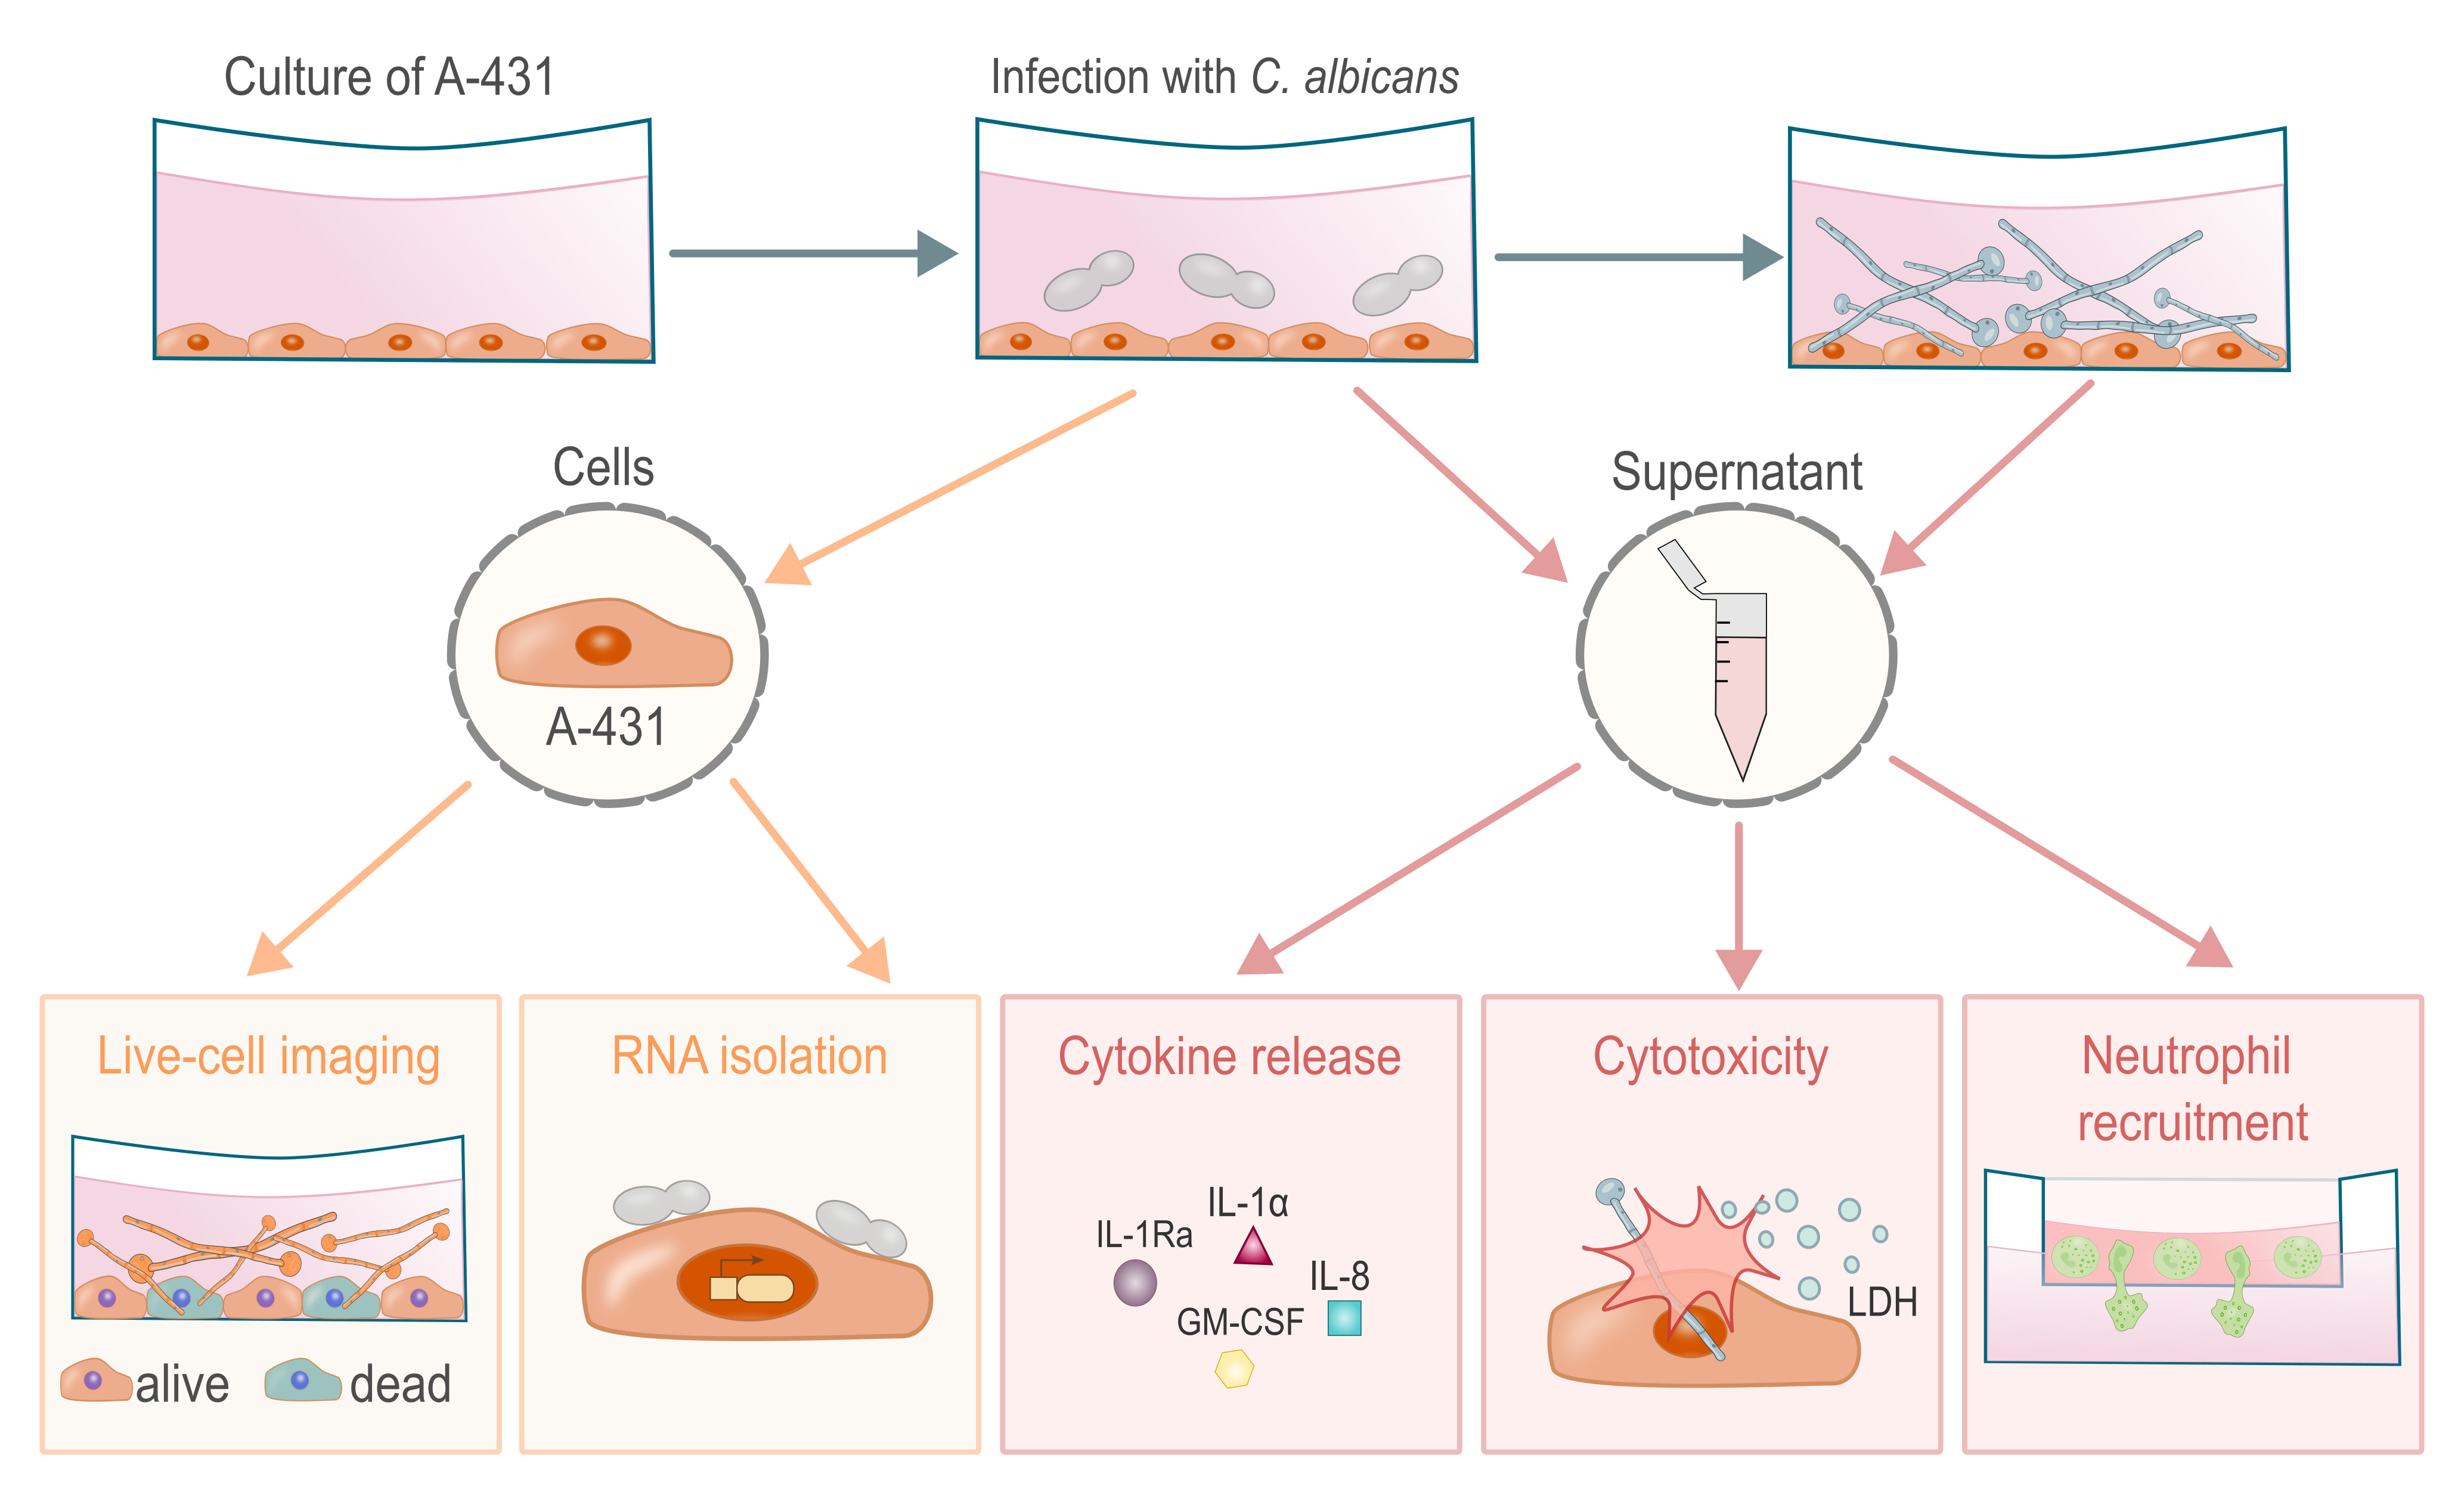
Experimental readouts of the vulvovaginal epithelial infection model with C. albicans. The epithelial cell line A-431 is infected with C. albicans yeast cells, which germinate over the course of infection. During this process, epithelial immune responses can be characterized by directly evaluating the epithelial cells with live-cell imaging and RNA isolation and by analyzing secreted molecules in the supernatant, such as cytokines and cytoplasmic lactate dehydrogenase (LDH) as a marker of cell lysis. Downstream processes on relevant effector cells can be assessed, for example, through neutrophil chemotaxis or activation assays.
Background
Vulvovaginal candidiasis (VVC) is a yeast infection of the vulvar and vaginal mucosa, most commonly caused by Candida albicans [1]. In the majority of women, this infection is linked to predisposing factors like antibiotic use and can be treated by a short course of antifungal therapy [1,2]. Still, 7%–9% of women experience recurrent infection (RVVC), defined by at least four episodes annually [3,4]. Their quality of life, including social and mental health factors, is severely burdened because of the associated discomfort, caused by curdy vaginal discharge, itching, pain, burning, redness, and swelling, as well as persistent medical costs [5–7]. Unlike other fungal infections, the disease severity of VVC is strongly intertwined with exacerbated inflammatory responses during infection, rather than being caused by compromised immunity [8–12]. While RVVC can be treated using fluconazole maintenance therapy to control the fungal burden [13], highly effective diagnostics predicting RVVC flares and sustainable therapeutic strategies are urgently needed [5].
The current state of knowledge on pathogenesis and therapy of (R)VVC has been established based on patient studies [14–22], a seminal study using an experimental human infection model [10], and VVC mouse models [23–35]. Moreover, in vitro infection models have been instrumental in the molecular dissection of cellular processes at the fungal–epithelial interface that cause tissue damage and catalyze inflammation [11,36–43].
The epidermoid carcinoma cell line A-431 is a well-established infection model of human vulvovaginal epithelial cells with Candida species [36–49]. This cell model has contributed to dissecting the molecular pathways underlying candidalysin cytotoxicity and induction of epithelial inflammatory responses driving neutrophil recruitment and activation, which is similarly observed in vivo [34,36,40,41,50,51]. In vitro epithelial infection, similar to the in vivo model, suggests a distinct phenotype of VVC caused by non-albicans species compared to C. albicans [39,41,52]. Similarly, type I interferon signaling has been linked to resistance to C. albicans infection in both in vivo and in vitro epithelial infection models [41,53–55].
A-431 cells are highly versatile due to their easy maintenance, compatibility with RPMI-1640 culture medium (which allows for co-culture with primary human immune cells or transfer of their supernatant), biosafety level, and genetic tractability. Some studies have cross-validated responses of the A-431 vulvovaginal epithelial infection model with primary human epithelial cells [41] or in vivo responses [34,36,56].
Here, we provide a step-by-step protocol based on multiple studies [38,40–42] demonstrating the potential of the A-431 vulvovaginal epithelial cell infection model for studying diverse processes relevant to the VVC research field. In the following protocol, we highlight the capabilities of the A-431 vulvovaginal epithelial infection model in terms of studying tissue damage, fungal burden, inflammatory responses, real-time cell status tracking, neutrophil recruitment, and gene expression. We thereby provide a toolset for further research into improving our understanding of the pathogenesis of VVC and to evaluate novel/candidate anti-infective, anti-virulence, and immunomodulatory therapeutic strategies for VVC.
Materials and reagents
Biological materials
1. A-431 cells (ATCC, catalog number: CRL-1555TM)
2. Candida albicans strain SC5314 (ATCC-MYA-2876) [57], risk group 2, human pathogenic fungus
3. Candida albicans strain CA3153 (kindly provided by Prof. Patrick Van Dijck) [58], risk group 2, human pathogenic fungus
4. Candida albicans strain CA3153::GFP (kindly provided by Prof. Patrick Van Dijck) [59], risk group 2, human pathogenic fungus
5. HUVEC/TERT2 cells [kindly provided by Transfer Group Antiinfectives (Leibniz-HKI); ATCC, catalog number: CRL-4053TM]
Reagents
For cell culture
1. RPMI-1640 (Gibco, catalog number: 11875093)
2. Accutase cell detachment solution (Capricorn, catalog number: ACC-1B)
3. Heat-inactivated fetal calf serum (hiFCS), heat-inactivated for 20 min at 57 °C; South America ultra-low endotoxin triple filtered (0.1 pm) (Bio & Sell, catalog number: FBS.TF.O5OO)
For culturing Candida
4. Yeast extract (Serva, catalog number: 24540.03)
5. Peptone (ThermoFisher, catalog number: 211677)
6. Glucose (Roth, catalog number: X997.2)
7. Agar-agar (Becton Dickinson, catalog number: 257353)
For cytotoxicity assay
8. Hydrochloric acid (HCl) 1 mol/L (Roth, catalog number: K025.1)
For ELISA
9. 1× TMB substrate solution (Invitrogen, catalog number: 00-4201-56)
10. Bovine serum albumin (BSA) fraction V, ≥98%, biotin-free, NZ-Origin (Roth, catalog number: 0163.4)
11. Sodium chloride (NaCl) (Roth, catalog number: 0962.2)
12. Disodium hydrogen phosphate dihydrate (Na2HPO4·2H2O) (Roth, catalog number: T877.1)
13. Potassium dihydrogen phosphate (KH2PO4) (Roth, catalog number: 23Y6.1)
14. Potassium chloride (KCl) (Roth, catalog number: HN02.1)
15. Tween-20 (Roth, catalog number: 9127.1)
For live-cell microscopy
16. SYTOTM Deep Red nucleic acid stain (Invitrogen, catalog number: S34900)
17. SYTOXTM Orange nucleic acid stain (Invitrogen, catalog number: S11368)
For RNA isolation
18. RNaseZap (Sigma-Aldrich, catalog number: R2020)
19. β-mercaptoethanol (ThermoFisher, catalog number: 125472500)
20. Ethanol 70% (Roth, catalog number: T868.3)
21. Oligo-dT (Invitrogen, catalog number: AM5730G)
22. GoTaq® qPCR master mix (Promega, catalog number: A6002)
23. Deoxynucleotide (dNTP) solution mix (New England BioLabs Inc., catalog number: N0447S)
24. RNaseOUTTM recombinant RNase inhibitor (Invitrogen, catalog number: 10777-019)
25. SuperScriptTM III reverse transcriptase (Invitrogen, catalog number: 18080-044), includes 0.1 M DTT and 5× first-strand buffer
For gene silencing
26. 5× siRNA buffer (Dharmacon, catalog number: B-002000-UB-100)
27. DharmaFECTTM transfection reagent 1 (Dharmacon, catalog number: T-2001-02)
28. siRNA target (Dharmacon)
29. siRNA non-targeting (Dharmacon)
For neutrophil chemotaxis
30. EBM® Endothelial Cell Growth Basal Medium (Lonza, catalog number: CC-3121)
31. EGM® Endothelial Cell Growth Medium SingleQuots® kit (Lonza, catalog number: CC-4133)
32. Lymphocyte separation medium, density 1.077 g/mL (Capricorn, catalog number: LSM-A)
33. Collagen A (Sigma, catalog number: C5533)
34. Penicillin-streptomycin, 10,000 U/mL (Gibco, catalog number: 15140122)
35. HBSS (Gibco, catalog number: 14025092)
36. HEPES (Gibco, catalog number: 15630106)
37. Cell Tracking Dye kit, Green, Cytopainter (Abcam, catalog number: ab138891)
38. IL-8 (Immunotools, catalog number: 11349084)
Solutions
1. Phosphate-buffered saline (PBS), pH 7.4 (see Recipes)
2. Cell culture medium RPMI-1640 + hiFCS (see Recipes)
3. Yeast peptone dextrose (YPD) agar plates/liquid medium (see Recipes)
4. ELISA wash buffer 25× (see Recipes)
5. ELISA assay diluent (see Recipes)
Recipes
1. PBS, pH 7.4
| Reagent | Final concentration | Quantity or volume |
|---|---|---|
| Na2HPO4·2H2O | 10 mM | 1.78 g/L |
| KH2PO4 | 1.8 mM | 0.24 g/L |
| NaCl | 140 mM | 8.2 g/L |
| KCl | 2.7 mM | 0.2 g/L |
Fill up with distilled water, autoclave (20 min, 121 °C), and store at room temperature.
2. Cell culture medium RPMI-1640 + hiFCS
| Reagent | Final concentration | Quantity or volume |
|---|---|---|
| RPMI-1640 medium | 90% | 450 mL |
| hiFCS | 10% | 50 mL |
| Total | 100% | 500 mL |
Store at 4 °C for a maximum of 2 weeks.
3. YPD agar plates/medium
| Reagent | Final concentration | Quantity or volume |
|---|---|---|
| Yeast extract | 1% | 10 g/L |
| Peptone | 2% | 20 g/L |
| Glucose | 2% | 20 g/L |
| Agar-agar (only for plates) | 2% | 20 g/L |
Fill up with distilled water and autoclave (20 min, 121 °C).
Liquid medium: Store at room temperature.
Agar plates: Pour 11 mL into a 9 cm culture plate, let it cool down, and store at 4 °C.
4. ELISA wash buffer 25× (1 L)
| Reagent | Final concentration | Quantity or volume |
|---|---|---|
| NaCl | 3.42 M | 200 g/L |
| Na2HPO4·2H2O | 250 mM | 44.5 g/L |
| KH2PO4 | 50 mM | 6.75 g/L |
| KCl | 67 mM | 5 g/L |
| Tween-20 | 12.5 mL/L | 12.5 mL/L |
Fill up with distilled water and store at room temperature. Dilute 1:25 in distilled water before use.
5. ELISA assay diluent (0.5 L)
Dissolve 1% BSA (10 g/L) in PBS (see Recipe 1) and store it at 4 °C. Do not use it for longer than 2 days.
Materials
For cell culture
1. Tissue culture flasks T-75 (Sarstedt, catalog number: 83.3911.002) and T-175 (Sarstedt, catalog number: 83.3912.002)
2. Tissue culture plates 6-well (TPP, catalog number: 92406), 24-well (TPP, catalog number: 92424), 96-well (TPP, catalog number: 92696)
3. Plastic Petri dish 9.2 cm (Sarstedt, catalog number: 82.1473)
4. Counting chamber Neubauer improved 0.1 mm depth (Roth, catalog number: PC72.1)
For cytotoxicity assay
5. Cytotoxicity Detection kit (LDH) (Roche, catalog number: 11644793001)
6. LDH from rabbit muscle (standard for cytotoxicity assay) (Roche, catalog number: 10127884001)
For ELISA
7. Human GM-CSF DuoSet ELISA (R&D Systems, catalog number: DY215)
8. Human IL-1Ra/1F3 DuoSet ELISA (R&D Systems, catalog number: DY280)
9. Human IL-8/CXCL8 DuoSet ELISA (R&D Systems, catalog number: DY208)
10. Human IL-1 alpha/IL-1F1 DuoSet ELISA (R&D Systems, catalog number: DY200)
11. High-binding 96-well ELISA plates, flat bottom, clear (Sarstedt, catalog number: 82.1581.200)
12. Adhesive plate sealing films (Greiner Bio-One, catalog number: 676001)
For RNA isolation
13. RNeasy Mini kit (Qiagen, catalog number: 74106)
14. RNase-Free DNase set (Qiagen, catalog number: 79254)
15. Cell scrapers, 24 cm (TPP, catalog number: 99002)
For neutrophil chemotaxis
16. TC-insert, for 24-well plates (Sarstedt, catalog number: 83.3932.300)
Equipment
1. Live-cell image microscope with filters around 488, 547, and 652 nm [used here: Incucyte SX5 (Sartorius, catalog number: 4816) with SX5 Green/Orange/NIR optical module (Sartorius, catalog number: 4832)]
2. HydroSpeed plate washer (Tecan, catalog number: 30060035)
3. Plate reader with filters for 450 and 570 nm (used here: Absorbance 96 (Byonoy)
4. NanoDrop One (Thermo Fisher, model: ND-ONE-W)
5. CFX Opus 96 Real-Time PCR System (Bio-Rad, catalog number: 12011319)
Software and datasets
1. Plate reader software: Absorbance 96 App (version 2024.08.0)
2. Live-cell imaging microscope (Incucyte 2024B)
3. Microsoft Excel (Microsoft, version 16.0.10417.20095)
4. GraphPad Prism (version 10.5.0)
5. Bio-Rad CFX Manager (version 3.1.1517.0823)
6. ImageJ/FIJI (version 2.16.0/1.54p) 22743772 [60]
Procedure
A. Maintaining and preparing A-431 human epidermoid carcinoma cells
1. Harvest A-431 cells from a 75 cm2 flask (around 80% confluency) by washing them with 10 mL of PBS and detaching with 2 mL of Accutase for 10 min at 37 °C (5% CO2).
Note: Detachment time can vary. Check under a microscope if the cells round up and detach. Some sticky cells can be detached by gently tapping the flask.
2. Add 4 mL of RPMI-1640 + hiFCS to stop the detachment and rinse the media multiple times over the surface to remove any remaining cells and to fragment cell clumps to a single cell suspension.
3. Count the cells using a cell counter (e.g., Bürker or Neubauer chamber, or automated cell counter) and adjust the concentration in RPMI-1640 + hiFCS according to your needs (Table 1).
Note: One T-75 flask at 80% confluency contains around 3 million cells. If, for some experiments, a high density of cells is needed, spin them down before counting (300× g for 5 min), remove the media, and resuspend in 1 mL of RPMI-1640 + hiFCS.
Table 1. Recommended cell numbers for seeding in different well plates and flasks
| Cell culture | Total number of cells per well |
|---|---|
| 6-well plate | 300,000 |
| 24-well plate | 100,000 |
| 96-well plate | 20,000 |
4. Seed the cells according to Table 1 and incubate at 37 °C (5% CO2) for 2 days (Figure 1).
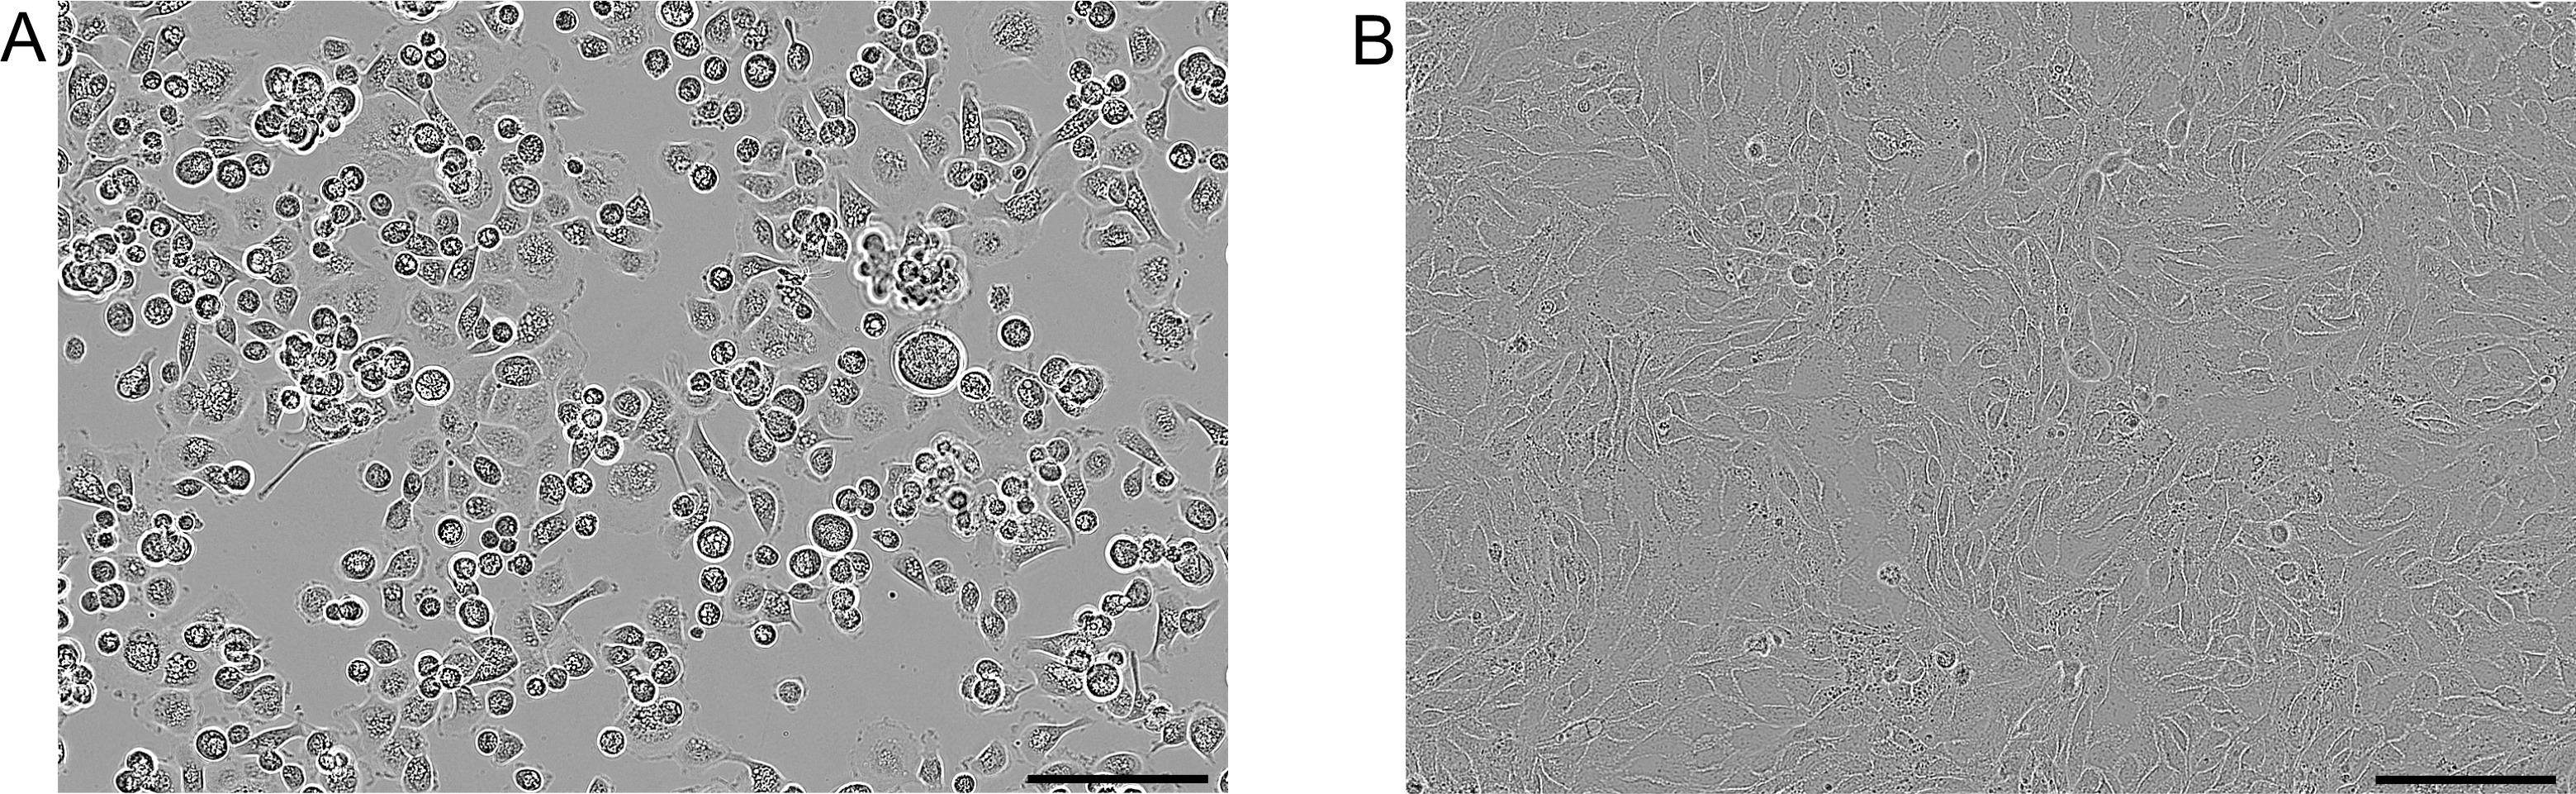
Figure 1. Representative images of A-431. A-431 cells seeded in a 96-well plate (A) 1 h after seeding and (B) after 48 h. Images were taken with a Sartorius Incucyte SX5 with 20× magnification. Scale bar, 100 μm.
B. Preparing Candida cultures for infection
1. Streak Candida strains of interest from a glycerol stock on YPD agar plates and incubate for approximately 1.5 days at 30 °C.
Note: After incubation, plates can be kept in the fridge for approximately 4 weeks.
2. Add 10 mL of YPD medium into a 25 mL glass Erlenmeyer flask and resuspend one single colony from the YPD agar plate into the flask. Incubate at 30 °C with 180 rpm shaking for approximately 16 h.
3. Collect 1 mL of the overnight culture and centrifuge at 10,000× g for 1 min.
4. Remove the supernatant and resuspend the yeast cell pellet with 1 mL of PBS.
5. Repeat the centrifugation and washing (steps B3 and B4) twice.
6. Resuspend the pellet in 1 mL of PBS.
7. Prepare a 1:100 dilution in PBS and determine the cell concentration.
8. Adjust the concentration in RPMI-1640 according to your multiplicity of infection (MOI).
Note: A MOI of 1 is a good way to start (calculated from the number of seeded cells).
C. Setup for infection
1. Remove the old media from the A-431 cell monolayer and refill with RPMI-1640.
Note: This is to remove the FCS, which can impact C. albicans pathogenicity.
2. Replace the RPMI-1640 with the Candida-containing medium (step B8).
3. Incubate the infected cells at 37 °C and 5% CO2. Always include an uninfected (cells only) control.
Note: The incubation time depends on your research question. Hyphal growth can be tracked up to 12 h (depending on MOI), live-cell imaging can be done for 12–24 h, and cytokine and cytotoxicity quantification is typically done at 24 h.
D. Adjustments, sample collection, and read-outs for Candida-infected A-431 cells
D1. Quantification of cytotoxicity by measuring lactate dehydrogenase (LDH) activity
1. When working with a cell culture plate: Spin down the plate at 300× g for 10 min before collecting supernatants. When working with a cell culture flask: Transfer the supernatants to a reaction tube, centrifuge it at 300× g for 10 min to remove debris/Candida from the liquid.
Note: If the supernatants are not processed immediately, store them at 4 °C maximum overnight. Freeze-thawing interferes with LDH activity.
2. Dilute the samples 10× in PBS and add 100 μL to a transparent 96 well-plate.
Note: The dilution can be adjusted depending on the experimental cell density.
3. Prepare a standard curve of LDH from rabbit muscle (Roche) in PBS of 2-fold dilutions with a concentration range of 500 ng/mL to 3.91 ng/mL and add 100 μL of each to the 96-well plate. Include wells with PBS only as a blank and perform at least two technical replicates per condition (Figure 2).
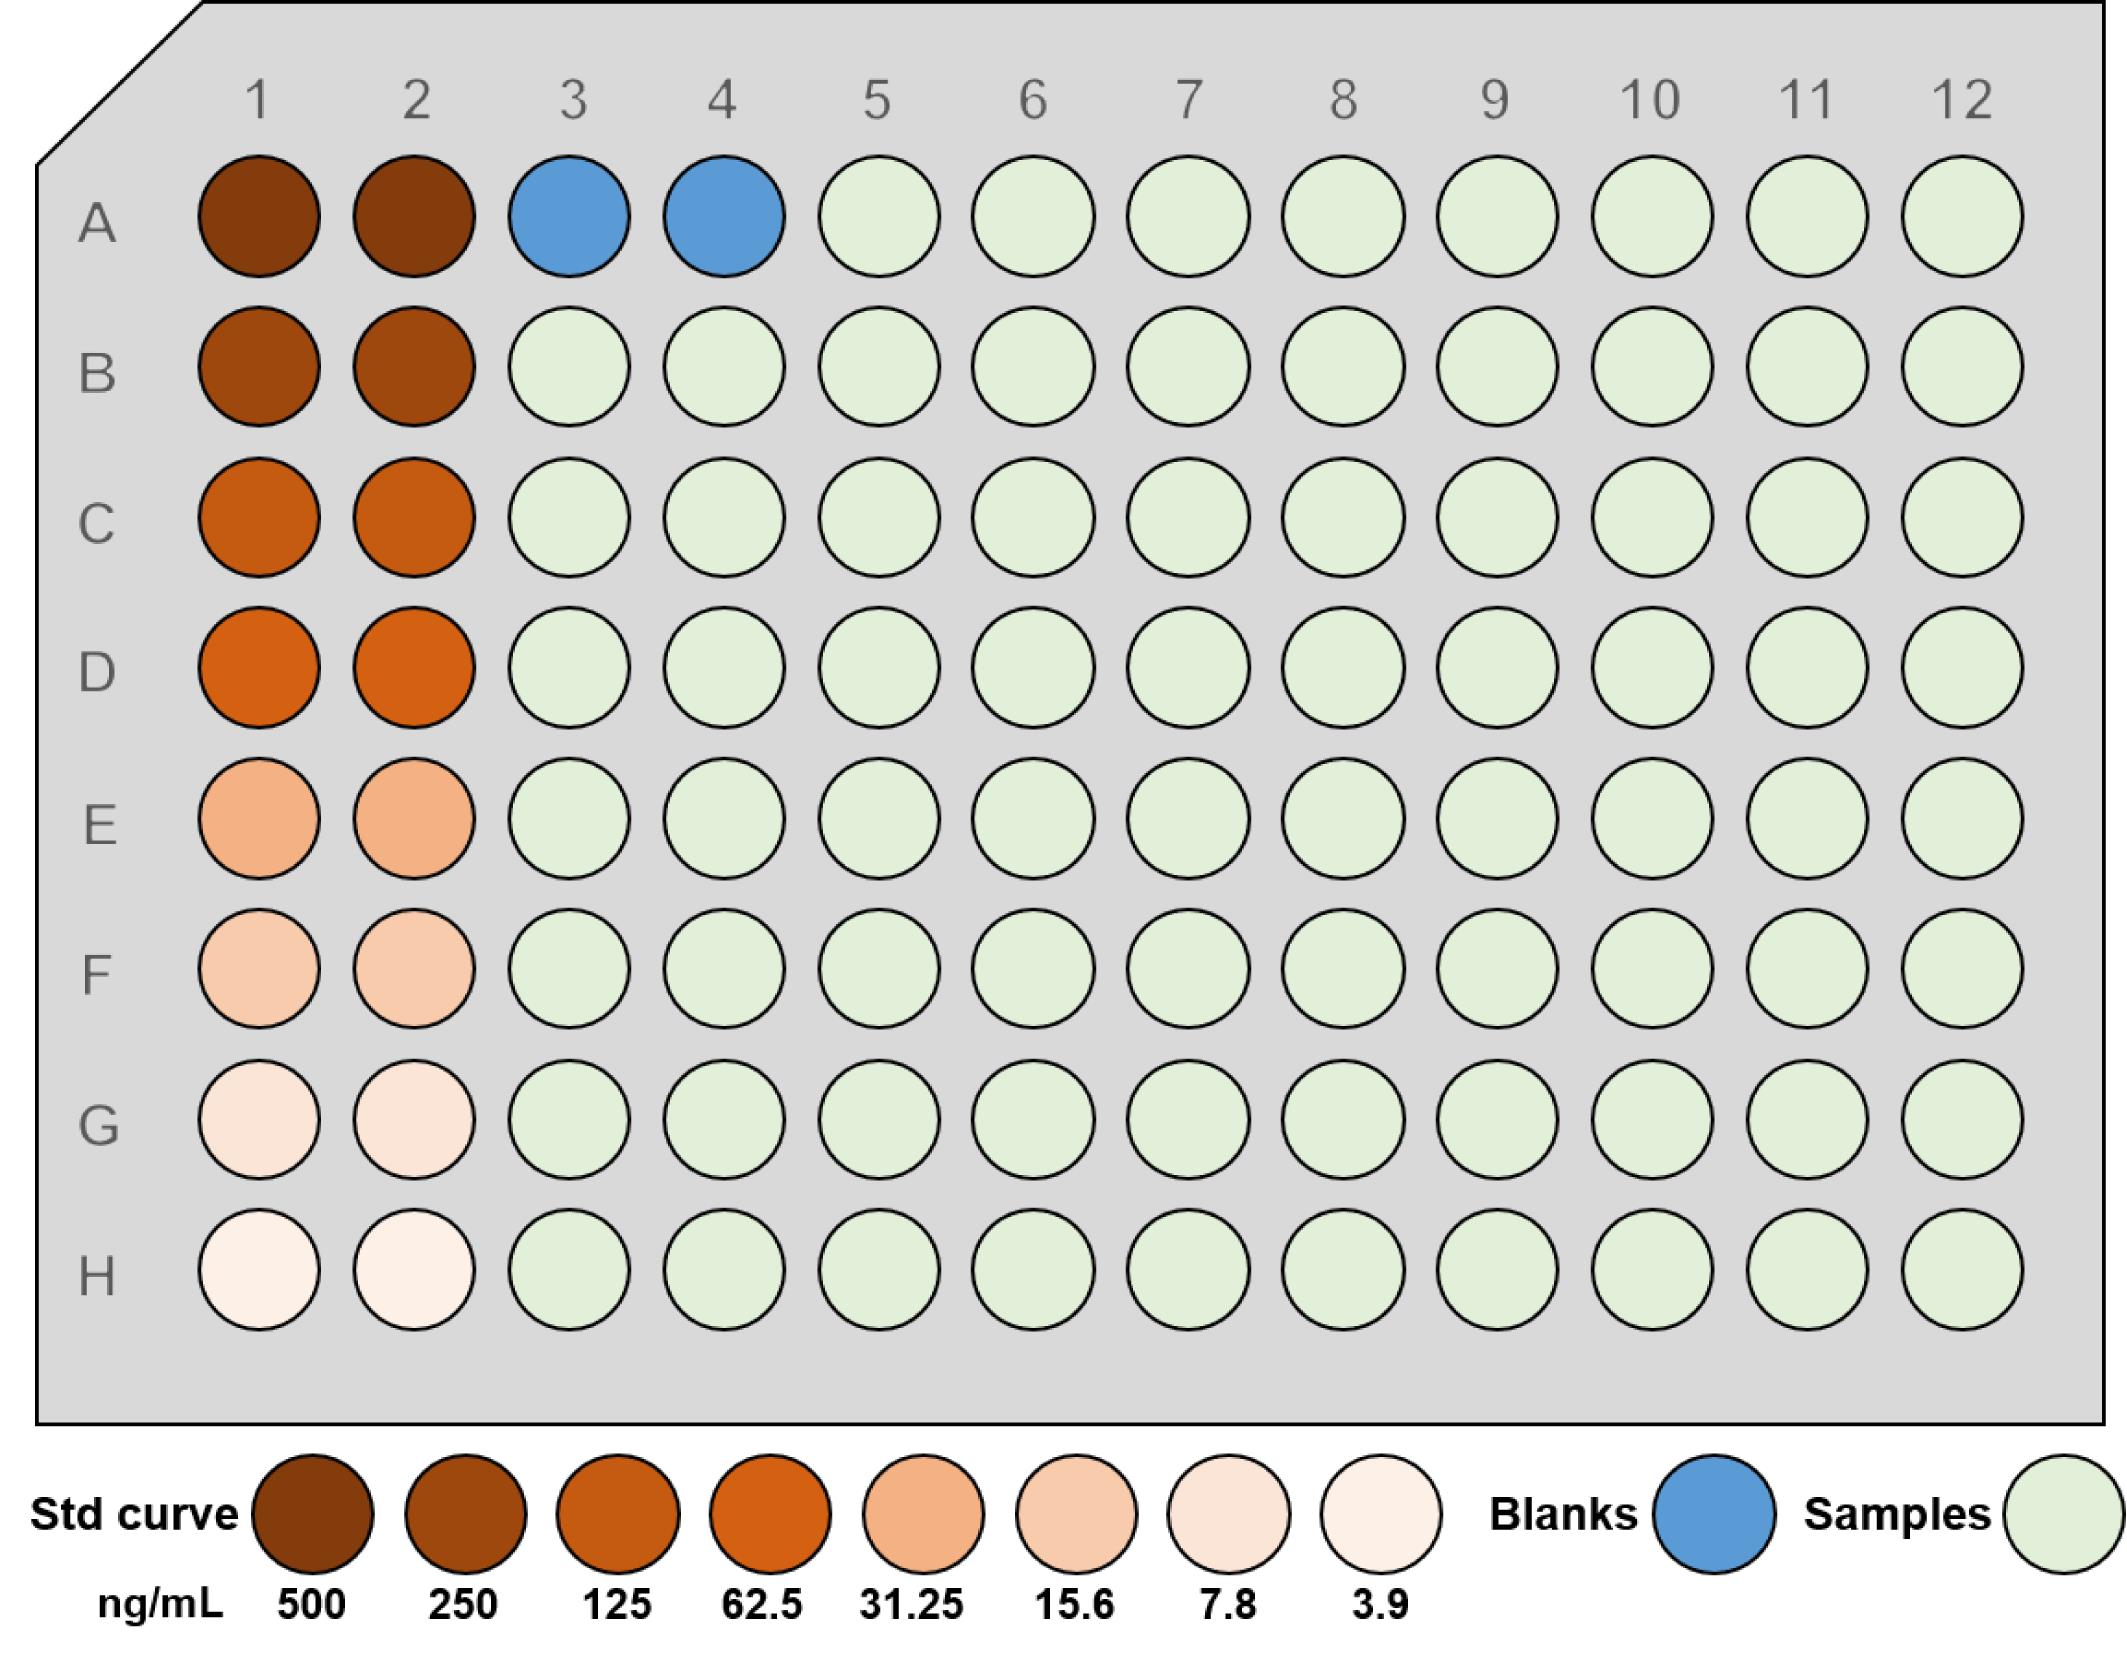
Figure 2. Example plate layout for cytotoxicity assay
4. Prepare the reaction mix according to the manufacturer using the cytotoxicity detection kit.
5. Add 100 μL to each sample and to the wells of the standard.
6. Incubate for 10 min in the dark.
Note: Check the plate regularly to stop the process in time.
7. Stop the reaction with 50 μL of 1 M HCl.
8. Measure the absorption with a plate reader at 490 nm and a reference wavelength at 660 nm.
Note: Cytotoxicity can also be determined using specific luciferase-expressing A-431 cell lines (see [61]).
D2. Monitoring inflammatory responses by quantifying cytokine concentrations within the supernatant (ELISA)
Note: The procedure here is for R&D DuoSet ELISA assay systems and may require adaptation when using assays from other suppliers.
1. When working with a cell culture plate, spin down the plate at 300× g for 10 min before collecting supernatants. When working with a cell culture flask, transfer the supernatant to a reaction tube and centrifuge it for 10 min at 300× g to remove debris/Candida from the liquid.
Notes:
1. If the supernatants are not processed immediately, store them at -20 or -80 °C.
2. The cells can be lysed using sterile water and a freeze-thaw cycle to quantify intracellular cytokine levels.
2. Thaw capture antibody aliquot on ice, briefly spin, and dilute in 11 mL of 1× PBS (rinse the aliquot tube with a small amount of PBS for quantitative transfer). Mix gently by inversion and coat the high-binding 96-plate by adding 100 μL/well of capture antibody. Incubate overnight.
3. Prepare the 1× ELISA wash buffer by diluting 200 mL of 25× wash buffer (Recipe 4) in 5 L of dH2O.
4. Wash the plate three times and tap dry on absorbent paper.
5. Block by adding 300 μL/well of assay diluent (Recipe 5) and incubate for 1 h.
6. Prepare dilutions for the standard curve according to the manufacturer’s protocol (adjust according to the cytokine of interest).
7. Wash the plate three times and tap dry.
8. Add 100 μL/well of standards and blank (assay diluent) with duplicates; then, add 100 μL/well of samples (diluted with assay diluent as required, adjust according to the cytokine) and incubate for 2 h at room temperature or overnight at 4 °C (Figure 3).
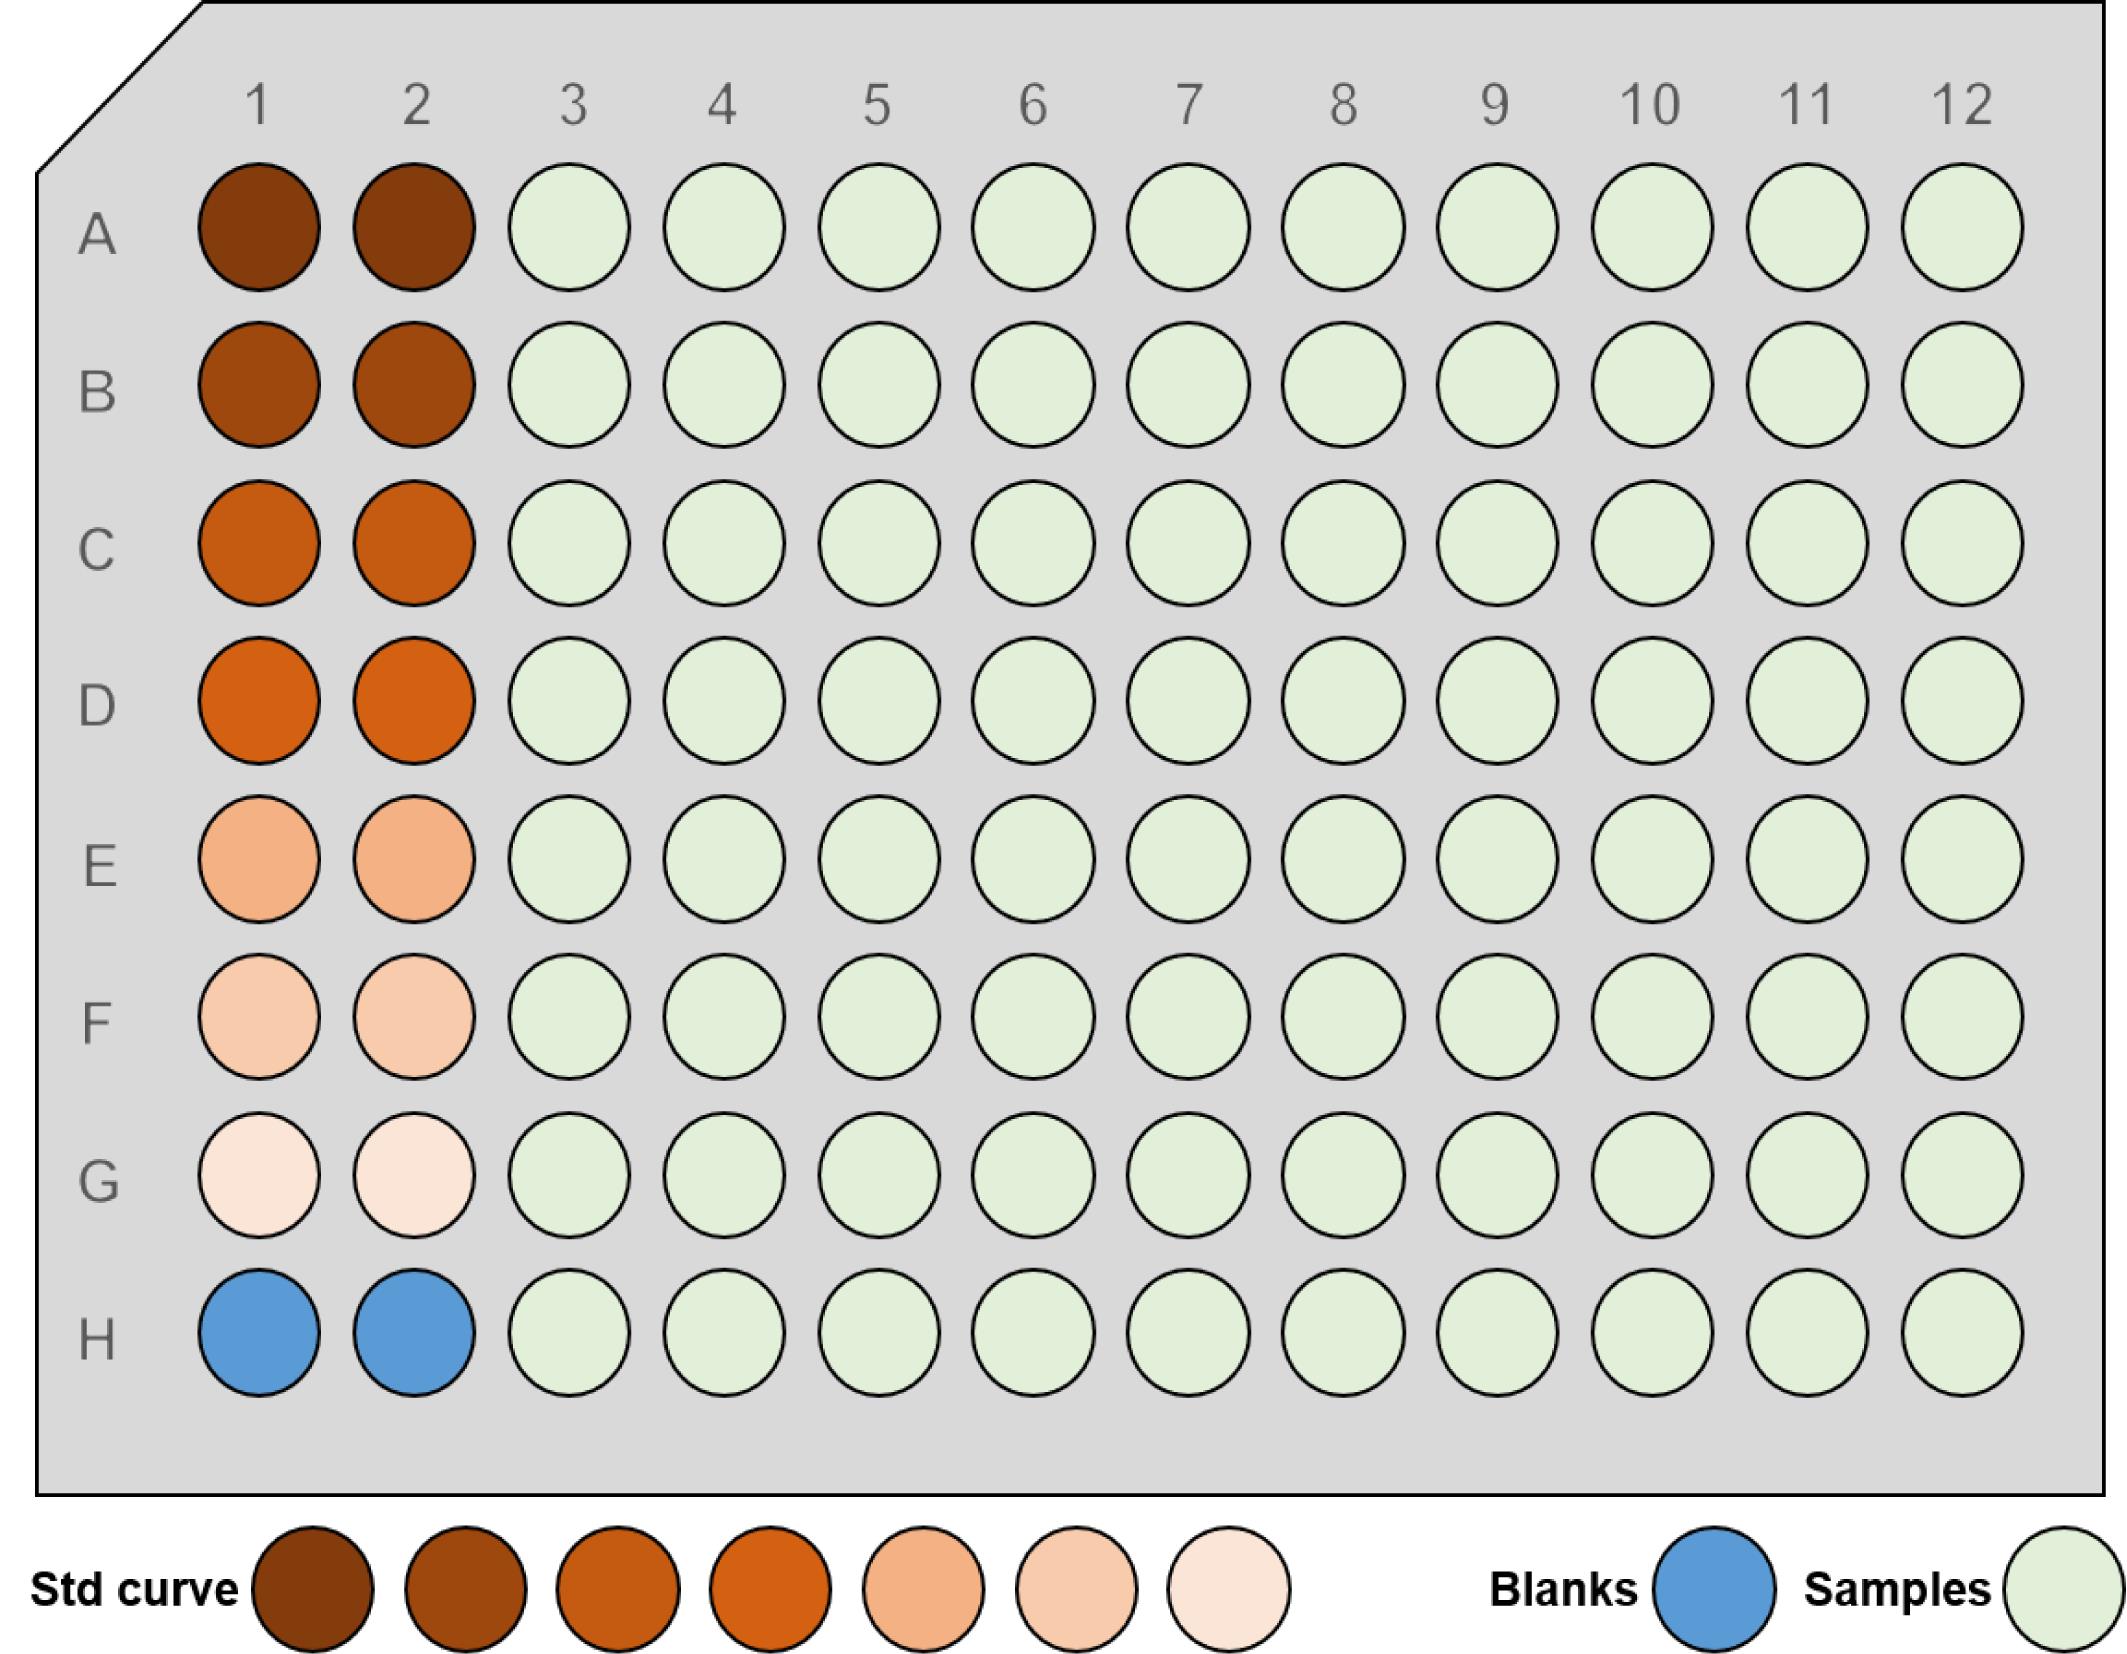
Figure 3. Example plate layout for ELISA
Note: Consider the sample type and cytokine of interest. Before the main experiment, you could run a dilution series of your sample (1:2, 1:5, 1:10, 1:20, 1:50, 1:100) and choose a dilution where OD values are within the kit sensitivity range (above blank but not near saturation). Avoid undiluted samples due to matrix interference, nonspecific binding, and background noise.
9. Thaw detection antibody aliquot on ice, briefly spin, and dilute in 11 mL of assay diluent (rinse the aliquot tube with a small amount of assay diluent for quantitative transfer). Mix gently by inversion (do not vortex to avoid bubbles).
10. Wash the plate three times and tap dry.
11. Add 100 μL/well of detection antibody. Incubate for 2 h.
12. Prepare streptavidin-HRP B by diluting 1:40 in assay diluent. Mix gently by inversion (do not vortex to avoid bubbles). Protect from the light.
13. Wash the plate three times and tap dry.
14. Add 100 μL/well of streptavidin-HRP B. Incubate for 20 min in the dark.
15. Wash the plate three times and tap dry.
16. Add 100 μL/well of 1× TMB substrate solution.
17. Develop for 5–20 min. Protect from the light.
Note: Monitor visually; use the standard curve color as an indicator. Do not allow OD to saturate; if wells appear very dark blue, proceed to stop immediately to avoid readings over 2.0 OD.
18. Add 50 μL/well of stop solution under a fume hood. Mix briefly by gently tapping. Measure at 450 nm and a reference wavelength at 570 nm.
D3. Quantification of fungal burden by colony forming units (CFUs)
Note: When C. albicans forms hyphae and/or biofilms on the A-431 cells, CFU plating may underestimate the fungal burden due to multiple fungal cells clumping together.
1. After collecting cell supernatants, add 200 μL of sterile H2O to each well and pipette up and down until the cell layer is removed from the plastic.
2. Collect the H2O from the well in a microcentrifuge tube and repeat the step three times until you reach 1 mL as the total volume (the volume of H2O can be adjusted).
3. Vortex the microcentrifuge tube to ensure homogenous distribution of the CFUs.
4. Plate 100 μL onto a YPD agar plate.
Note: Dilution can be adjusted depending on the MOI and length of infection. We recommend diluting twice (1:10 and 1:100) and plating both.
5. Incubate overnight at 30 °C.
6. Count the number of colonies in the next 1–2 days.
D4. Live-cell imaging for tracking cell death and hyphal growth over time
1. When adding plain RPMI-1640 to the cells (step C2), include fluorescent dyes in the medium [e.g., SYTOTM Deep Red nucleic acid stain for counting total cell number (total dilution 1:2,000, final concentration 1 μM), or SYTOXTM Orange nucleic acid stain for counting dead cells (total dilution 1:10,000, final concentration 0.5 μM)].
Note: The use of RPMI-1640 without phenol red could decrease the background signal and therefore improve the assay sensitivity.
2. Incubate the cells with medium containing fluorescent dyes for 30 min at 37 °C (5% CO2) before adding Candida.
Note: For tracking hyphal growth, fluorescent Candida can be used instead of wild-type yeast strains. Check that the fluorescent-labeled strain does not interfere/overlap with the fluorescent cell dyes.
3. Incubate the plate in a live-cell imaging microscope (e.g., Incucyte SX5), taking pictures every hour in the desired channels, with a 10× objective (Figure 4) or higher magnification.
Note: Setting depends on the chosen fluorophores. For example, when using SytoxTM Orange, the acquisition time can be reduced to 100 ms, while fluorescent Candida strains might need more.

Figure 4. Example images of live-cell imaging. A-431 cells were stained with SytoTM Deep Red for counting the total number of cells and SytoxTM Orange to monitor cytotoxicity. GFP-labeled CA3153 was used to track hyphal growth over time. Exemplary time point 6 hours post-infection (hpi) is shown. Images were taken with a Sartorius Incucyte SX5 with 20× magnification. Scale bar, 100 μm.
D5. Gene silencing
1. Seed cells a day before, according to Table 1, and incubate at 37 °C (5% CO2) overnight.
2. Prepare 1× siRNA buffer by diluting 5× siRNA buffer in sterile RNase-free water.
3. Resuspend the acquired siRNA to a 20 μM stock solution using 1× siRNA buffer.
Note: Be sure to include the following controls: mock-transfected cells (untreated cells), siRNA controls (non-targeting siRNA), and positive control siRNAs (targeting an endogenous or reporter gene).
4. Prepare a 5 μM siRNA solution in 1× siRNA buffer from your stock solution of 20 μM.
5. In separate tubes, dilute the siRNA (Tube 1) and the appropriate DharmaFECT transfection reagent 1 (Tube 2) with serum-free medium (96-well plate).
a. Tube 1: Prepare a 10 μL volume of the siRNA in serum-free medium by adding 0.5 μL of 5 μM siRNA to 9.5 μL of serum-free medium.
b. Tube 2: Prepare a 10 μL volume of diluted DharmaFECT transfection reagent 1 in serum-free medium.
Note: Depending on the cell line and cell density, the DharmaFECT reagent amount can vary. Check the manufacturer’s instructions.
6. Gently mix the contents of each tube by pipetting carefully up and down. Incubate for 5 min at room temperature.
7. Add the contents of Tube 1 to Tube 2. Mix by pipetting carefully up and down and incubate for 20 min. Then, add 80 μL of antibiotic-free complete medium for a total volume of 100 μL of transfection medium (96-well plate).
8. Remove culture medium from the wells and add 100 μL of the appropriate transfection medium to each well.
9. Incubate cells at 37 °C in 5% CO2 for 24 h (for mRNA analysis).
D6. Isolation of RNA for expression analysis
Note: Use RNaseZapTM to wipe and decontaminate all pipettes and workstations.
1. Sample harvest
a. Remove culture medium.
b. Add 300 μL (6-well plate) of RLT buffer (from RNeasy Mini Kit), containing 1% β-mercaptoethanol.
Note: Work quickly when the RLT buffer is on the living cells, as the cells react to the RLT buffer and could change their transcriptional profile.
c. Detach cells using a cell scraper.
d. Store at -80 °C until RNA isolation.
2. Purification of total RNA (adapted from RNeasy Mini Kit)
a. Thaw samples on ice.
b. Add 300 μL of 70% ethanol to a new tube and add your sample.
c. Mix well by pipetting and subject the mixture to a spin column.
d. Centrifuge at 10,000× g for 30 s; discard flowthrough.
e. Add 700 μL of RW1 buffer into the column.
f. Centrifuge at 10,000× g for 30 s; discard flowthrough.
g. Add 500 μL of RPE buffer to the column.
h. Centrifuge at 10,000× g for 30 s; discard flowthrough.
i. Add 500 μL of RPE buffer to the column.
j. Centrifuge at 10,000× g for 2 min, discard the flowthrough, and centrifuge for 1 min at maximum speed to dry the membrane.
k. Place the column into a new microcentrifuge tube and add 87.5 μL of nuclease-free water to the membrane. Incubate for 1 min.
l. Centrifuge at 10,000× g for 1 min to elute the RNA.
m. Measure total RNA on NanoDrop.
n. Store at -80 °C until further use.
3. RNA clean-up (adapted from RNeasy Mini kit)
a. Thaw RNA on ice.
b. Add 10 μL of RDD buffer (from RNase-Free DNase set) to your RNA sample and mix gently.
c. Add 2.5 μL of DNase I (from RNase-Free DNase set) and mix several times very gently by pipetting.
Note: Avoid vortex since it will deactivate the DNase.
d. Incubate the sample for 30 min.
e. Add 350 μL of RLT buffer, mix well, add 250 μL of 70% ethanol, mix well, and subject the solution to the column.
f. Centrifuge at 13,200× g for 30 s, discard the flowthrough, and reuse the collection tube.
g. Add 500 μL of RPE buffer to the column, centrifuge at 13,200× g for 30 s, discard the flowthrough, and reuse the collection tube. Repeat this step and increase the centrifugation time to 2 min.
h. Centrifuge the empty column at 13,200× g for 1 min to get rid of residual impurities from your column.
i. To collect pure RNA samples, add 40 μL of nuclease-free water (from RNeasy Mini kit).
j. Incubate for 1 min.
k. Centrifuge at 13,200× g for 30 s.
l. Repeat steps D6.3i–k.
m. Measure total RNA and its purity on NanoDrop.
4. cDNA synthesis
a. Determine the volume containing 500 ng of RNA and combine with water for a total volume of 20 μL.
b. Add 1 μL of Oligo-dT.
c. Incubate at 70 °C for 10 min with the lid set to 95 °C in a thermocycler.
d. Meanwhile, prepare cDNA synthesis mix (12 μL each sample):
• 7 μL of 5× first-strand buffer
• 2 μL of 0.1 M DTT
• 1 μL of reverse transcriptase Superscript III
• 1 μL of dNTP
• 1 μL of RNaseOUTTM
e. Place cDNA samples on ice for 2 min.
f. Add 12 μL of cDNA synthesis mix for each sample.
g. Incubate samples for 2 h at 42 °C, then 15 min at 70 °C, and then 4 °C until further use.
h. Dilute the cDNA 1:5 (33 μL + 132 μL of DEPC water).
5. RT-qPCR
a. Prepare primers to a working solution of 10 μM.
b. Add 1 μL of cDNA to the PCR plate.
c. Prepare master mix (each sample):
• Add RNase-free water to a final volume of 20 μL
• Add forward primer for a final concentration of 400 nM
• Add reverse primer for a final concentration of 400 nM
• 10 μL of GoTaq® qPCR master mix
d. Spin down the samples.
e. Add 19 μL of master mix to the respective wells.
f. Seal the plate and centrifuge at 250× g for 3 min.
g. Perform qPCR using a CFX instrument and run the plate according to the following cycling conditions: denaturation at 95 °C for 15 min, followed by 40 cycles of 95 °C for 15 s, 60 °C for 30 s, and 72 °C for 30 s. Melting curve analysis is done as follows: 15 s at 65 °C with an increase of 0.5 °C each cycle to 95 °C.
D7. Quantifying downstream neutrophil recruitment
1. hTERT-immortalized human umbilical cord vein endothelial cells (HUVECs/TERT 2) seeding (day 1)
a. Handle cells as instructed (ATCC) and seed at a density of 2 × 10⁴ cells (200 μL) in a transwell insert with a 3 μm pore size already pre-coated with collagen A (1:20) for 1 h at 37 °C. Incubate at 37 °C with 5% CO2 in EBM with supplement kit and 100 U/mL Pen/Strep two days before the chemotaxis assay.
b. Add 600 μL of the same medium into the bottom compartment.
2. Human polymorphonuclear neutrophil isolation and staining (day 3)
a. Isolate neutrophils from the blood of healthy volunteers using density gradient centrifugation by using lymphocyte separation medium as described in [62].
b. Resuspend the neutrophils in RPMI and count. Add 2 μL of Cytopainter green stock (2 μL/mL) solution to 1 × 10⁶ neutrophils. Wash the stained neutrophils once using HBSS (pH 7) with 20 mM HEPES buffer, followed by centrifugation (300× g for 10 min).
3. Stimuli addition (day 3)
a. Remove the medium from the transwell and add 200 μL of 5 × 10⁵/mL stained neutrophils.
b. Replace the medium from the bottom with 600 μL of stimuli (A-431 cell supernatant is used here, generated as mentioned above).
Note: Use 100 ng/mL recombinant human IL-8 (Immunotools) as a positive control.
c. Incubate for 2 h at 37 °C in a cell culture incubator.
d. Image the bottom of the well at 20× magnification at several positions (e.g., Incucyte SX5, Basic, 20×, acquisition time: 300 ms, Figure 5).
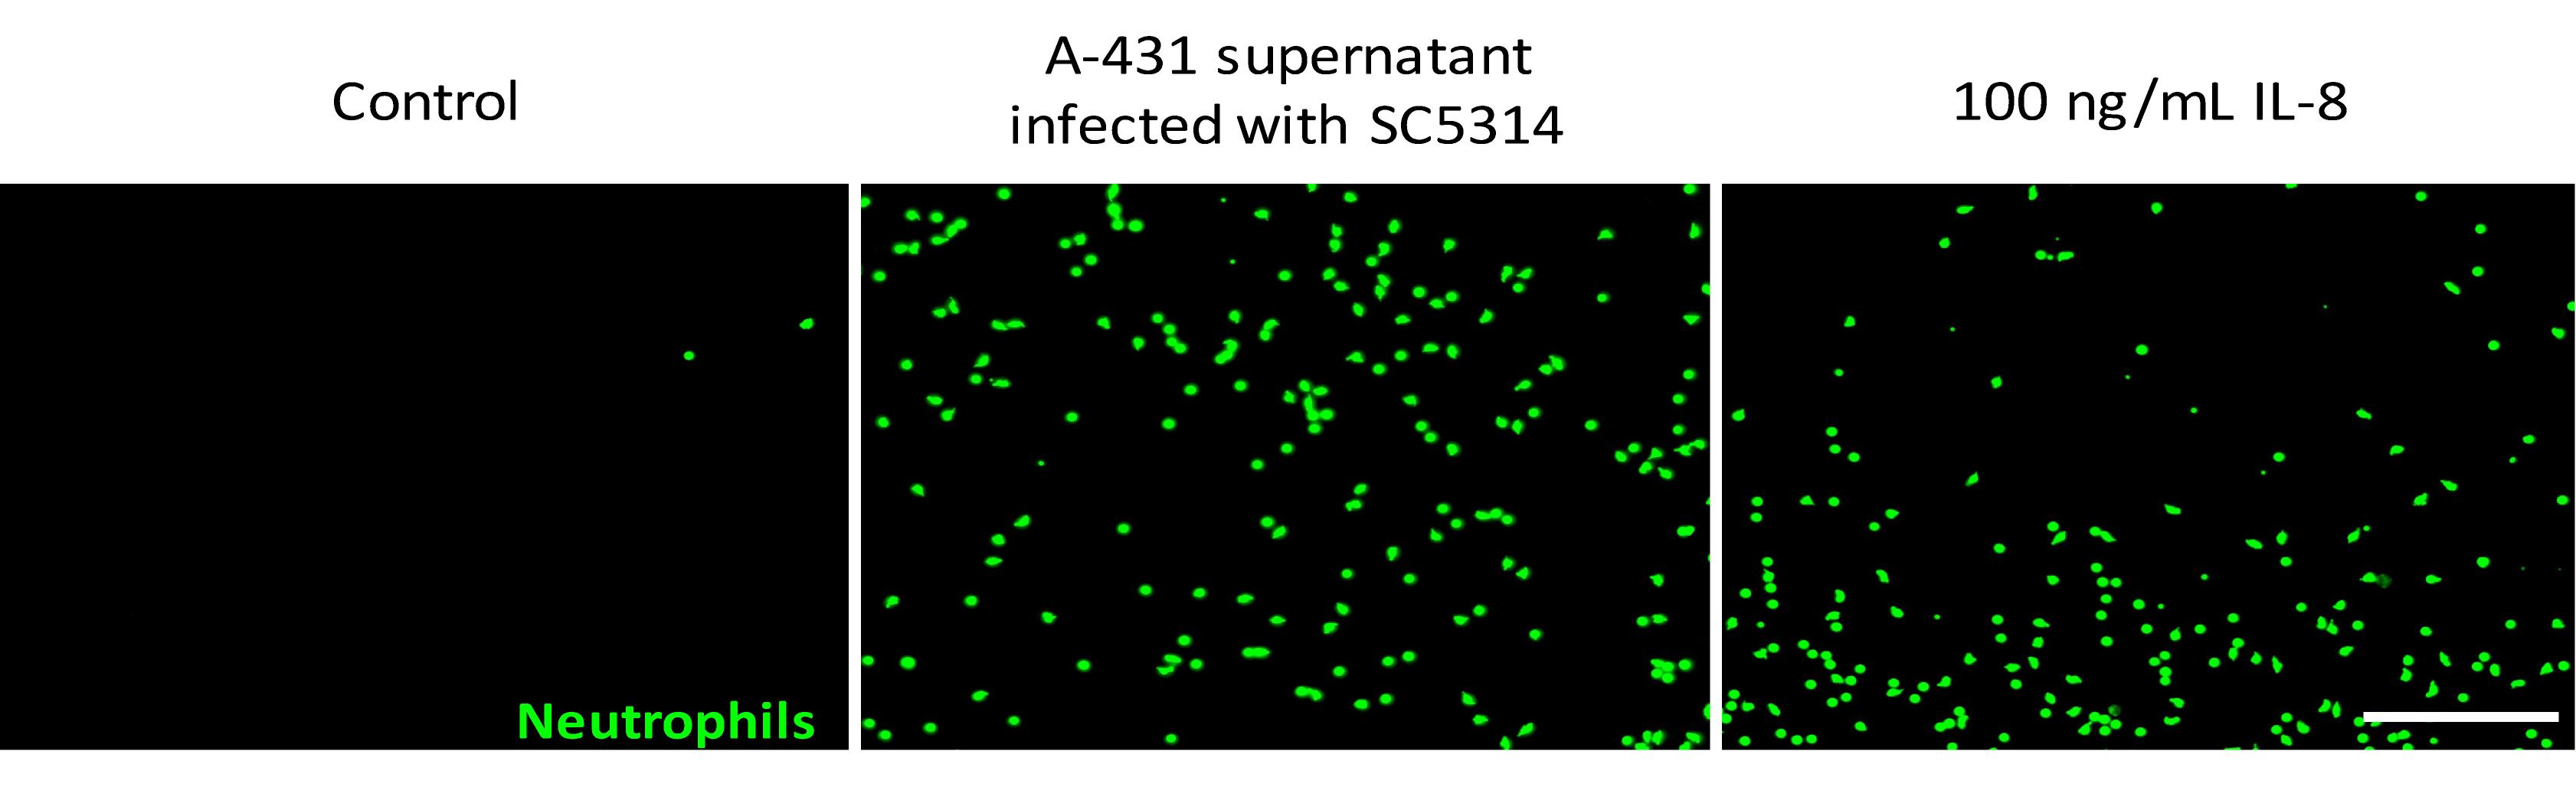
Figure 5. Example images of neutrophil migration under stimulation. Green dots represent Cytopainter Green-stained neutrophils that were attracted and then migrated through the transwell membrane after 2 h of stimulation. Images were taken with a Sartorius Incucyte SX5 with 20× magnification. Scale bar, 200 μm.
Data analysis
The number of biological replicates highly depends on the expected effect size, the research question, and experimental reproducibility. We recommend performing at least three independent biological replicates with two or more technical replicates per experiment. Always include a control without fungus (cells only). The statistical methods strongly depend on the research question to be answered and the experimental design. For example, comparing cytotoxicity of C. albicans isolates would require one-way ANOVA or a nonparametric version of ANOVA, depending on whether the data are normally distributed. Whereas for analysis of drug interventions and vehicle controls or time-course experiments, a two-way ANOVA would be appropriate.
1. Assessing inflammatory response and cell cytotoxicity by measuring LDH levels and cytokines
Quantification of GM-CSF, IL-1Ra, IL-1α, and IL-8 release is performed according to the manufacturer’s protocol (available at the R&D website) (Figure 6A). LDH can be measured using any plate reader with a filter for 490 nm, including a reference wavelength at 660 nm. Use the standard curve to calculate the concentration of LDH in every sample (Figure 6B). Data were plotted using GraphPad Prism v10.
2. Evaluating cell death and hyphal growth from live-cell imaging using the Incucyte 2024B software
Note: The Incucyte can image multiple parts of the well. If feasible, we recommend recording at least two positions per well. For every condition, two or more technical replicates are recommended, and at least three biological replicates.
Incucyte live-cell imaging of hyphal growth was performed as described in Wurster et al. [63] for brightfield/phase contrast and fluorescence-tagged fungi. For a detailed analysis of masking fluorescently labeled cells, we referred to Sartorius’s Analysis Guidelines: Technical Note Incucyte® Live-Cell Analysis System. Once the images are loaded in Sartorius software, adjust the intensity of every channel and apply spectral unmixing if needed. Launch a new analysis by either choosing the basic analyzer for cell death or Neurotrack for hyphal growth, including the required channels, and select images from different time points and conditions. The analysis definition depends on your needs, but use the mentioned references to get a first impression. After the analysis is done, data such as cell counts or hyphal length can be imported into other software for further representation and statistical analysis. The values after reaching saturation should be considered with care. For evaluating cell death, we recommend normalizing the number of dead cells to the total number of initial cells and subtract the background (total cell number at time point 0; Figure 6C, D).
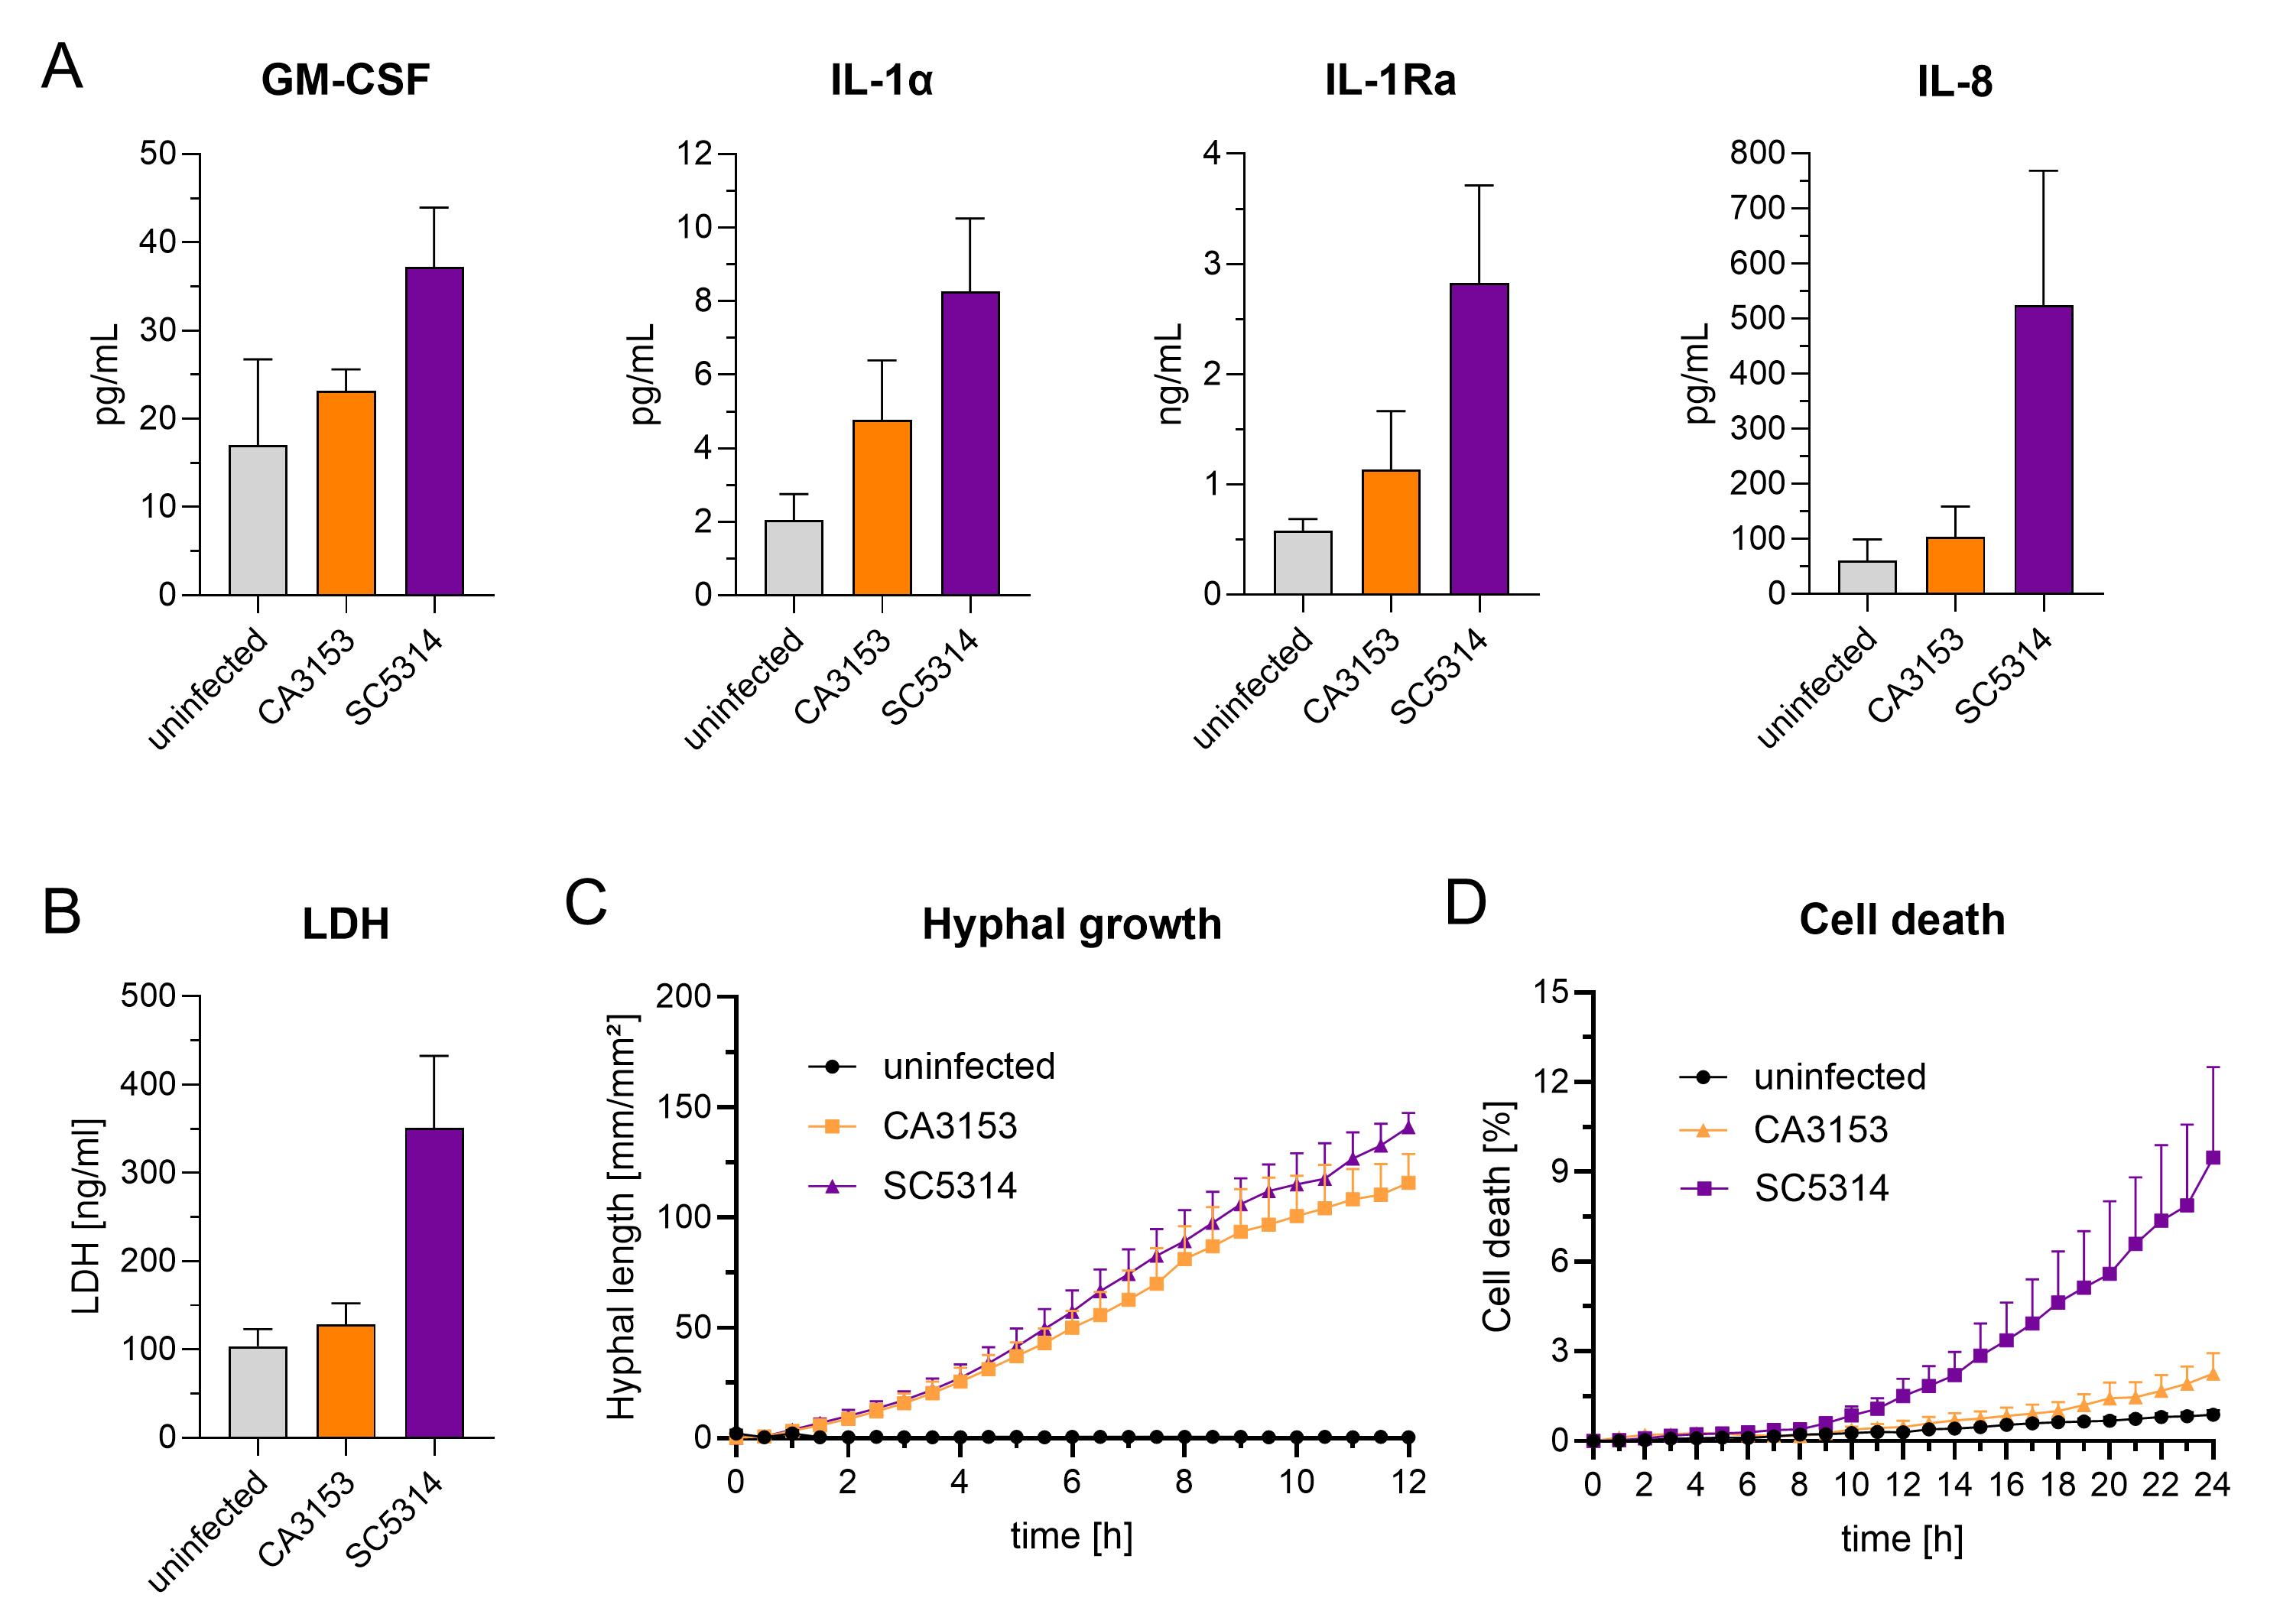
Figure 6. Possible readouts of the A-431 infection model. Different endpoint analyses, such as cytokine release (A) or cytotoxicity (B), can be determined after infection with different Candida strains in the cell supernatant. Live-cell imaging allows tracking hyphal growth (C) and A-431 cell death events (D) over time during infection. Data is shown as mean + SEM, n ≥ 3.
3. RT-qPCR
Quantify the relative gene expression through the comparative Ct (ΔΔCT) method via manual calculation in Excel. The expression levels are normalized to the housekeeping gene and the control sample. The fold change of each gene is plotted using GraphPad Prism v10.
4. Neutrophil attraction
Quantification of the number of Cytopainter green-positive events is processed by the Incucyte Sartorius Basic Analyzer software. New analysis can be launched as described above (as in Data analysis, section 2). Data is plotted using GraphPad Prism v10. In case of an alternative imaging setup, analysis can also be performed in Fiji [60], as quantification is based on counting green events.
Validation of protocol
This protocol (or parts of it) has been used and validated in the following research article(s):
• Pekmezovic et al. [41]. Candida pathogens induce protective mitochondria-associated type I interferon signalling and a damage-driven response in vaginal epithelial cells. Nature Microbiology (Figures 1–6).
• Valentine et al. [40]. Nanobody-mediated neutralization of candidalysin prevents epithelial damage and inflammatory responses that drive vulvovaginal candidiasis pathogenesis. mBio (Figures 2, 3, and 5)
• Hitzler et al. [42]. Host albumin redirects Candida albicans metabolism to engage an alternative pathogenicity pathway. Nature Communications (Figures 1b, c, e; Figure 2c–e; Figure 3h, I, Figure 4d–g; Figure 7a, b, e; Figure 8b–f)
• Pekmezovic et al. [39]. Human albumin enhances the pathogenic potential of Candida glabrata on vaginal epithelial cells PLoS Pathogens (Figure 1; Figure 2B–G; Figure 3; Figure 4A; Figure 5A, C; Figure 6, Figure 7)
• Valentine et al. [38]. Probiotic Lactobacillus Species Modulate Immune Responses During Vaginal Epithelial Cell Colonization. Journal of Infectious Diseases (Figures 1 and 2)
• Rosati, Valentine et al. [43]. Lactic acid in the vaginal milieu modulates the Candida-host interaction. Virulence (Figure 1E–H)
General notes and troubleshooting
1. If not stated otherwise, all steps are performed at room temperature (approximately 20 °C).
2. Note that while measuring cytotoxicity or cytokine release, each plate should contain its own standard curve to avoid discrepancies due to material variations or timing.
Acknowledgments
Conceptualization, M.S.G., V.E.G., D.E.M.; Methodology, K.O.C., B.C., A.D., E.G.; Investigation, K.O.C., J.V.S., B.C., V.E.G., E.G.; Visualization, D.E.M., V.E.G., Writing—Original Draft, K.O.C., B.C., V.E.G.; D.E.M.; Writing—Review & Editing, M.S.G., K.O.C., J.V.S., B.C., V.E.G., C.F.F., D.E.M., E.G., A.D.; Supervision, M.S.G., A.D.; Project administration: M.S.G.; Funding acquisition: M.S.G., A.D.
We gratefully acknowledge the support of K.O.C., V.E.G., and M.H. by a FWO-funded SBO project DeVEnIR (project number S006424N) to M.S.G, support of A.D. by an ESCMID research grant to A.D., the Free State of Thuringia, co-funded by the European Union – Project-ID 2023 FGI 0004 "A Live broadcast of the interactions between host and fungal pathogens" to M.S.G. and A.D., support for D.E.M., C.F.F., and M.S.G. by the German Research Foundation (Deutsche Forschungsgemeinschaft - DFG) Emmy Noether Program (project no.434385622/GR 5617/1-1) to M.S.G., and support for B.C. by the DFG within the Collaborative Research Center (CRC)/Transregio (TRR) 124 FungiNet projects C1 (DFG project number 210879364) to M.S.G. This protocol was adapted from [38–43]. We acknowledge the pioneering work in the field that has led to the establishment of this model and to ever-improving readouts.
Competing interests
The authors declare no conflicts of interest.
References
- Gonçalves, B., Ferreira, C., Alves, C. T., Henriques, M., Azeredo, J. and Silva, S. (2015). Vulvovaginal candidiasis: Epidemiology, microbiology and risk factors. Crit Rev Microbiol. 42(6): 905–927. https://doi.org/10.3109/1040841x.2015.1091805
- Grando, D. and Watson, C. J. (2025). Perspectives on Vaginal Ecology and Management of Recurrent Vulvovaginal Candidiasis: A Narrative Review. J Fungi. 11(11): 806. https://doi.org/10.3390/jof11110806
- Foxman, B., Muraglia, R., Dietz, J. P., Sobel, J. D. and Wagner, J. (2013). Prevalence of Recurrent Vulvovaginal Candidiasis in 5 European Countries and the United States. J Low Genit Tract Dis. 17(3): 340–345. https://doi.org/10.1097/lgt.0b013e318273e8cf
- Makanjuola, O., Bongomin, F. and Fayemiwo, S. (2018). An Update on the Roles of Non-albicans Candida Species in Vulvovaginitis. J Fungi. 4(4): 121. https://doi.org/10.3390/jof4040121
- Foxman, B., Barlow, R., Dʼarcy, H., Gillespie, B. and Sobel, J. D. (2000). Candida vaginitis. Sex Transm Dis. 27(4): 230–235. https://doi.org/10.1097/00007435-200004000-00009
- Rafat, Z., Alipour, N., Esmaeili, E., Mirhasani, F., Yaseri, M., Haghighat, F., Navidi Ghaziani, N. and Kamali Sarvestani, H. (2026). Vulvovaginal candidiasis: A global perspective through systematic review and meta-analysis. Microb Pathogen. 212: 108284. https://doi.org/10.1016/j.micpath.2026.108284
- Niharikaa, J., Singh, R. Y., Menon, R., David, B. G., Hiremath, P. B. and Manobalan, K. (2025). revalence and etiology of vulval pruritus among women across different age groups: A cross-sectional study in a dermatology outpatient department. ndian J Sex Transm Dis AIDS. 46(2): 142–147.https://doi.org/10.4103/ijstd.ijstd_144_24
- Fidel, P. L., Lynch, M. E., Lopez, V. R., Sobel, J. D. and Robinson, R. (1993). Systemic Cell-Mediated Immune Reactivity in Women with Recurrent Vulvovaginal Candidiasis. J Infect Dis. 168(6): 1458–1465. https://doi.org/10.1093/infdis/168.6.1458
- Fong, I. W., McCleary, P. and Read, S. (1992). Cellular immunity of patients with recurrent or refractory vulvovaginal moniliasis. Am J Obstet Gynecol. 166(3): 887–890. https://doi.org/10.1016/0002-9378(92)91356-f
- Fidel, P. L., Barousse, M., Espinosa, T., Ficarra, M., Sturtevant, J., Martin, D. H., Quayle, A. J. and Dunlap, K. (2004). An Intravaginal Live Candida Challenge in Humans Leads to New Hypotheses for the Immunopathogenesis of Vulvovaginal Candidiasis. Infect Immun. 72(5): 2939–2946. https://doi.org/10.1128/iai.72.5.2939-2946.2004
- Cheng, L. C., You, S., Ren, T., Qiu, J. and Hua, K. (2025). Development and characterization of a novel immortalized human vaginal fibroblast cell line for advanced applications in reproductive health. Reprod Biol Endocrinol. 23(1): 56. https://doi.org/10.1186/s12958-025-01393-0
- Ardizzoni, A., Wheeler, R. T. and Pericolini, E. (2021). It Takes Two to Tango: How a Dysregulation of the Innate Immunity, Coupled With Candida Virulence, Triggers VVC Onset. Front Microbiol. 12: e692491. https://doi.org/10.3389/fmicb.2021.692491
- Gardella, B., Cassani, C., Dominoni, M., Pasquali, M. F. and Spinillo, A. (2024). Maintenance pharmacological therapy of recurrent vulvovaginal candidiasis. A Bayesian network meta-analysis of randomized studies. Eur J Obstet Gynecol Reprod Biol. 302: 310–316. https://doi.org/10.1016/j.ejogrb.2024.09.040
- Díaz-Navarro, M., Irigoyen-von-Sierakowski, Ã., Delcán, I., Monte, A., Palomo, M., Escribano, P., Guinea, J., Burillo, A., Galar, A., Muñoz, P., et al. (2025). New insights in the role of Candida biofilm in the pathogenesis of recurrent vulvovaginal candidiasis: a prospective clinical study. Front Microbiol. 16: e1566171. https://doi.org/10.3389/fmicb.2025.1566171
- Hasselrot, T., Alvendal, C., Hunt, S., Boger, M. F., Kaldhusdal, V., Damdimopoulos, A., Schuppe‐Koistinen, I., Edfeldt, G., Bohm‐Starke, N., Broliden, K., et al. (2025). Vaginal Transcriptional Signatures of the Neutrophil‐Driven Immune Response Correlate With Clinical Severity During Recurrent Vulvovaginal Candidiasis. Am J Reprod Immunol. 93(1): e70040. https://doi.org/10.1111/aji.70040
- Yano, J., Woznicki, N. A., Sobel, J. D., Meyaski-Schluter, M. C. and Fidel, P. L. (2026). Elevated vaginal heparan sulfate correlates with impaired neutrophil killing of Candida albicans in women with vulvovaginal candidiasis. Infect Immun. 94(3): e00709–25. https://doi.org/10.1128/iai.00709-25
- Pericolini, E., Perito, S., Castagnoli, A., Gabrielli, E., Mencacci, A., Blasi, E., Vecchiarelli, A. and Wheeler, R. T. (2018). Epitope unmasking in vulvovaginal candidiasis is associated with hyphal growth and neutrophilic infiltration. PLoS One. 13(7): e0201436. https://doi.org/10.1371/journal.pone.0201436
- Roselletti, E., Perito, S., Gabrielli, E., Mencacci, A., Pericolini, E., Sabbatini, S., Cassone, A. and Vecchiarelli, A. (2017). NLRP3 inflammasome is a key player in human vulvovaginal disease caused by Candida albicans. Sci Rep. 7(1): 17877. https://doi.org/10.1038/s41598-017-17649-8
- He, X., Tang, Q., Zhan, F., Mao, Y., Ye, F., Weng, Z., Jiang, X. and Swidsinski, A. (2023). Inflammatory invasion on human vaginal mucosa correlated with combined drug treatment and recurrence in recurrent vulvovaginal candidiasis. J Obstet Gynaecol Res. 49(5): 1443–1451. https://doi.org/10.1111/jog.15577
- Ardizzoni, A., Sala, A., Colombari, B., Giva, L. B., Cermelli, C., Peppoloni, S., Vecchiarelli, A., Roselletti, E., Blasi, E., Wheeler, R. T., et al. (2020). Perinuclear Anti-Neutrophil Cytoplasmic Antibodies (pANCA) Impair Neutrophil Candidacidal Activity and Are Increased in the Cellular Fraction of Vaginal Samples from Women with Vulvovaginal Candidiasis. J Fungi. 6(4): 225. https://doi.org/10.3390/jof6040225
- Roselletti, E., Pericolini, E., Nore, A., Takacs, P., Kozma, B., Sala, A., De Seta, F., Comar, M., Usher, J., Brown, G. D., et al. (2023). Zinc prevents vaginal candidiasis by inhibiting expression of an inflammatory fungal protein. Sci Transl Med. 15(725): eadi3363. https://doi.org/10.1126/scitranslmed.adi3363
- Yano, J., Langdon, K., Swor, M., Noverr, M. C. and Fidel, P. L. (2025). Use of Intravaginal Cooling to Provide Symptom Relief in Women With Vulvovaginal Candidiasis and Reduce Immunopathology in an Accompanying Mouse Model. J Infect Dis. 231(4): e813–e821. https://doi.org/10.1093/infdis/jiaf028
- Pericolini, E., Gabrielli, E., Amacker, M., Kasper, L., Roselletti, E., Luciano, E., Sabbatini, S., Kaeser, M., Moser, C., Hube, B., et al. (2015). Secretory Aspartyl Proteinases Cause Vaginitis and Can Mediate Vaginitis Caused by Candida albicans in Mice. mBio. 6(3): e00724–15. https://doi.org/10.1128/mbio.00724-15
- Bruno, V. M., Shetty, A. C., Yano, J., Fidel, P. L., Noverr, M. C. and Peters, B. M. (2015). Transcriptomic Analysis of Vulvovaginal Candidiasis Identifies a Role for the NLRP3 Inflammasome. mBio. 6(2): e00182–15. https://doi.org/10.1128/mbio.00182-15
- Saavedra, M., Taylor, B., Lukacs, N. and Fidel, P. L. (1999). Local Production of Chemokines during Experimental Vaginal Candidiasis. Infect Immun. 67(11): 5820–5826. https://doi.org/10.1128/iai.67.11.5820-5826.1999
- Renga, G., Borghi, M., Oikonomou, V., Mosci, P., Bartoli, A., Renauld, J. C., Romani, L. and Costantini, C. (2018). IL-9 Integrates the Host-Candida Cross-Talk in Vulvovaginal Candidiasis to Balance Inflammation and Tolerance. Front Immunol. 9: e02702. https://doi.org/10.3389/fimmu.2018.02702
- Yano, J., Palmer, G. E., Eberle, K. E., Peters, B. M., Vogl, T., McKenzie, A. N. and Fidel, P. L. (2014). Vaginal Epithelial Cell-Derived S100 Alarmins Induced by Candida albicans via Pattern Recognition Receptor Interactions Are Sufficient but Not Necessary for the Acute Neutrophil Response during Experimental Vaginal Candidiasis. Infect Immun. 82(2): 783–792. https://doi.org/10.1128/iai.00861-13
- Peters, B. M., Coleman, B. M., Willems, H. M. E., Barker, K. S., Aggor, F. E. Y., Cipolla, E., Verma, A. H., Bishu, S., Huppler, A. H., Bruno, V. M., et al. (2019). The Interleukin (IL) 17R/IL-22R Signaling Axis Is Dispensable for Vulvovaginal Candidiasis Regardless of Estrogen Status. J Infect Dis. 221(9): 1554–1563. https://doi.org/10.1093/infdis/jiz649
- Taylor, B. N., Staib, P., Binder, A., Biesemeier, A., Sehnal, M., Röllinghoff, M., Morschhäuser, J. and Schröppel, K. (2005). Profile of Candida albicans-Secreted Aspartic Proteinase Elicited during Vaginal Infection. Infect Immun. 73(3): 1828–1835. https://doi.org/10.1128/iai.73.3.1828-1835.2005
- Yano, J. and Fidel, Jr., P. L. (2011). Protocols for Vaginal Inoculation and Sample Collection in the Experimental Mouse Model of Candida vaginitis. J Visualized Exp.: e3791/3382. https://doi.org/10.3791/3382
- Kosmala, D., Sertour, N., Fróis Martins, R., Spaggiari, L., Ardizzoni, A., LeibundGut-Landmann, S., Pericolini, E., Bougnoux, M. E., d’Enfert, C., Legrand, M., et al. (2024). The pathogenic and colonization potential of Candida africana. Microbes Infect. 26: 105230. https://doi.org/10.1016/j.micinf.2023.105230
- Yano, J., Noverr, M. C. and Fidel, P. L. (2017). Vaginal Heparan Sulfate Linked to Neutrophil Dysfunction in the Acute Inflammatory Response Associated with Experimental Vulvovaginal Candidiasis. mBio. 8(2): e00211–17. https://doi.org/10.1128/mbio.00211-17
- Miao, J., Regan, J., Cai, C., Palmer, G. E., Williams, D. L., Kruppa, M. D. and Peters, B. M. (2023). Glycogen Metabolism in Candida albicans Impacts Fitness and Virulence during Vulvovaginal and Invasive Candidiasis. mBio. 14(2): e00046–23. https://doi.org/10.1128/mbio.00046-23
- Liu, J., Willems, H. M. E., Sansevere, E. A., Allert, S., Barker, K. S., Lowes, D. J., Dixson, A. C., Xu, Z., Miao, J., DeJarnette, C., et al. (2021). A variant ECE1 allele contributes to reduced pathogenicity of Candida albicans during vulvovaginal candidiasis. PLoS Pathog. 17(9): e1009884. https://doi.org/10.1371/journal.ppat.1009884
- Peters, B. M., Palmer, G. E., Nash, A. K., Lilly, E. A., Fidel, P. L. and Noverr, M. C. (2014). Fungal Morphogenetic Pathways Are Required for the Hallmark Inflammatory Response during Candida albicans Vaginitis. Infect Immun. 82(2): 532–543. https://doi.org/10.1128/iai.01417-13
- Richardson, J. P., Willems, H. M. E., Moyes, D. L., Shoaie, S., Barker, K. S., Tan, S. L., Palmer, G. E., Hube, B., Naglik, J. R., Peters, B. M., et al. (2018). Candidalysin Drives Epithelial Signaling, Neutrophil Recruitment, and Immunopathology at the Vaginal Mucosa. Infect Immun. 86(2): e00645–17. https://doi.org/10.1128/iai.00645-17
- Sabbatini, S., Zatini, L., Narducci, E., Rosati, L., Ardizzoni, A., Mencacci, A., Rende, M., Pericolini, E., Galli, F., Bartolini, D., et al. (2024). Modulation of C. albicans-Induced Immune Response in Vaginal Epithelial Cells by Garcinoic Acid. Microorganisms. 12(12): 2455. https://doi.org/10.3390/microorganisms12122455
- Valentine, M., Rosati, D., Dietschmann, A., Schille, T. B., Netea, M. G., Hube, B. and Gresnigt, M. S. (2025). Probiotic Lactobacillus Species Modulate Immune Responses During Vaginal Epithelial Cell Colonization. J Infect Dis. 232(3): e403–e415. https://doi.org/10.1093/infdis/jiaf221
- Pekmezovic, M., Kaune, A. K., Austermeier, S., Hitzler, S. U. J., Mogavero, S., Hovhannisyan, H., Gabaldón, T., Gresnigt, M. S. and Hube, B. (2021). Human albumin enhances the pathogenic potential of Candida glabrata on vaginal epithelial cells. PLoS Pathog. 17(10): e1010037. https://doi.org/10.1371/journal.ppat.1010037
- Valentine, M., Rudolph, P., Dietschmann, A., Tsavou, A., Mogavero, S., Lee, S., Priest, E. L., Zhurgenbayeva, G., Jablonowski, N., Timme, S., et al. (2024). Nanobody-mediated neutralization of candidalysin prevents epithelial damage and inflammatory responses that drive vulvovaginal candidiasis pathogenesis. mBio. 15(3): e03409–23. https://doi.org/10.1128/mbio.03409-23
- Pekmezovic, M., Hovhannisyan, H., Gresnigt, M. S., Iracane, E., Oliveira-Pacheco, J., Siscar-Lewin, S., Seemann, E., Qualmann, B., Kalkreuter, T., Müller, S., et al. (2021). Candida pathogens induce protective mitochondria-associated type I interferon signalling and a damage-driven response in vaginal epithelial cells. Nat Microbiol. 6(5): 643–657. https://doi.org/10.1038/s41564-021-00875-2
- Hitzler, S. U. J., Fernández-Fernández, C., Günther, K., Dietschmann, A., Hovhannisyan, H., Möslinger, A., Austermeier, S., Cristóvão, B., Vascelli, G., Zelante, T., et al. (2025). Host albumin redirects Candida albicans metabolism to engage an alternative pathogenicity pathway. Nat Commun. 16(1): 6447. https://doi.org/10.1038/s41467-025-61701-5
- Rosati, D., Valentine, M., Bruno, M., Pradhan, A., Dietschmann, A., Jaeger, M., Leaves, I., van de Veerdonk, F. L., Joosten, L. A., Roy, S., et al. (2025). Lactic acid in the vaginal milieu modulates the Candida-host interaction. Virulence. 16(1): e2451165. https://doi.org/10.1080/21505594.2025.2451165
- Ricchi, F., Kenno, S., Pedretti, N., Brenna, G., De Seta, F., Ardizzoni, A. and Pericolini, E. (2025). Cutibacterium acnes lysate improves cellular response against Candida albicans, Escherichia coli and Gardnerella vaginalis in an in vitro model of vaginal infection. Front Cell Infect Microbiol. 15: e1578831. https://doi.org/10.3389/fcimb.2025.1578831
- Sohn, K., Senyürek, I., Fertey, J., Königsdorfer, A., Joffroy, C., Hauser, N., Zelt, G., Brunner, H. and Rupp, S. (2006). An in vitro assay to study the transcriptional response during adherence of Candida albicans to different human epithelia. FEMS Yeast Res. 6(7): 1085–1093. https://doi.org/10.1111/j.1567-1364.2006.00130.x
- Buonanno, A., Imparato, M., Maione, A., Carraturo, F., Galdiero, E., Guida, M. and de Alteriis, E. (2025). The Biotherapeutic Potential of a Novel Probiotic Kluyveromyces marxianus Isolated from a Sourdough Starter Against Vaginal Candida albicans Strains. J Fungi. 11(2): 147. https://doi.org/10.3390/jof11020147
- Gabrielli, E., Sabbatini, S., Roselletti, E., Kasper, L., Perito, S., Hube, B., Cassone, A., Vecchiarelli, A. and Pericolini, E. (2016). In vivo induction of neutrophil chemotaxis by secretory aspartyl proteinases of Candida albicans. Virulence. 7(7): 819–825. https://doi.org/10.1080/21505594.2016.1184385
- Kenno, S., Pedretti, N., Spaggiari, L., Ardizzoni, A., Comar, M., Posch, W., Wheeler, R. T., Peppoloni, S. and Pericolini, E. (2025). Vaginal Clinical Isolates of Candida albicans Differentially Modulate Complosome Activation in Vaginal Epithelial Cells. J Fungi. 11(7): 501. https://doi.org/10.3390/jof11070501
- Spaggiari, L., Ardizzoni, A., Ricchi, F., Pedretti, N., Squartini Ramos, C. A., Squartini Ramos, G. B., Kenno, S., De Seta, F. and Pericolini, E. (2024). Fungal burden, dimorphic transition and candidalysin: Role in Candida albicans-induced vaginal cell damage and mitochondrial activation in vitro. PLoS One. 19(5): e0303449. https://doi.org/10.1371/journal.pone.0303449
- Auffray, J., Biteau, N., Cayrel, A., Dacheux, D., Hsein, H., Tchoreloff, P. and Noel, T. (2025). Mucosal passive immunization with monoclonal antibodies targeting Candidalysin and Hyr proteins attenuates vaginal candidiasis in mice. Virulence. 16(1): e2569629. https://doi.org/10.1080/21505594.2025.2569629
- Lowes, D. J., Hevener, K. E. and Peters, B. M. (2020). Second-Generation Antidiabetic Sulfonylureas Inhibit Candida albicans and Candidalysin-Mediated Activation of the NLRP3 Inflammasome. Antimicrob Agents Chemother. 64(2): e01777–19. https://doi.org/10.1128/aac.01777-19
- Willems, H. M. E., Lowes, D. J., Barker, K. S., Palmer, G. E. and Peters, B. M. (2018). Comparative Analysis of the Capacity of the Candida Species To Elicit Vaginal Immunopathology. Infect Immun. 86(12): e00527–18. https://doi.org/10.1128/iai.00527-18
- Rodriguez, E., Savid-Frontera, C., Angiolini, S. C., Hernáez-Sánchez, M. L., Miró, M. S., Viano, M. E., Icely, P. A., Stempin, C. C., Rodriguez-Galan, M. C., Gil, C., et al. (2025). Type-I interferons in Vulvovaginal Candidiasis: Mechanism of epithelial early defense and immune regulation against Candida albicans. Mucosal Immunol. 18(5): 1124–1138. https://doi.org/10.1016/j.mucimm.2025.07.001
- Sala, A., Ardizzoni, A., Spaggiari, L., Vaidya, N., van der Schaaf, J., Rizzato, C., Cermelli, C., Mogavero, S., Krüger, T., Himmel, M., et al. (2023). A New Phenotype in Candida-Epithelial Cell Interaction Distinguishes Colonization- versus Vulvovaginal Candidiasis-Associated Strains. mBio. 14(2): e00107–23. https://doi.org/10.1128/mbio.00107-23
- Li, T., Liu, Z., Zhang, X., Chen, X. and Wang, S. (2019). Therapeutic effectiveness of type I interferon in vulvovaginal candidiasis. Microb Pathogen. 134: 103562. https://doi.org/10.1016/j.micpath.2019.103562
- Gabrielli, E., Pericolini, E., Ballet, N., Roselletti, E., Sabbatini, S., Mosci, P., Decherf, A. C., Pélerin, F., Perito, S., Jüsten, P., et al. (2018). Saccharomyces cerevisiae-based probiotic as novel anti-fungal and anti-inflammatory agent for therapy of vaginal candidiasis. Benefic Microbes. 9(2): 219–230. https://doi.org/10.3920/bm2017.0099
- Gillum, A. M., Tsay, E. Y. H. and Kirsch, D. R. (1984). Isolation of the Candida albicans gene for orotidine-5′-phosphate decarboxylase by complementation of S. cerevisiae ura3 and E. coli pyrF mutations. Mol Gen Genet. 198(1): 179–182. https://doi.org/10.1007/bf00328721
- Poulain, D., Hopwood, V., Vernes, A. and Mackenzie, D. W. R. (1985). Antigenic Variability of Candida Albicans. CRC Crit Rev Microbiol. 12(3): 223–270. https://doi.org/10.3109/10408418509104430
- Sillen, M., Abyad, D. E., Vreys, N., Baldewijns, S., Palmans, I., Goethem, O. V., Cheng, K. O., Velde, G. V., Espinosa, D. E. M., Gouwy, M., et al. (2025). Saccharomyces cerevisiae reduces vulvovaginal candidiasis severity through modulation of fungal pathogenicity and inflammatory responses. Research Square. ers–6795973/v1. https://doi.org/10.21203/rs.3.rs-6795973/v1
- Schindelin, J., Arganda-Carreras, I., Frise, E., Kaynig, V., Longair, M., Pietzsch, T., Preibisch, S., Rueden, C., Saalfeld, S., Schmid, B., et al. (2012). Fiji: an open-source platform for biological-image analysis. Nat Methods. 9(7): 676–682. https://doi.org/10.1038/nmeth.2019
- Tesfamariam, M., Vij, R., Trümper, V., Hube, B. and Brunke, S. (2024). Shining a light on Candida-induced epithelial damage with a luciferase reporter. mSphere. 9(11): e00509–24. https://doi.org/10.1128/msphere.00509-24
- Gresnigt, M. S., Joosten, L. A. B., Verschueren, I., van der Meer, J. W. M., Netea, M. G., Dinarello, C. A. and van de Veerdonk, F. L. (2012). Neutrophil-Mediated Inhibition of Proinflammatory Cytokine Responses. J Immunol. 189(10): 4806–4815. https://doi.org/10.4049/jimmunol.1103551
- Wurster, S., Kumaresan, P. R., Albert, N. D., Hauser, P. J., Lewis, R. E. and Kontoyiannis, D. P. (2019). Live Monitoring and Analysis of Fungal Growth, Viability, and Mycelial Morphology Using the IncuCyte NeuroTrack Processing Module. mBio. 10(3): e00673–19. https://doi.org/10.1128/mbio.00673-19
Article Information
Publication history
Received: Feb 27, 2026
Accepted: Apr 14, 2026
Available online: Apr 30, 2026
Published: May 20, 2026
Copyright
© 2026 The Author(s); This is an open access article under the CC BY-NC license (https://creativecommons.org/licenses/by-nc/4.0/).
How to cite
Groß, V. E., Cheng, K. O., Cristóvão, B., Gürel, E., Himmel, M., Fernández-Fernández, C., Schuchardt, J. V., Dietschmann, A., Montaño, D. E. and Gresnigt, M. S. (2026). An In Vitro A-431 Epithelial Cell Infection Model for Studying Fungal Pathogenicity and Immune Responses Associated With Vulvovaginal Candidiasis. Bio-protocol 16(10): e5693. DOI: 10.21769/BioProtoc.5693.

 Download Citation in RIS Format
Category
Microbiology > Microbe-host interactions > Fungus
Cell Biology > Cell-based analysis > Fungal infection
Immunology > Mucosal immunology > Genitourinary tract
Do you have any questions about this protocol?
Post your question to gather feedback from the community. We will also invite the authors of this article to respond.
 Post a Question


