


- Protocols

- Articles and Issues
- For Authors
- About
- Become a Reviewer


A Step-by-Step GUI-Based Protocol for Molecular Dating Analysis Using PhyloSuite v2

Published: Vol 16, Iss 10, May 20, 2026 DOI: 10.21769/BioProtoc.5688 Views: 1176
Reviewed by: Migla MiskinyteAnonymous reviewer(s)
 PDF
PDF  Ask a question
Original research article
The authors used this protocol in:

Nov 2025
Advertisement



Protocol Collections
Comprehensive collections of detailed, peer-reviewed protocols focusing on specific topics




Abstract
In current genomic research, molecular dating is challenged by both imperfect substitution modeling and analysis efficiency, as genome-scale datasets often exhibit substantial rate heterogeneity and complex patterns of sequence evolution, which can make divergence-time estimation sensitive to modeling assumptions and computational settings. Meanwhile, commonly used molecular dating workflows remain operationally demanding; preparing correctly formatted inputs, implementing model settings, configuring fossil calibrations, and performing basic diagnostics and visualization frequently require multiple tools and extensive manual steps, resulting in high hands-on time and avoidable operational errors. To facilitate the practical implementation of molecular dating analyses and lower the operational barrier for users, this protocol describes a GUI-based workflow in PhyloSuite v2 for molecular dating analysis. Using a dataset of fish nuclear genomes as an example, the tutorial covers multi-format data import, visual configuration of fossil calibrations, automatic selection and implementation of substitution models, automation of complex analytical procedures, and assessment of Markov chain Monte Carlo (MCMC) convergence, along with data visualization. Through this protocol, users can quickly master the full workflow—from input preparation and molecular dating to MCMC sample statistical assessment and timetree visualization—thus significantly enhancing the efficiency of molecular dating analysis and result verification.
Key features
• Guides users through a complete molecular dating workflow in PhyloSuite v2, from input preparation to final output.
• Specifies required inputs, intermediate files, and final outputs for molecular dating analyses.
• Provides a practical visual procedure for setting and checking fossil calibrations before analysis.
• Helps users configure reproducible runs and interpret diagnostic outputs to assess convergence and dating performance.
Keywords: Molecular dating timetree
PhyloSuite v2
MCMCtree
r8s
timetree
PhyloSuite v2
MCMCtree
r8s
Graphical overview
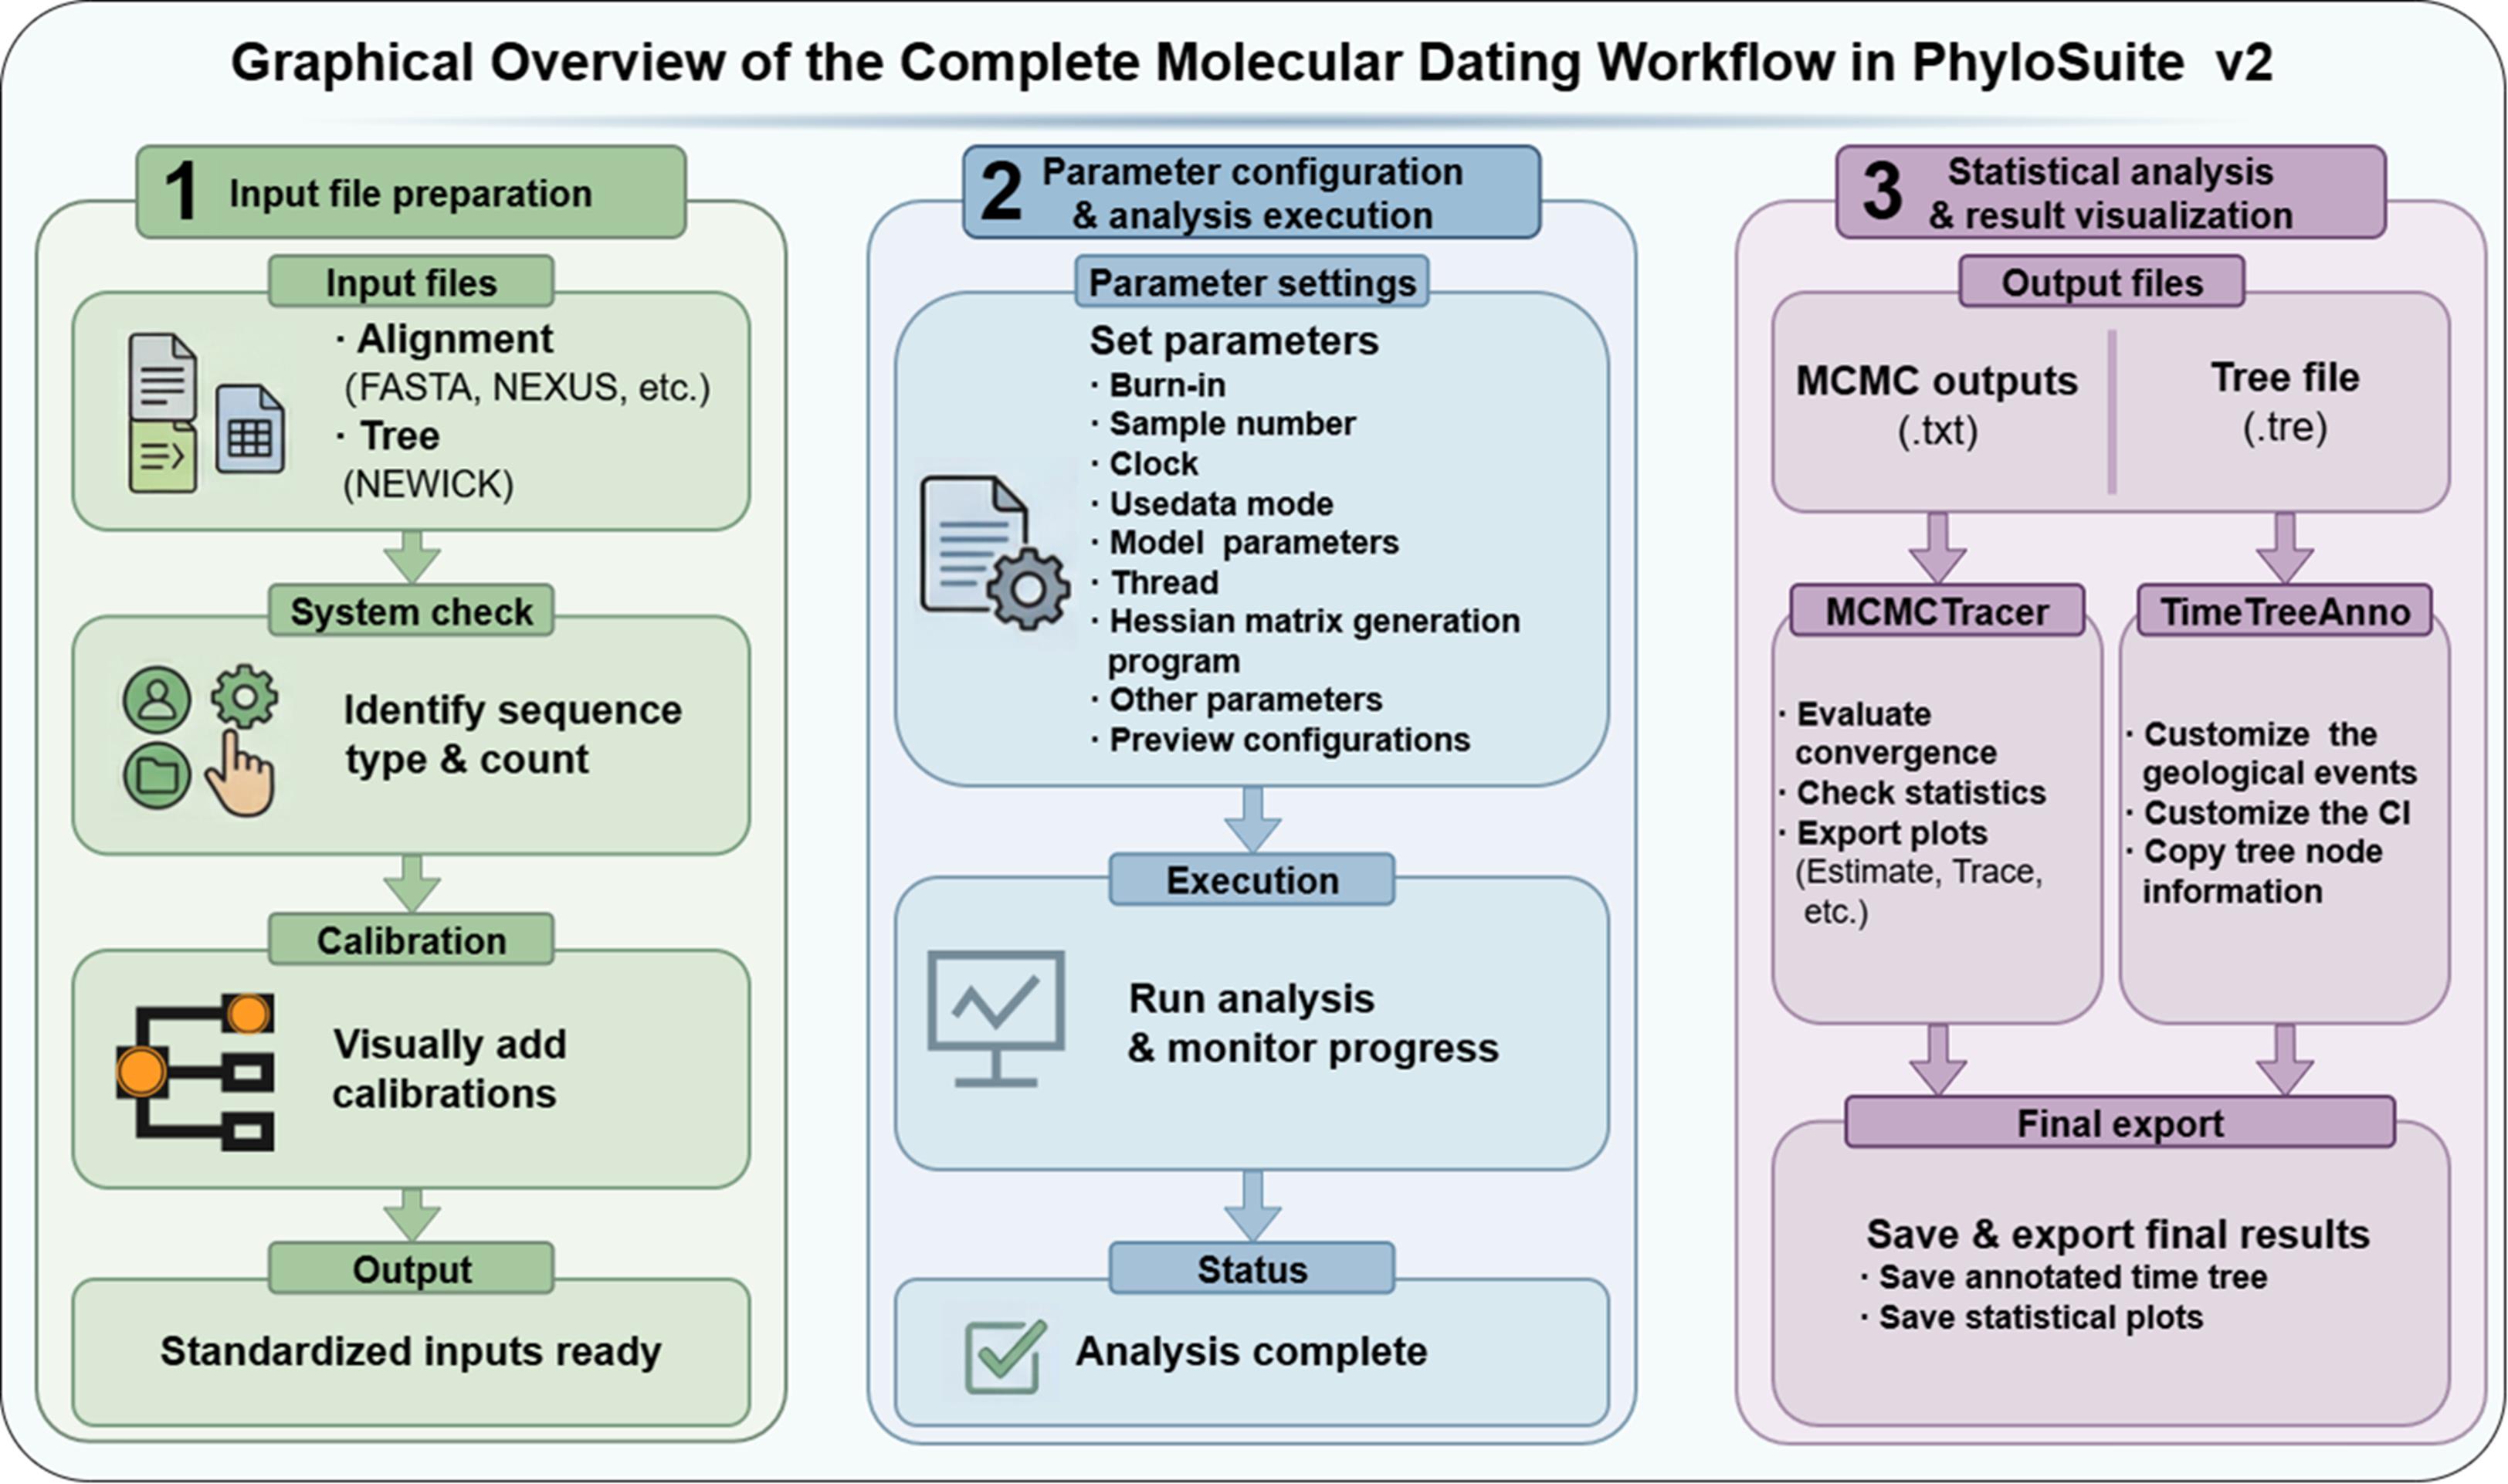
Overall molecular dating workflow implemented in PhyloSuite v2. Briefly, the procedure includes input preparation, fossil calibration setup, parameter configuration and molecular dating analysis in MDGUI, convergence assessment in MCMCTracer, and timetree annotation in TimeTreeAnno. This overview is intended to provide users, especially beginners, with a conceptual guide before proceeding to the detailed step-by-step instructions.
Background
Phylogenetic inference is a cornerstone of evolutionary biology because it provides explicit, testable hypotheses of evolutionary relationships from molecular sequence data [1]. Molecular dating extends phylogenetic inference by placing divergences on an absolute timescale, enabling evolutionary events to be compared with geological history and the fossil record [2]. In the phylogenomic era, molecular clock analyses must often accommodate complex patterns of rate variation and other challenges that become more prominent as data scale increases. Molecular dating is increasingly challenged by both model fit and analysis efficiency for genome-scale datasets. Genome-scale data commonly exhibit substantial rate heterogeneity, making divergence-time estimates sensitive to model specification, calibration strategy, and prior settings [3]. Moreover, because Bayesian dating relies on repeated likelihood calculations throughout Markov chain Monte Carlo (MCMC), phylogenomic datasets often impose substantial computational demands, motivating practical strategies to improve efficiency and stability [4].
A comprehensive molecular dating workflow typically involves interdependent steps, including complex multi-gene data preparation (e.g., sequence alignment, trimming, and concatenation), optimal model selection, rigorous application of clock models, and fossil calibrations [5]. In practice, this process relies heavily on specialized software such as MCMCtree and r8s [6,7]. MCMCtree uses a Bayesian framework to estimate divergence times by integrating sequence data with clock models and fossil calibration priors, whereas r8s uses a penalized likelihood approach that infers divergence times by smoothing rate variation across branches. Accordingly, MCMCtree is generally preferred when prior information and calibration uncertainty need to be modeled more explicitly, whereas r8s may be useful for relatively simpler or computationally lighter analyses. These tools typically operate via command-line interfaces, where parameter configuration is complex and error-prone, thereby representing a significant technical barrier [8]. For example, fossil calibration choices can strongly influence posterior time estimates, and best-practice guidelines stress that calibrations should be explicitly justified and that calibration-derived priors should be evaluated before analysis [9,10]. In addition, because Bayesian dating relies on MCMC sampling, routine convergence assessment (e.g., trace inspection and ESS summaries) is recommended before interpreting posterior estimates [11].
To reduce hands-on time and lower operational barriers for routine analyses, PhyloSuite was developed as an integrated GUI platform for streamlining sequence data management and phylogenetic workflows for multi-gene and genomic datasets [12]. Building on this framework, a major update in PhyloSuite v2 is the introduction of a molecular dating suite, comprising MDGUI (molecular dating analysis), TimeTreeAnno (Timetree annotation and visualization), and MCMCTracer (convergence diagnostics), which were not available in the previous version of the suite [13]. By integrating core programs such as MCMCtree, r8s, and IQ-TREE, this suite aims to provide users with a unified and visualized workflow for molecular dating analyses [14].
In the PhyloSuite v2 interface, the molecular dating workflow described here is mainly implemented through the modules under the Phylogeny menu, whereas other menus such as Flowchart, File, Alignment, and Mitogenome are primarily used for workflow organization, file management, sequence alignment-related operations, and mitogenome-oriented analyses, respectively. A more detailed introduction to these general functions can be found in our previous paper [15].
Using a dataset of fish nuclear genomes as a case study, this protocol provides a detailed tutorial demonstrating how to leverage PhyloSuite v2 to efficiently and accurately execute the entire analysis pipeline—from molecular dating to visualization—offering a user-friendly solution for the research community.
Users can locate three plugins—MDGUI, TimeTreeAnno, and MCMCTracer—by hovering over the Phylogeny menu in the main interface of PhyloSuite v2 (Figure 1).
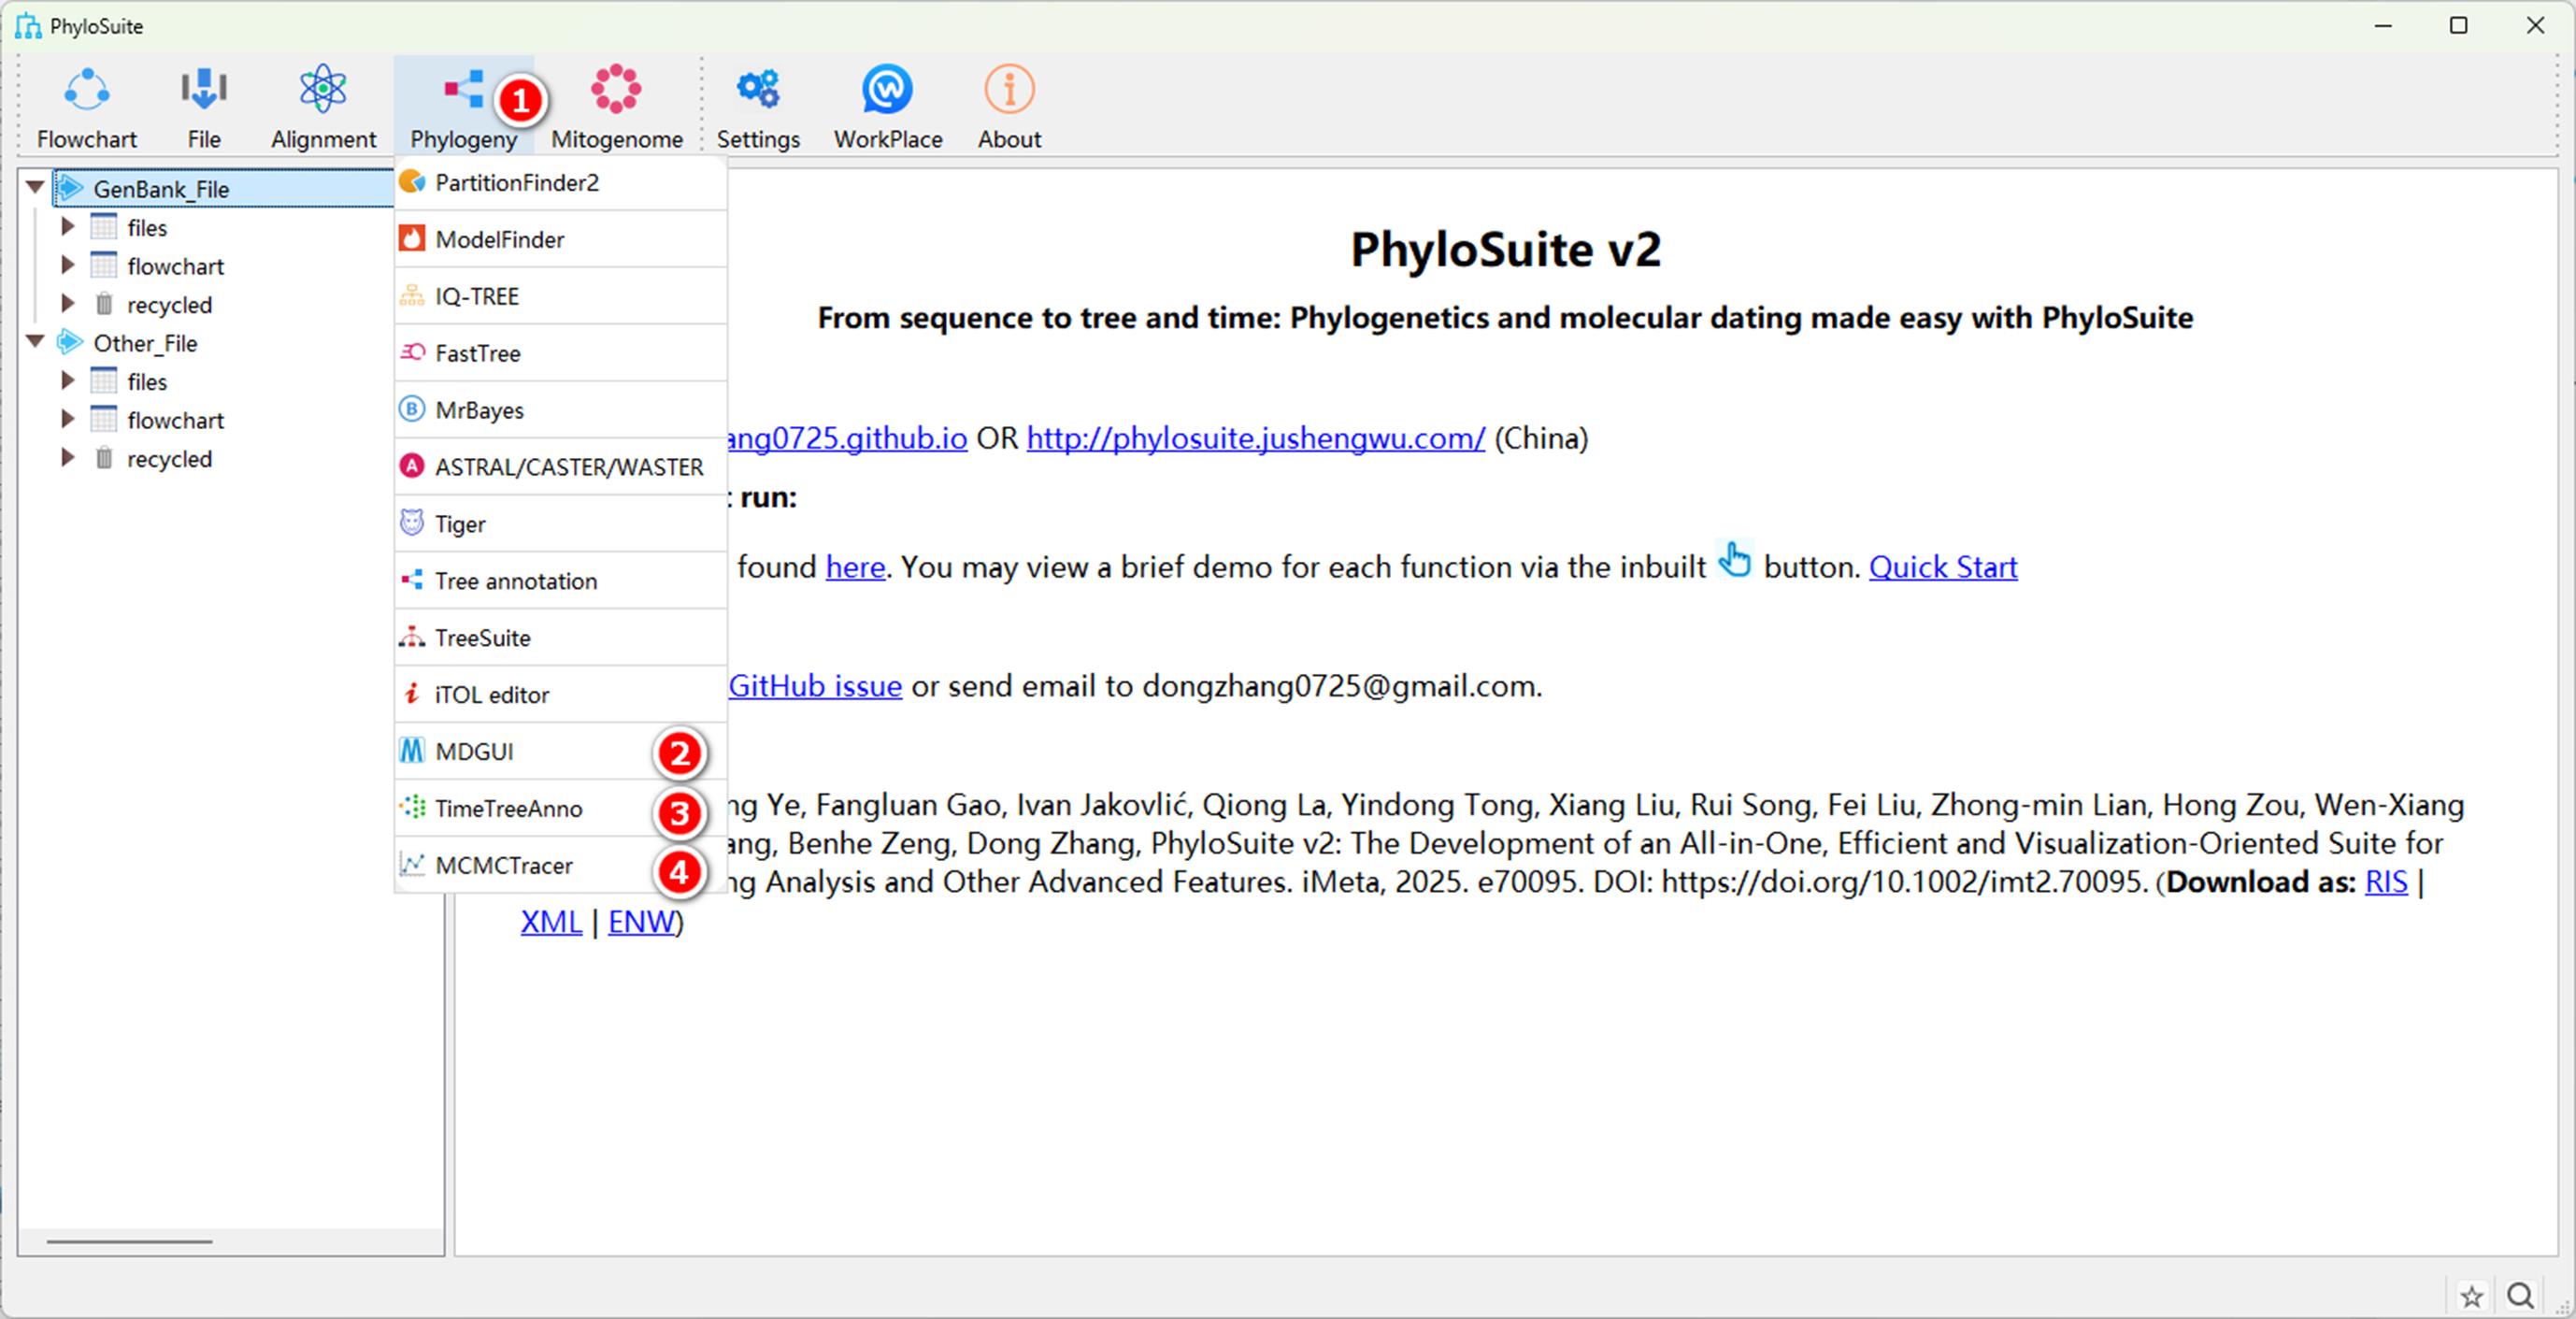
Figure 1. Entry point of the molecular dating analysis suite in PhyloSuite v2. Screenshot showing the location from which users can access the integrated molecular dating analysis suite within the PhyloSuite v2 main interface: (1) phylogeny option in the main interface; (2) entry point of MDGUI; (3) entry point of TimeTreeAnno; (4) entry point of MCMCTracer.
Software and datasets
1. PhyloSuite v2 (https://github.com/dongzhang0725/PhyloSuite, 2025/11/26)
2. Genomic data of Antarctic notothenioid fish (https://datadryad.org/dataset/doi:10.5061/dryad.80gb5mktn, 2022/12/09)
Note: The tutorial dataset used in this protocol was tested on a computer equipped with an Intel Ultra 5 125H CPU and 32 GB RAM. During routine execution, RAM usage was generally around 1.1 GB, with a peak of approximately 1.2 GB, while CPU usage was approximately 0.3%–2.7%. Considering that users may run other software simultaneously, we recommend that the local machine have at least 16 GB of RAM when running this tutorial dataset. Larger datasets may require additional memory.
Environment and download
PhyloSuite is primarily written in Python and has been compiled to run on Windows, macOS, and Linux operating systems. To ensure that all necessary dependencies are included, users are recommended to download the version with plugins (bundled version). The latest version of PhyloSuite can be downloaded at https://github.com/dongzhang0725/PhyloSuite.
Tip: Users can download example files from the official website (http://phylosuite.jushengwu.com/example.zip) for software testing and debugging purposes.
Procedure
A. MDGUI-MCMCtree
MDGUI integrates MCMCtree for molecular dating; the steps below walk through the run setup and execution within the GUI.
1. File input
a. Drag-and-drop import
i. Sequence alignment file (alignment): Import multi-sequence alignment files (FASTA, NEXUS, PHYLIP formats are supported) into the file input box (Figure 2A). The input should be a pre-aligned dataset suitable for phylogenetic analysis, and all taxa included in the alignment should correspond exactly to those in the input tree file.
ii. Tree file (Treefile): Import a phylogenetic tree file (recommended in nwk format). The input should contain the same taxa as the alignment file, with matching taxon names, so that the downstream molecular dating analysis can be performed correctly.
Tip: MDGUI supports three import methods: drag-and-drop, button import, or automatic import from upstream results (Figure 2B, C).
iii. After importing, the program will automatically detect the sequence type (AAs, nucleotides, codon) and display it in the “seqtype” option.
iv. Enabling tip-dating analyses: Enable this option only for datasets in which terminal sequences have explicit sampling dates, such as heterochronously sampled viral or other time-stamped data.
v. After importing the tree, click Add calibration points in tree to open the fossil calibration visualization interface (see section A2).
vi. For big trees, users can alternatively click the Add calibration using taxa (big tree) button to add fossil calibration.
vii. The software automatically detects the number of species and displays it. Make sure that species names match between the alignment and tree files, as mismatches will trigger an error warning.
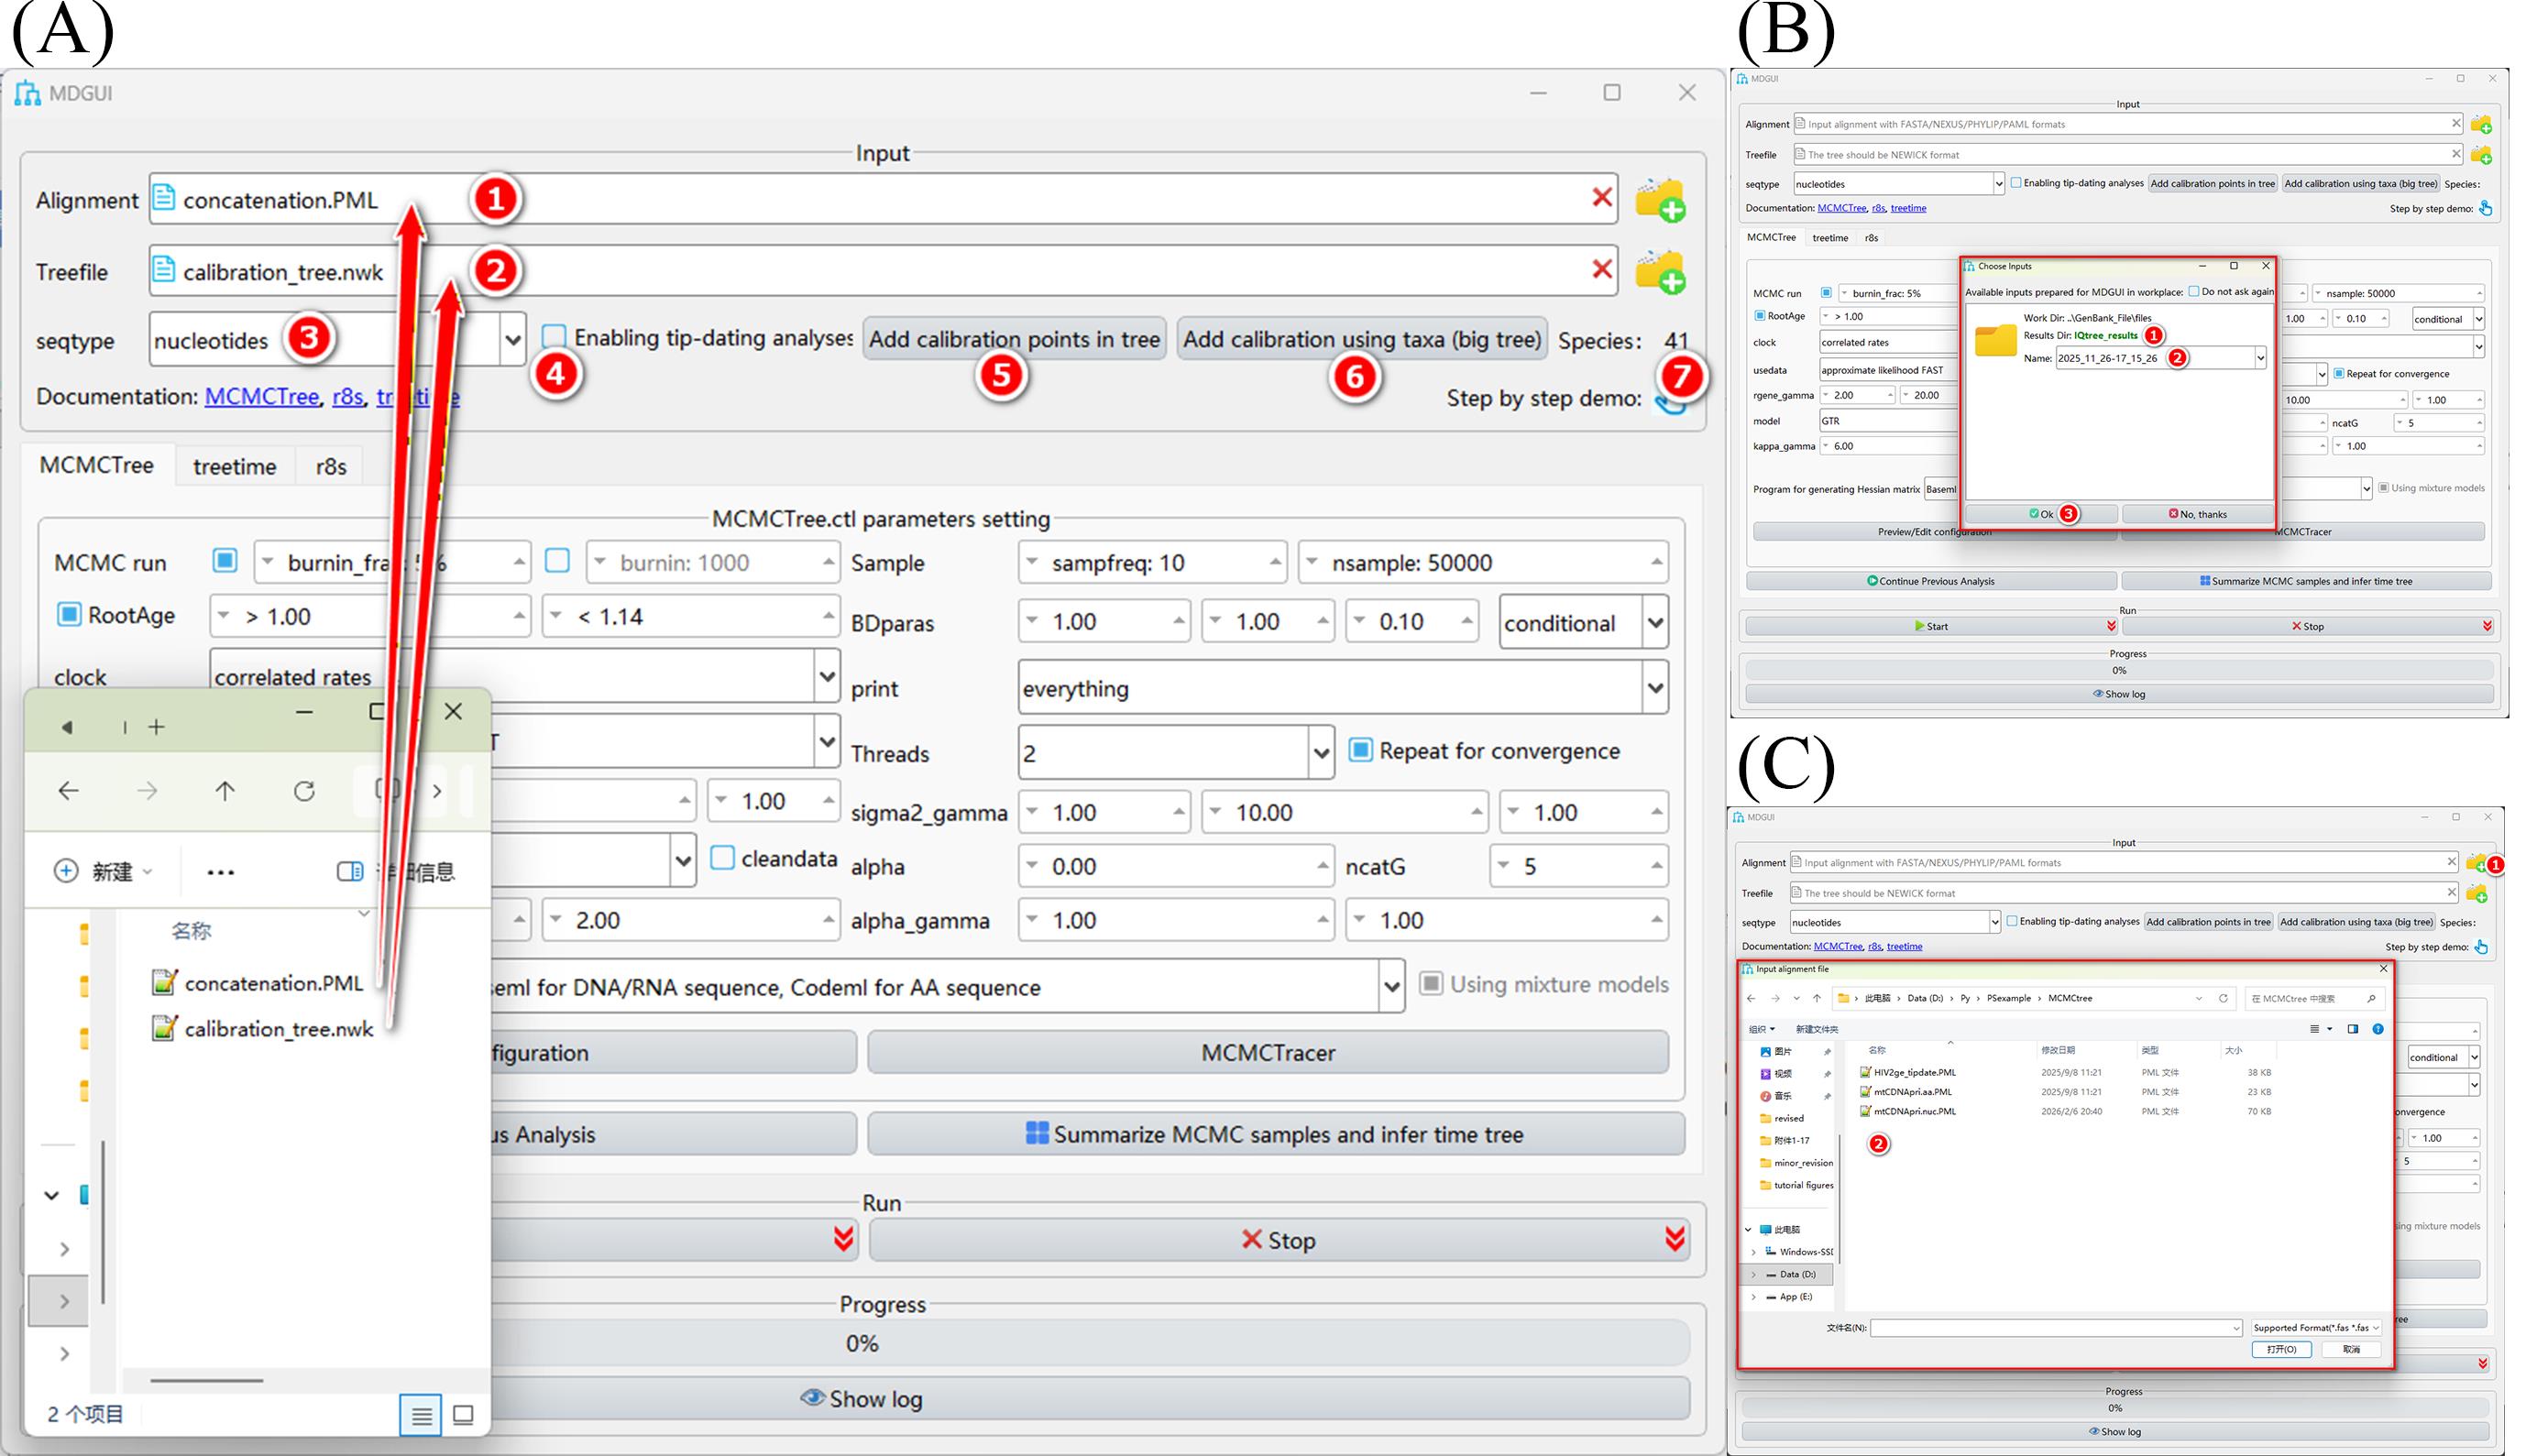
Figure 2. Different ways of file import into MDGUI. (A) Drag-and-drop file import from a folder: (1) alignment file input box; (2) tree file input box; (3) automatically detected sequence type; (4) option for enabling tip-dating analysis; (5) button for opening the fossil calibration visualization interface; (6) button for adding fossil calibrations in large trees; (7) number of species. (B) Automatic import from upstream analysis: (1) window showing automatically detected result folders from upstream analyses; (2) folder selected for import; (3) “confirm input” button. (C) Button-based file import from a pop-up window: (1) folder icon for opening a file browser; (2) pop-up window listing suitable input files for selection and import.
b. Automatic import
i. When MDGUI launches, the software automatically detects result folders from upstream analyses (e.g., IQ-TREE, MrBayes, FastTree) and opens a selection window (Figure 2B). Users can also trigger this window by clicking on the Alignment input box.
ii. Choose the folder containing the results to import.
iii. After confirming the selection, PhyloSuite will automatically pick the appropriate result files from the folder and import them into MDGUI’s “Alignment” and “Treefile” input fields.
c. Button-based import
i. Click the folder icon next to the Alignment or Treefile to open a file browser (Figure 2C).
ii. In the opened window, the software automatically filters file types to show a list of suitable input files. Select a file and click the Open button to import it.
Tip: MCMCtree requires a rooted tree, and the root must have a calibration point. Otherwise, MDGUI will prompt an error during the run. See the next section for solutions.
For viral sequences with temporal information in sequence names, select Enabling tip-dating analyses (https://github.com/abacus-gene/paml/wiki/MCMCtree#enabling-tip-dating-analyses-with-mcmctree).
2. Adding fossil calibration points
i. Right-click a node to add or remove calibration information (Figure 3).
ii. For unrooted trees, select a root node and use set as outgroup (root tree).
ii. Click Add calibration to add fossil calibration information. The pop-up interface has three tabs: “MCMCtree” is used for setting calibration information for nodes other than the root; “MCMCtree root node” is used for setting calibration for the root node; and “r8s” is used for setting time calibration information required for r8s analysis (Figure 4).
iv. Remove calibration deletes all calibration information for that node.
v. For MCMCtree analysis, users can save their fossil calibration settings by clicking the m button or the close button.
vi. For r8s analysis, users can save all selected fossil calibration configuration settings by clicking the r button.
Tip: If using MCMCtree for molecular dating, calibration information must be added for the root node (switch to the MCMCtree root node tab in the Calibration formats interface or configure it on the MDGUI main page). In addition, the default time unit for fossil calibration in MCMCtree is 100 MYA, whereas that in r8s is 1 MYA. Users should be aware of this distinction when setting calibration information.
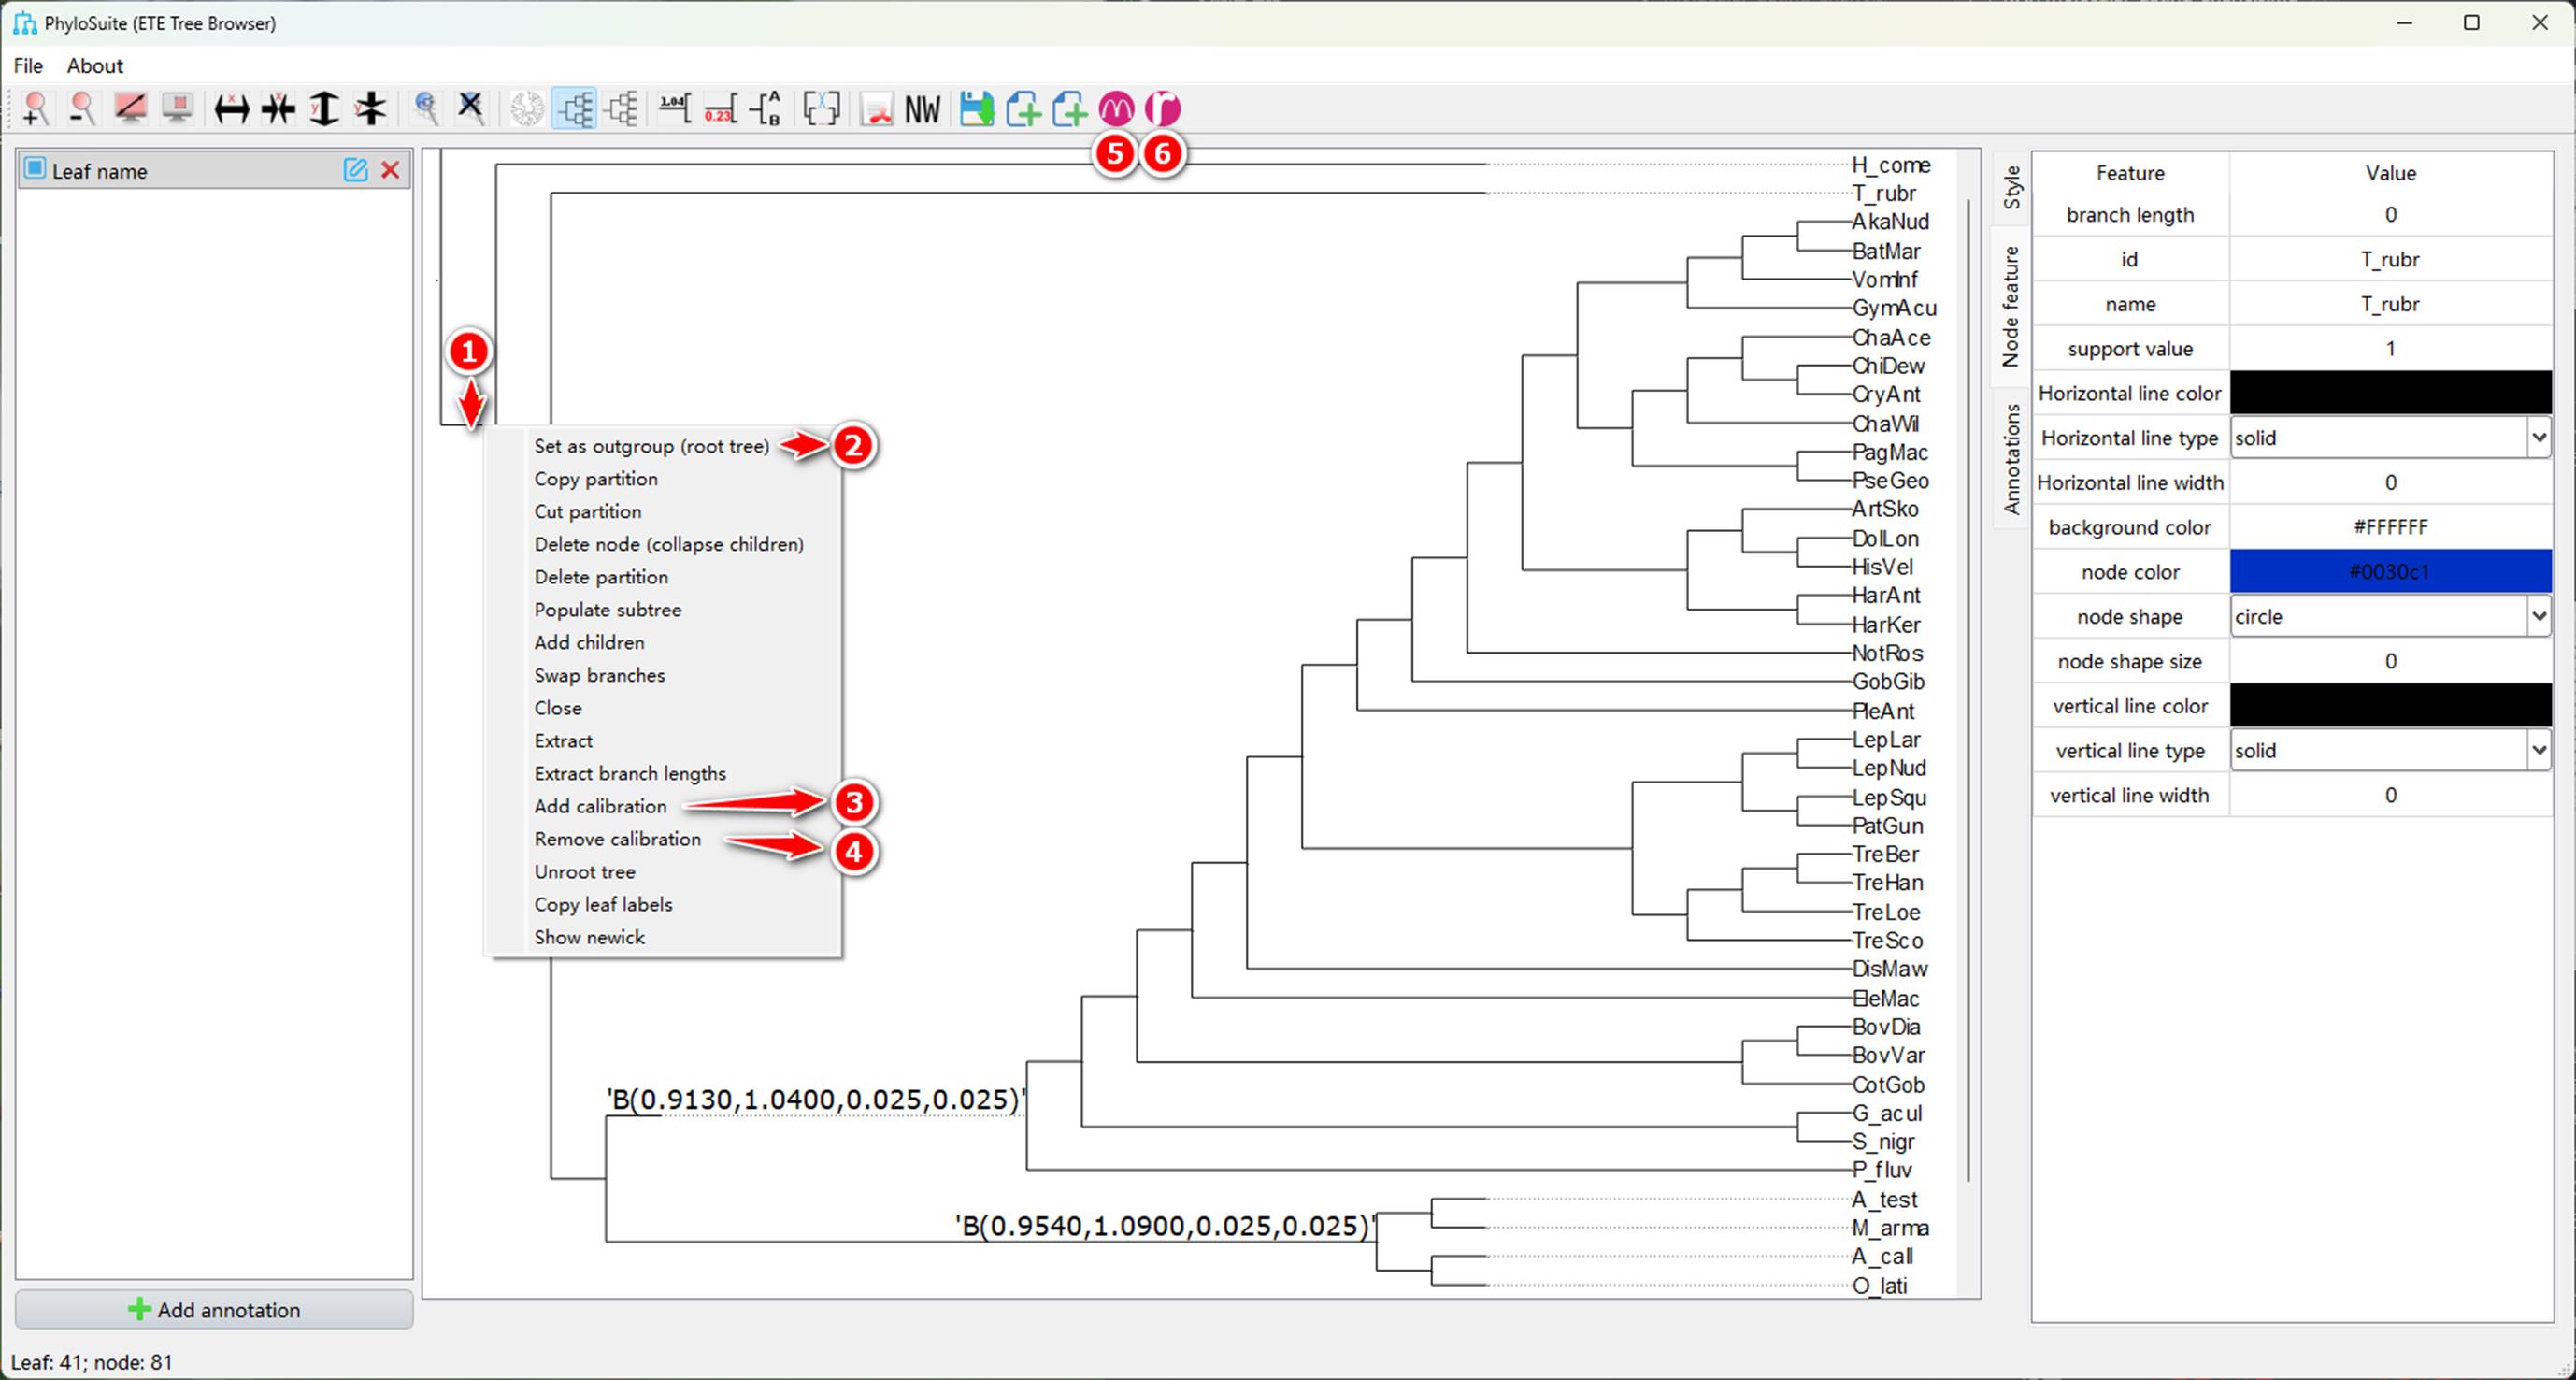
Figure 3. Fossil calibration visualization interface. Interface for visually adding fossil calibration constraints to internal nodes of the phylogenetic tree prior to running molecular dating analyses: (1) right-click menu at a selected node; (2) option for rooting an unrooted tree by setting the selected node as the outgroup; (3) button for opening the calibration setting window; (4) button for removing calibration information from the selected node; (5) button for saving fossil calibration settings for MCMCtree analysis; (6) button for saving fossil calibration settings for r8s analysis.
a. For the root node
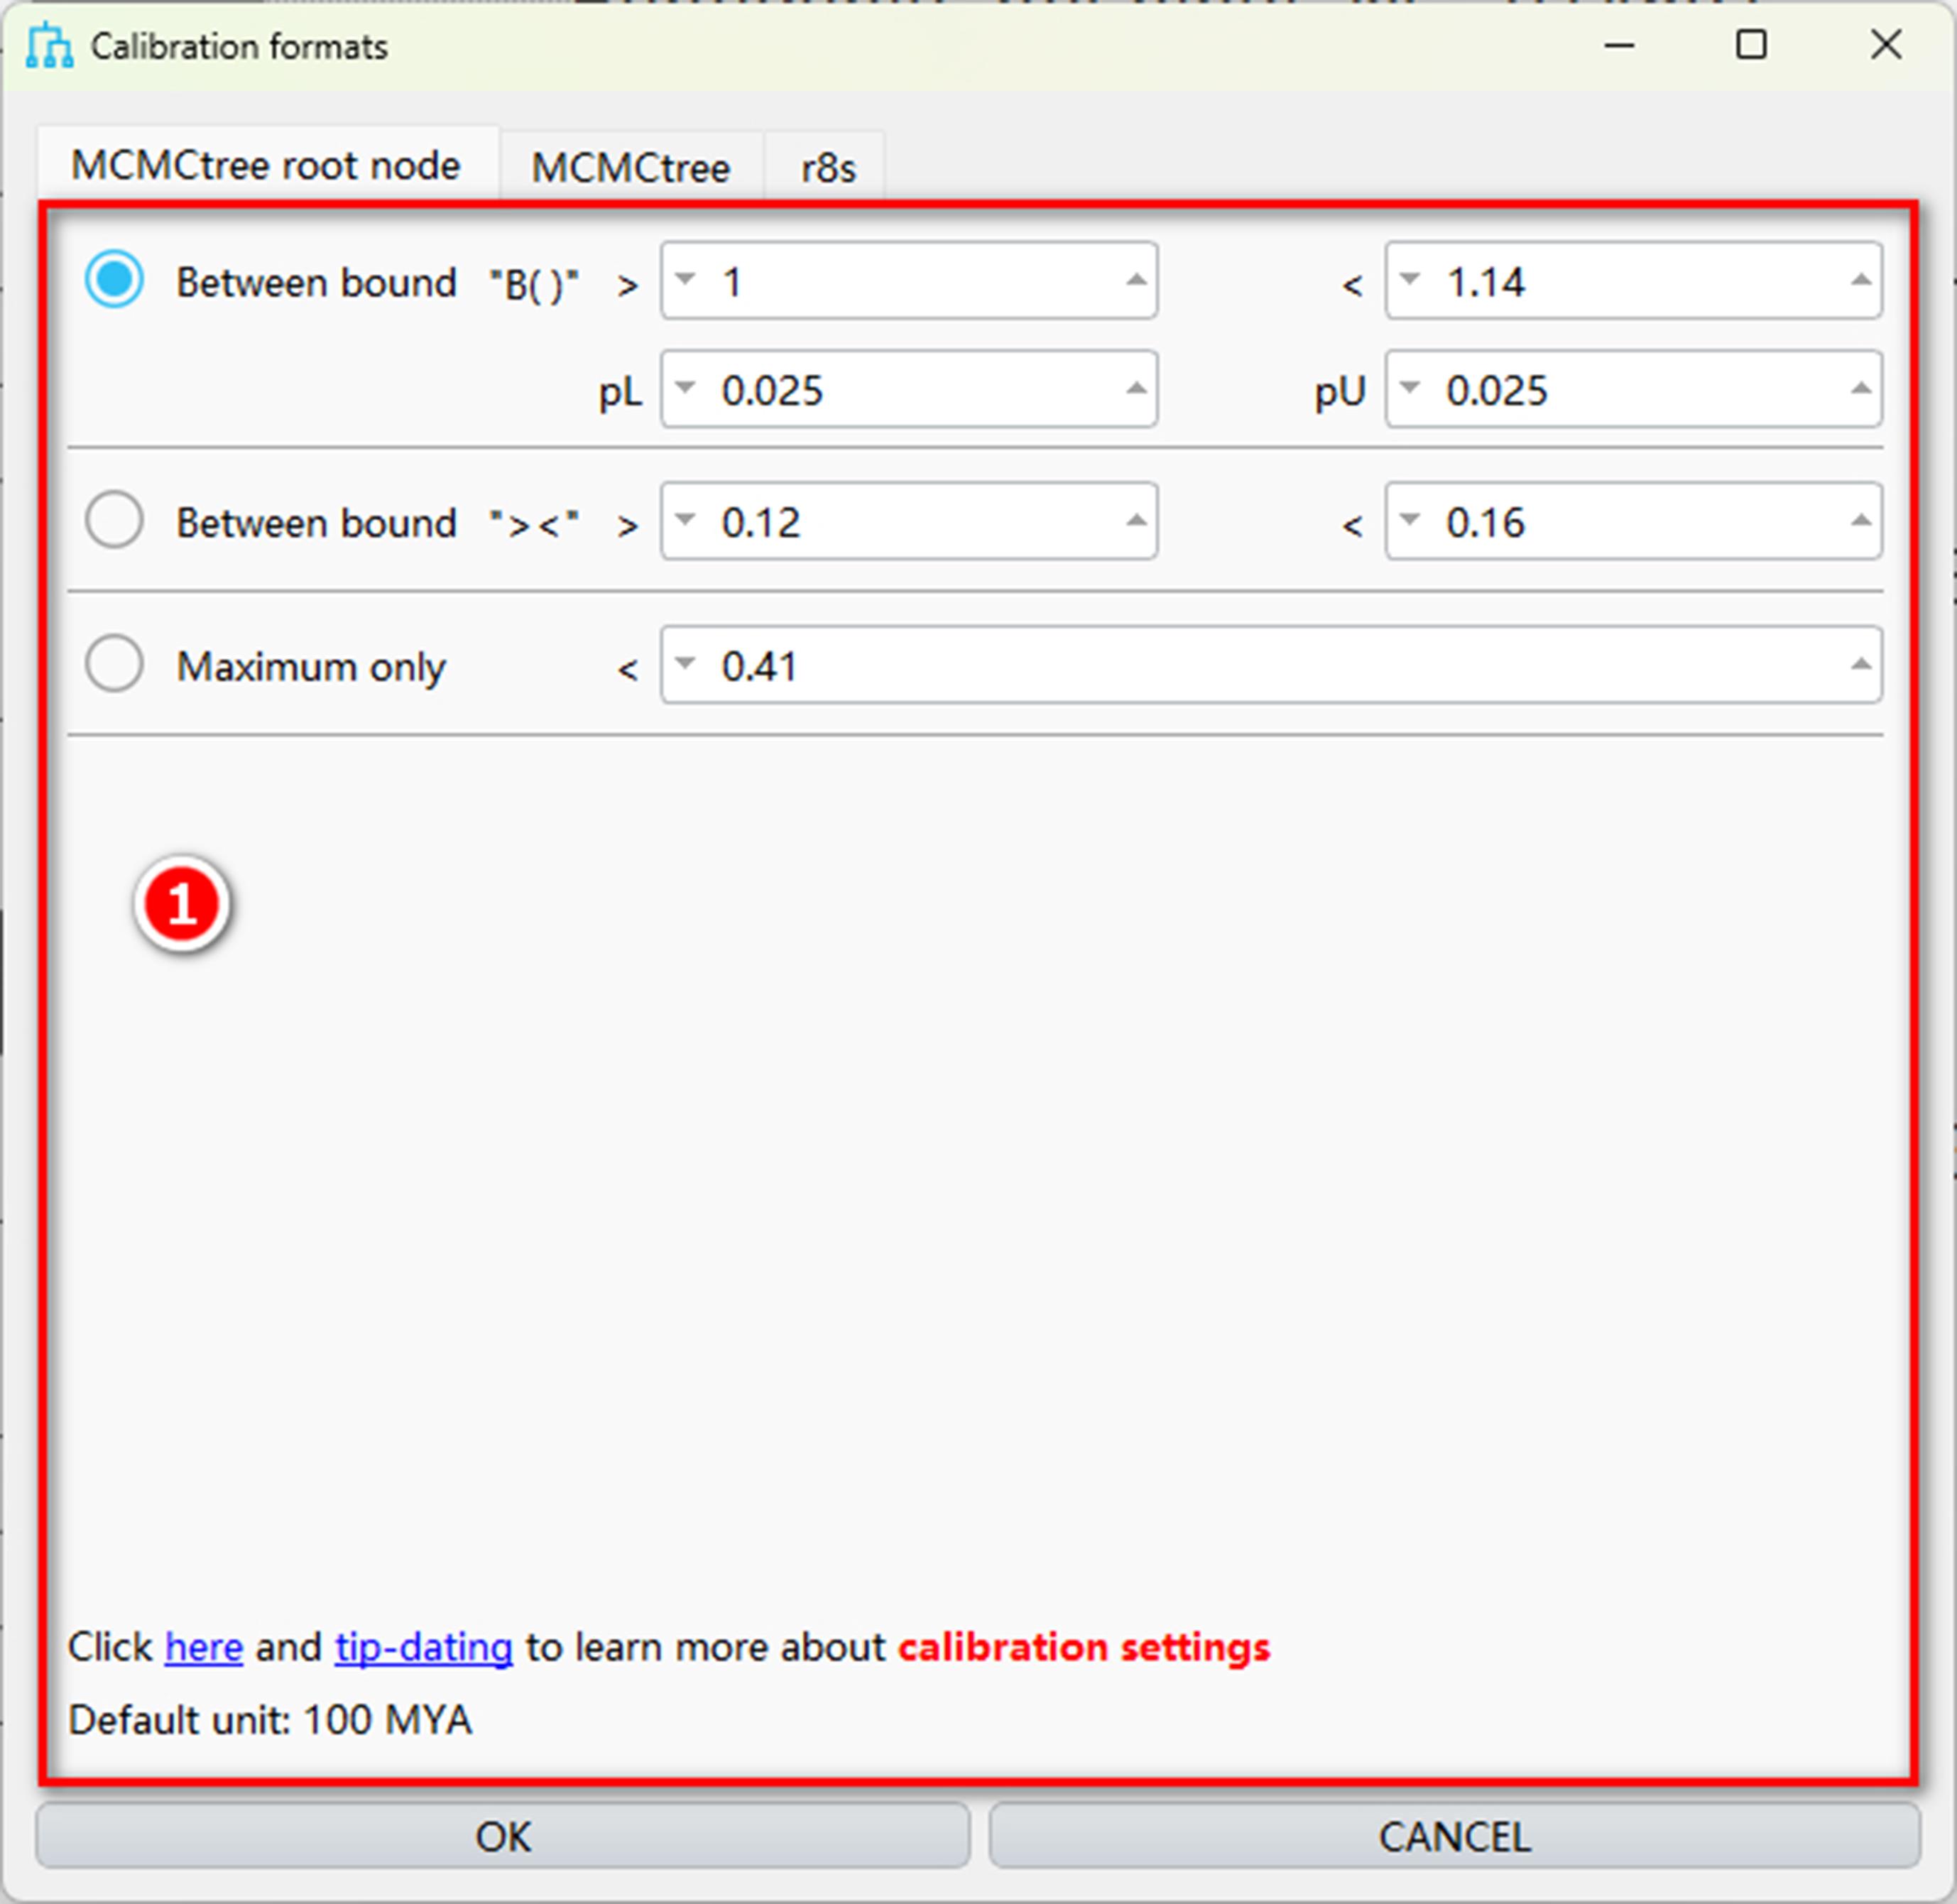
Figure 4. Formats of root node calibration. Window for setting root node calibration in MCMCtree: (1) three supported formats for root node calibration.
i. Set root node calibration in the MCMCtree root node tab (Figure 4) or use the Rootage parameter on the MDGUI main interface.
b. For the other nodes
i. Switch to the MCMCtree tab to configure time information for nodes other than the root (Figure 5). In MCMCtree, commonly used calibration formats include three basic soft-bound types:
(1) Between bounds: formats such as “>0.06 <0.08” or “B (0.06, 0.08),” indicating that the time is between 6 and 8 million years ago (MYA; the basic unit is 100 million years).
(2) Minimum only: minimum time, formats such as “>0.06” or “L (0.06),” indicating that the age is at least 6 MYA.
(3) Maximum only: maximum time, formats such as “<0.08” or “U (0.08),” indicating that the age is at most 8 MYA.
These are all soft-bound calibrations, implying that there is a small probability that the true time falls outside the specified limits. In MCMCtree, this probability is set to 0.025 (2.5%) by default, but users may modify it according to their calibration assumptions; smaller values impose stricter effective bounds, whereas larger values allow more probability mass outside the specified limits.
In addition to these simple bounds, more complex parametric probability distributions can be used when calibration uncertainty cannot be adequately described by minimum and maximum bounds alone. This is particularly useful when a fossil provides a relatively reliable minimum age, but the maximum age is more uncertain. In such cases, a skewed distribution may better reflect the expected asymmetry of the calibration prior.
(4) Gamma: format as “G (alpha, beta).”
(5) Skew normal: format as “SN (location, scale, shape).”
(6) Skew t: format as “ST (location, scale, shape, df).”
Compared with the Skew normal option, the Skew t option allows heavier tails and may be useful when greater uncertainty toward older ages needs to be accommodated.
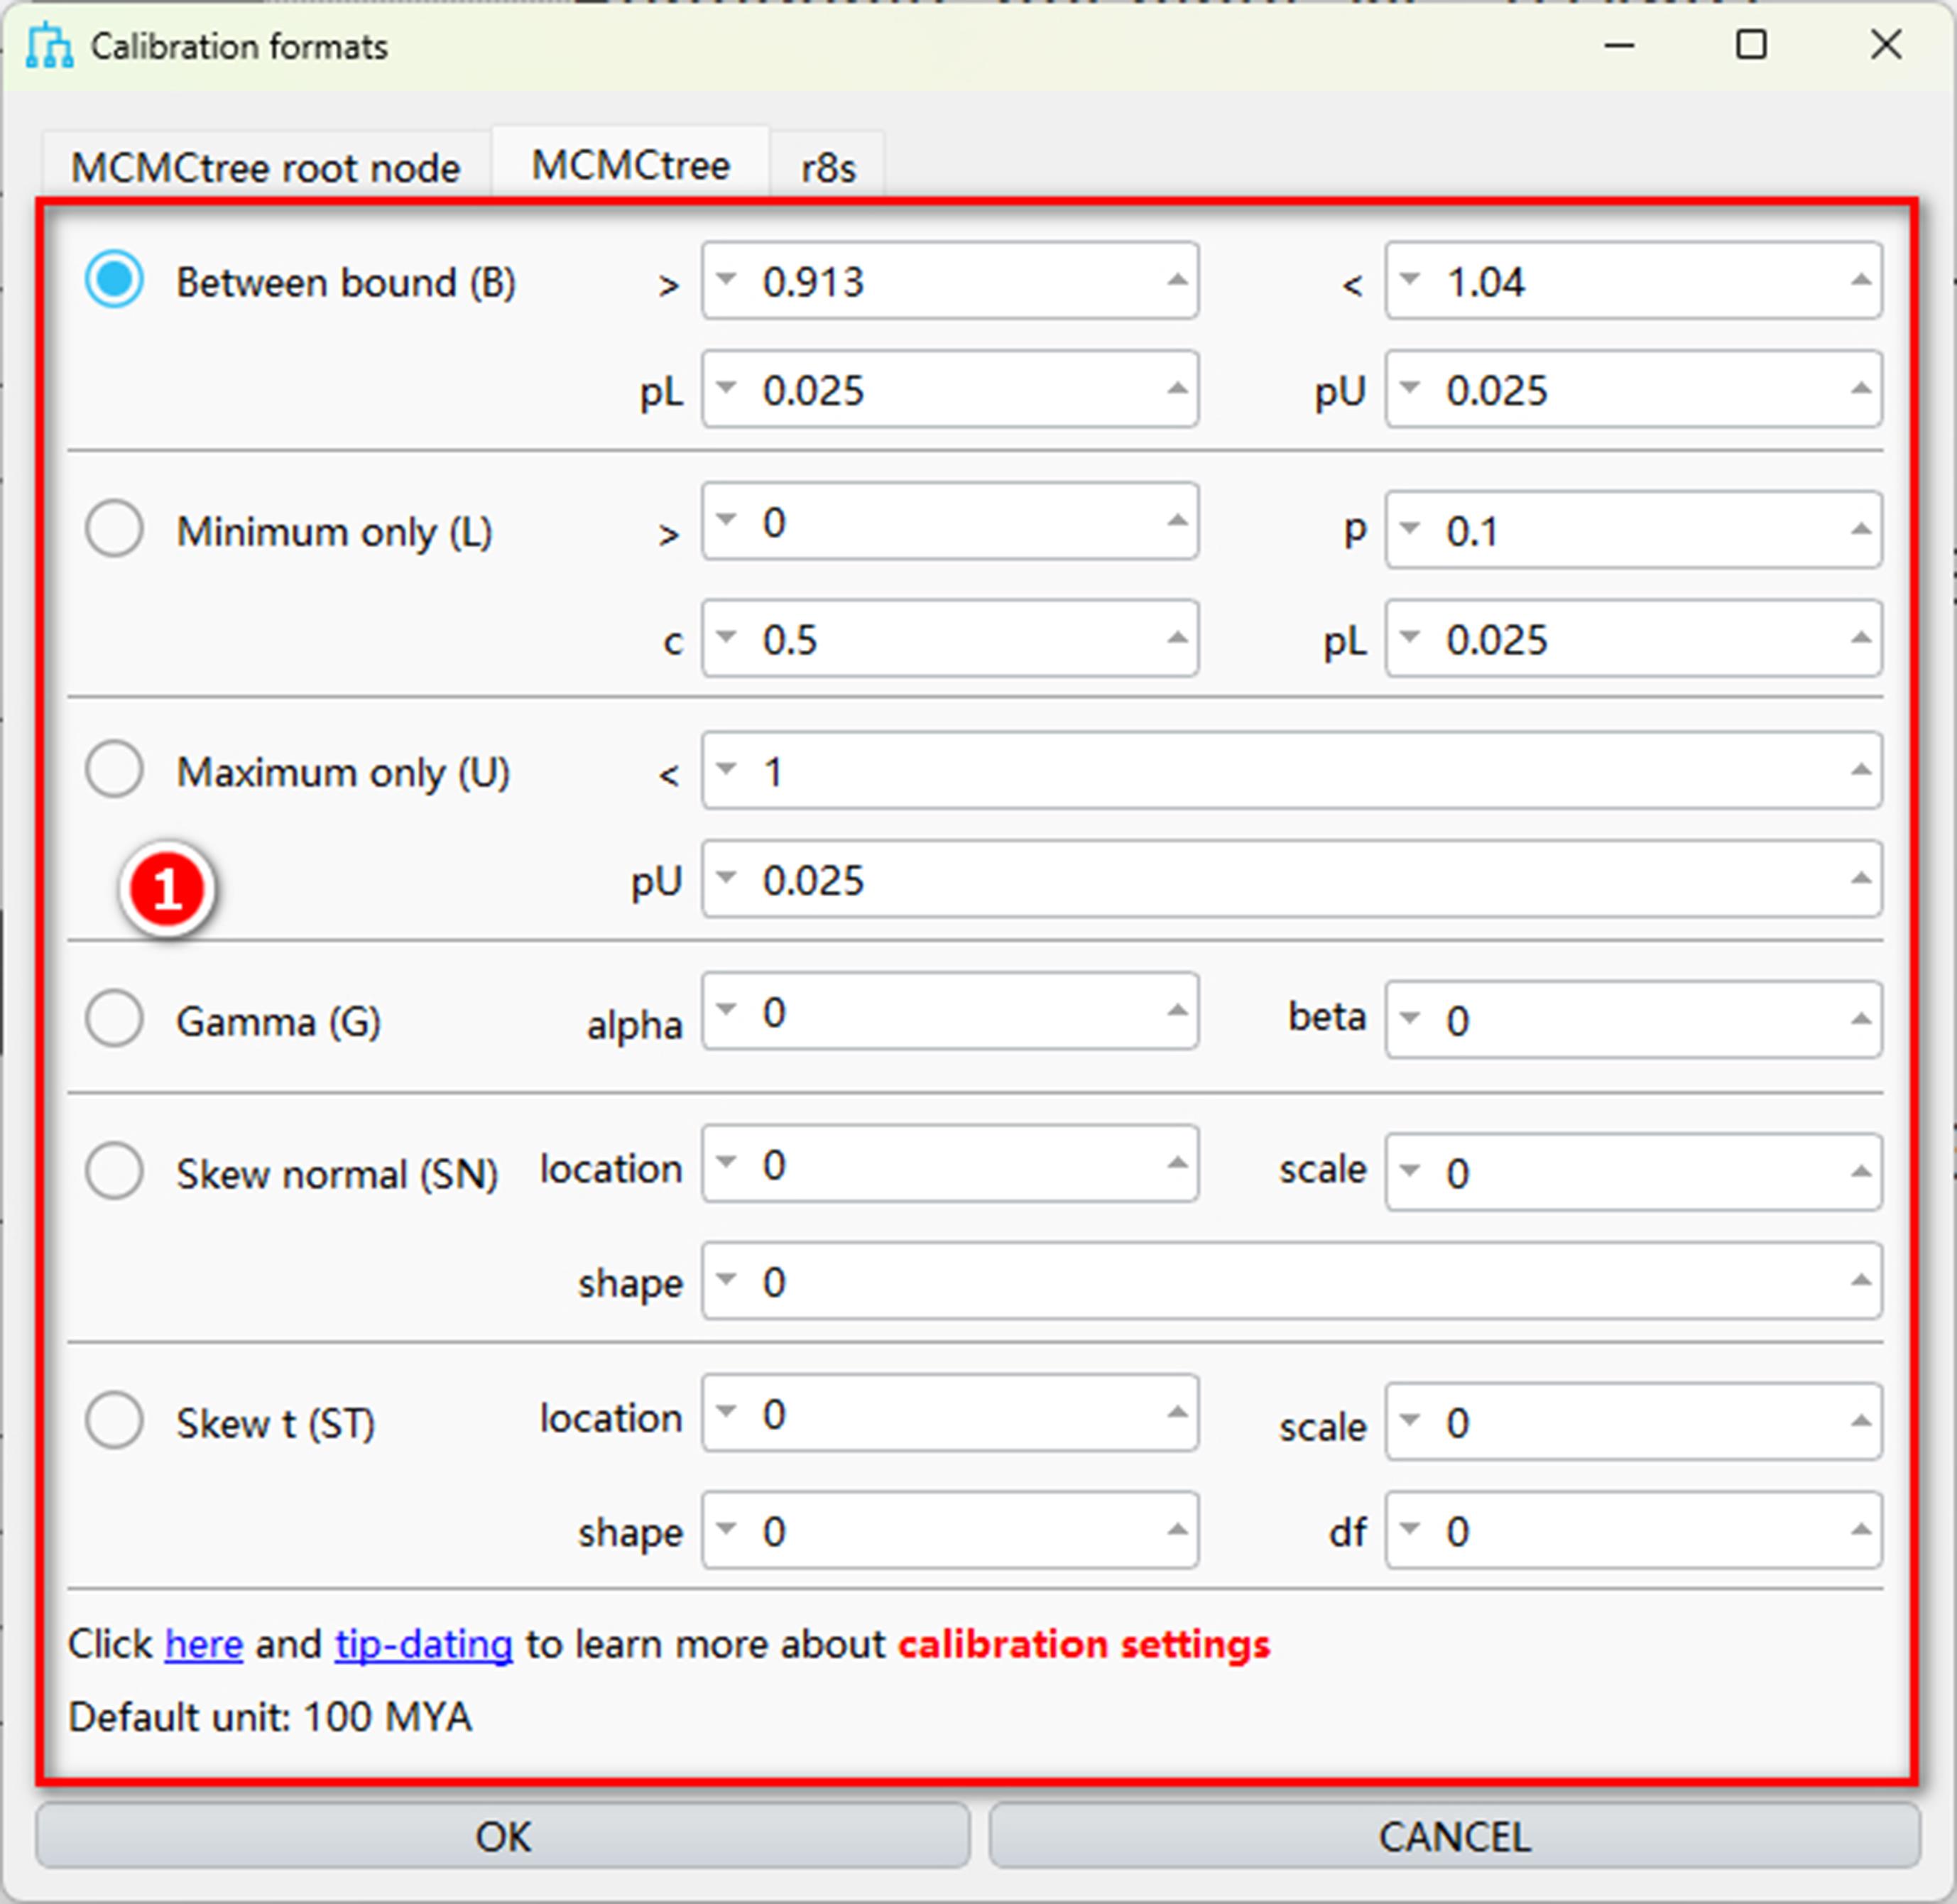
Figure 5. Formats of other nodes calibration. Window for setting fossil calibrations for non-root nodes in MCMCtree: (1) six supported formats for non-root node calibration.
3. MDGUI-MCMCtree parameter settings
The parameters of MDGUI-MCMCtree are consistent with the command-line version of MCMCtree, but significant improvements have been made regarding the usability and automation (Figure 6). For instance, when a user selects a model not enabled by default in MCMCtree (e.g., GTR or amino acid models), MDGUI automatically sets the usedata parameter to “approximate likelihood FAST.”
a. Burnin (burn-in generation setting): Unlike the original version, which requires a specific number of generations, this setting allows users to set a percentage of total generations (e.g., 10%) or a specific number. When a percentage is set, the software automatically calculates the number of steps corresponding to this percentage of the total generations as the burn-in period and discards this data during subsequent analyses, so that samples are taken after the MCMC chain has approached a stationary distribution and are therefore more suitable for parameter estimation.
b. RootAge: This parameter is used to specify the calibration range for the root age. If this option is not selected, the root calibration should instead be specified in the graphical fossil calibration interface when adding calibration information.
c. Usedata: The command-line version of MCMCtree supports only five nucleotide substitution models (JC69, K80, F81, F84, and HKY85) for direct use. If other nucleotide models (e.g., T92, T93, GTR, UNREST) or amino acid models (e.g., WAG, MtZoa, LG) are required, the usedata parameter must be manually configured to calculate the Hessian matrix in conjunction with the Baseml or Codeml in three to four steps (the specific steps are described in the PhyloSuite v2 article [13]).
In MDGUI, users simply set usedata to “approximate likelihood FAST” mode to complete all steps with a single click, eliminating the need for manual configuration. Selecting the “no data (prior)” or “seq like (exact likelihood) SLOW” options is equivalent to manually setting usedata = 0 or usedata = 1 in the configuration file, respectively.
d. Threads (the number of independent MCMC chains): When the data volume is large (e.g., genomic data or many species), this parameter can be used to run multiple MCMC chains simultaneously. Upon completion, PhyloSuite merges the sample files (mcmc.txt) from these chains for statistical analysis, thereby shortening the analysis time. Details on the implementation and handling of parallel MCMC chains are discussed at https://github.com/abacus-gene/paml/issues/74.
e. Repeat for convergence (automatically repeat molecular dating analysis for convergence assessment): It is recommended to check this option. The software will evenly distribute the MCMC chains into two repeat folders (repeat1 and repeat2) based on the number of threads. For example, if users set “Threads” to 4, chains run1 and run2 will run in repeat1, while run3 and run4 will run in repeat2. If “Threads” is set to an odd number (e.g., 5), MDGUI will reduce the count by 1 (to 4) to ensure even distribution. After analysis, a file containing all MCMC samples (all_mcmc_runs.txt) is generated in each repeat folder, facilitating convergence diagnostics and reliability assessment using tools like MCMCTracer.
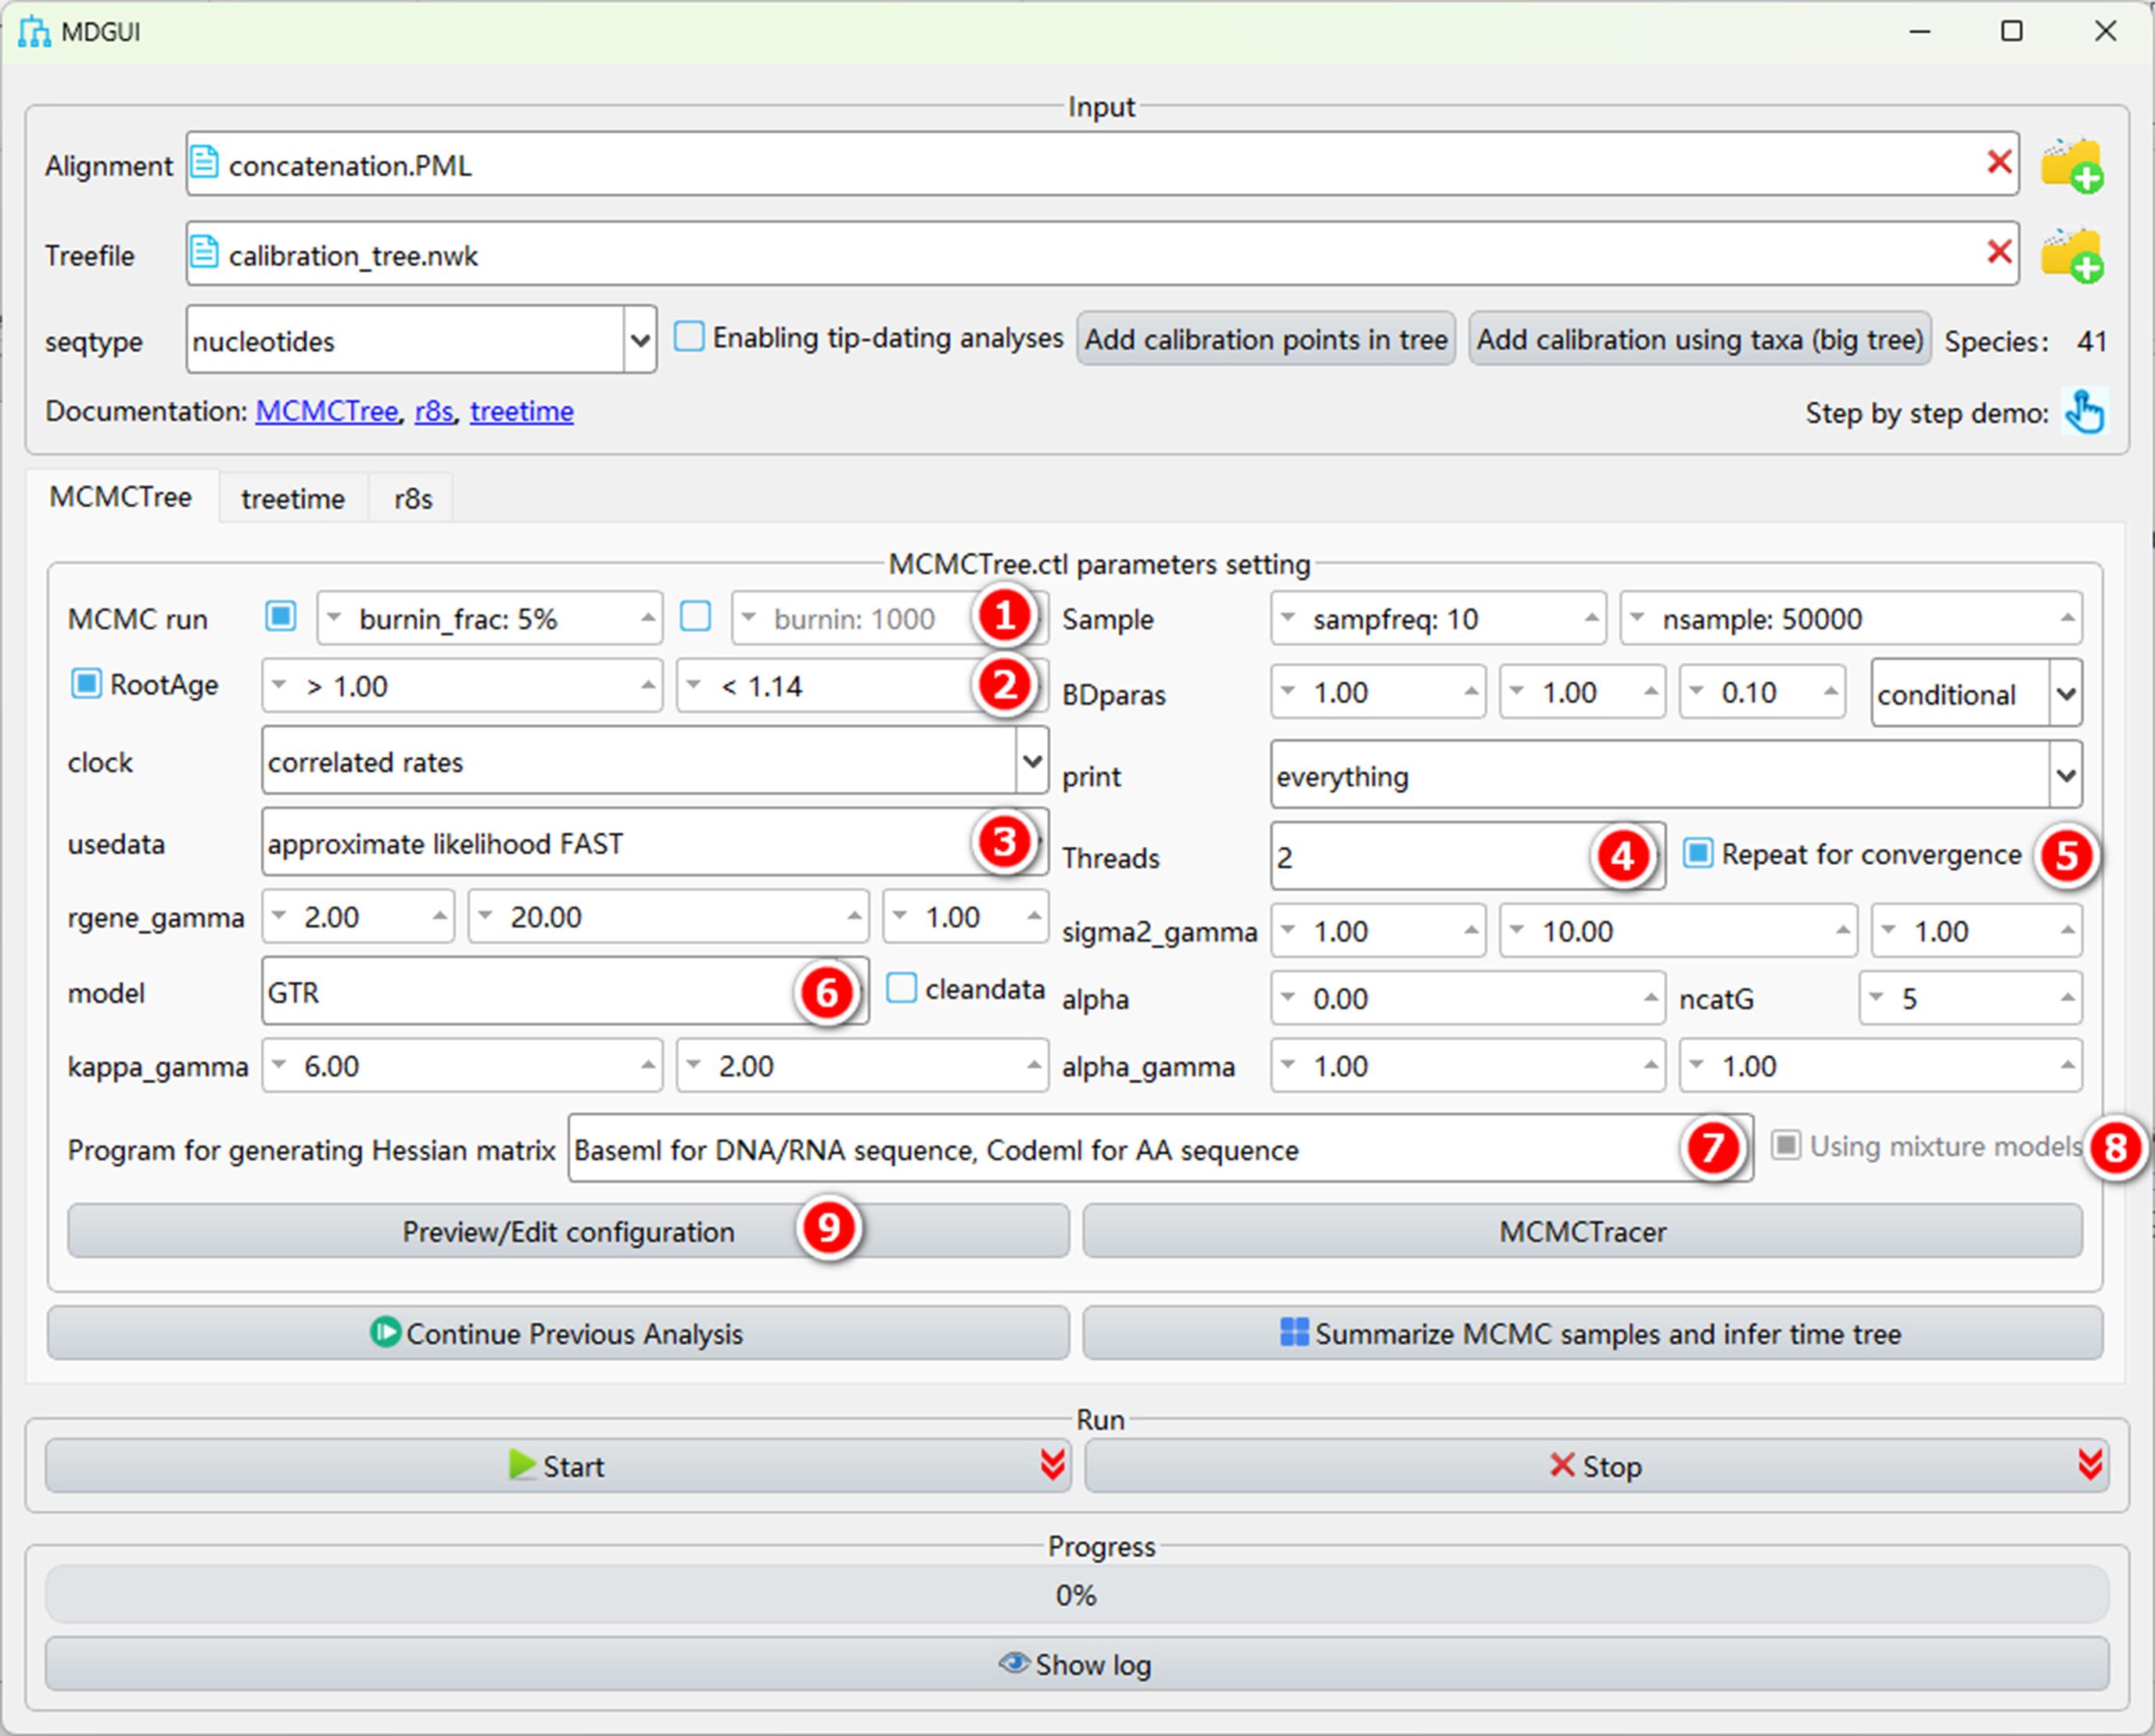
Figure 6. MDGUI-MCMCtree parameter settings. Overview of configurable parameters for MCMCtree analysis within MDGUI: (1) burn-in setting; (2) root age calibration setting; (3) usedata setting for likelihood calculation mode; (d) thread setting for independent MCMC chains; (e) option for automatically repeating analyses for convergence assessment; (f) evolutionary model selection; (g) program selection for Hessian matrix generation; (h) option for enabling mixture models; (i) button for previewing or editing the configuration file.
f. Model (model selection): Building upon the default models of MCMCtree, MDGUI provides an extensive range of additional evolutionary model options categorized by sequence type. Models are categorized by the sequence type and organized systematically to facilitate quick lookup and selection by users (Figure 7).
Tip: If users are unsure which model to use, they can simply select the AUTO option. The software will invoke ModelFinder to automatically select the optimal model.
g. Program for generating Hessian matrix: In addition to MCMCtree’s native calculation method, MDGUI integrates IQ-TREE for Hessian matrix calculation (see https://iqtree.github.io/doc/Dating). Compared to MCMCtree, this method supports a wider range of new sequence evolutionary models—such as Q.pfam, Q.plant, and Q.mammal—as well as mixture models. Users simply need to select IQ-TREE for all sequences (more models) under the Program for generating Hessian matrix option to enable this feature.
h. Using mixture models: If IQ-TREE is selected for Hessian matrix calculation, users can enable the mixture models option to address data heterogeneity issues (refer to https://iqtree.github.io/doc/Complex-Models).
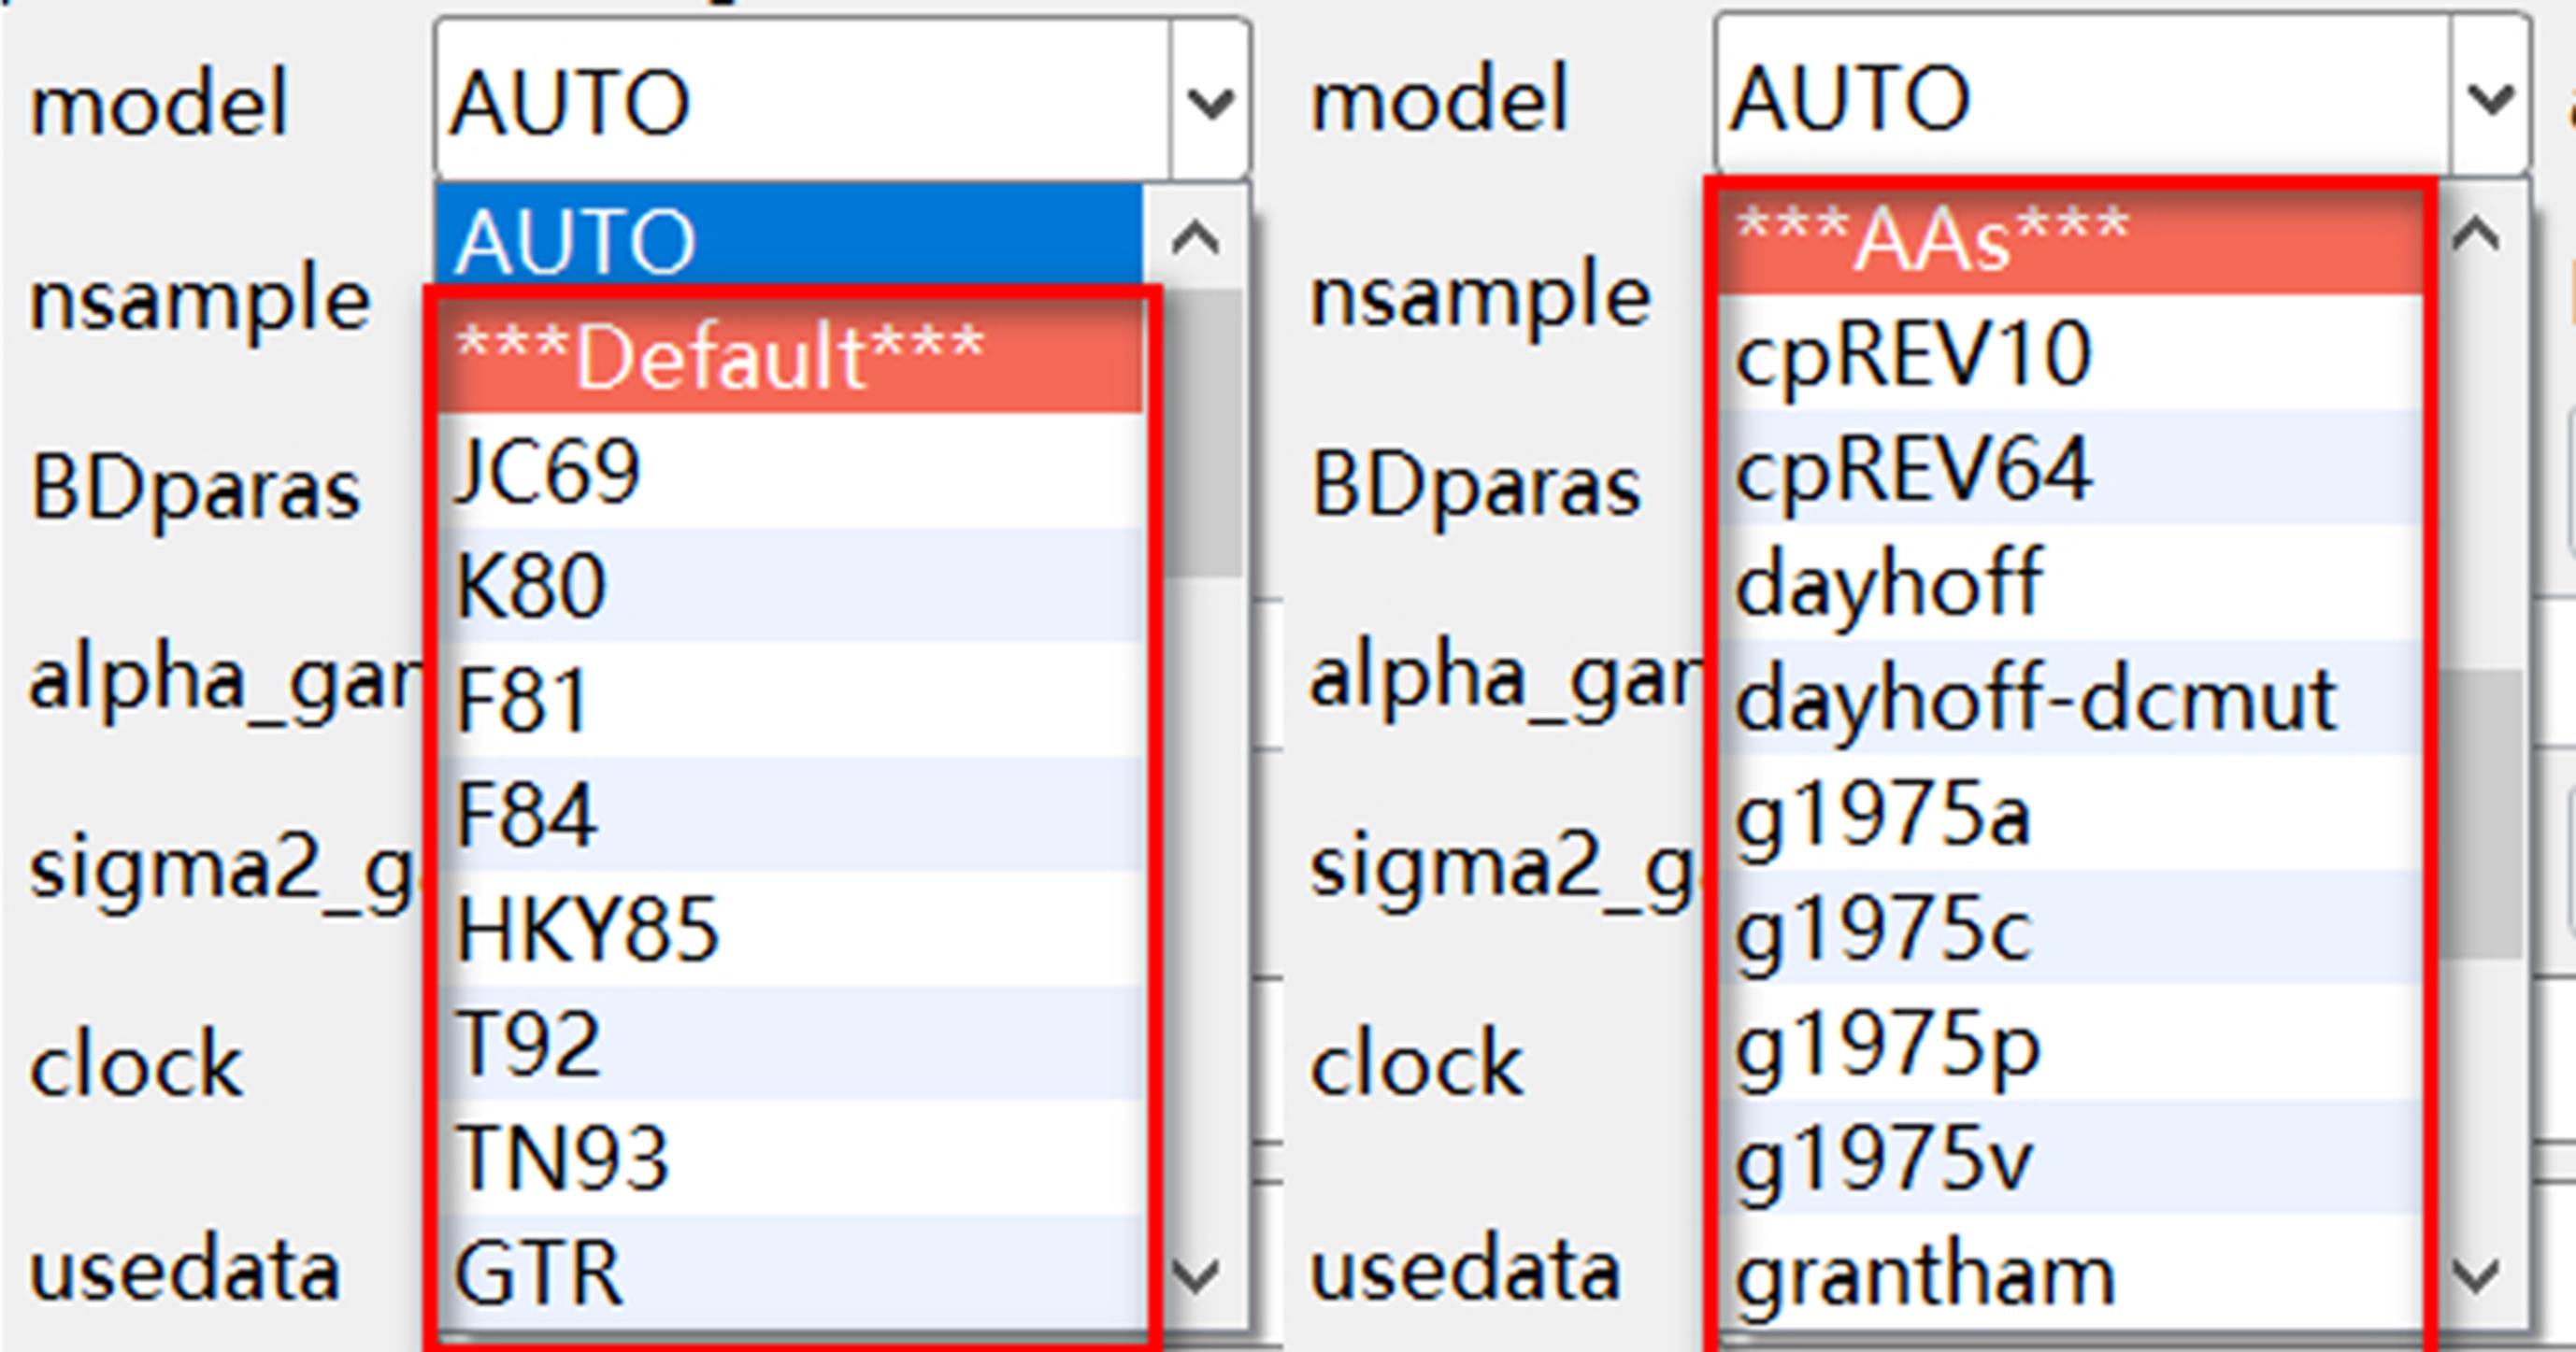
Figure 7. Supported models in MDGUI-MCMCtree. List of available nucleotide and amino acid models supported for MCMCtree analyses.
i. Preview/Edit configuration: As the MDGUI interface provides only a subset of MCMCtree parameters, users wishing to add new parameters or manually modify existing ones can click the Preview/Edit configuration button. This will trigger a pop-up window displaying the text content of the final control file (mcmctree.ctl), generated on the basis of all current interface settings. Users can review the content here, as well as edit or add parameters directly in the text format. Once confirmed, clicking the SAVE AND RUN button will execute MCMCtree using the updated parameters (Figure 8).
Tip: Users are advised to avoid spaces and special shell characters in file names and paths whenever possible. In addition, when editing content in the Preview/Edit configuration window, users should follow the generated template and should not arbitrarily add or remove symbols in order to avoid system errors or local command execution issues.
In the preview configuration, the default setting “seed = -1” means that the analysis will use a randomly generated seed value. A fixed seed is mainly needed to ensure strict bit-for-bit computational reproducibility. By default, the interface does not require manual seed setting; instead, the program automatically outputs a “SeedUsed” file recording the seed value used in that run. Users who require bit-for-bit reproducibility can manually set a fixed integer seed in the Preview/Edit configuration window before starting the analysis.
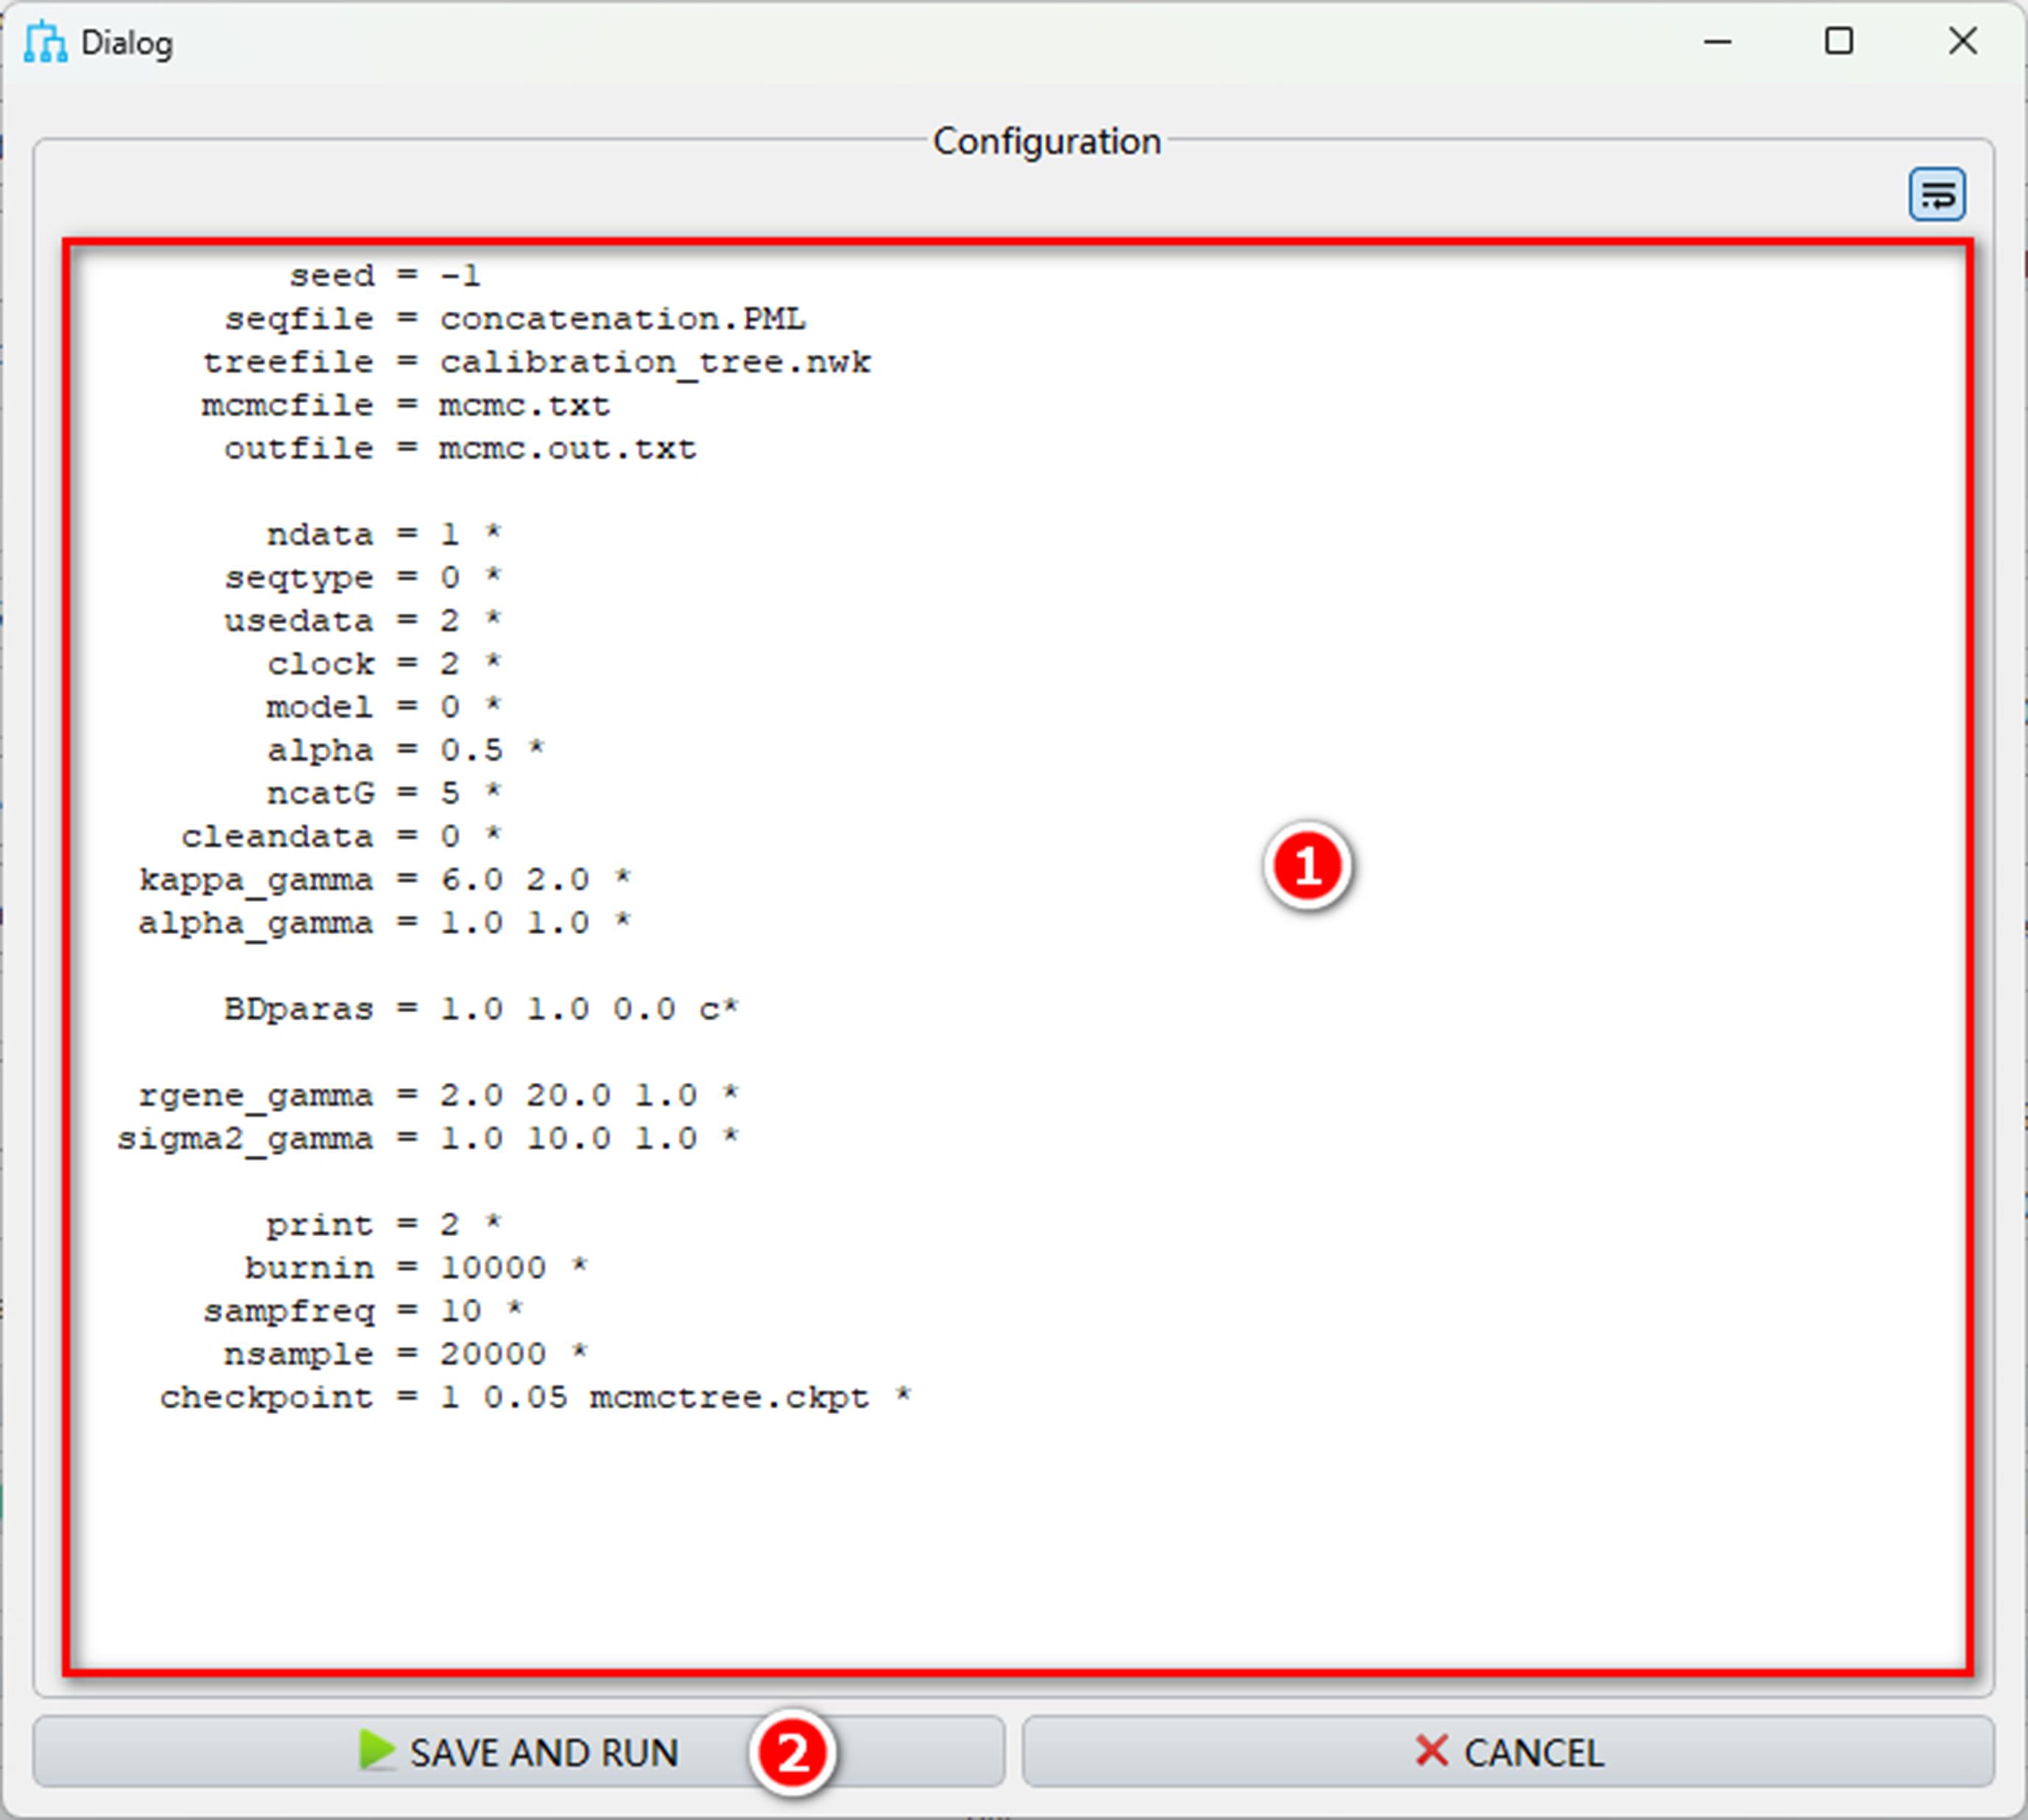
Figure 8. Preview/edit MDGUI-MCMCtree configuration. Interface for reviewing and modifying automatically generated control file settings prior to analysis execution: (1) button for previewing or editing the final control file; (2) button for executing MCMCtree with the updated configuration.
4. Running and real-time monitoring
a. Start analysis
i. Users can directly click the Start button on the main interface to rapidly initiate the analysis (Figure 9).
ii. Prior to initiating the analysis, users can modify the working directory and output folder name. If these are not specified, the system will, by default, create a folder under the installation directory at “myWorkPlace/GenBank_File/files/MDGUI_results.” The default folder name is the date and time at which the analysis is started. For better traceability and easier identification of different analyses at a later stage, users are recommended to rename the results folder manually.
iii. Click this option to specify or modify the name of the output results folder before starting the analysis.
iv. Click the Show log button to open a pop-up window for viewing the running log of the analysis.
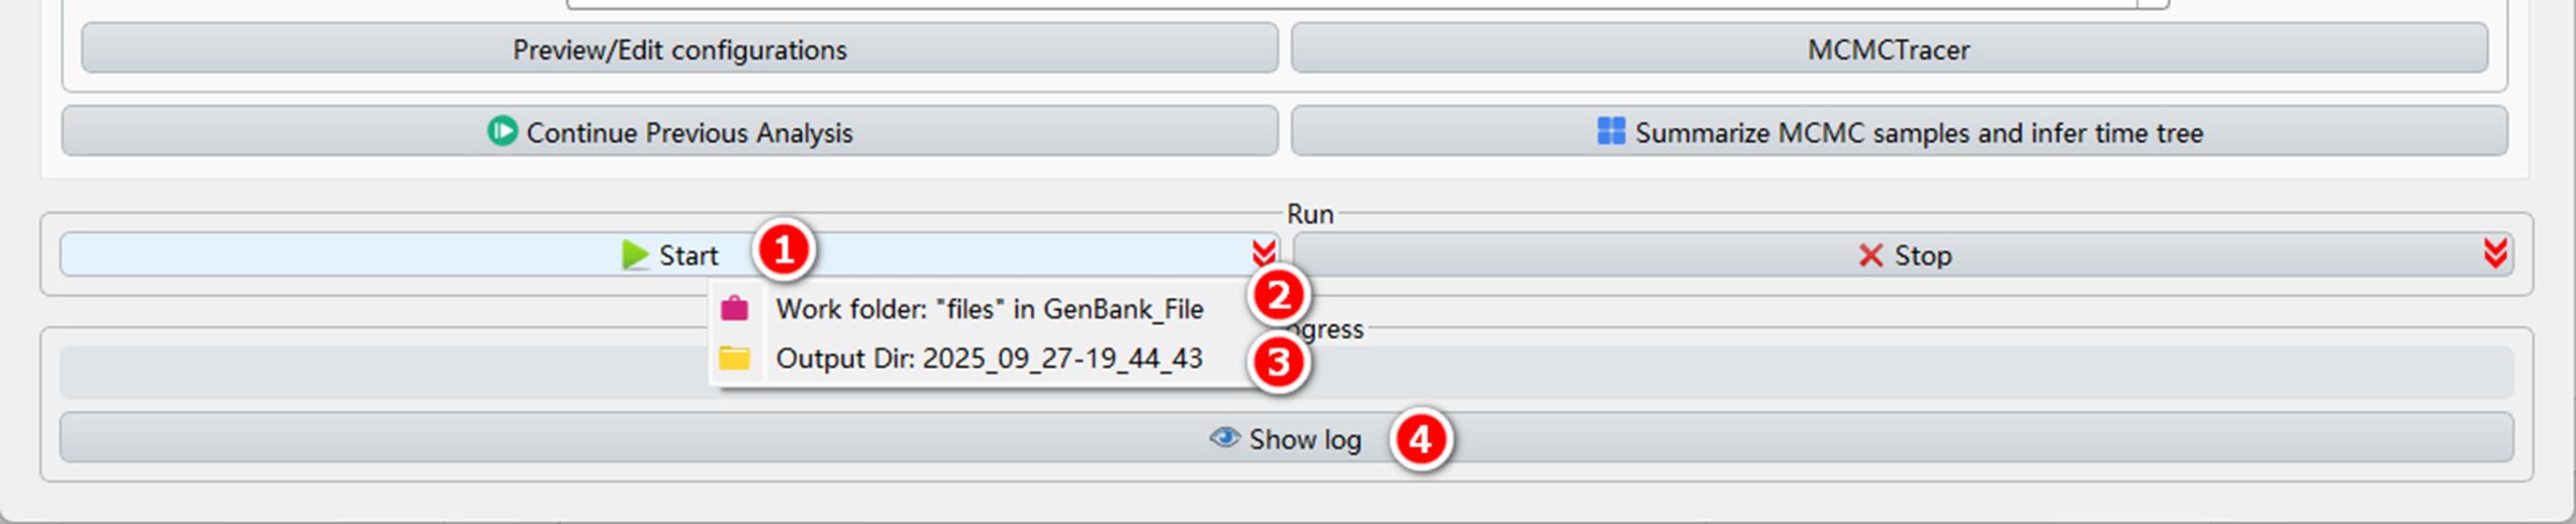
Figure 9. Start MDGUI-MCMCtree analysis. Interface displaying the initiation of the MCMCtree run within MDGUI: (1) button for launching the analysis; (2) working directory setting; (3) output folder name setting; (4) button for opening the run log window.
b. Real-time status
i. Log viewer window: This window opens automatically during runtime (it can also be opened manually by clicking the show log button) to display the current operational steps and status of the analysis (Figure 10).
ii. Users can click the Save to file button and select a destination path to save the content of the run log.
Real-time convergence analysis and visualization: During the ongoing MCMCtree run, users can click the MCMCTracer button on the MDGUI main interface (Figure 6). The software will summarize the current MCMC samples, open the MCMCTracer window, and automatically import the sample data for real-time summary and visualization.
In the Convergence tab of MCMCTracer, users can directly assess whether the analysis has converged. If the data points in the plot cluster noticeably around the x = y diagonal, it indicates that the results from the two analyses are consistent, suggesting good MCMC convergence.
Users can also review key statistics such as the effective sample size (ESS) and confidence intervals (CI) within this tool, and assess convergence in real-time by observing visual outputs like trace plots, scatterplots, and histograms (see Section B).
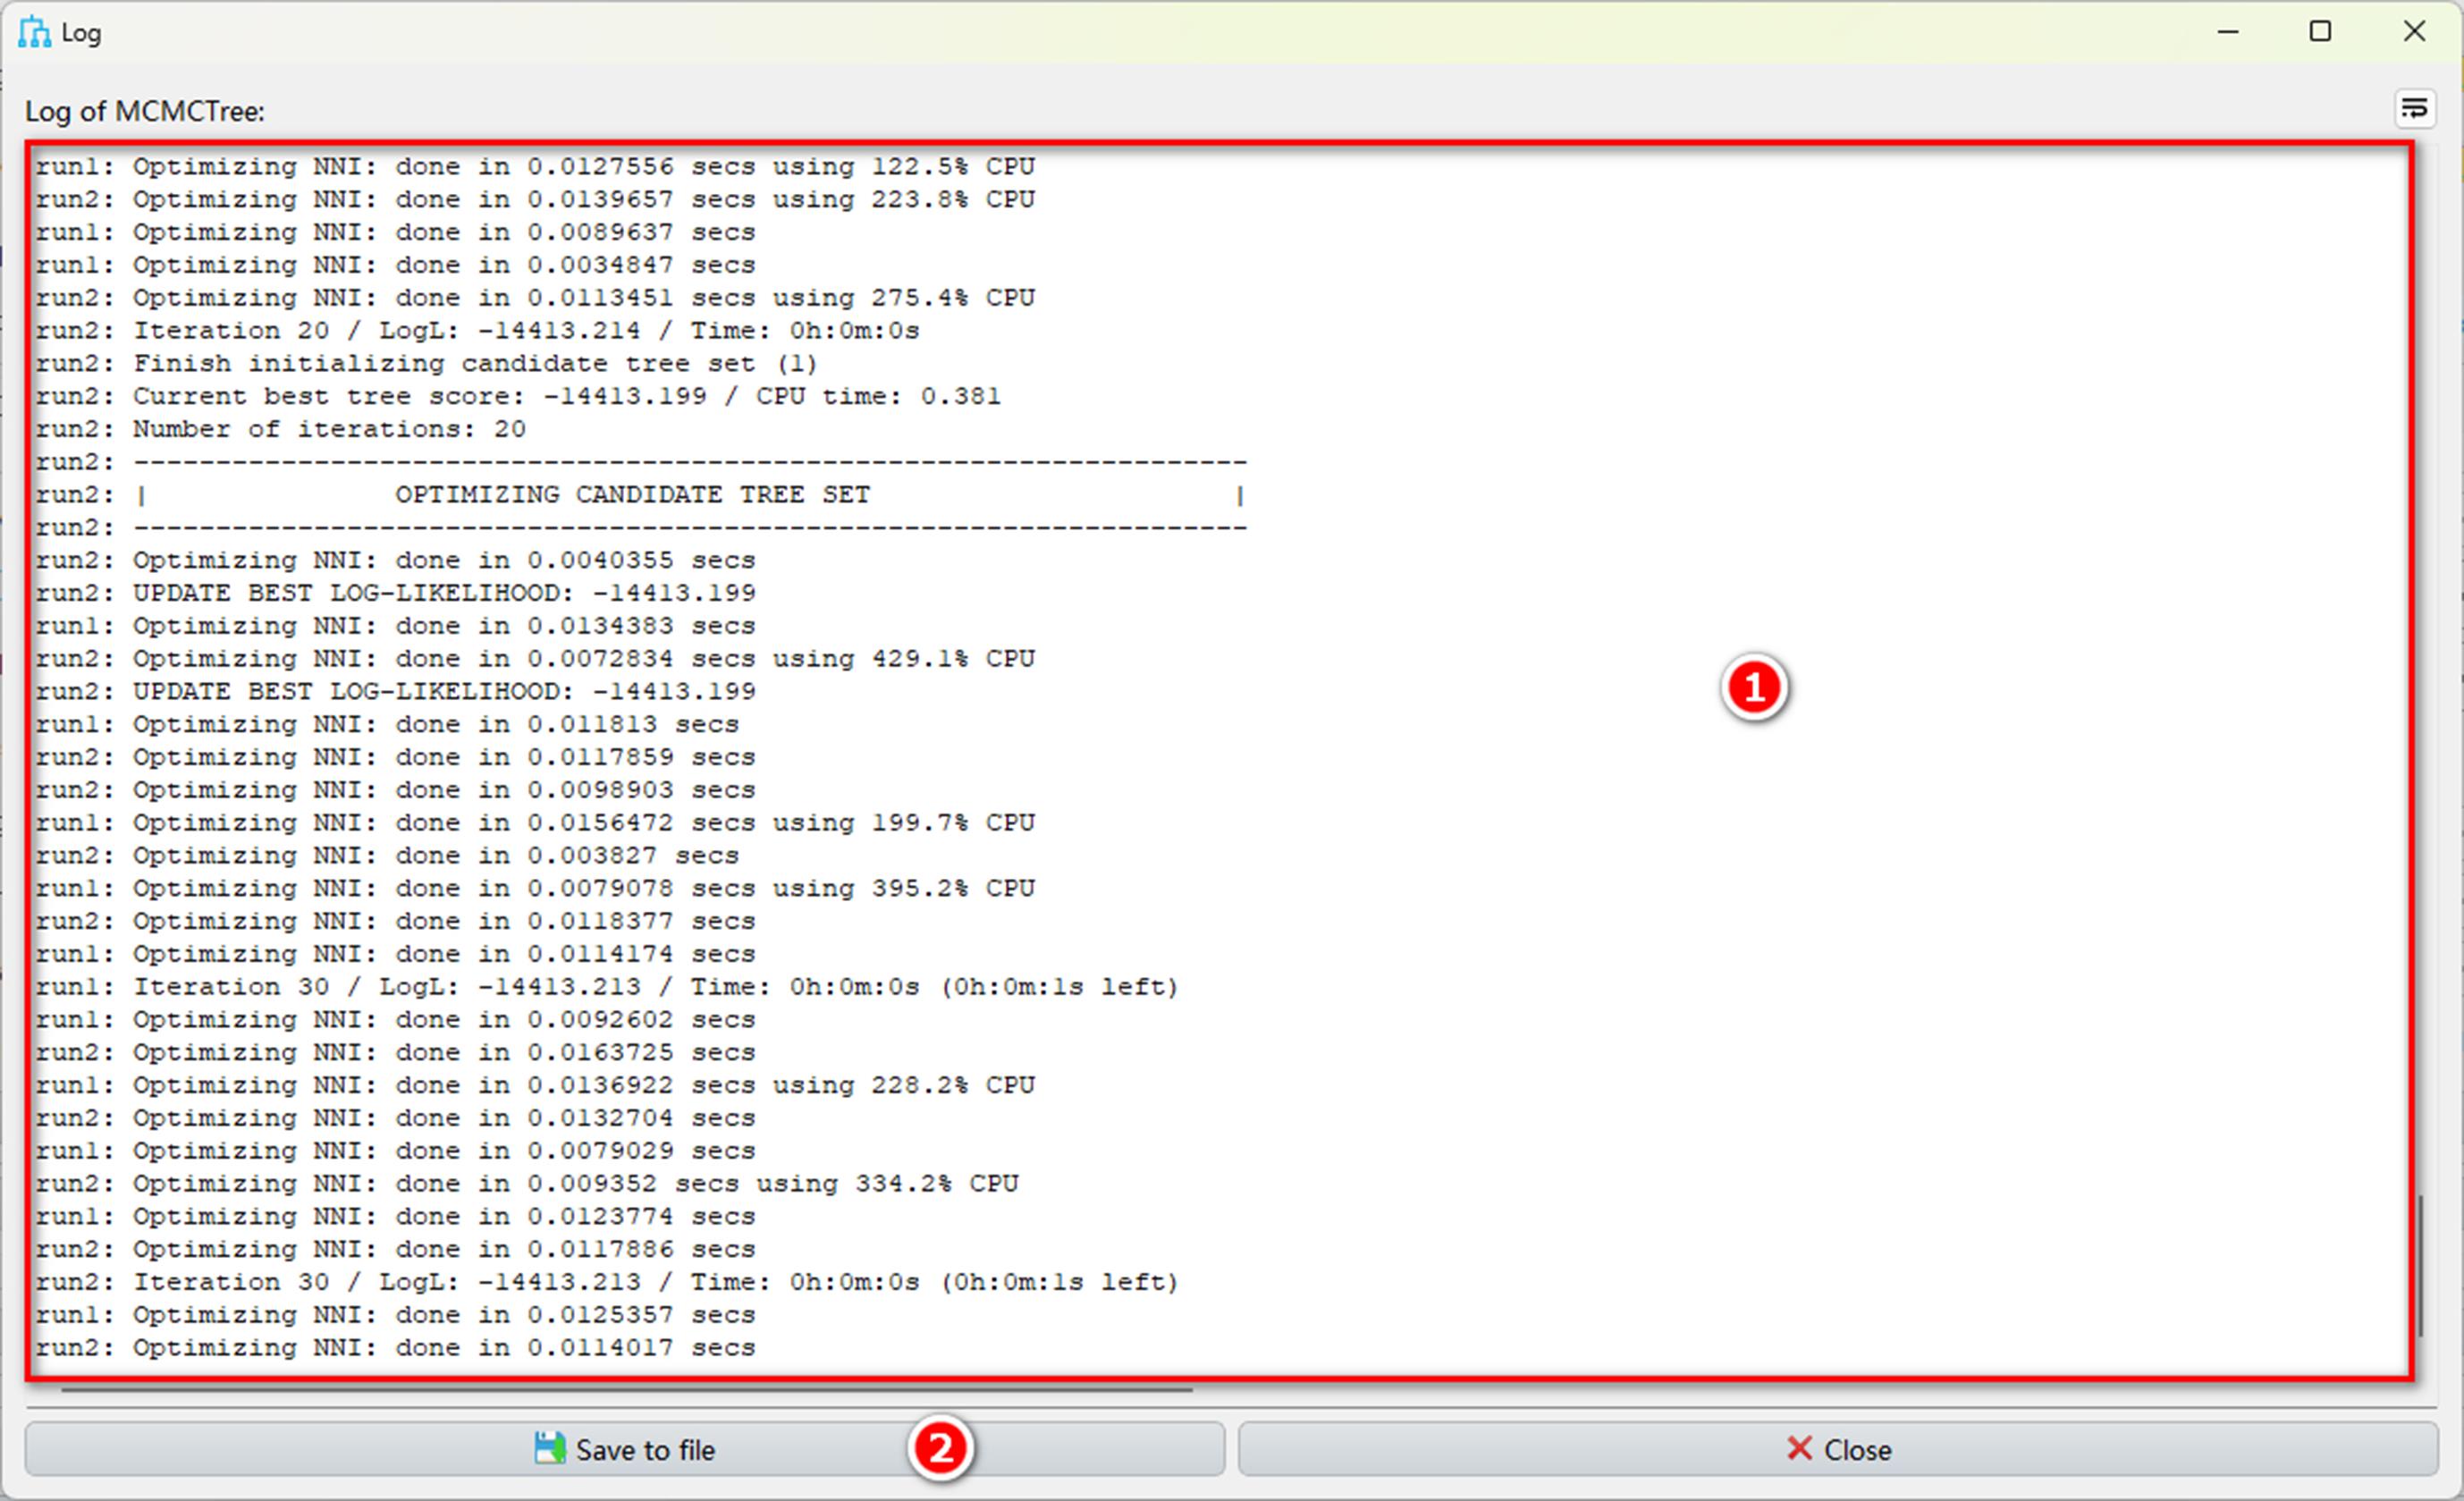
Figure 10. MDGUI-MCMCtree run log. Real-time log output showing progress and execution status during the MCMCtree analysis: (1) log viewer window for displaying the current running steps and status; (2) button for exporting the run log.
c. Pause and resume
i. Stopping the analysis: If users need to stop the analysis mid-process, they can click the Stop button on the MDGUI main interface (Figure 11). The program periodically saves the running status (checkpoint) of each MCMC chain to facilitate subsequent resumption.
ii. If users wish to stop the analysis and immediately perform MCMC statistical analysis and timetree inference using the current data, they can select the Stop the run and infer the time tree option from the Stop button’s dropdown menu.
Tip: In the event of a power outage during the run, this checkpoint mechanism ensures that progress is saved.
iii. Resuming the analysis: If users need to continue an unfinished analysis, simply click the Continue Previous Analysis button (Figure 11) and select the output folder corresponding to the previously interrupted run. The software will load the previous running status (checkpoint file) and resume execution from the point of interruption until the total number of generations is reached.
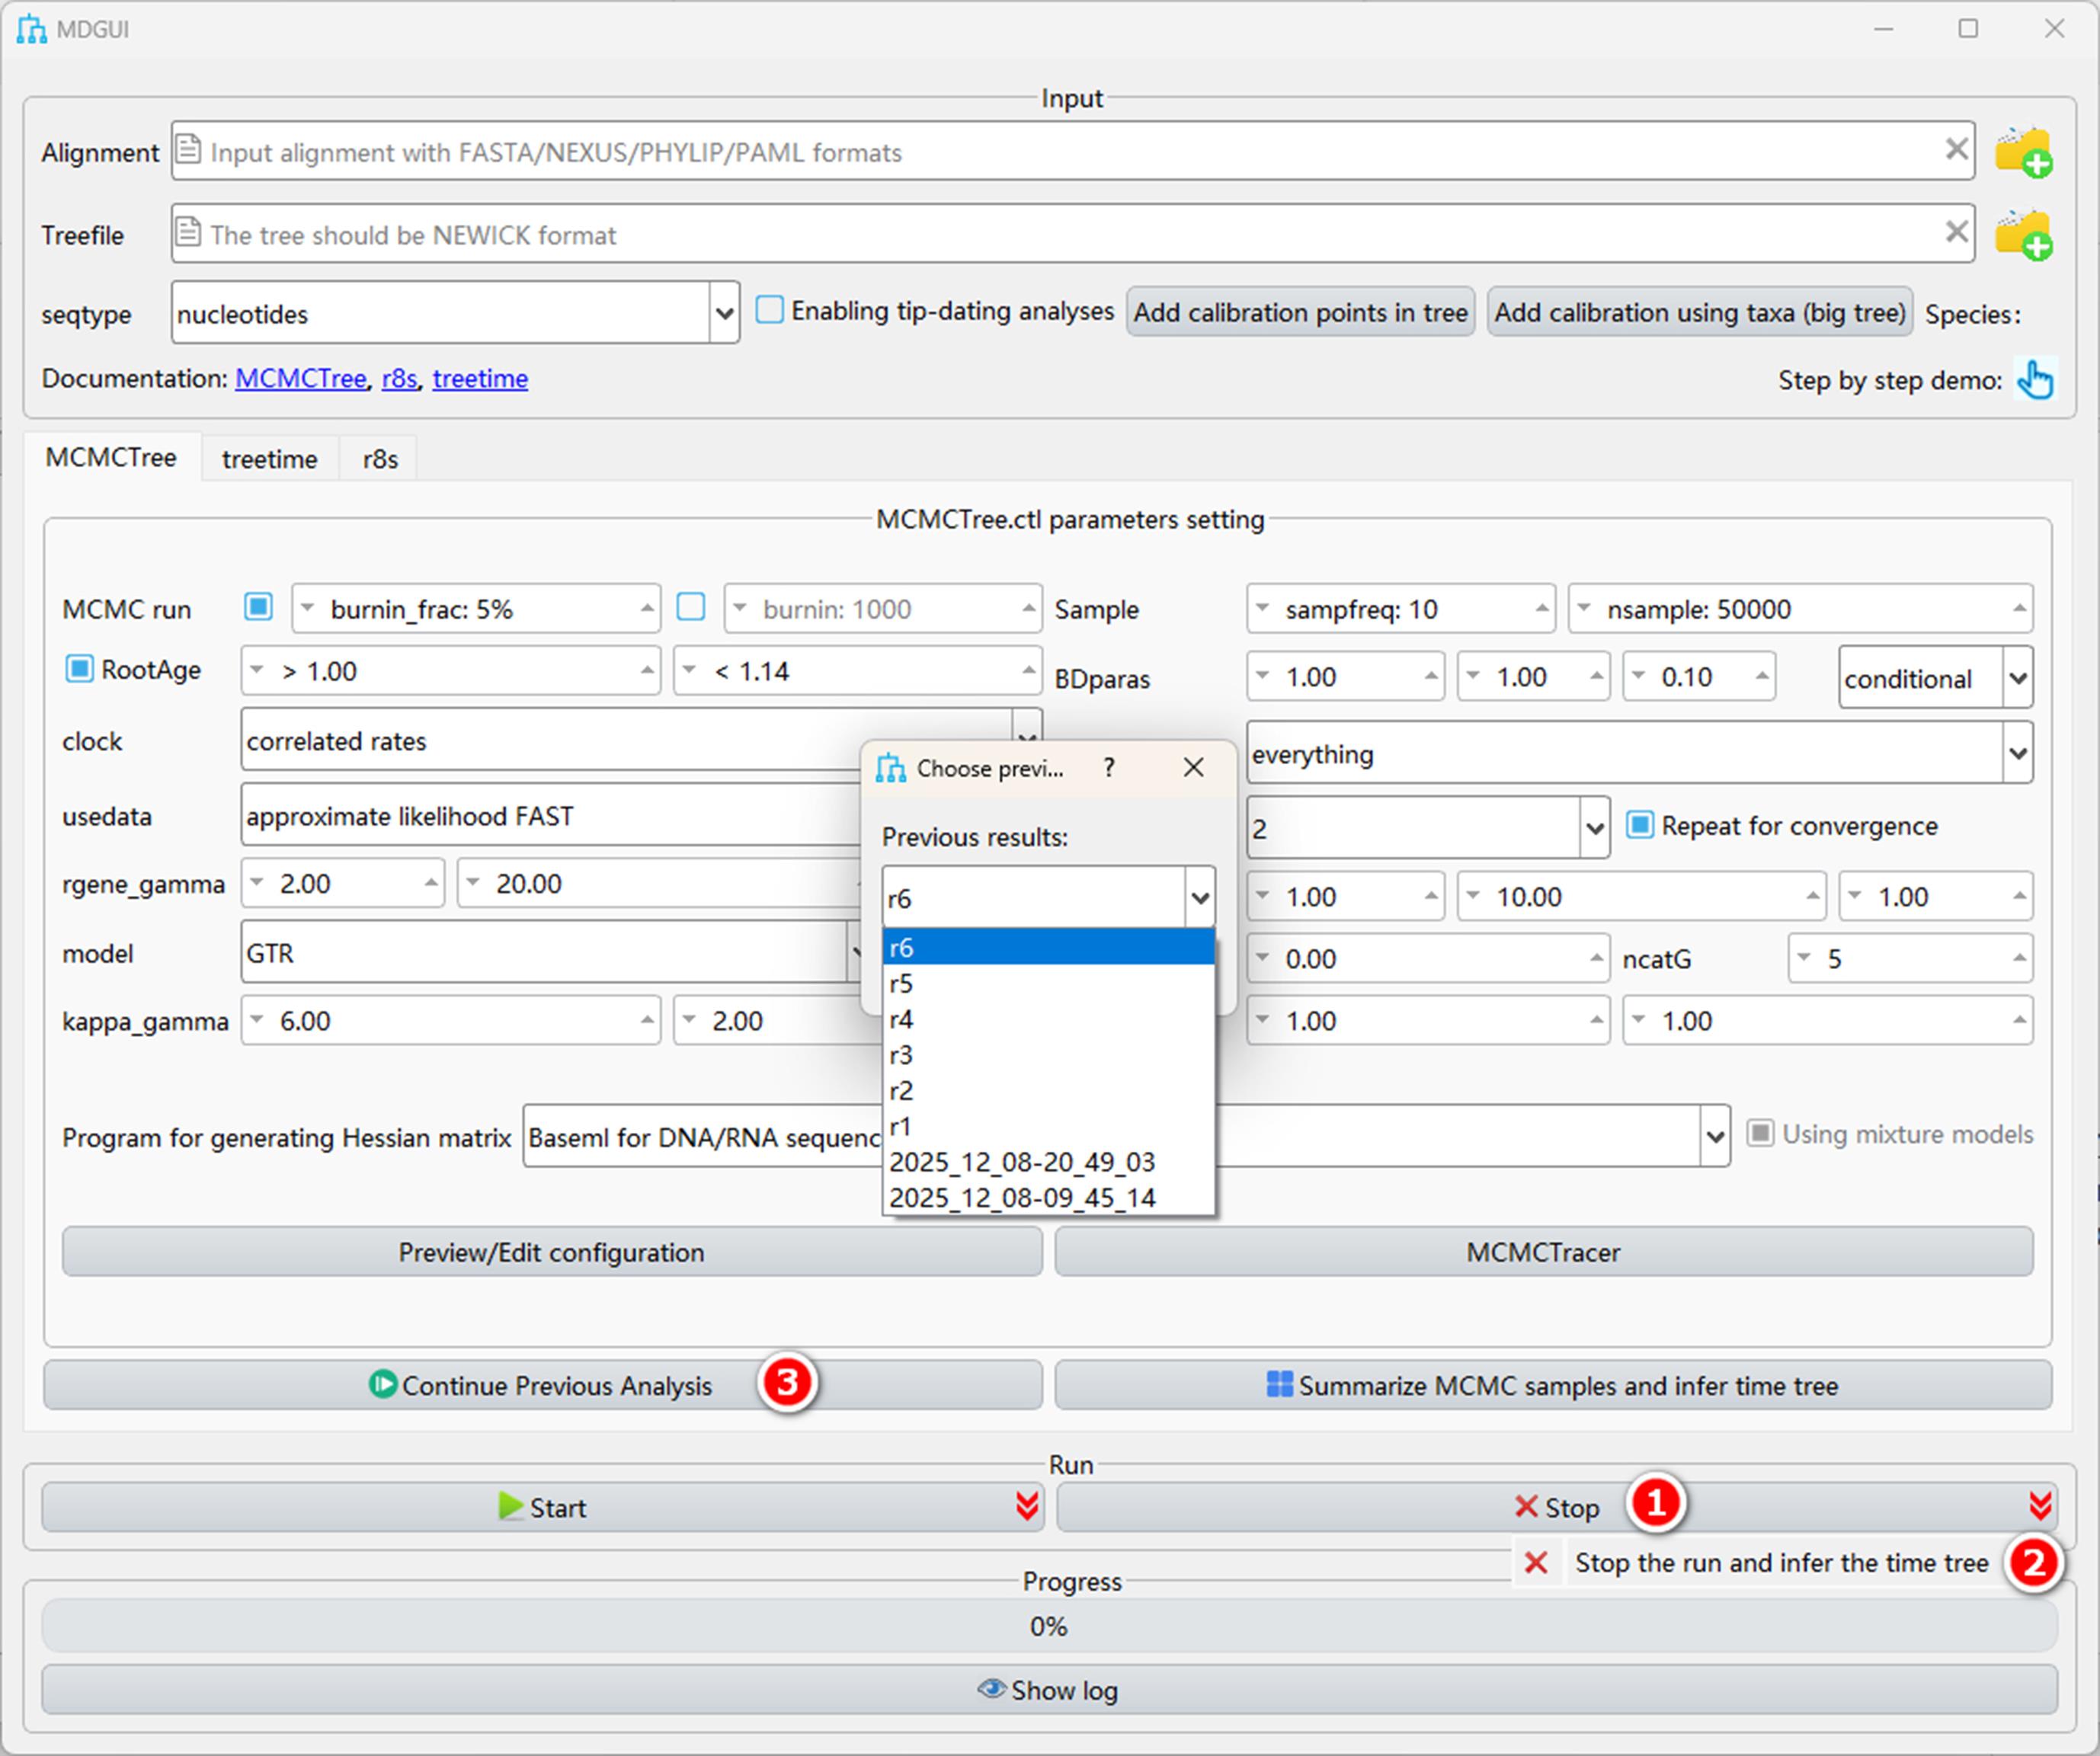
Figure 11. MDGUI-MCMCtree pause and resume. Buttons enabling users to pause and resume an ongoing MCMCtree run: (1) button for interrupting the current analysis; (2) option for stopping the run and inferring the time tree using the current data; (3) button for resuming an interrupted run from the last saved checkpoint.
d. MCMC summarization
i. Users can click the Summarize MCMC samples and infer time tree button to summarize the results (Figure 12). If MCMCtree is currently running, MDGUI will perform MCMC statistical analysis without interrupting the ongoing process.
If the MCMCtree run has finished, this button will display a list of all result folders from previously completed runs within the current working directory. Users can select any folder to perform the statistical analysis of an MCMC run, including summarizing MCMC samples and generating the timetree (see section B).
ii. Once the analysis has passed the burn-in phase, users can click the MCMCTracer button at any time. The program will first execute the summarize function described in step A4di, aggregate the current MCMC samples, and automatically import them into MCMCTracer for statistical plotting, thereby visualizing the posterior distribution status and trends of the current MCMC samples in real-time (see section B).
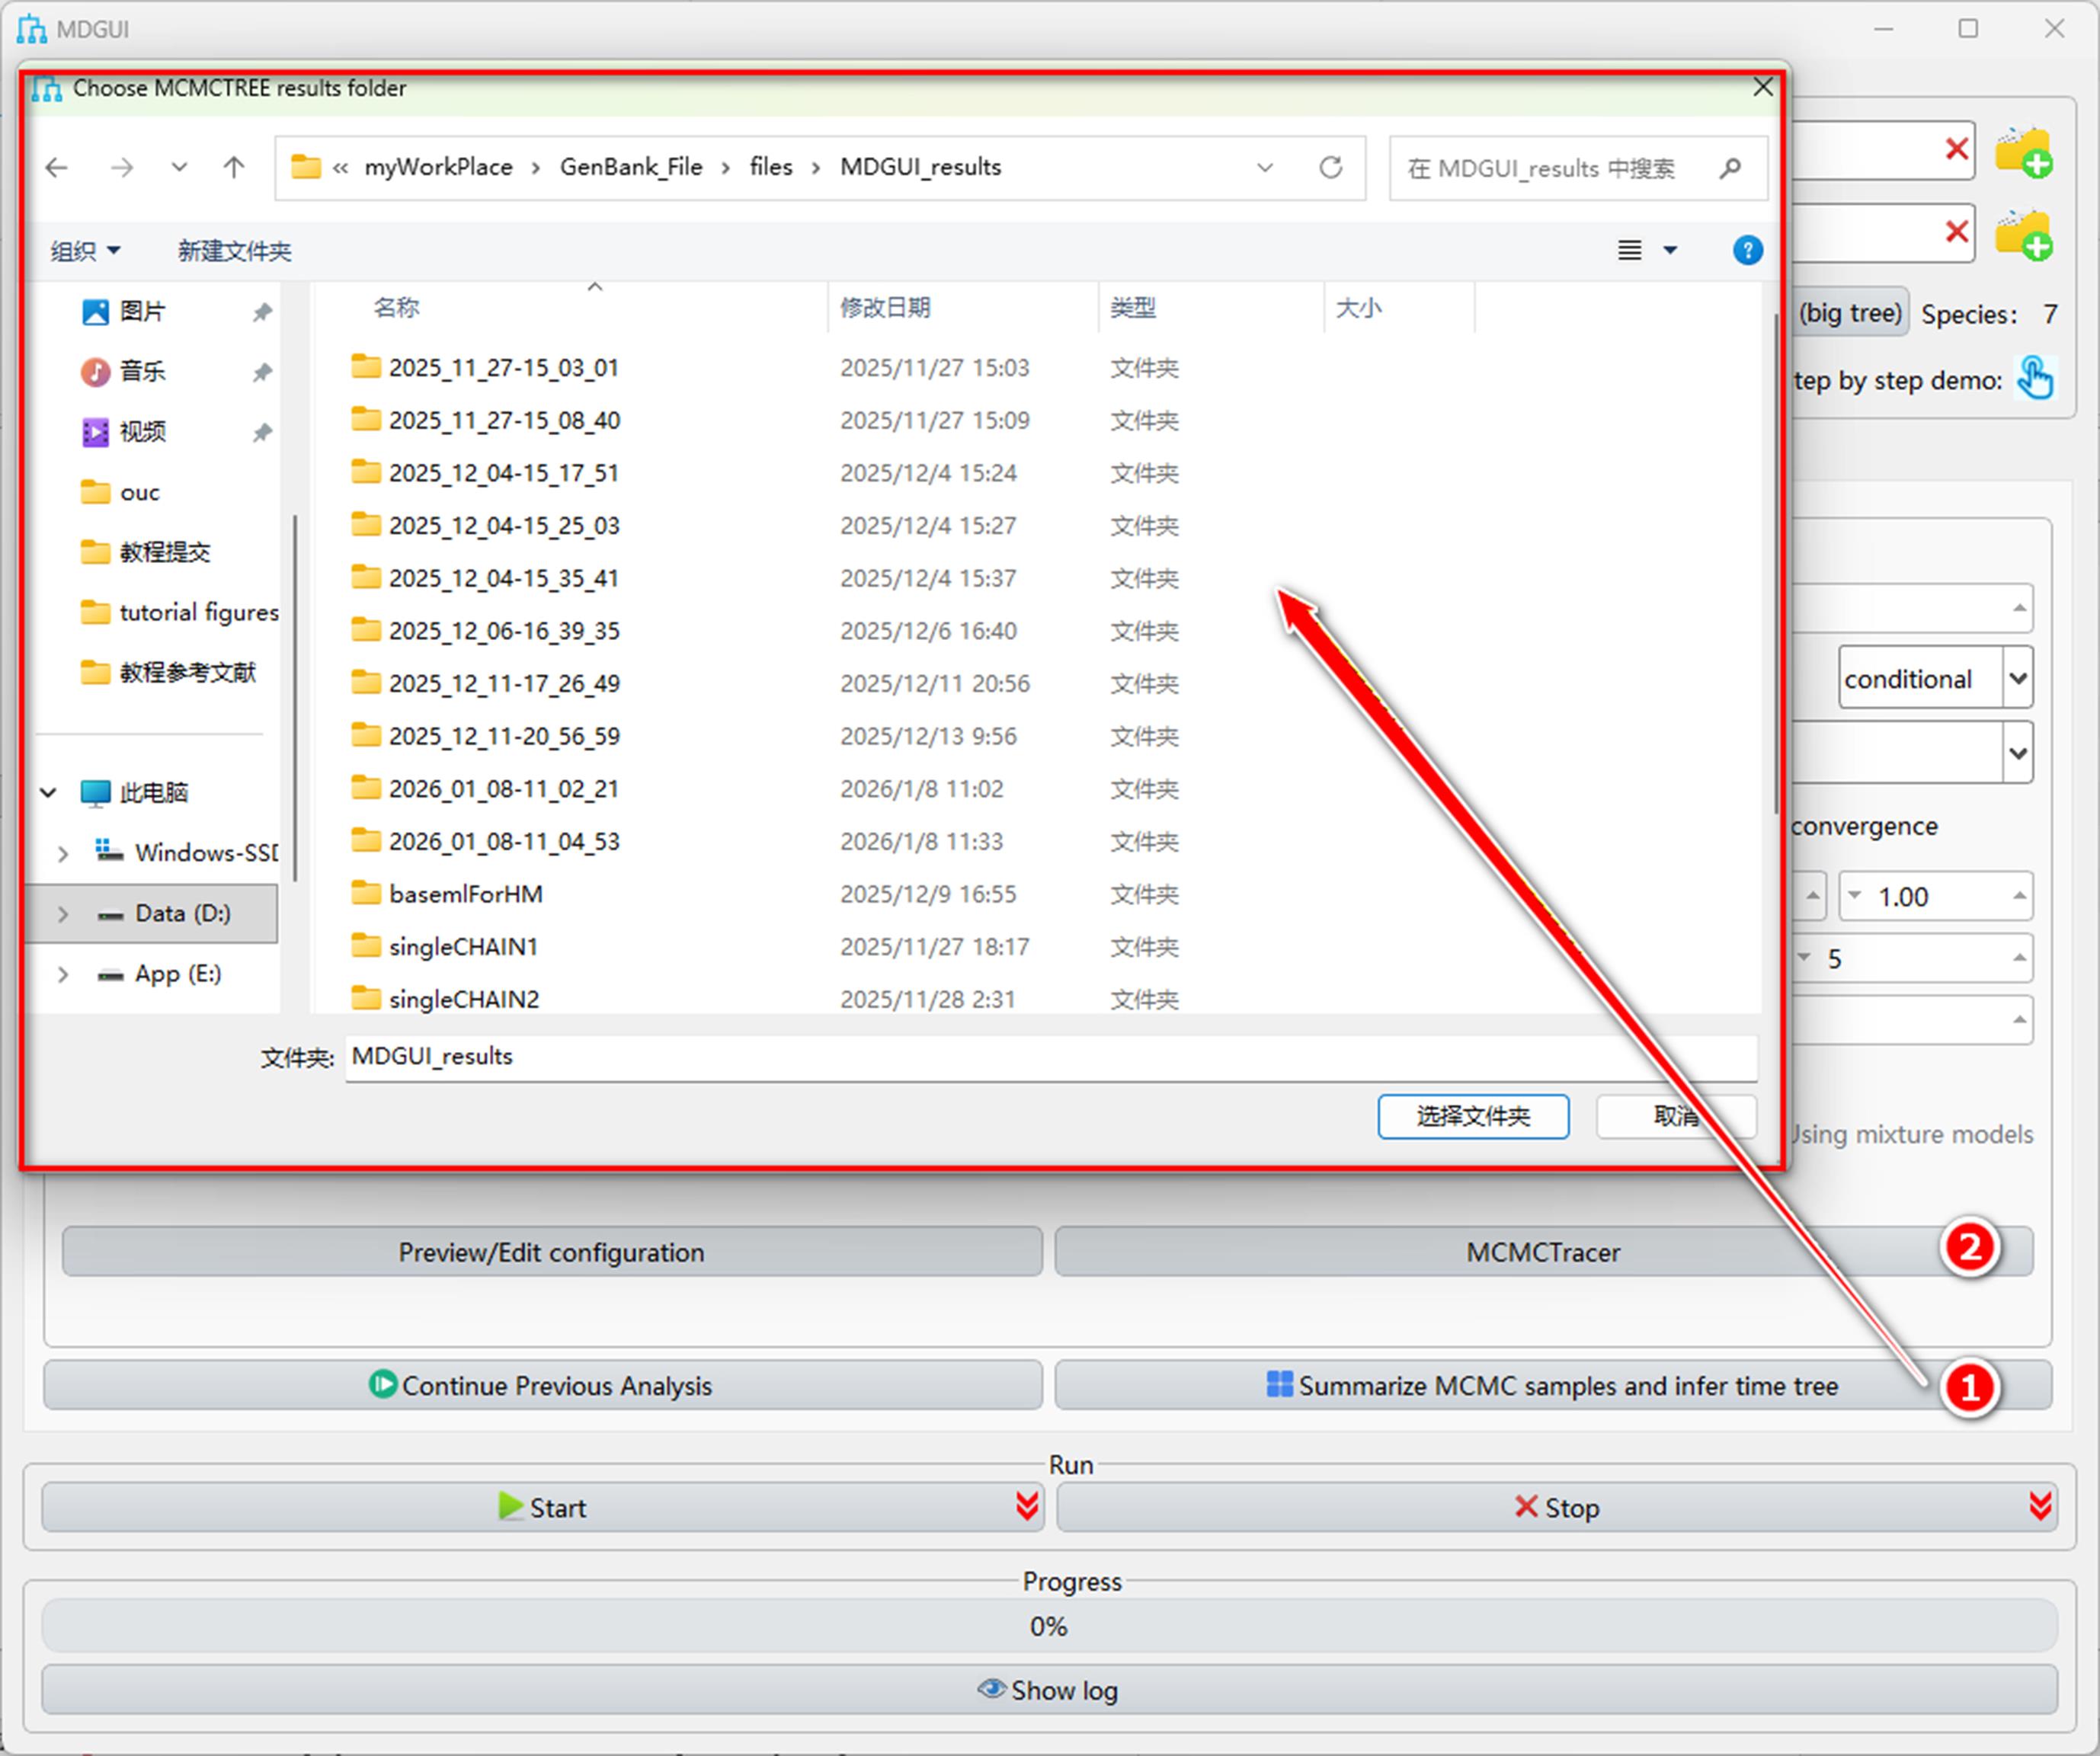
Figure 12. Summarize MCMC samples. Buttons for summarizing MCMC output files: (1) button for summarizing MCMC samples and generating the timetree; (2) button for summarizing the current MCMC samples and importing them into MCMCTracer for real-time visualization.
5. Output files
After the molecular dating analysis finishes, MDGUI will display a prompt window where users can choose to import the results into TimeTreeAnno or MCMCTracer to directly visualize the analysis outputs (Figure 13).
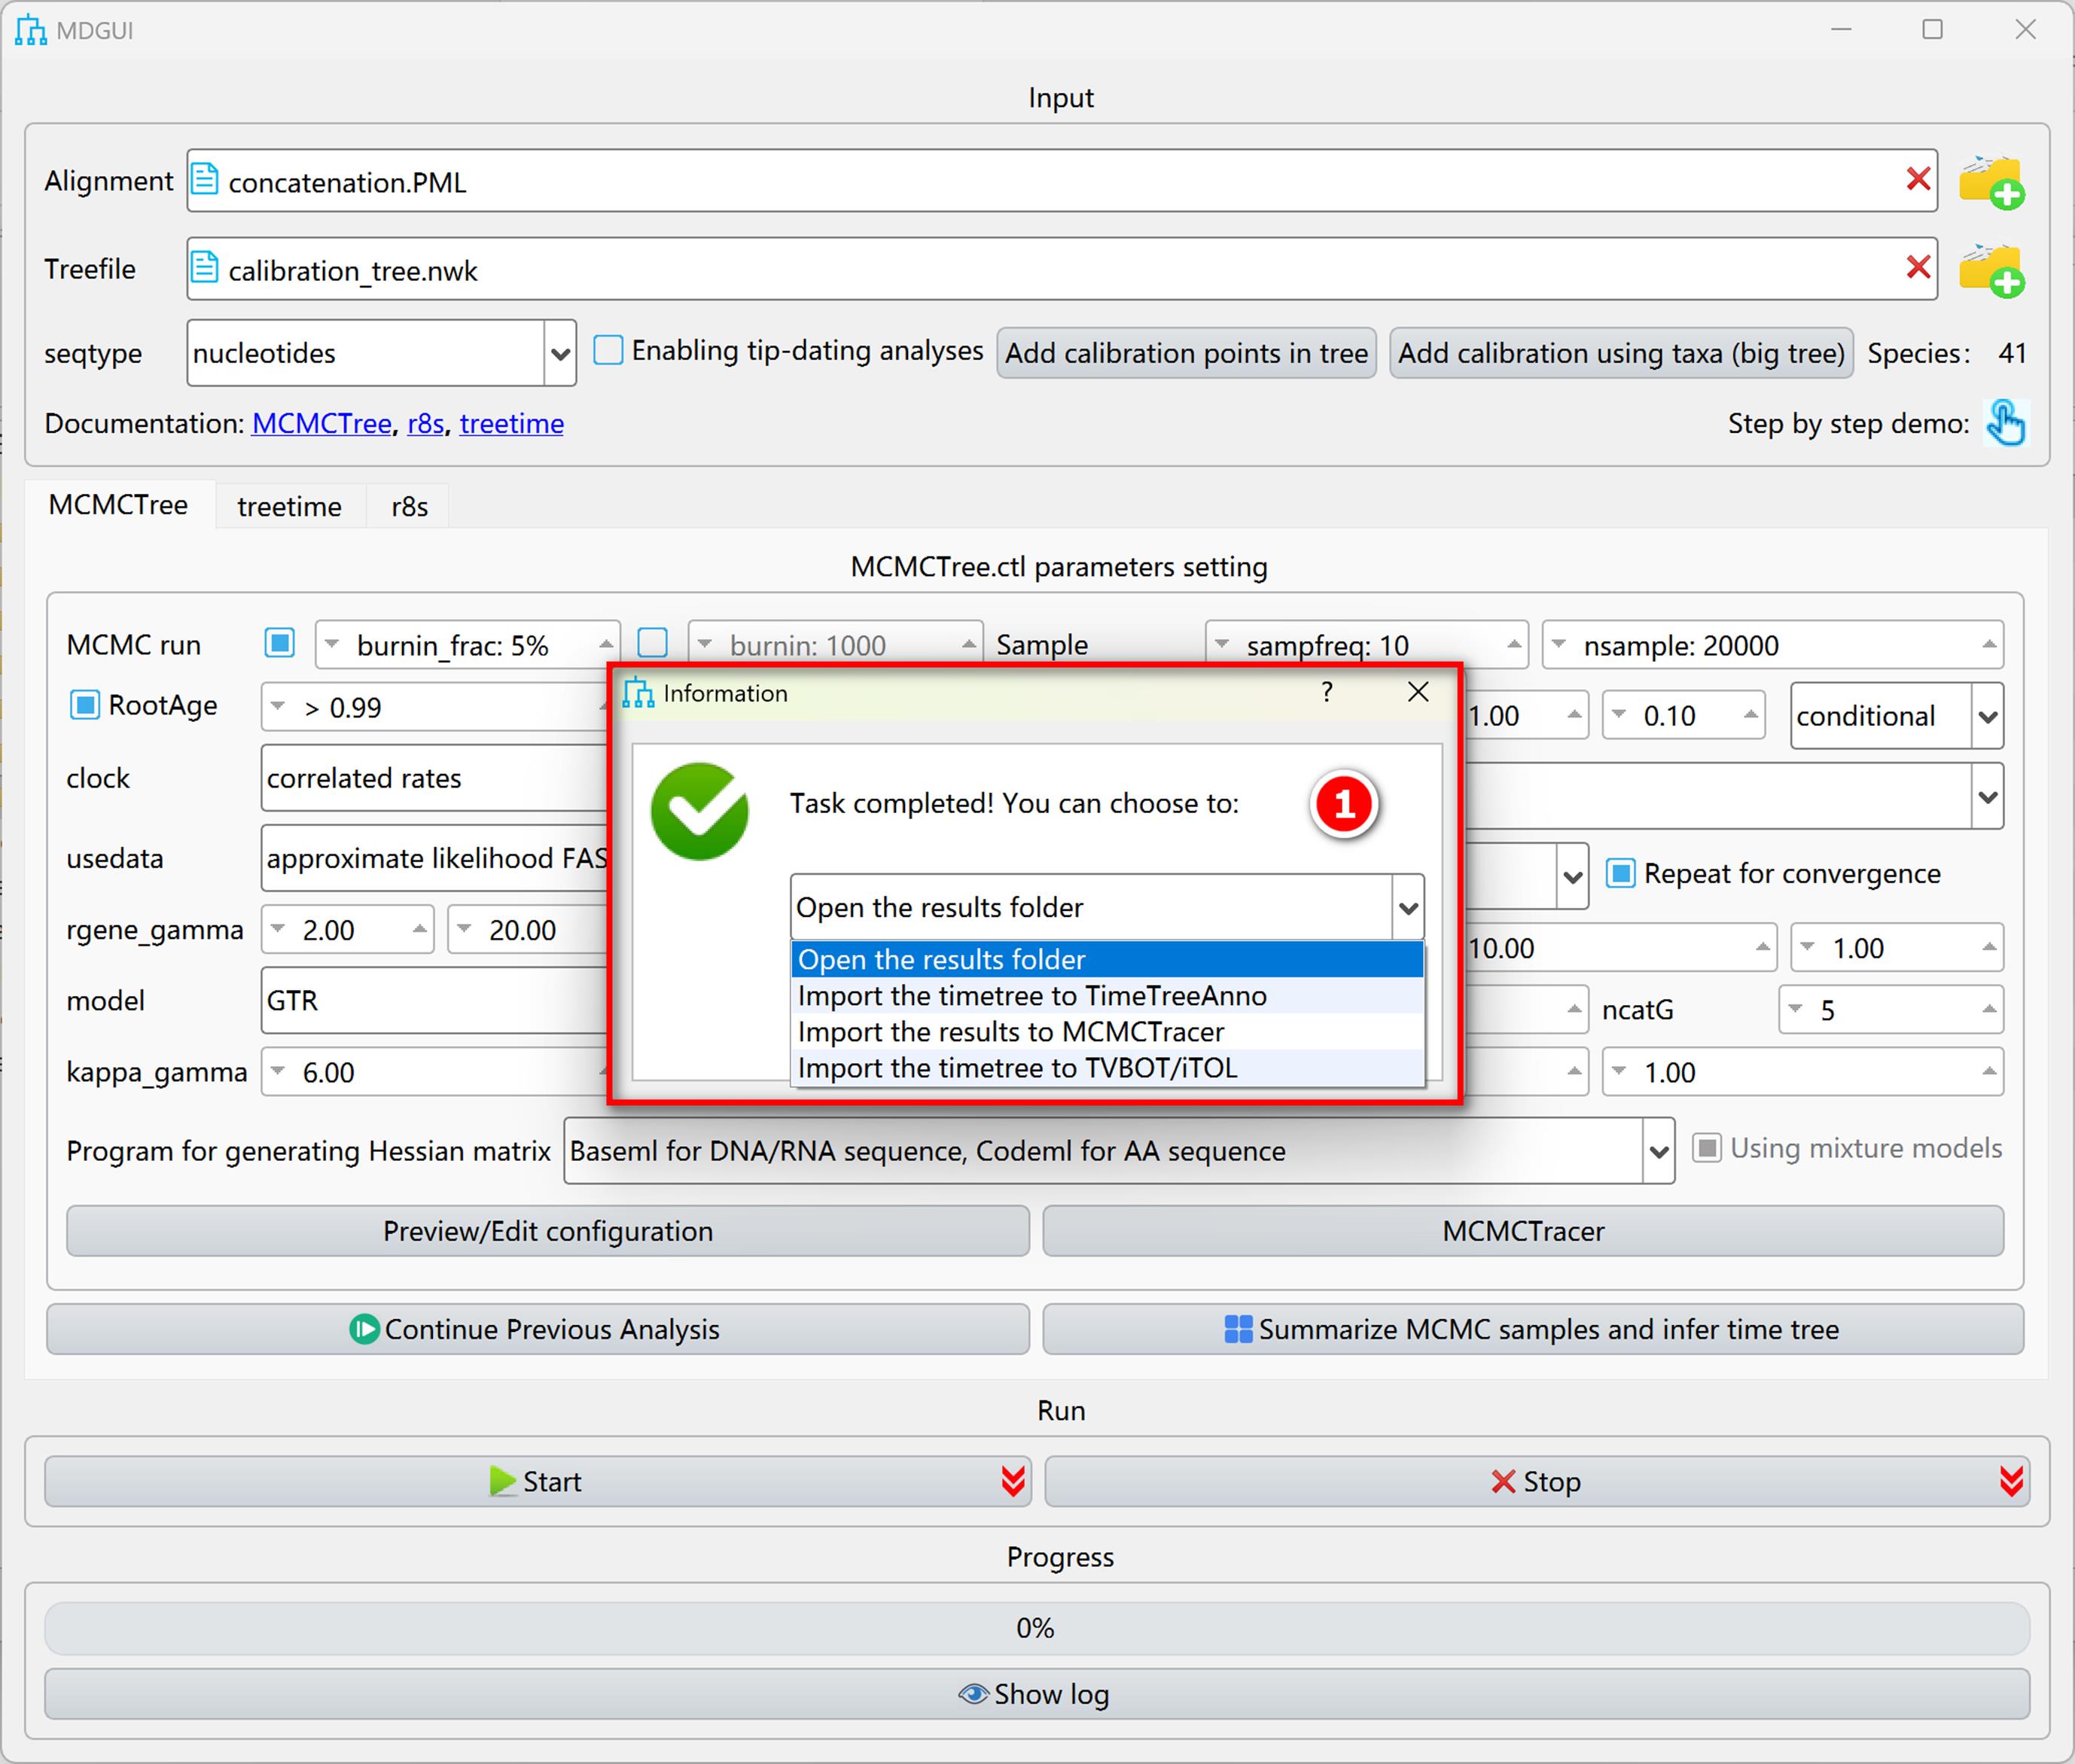
Figure 13. Pop-up window for importing results into downstream analyses. Dialog window for selecting downstream modules for direct import of completed MCMCtree analysis results: (1) window for choosing the downstream module for result import.
a. Folder naming
The result folder is named by default according to the specific start time of the analysis (e.g., “2025_08_22–15_45_14”) to distinguish between separate runs. However, if users manually modify the output name prior to clicking the Start button, the folder will be assigned the user-defined name.
i. Results with “Repeat for convergence” unchecked
When the “Repeat for convergence” option is unchecked, the result folder will contain one or more run folders. This depends on the Threads setting; for example, if Threads is set to 2, there will be two independent folders: run1 and run2 (Figure 14). Each run folder stores all output files generated by a complete MCMC chain analysis (e.g., mcmc.txt, mcmc.out.txt, etc.).
(1) In the same directory as the run folders, the program will generate a result file named “all_mcmc_runs.txt,” which merges MCMC samples from all run folders.
(2) This directory also contains the log file generated by the statistical analysis (summarization.out.txt) and the timetree file (FigTree.tre) (Figure 14).
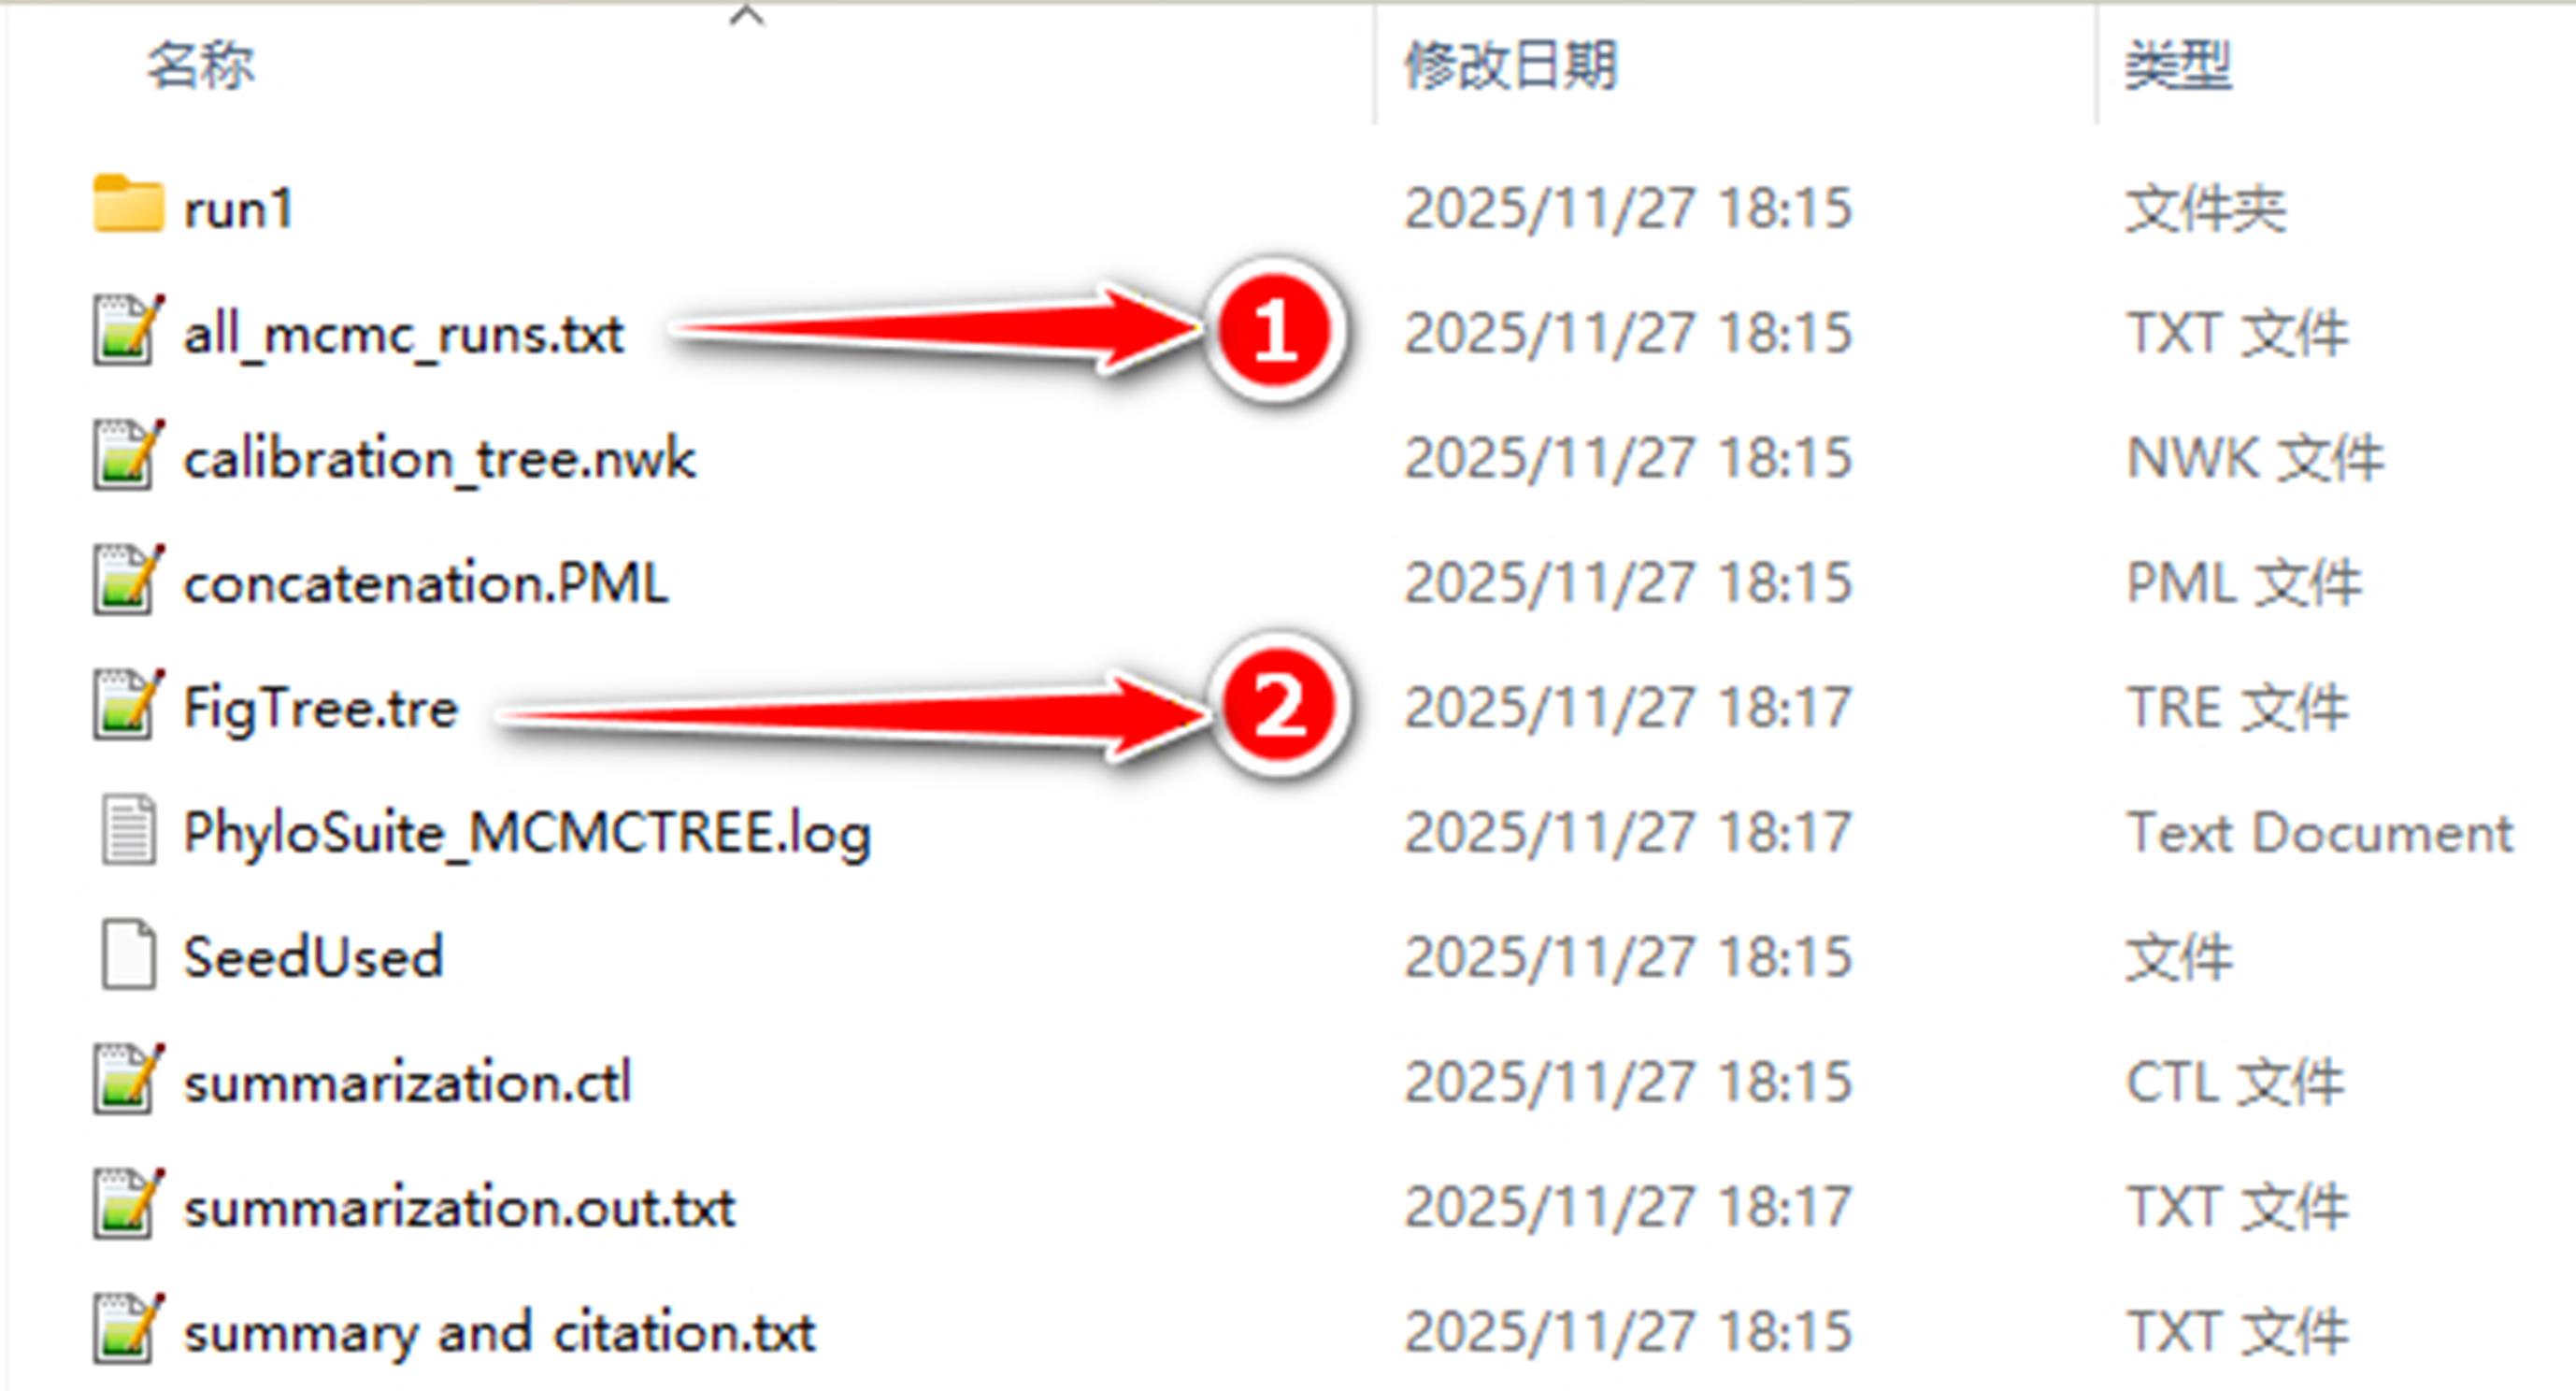
Figure 14. Output folder contents without enabling the “Repeat for convergence” option. Directory structure generated after running a single-chain MCMCtree analysis without activating the “Repeat for convergence” setting: (1) “all_mcmc_runs.txt” file containing the summarized MCMC samples; (2) “FigTree.tre” file containing the inferred timetree.
ii. MCMCtree’s results with “Repeat for convergence” option
(1) When the “Repeat for convergence” option is checked, the result folder will contain two repeat folders: repeat1 and repeat2 (Figure 15).
(2) Each repeat folder contains multiple run folders corresponding to the Threads setting, similar to the setup described in the previous section (e.g., run1, run2...).
(3) Each run folder stores the complete results of an independent MCMC chain analysis (Figure 15). The primary results of the two replicate runs, comprising files such as “all_mcmc_runs.txt,” “summarization.out.txt,” and “FigTree.tre” are generated within both repeat folders. Additionally, MDGUI copies the FigTree.tre file from repeat1 to the directory at the same level as the repeat folders. If the two replicates have converged, the timetrees in repeat1 and repeat2 should be identical or highly similar.
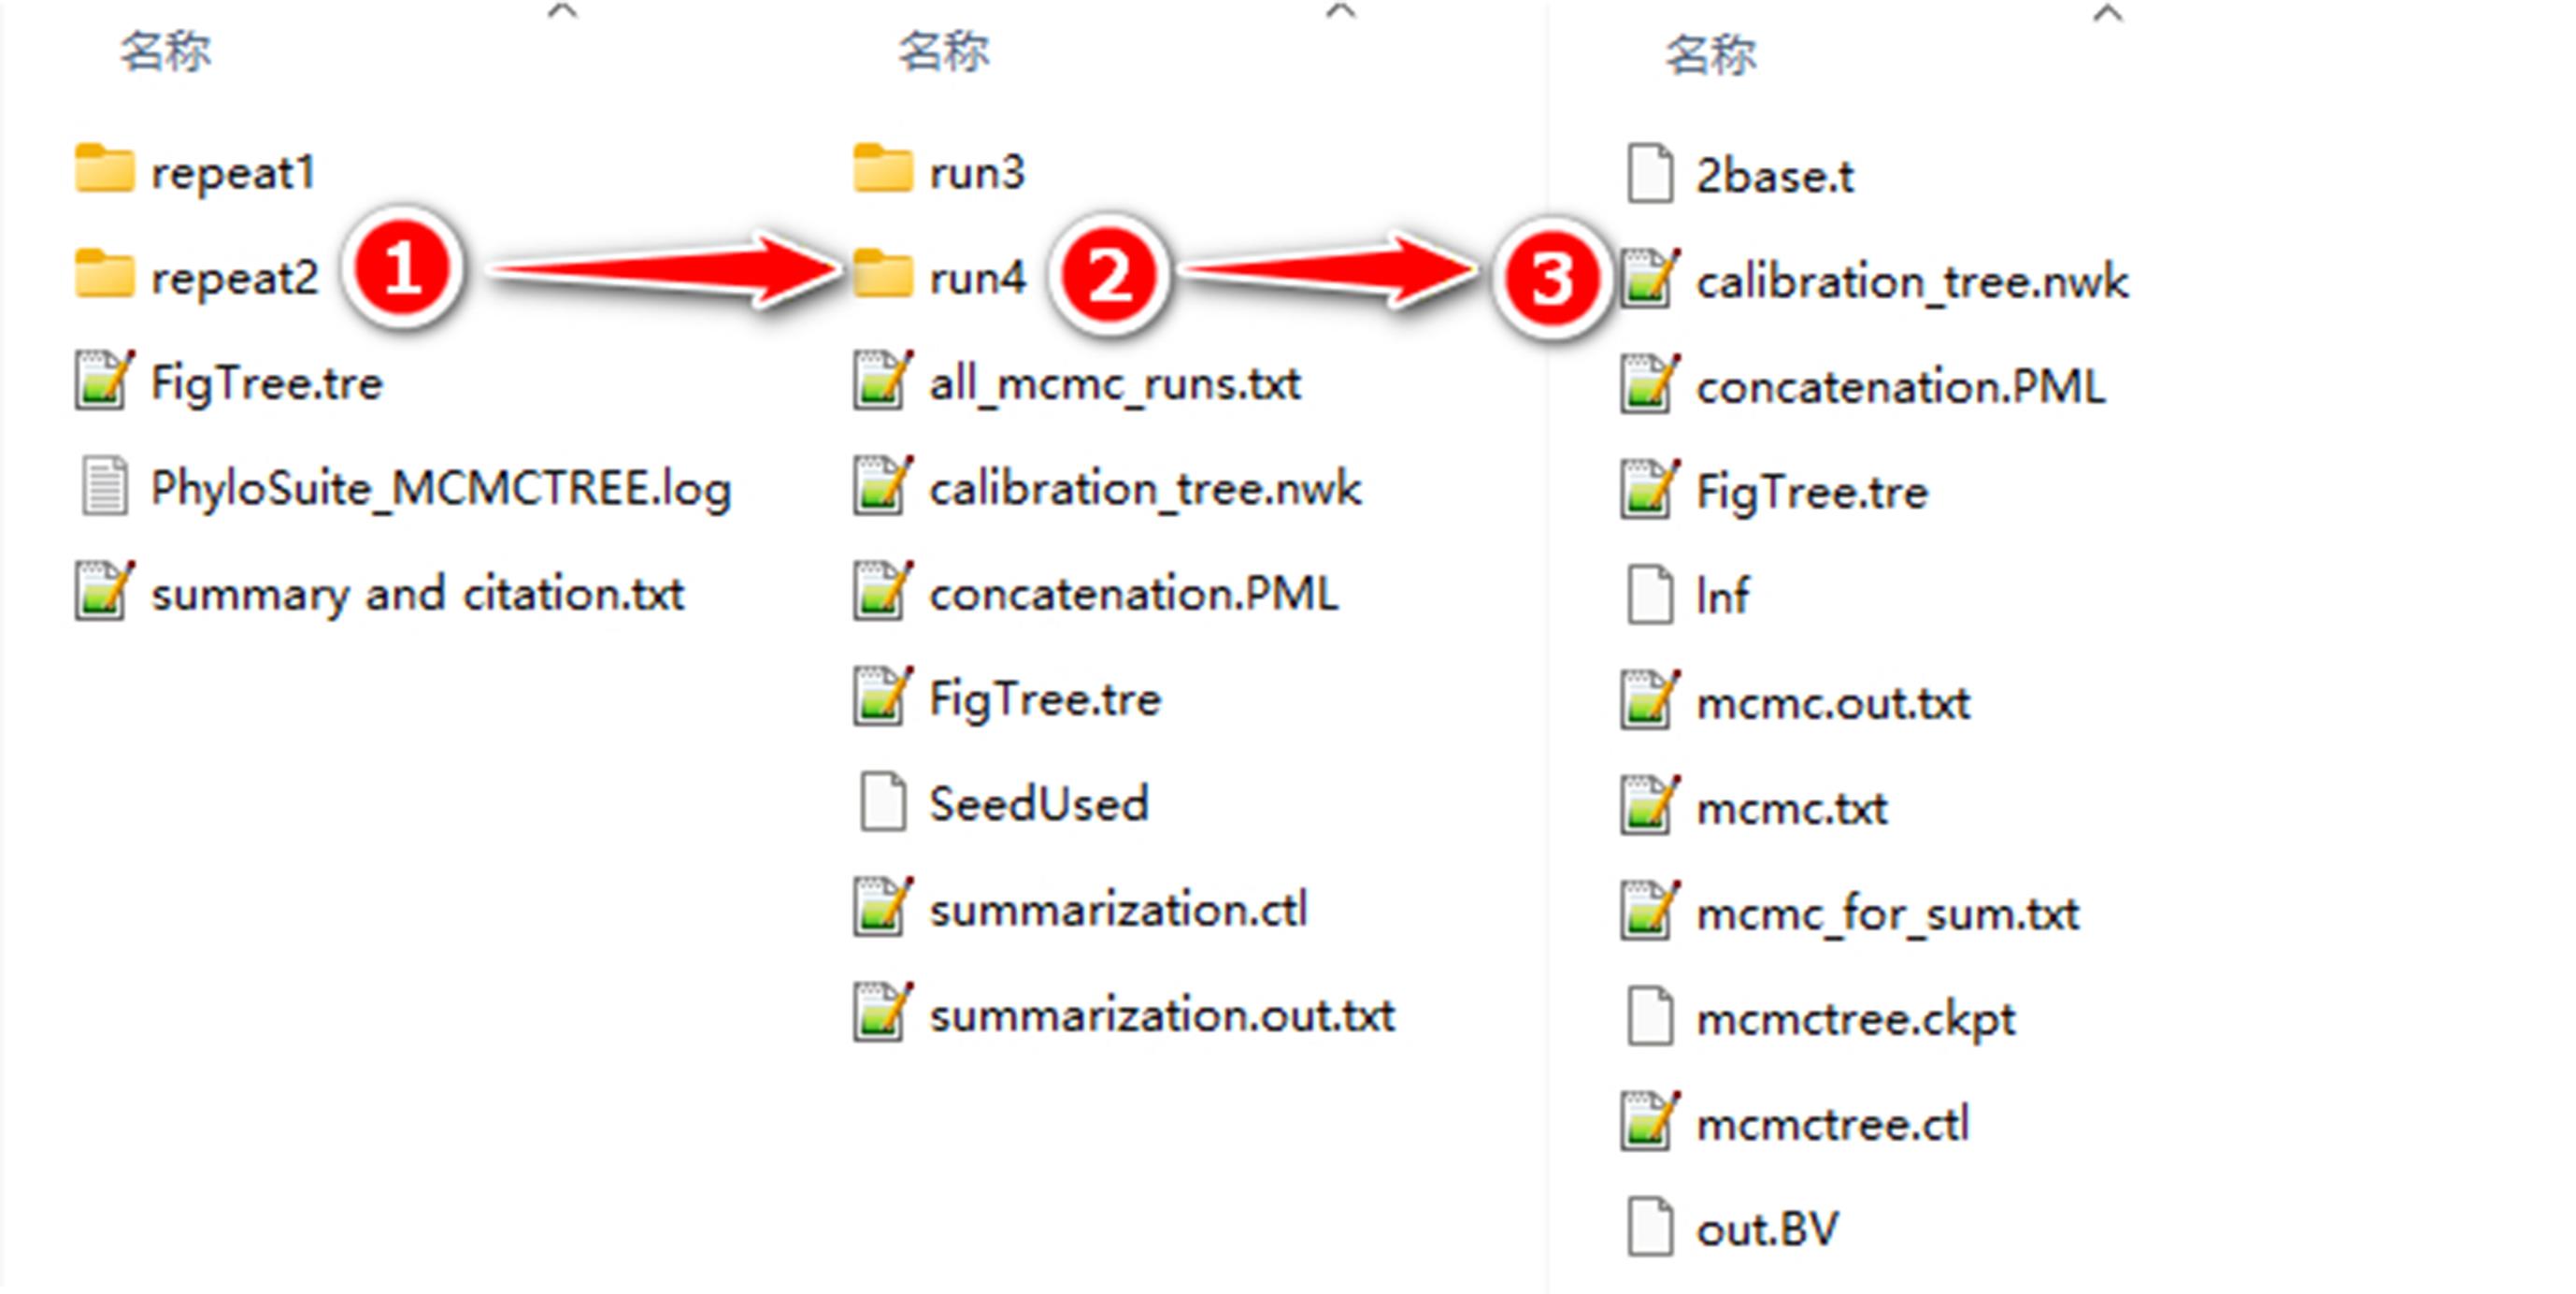
Figure 15. Output folder contents with enabling the “Repeat for convergence” option. Directory structure generated when multiple independent MCMC chains are executed with the “Repeat for convergence” option enabled: (1) repeat folders for replicated analyses; (2) run folders for individual MCMC chains within each repeat folder; (3) contents of each run folder storing the complete results.
B. MCMCTracer
The MCMCTracer tool is primarily designed for the statistical analysis, visualization, and convergence diagnostics of MCMC samples (such as results from MDGUI runs) to assess the reliability of the results (Figure 16). The interface is divided into two tabs: Trace and Convergence.
1. Trace tab
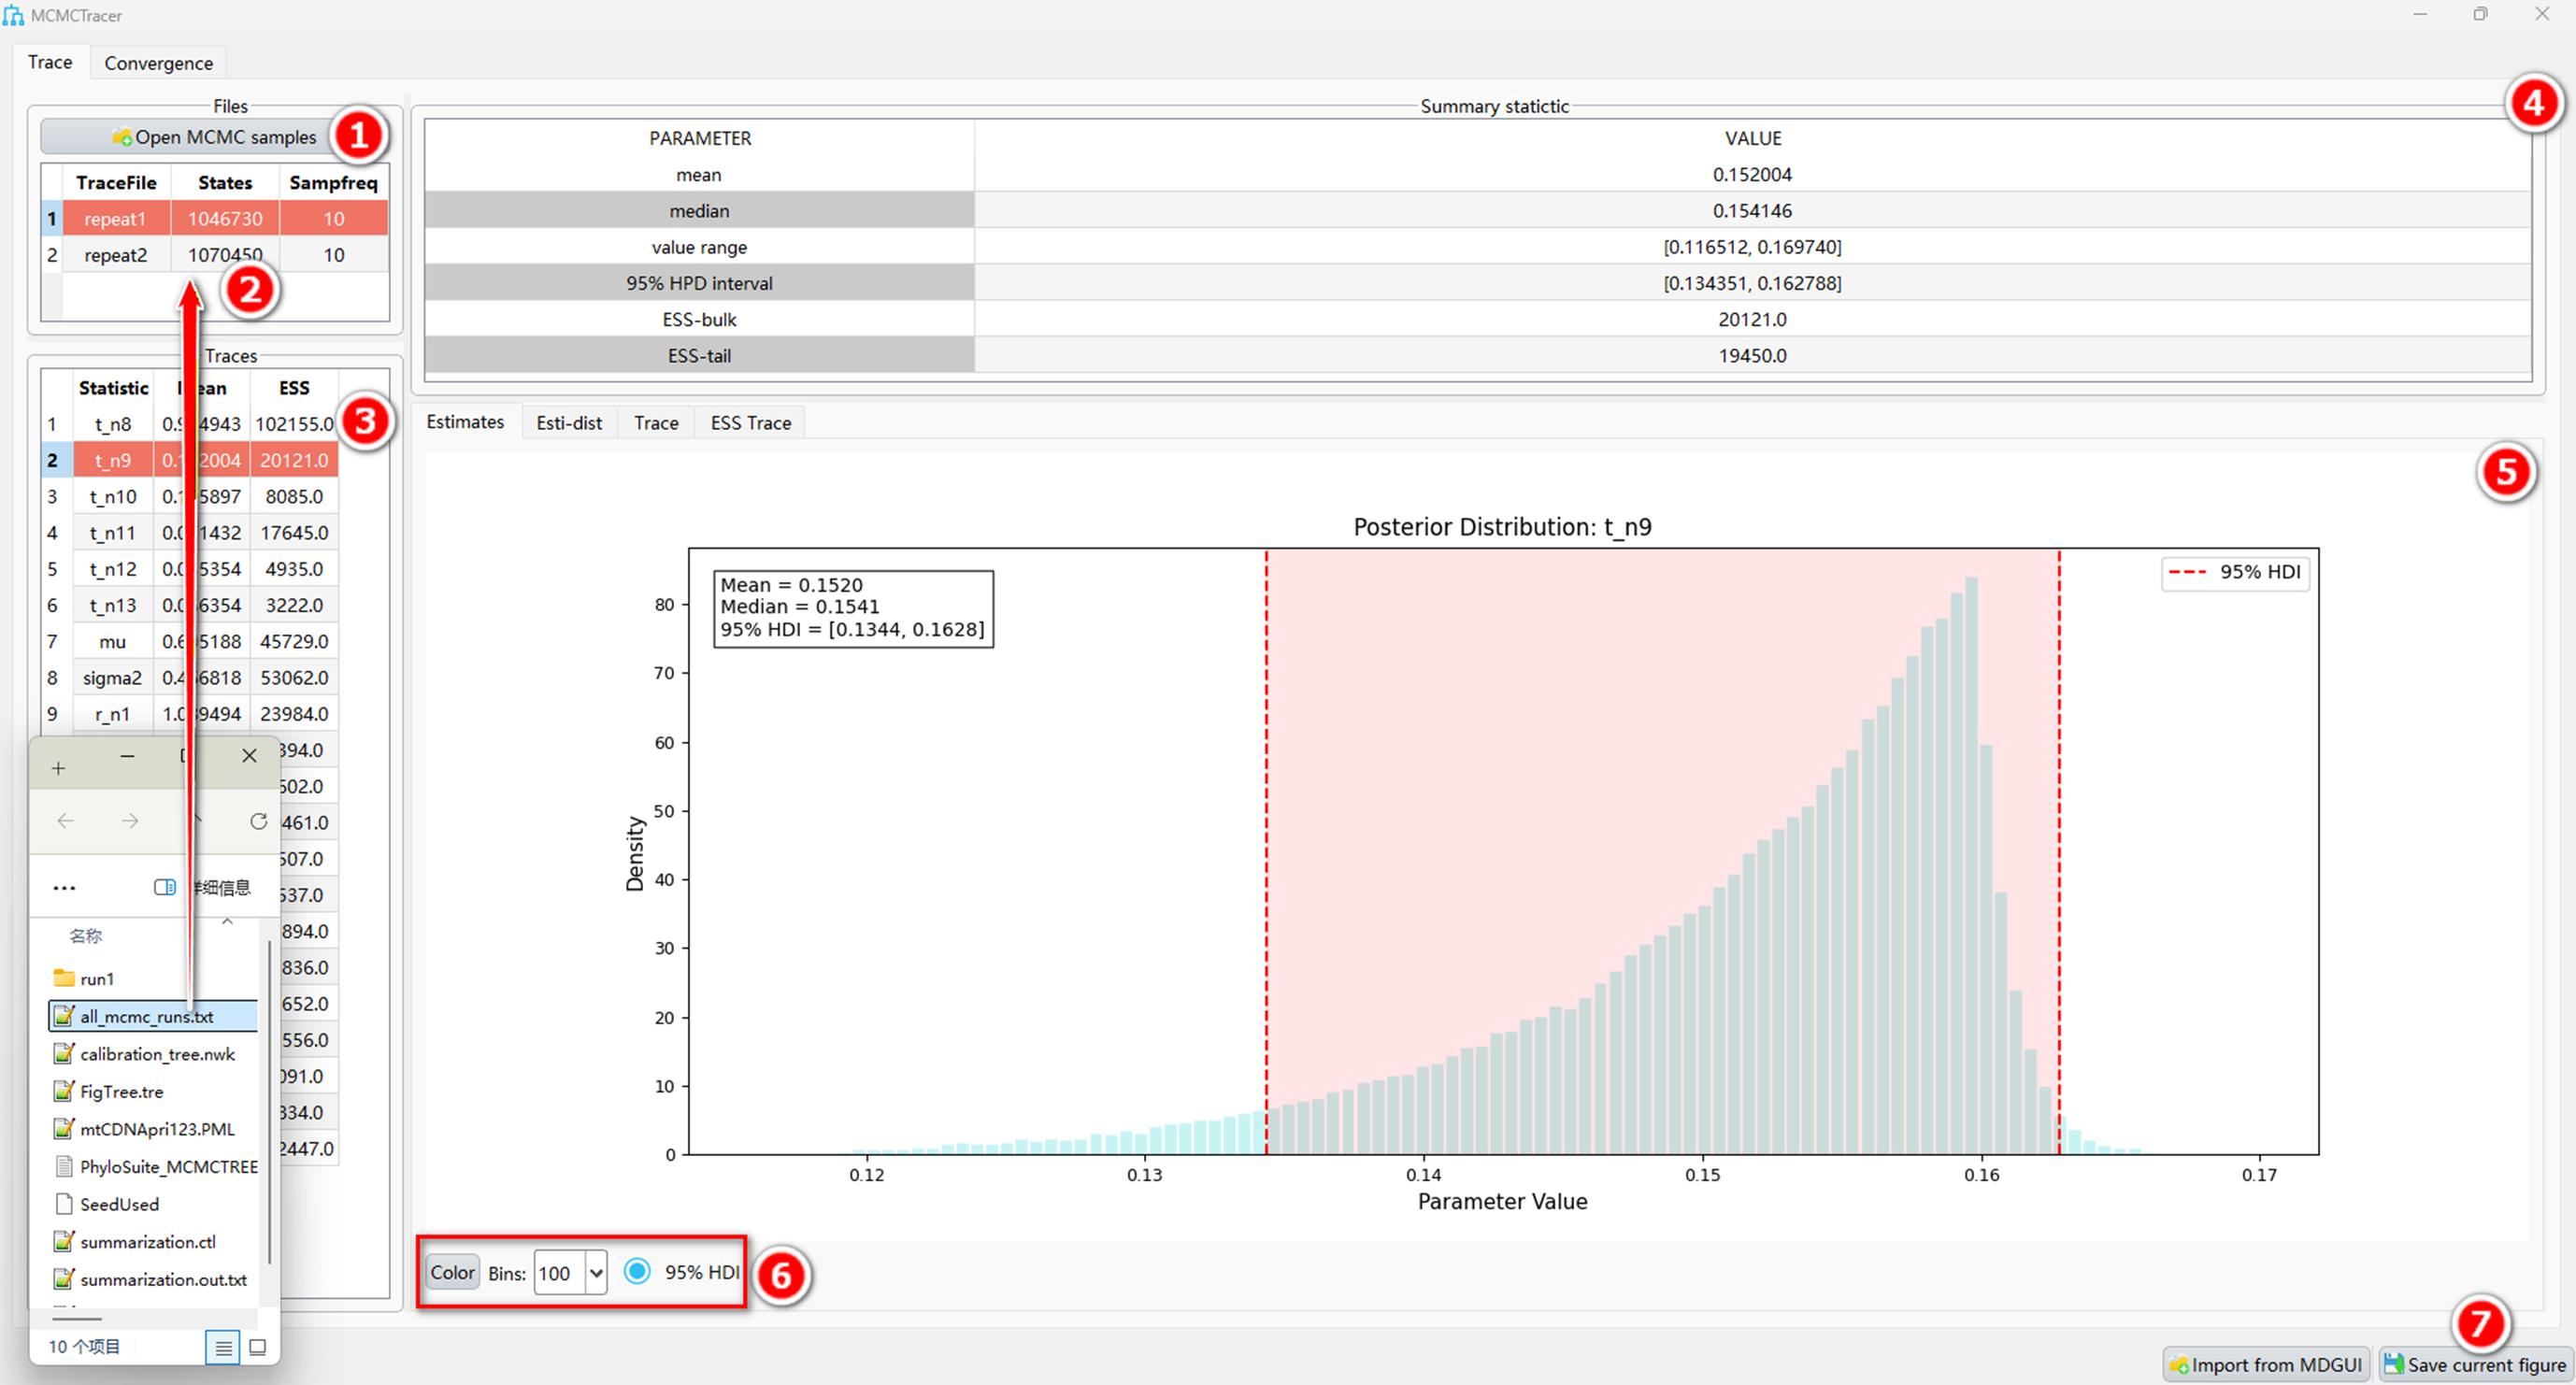
Figure 16. Main interface of MCMCTracer. Overview of the graphical interface used to visualize and summarize MCMC outputs: (1) button for importing result files; (2) drag-and-drop import area for directly loading result files; (3) data selection area for listing and selecting available data columns; (4) summary statistics area for displaying statistical summaries of the selected data; (5) visualization area for showing trace plots, histograms, and scatterplots; (6) customization area for modifying plot appearance; (7) button for exporting the displayed charts.
a. File selection: After launching MCMCTracer, users can click the input button in the import area and select files to import from the pop-up dialog box.
b. Drag-and-drop import: Directly drag result files from a system folder and drop them anywhere into the program window.
Tip: MCMCTracer is configured with an automated workflow for importing MDGUI analysis results. When MCMCTracer is launched, if the currently selected run in MDGUI is an MCMCtree result, the software will automatically load the available files and display the statistics and visualizations. Similarly, if users choose to check convergence using MCMCTracer during an ongoing analysis, the software will execute this same operation.
The files typically required for import are “mcmc.txt” (results from a single chain) or “all_mcmc_runs.txt” (merged results from multiple chains) located in the MDGUI result folder. Upon successful import, the file list area will display the names of all imported files. Hovering the mouse cursor over a file name will reveal its full storage path, facilitating quick verification of the imported file.
c. Data selection: Once files are imported, the Data Selection Area (Traces) at the bottom left will automatically read and list all available data columns from the files. Users can click to select different parameters, and the Visualization Area on the right will plot and display the corresponding data.
d. Summary statistics: This section displays statistical summaries for the selected data, including the value range, median, mean, 95% confidence interval (CI), and effective sample size (ESS).
e. Visualization area: This area visualizes the selected data into various statistical plots, including trace plots, histograms, and scatterplots.
f. Customization: Users can modify the plots within the visualization area, customizing visual elements such as plot colors, histogram bins, and point styles.
g. Export: Users can use the save button at any time to instantly save the charts currently displayed on the interface, with support for multiple output formats.
2. Convergence tab
The Convergence tab is designed for the automated diagnosis and analysis of consistency between results from two independent MCMCtree analyses (Figure 17). This includes comparisons between two independent molecular dating analyses (e.g., repeat1 and repeat2) or between results of two independent MCMC chains (e.g., run1 and run2).
a. The operational workflow in this section is highly simplified. Users do not need to manually select or drag individual files; simply click the Import from MDGUI button.
b. In the pop-up dialog box, directly select the MDGUI analysis results. The program will automatically recognize the corresponding files for analysis.
c. Upon data import, the software will automatically read and display other key details, such as seed and posterior mean times.
d. This area automatically extracts the “summarization.out.txt” files (which contain the posterior mean times for each node obtained from MCMCtree analysis) from the repeat1 and repeat2 folders within the result directory. It then generates a scatterplot based on this data to facilitate convergence assessment. If the two runs (repeat1 and repeat2) have converged to the same posterior distribution, all data points in the scatterplot should cluster closely around the x = y diagonal. Conversely, if data points deviate significantly from this diagonal, it indicates non-convergence. In this case, the MCMC chain runtime needs to be extended (e.g., by increasing the nsamp or burnin parameters, or both). For further details, please refer to the official MCMCtree manual (https://gensoft.pasteur.fr/docs/paml/4.9j/MCMCtree.Tutorials.pdf).
Tip: As the MDGUI-MCMCtree run progresses, points in the scatterplot should gradually cluster closer to the diagonal line, indicating improved agreement between runs; a tight concentration along the diagonal by the end of the run suggests convergence (Figure 18).
If the analysis shows serious convergence problems (Figure 19), users should first check the input data and then consider increasing sampling-related parameters to further assess whether convergence can be improved.
e. Users can use the export function provided by the software to save the final convergence diagnostic plot to their local machine in various common image formats (e.g., PNG, JPEG, SVG, and PDF).
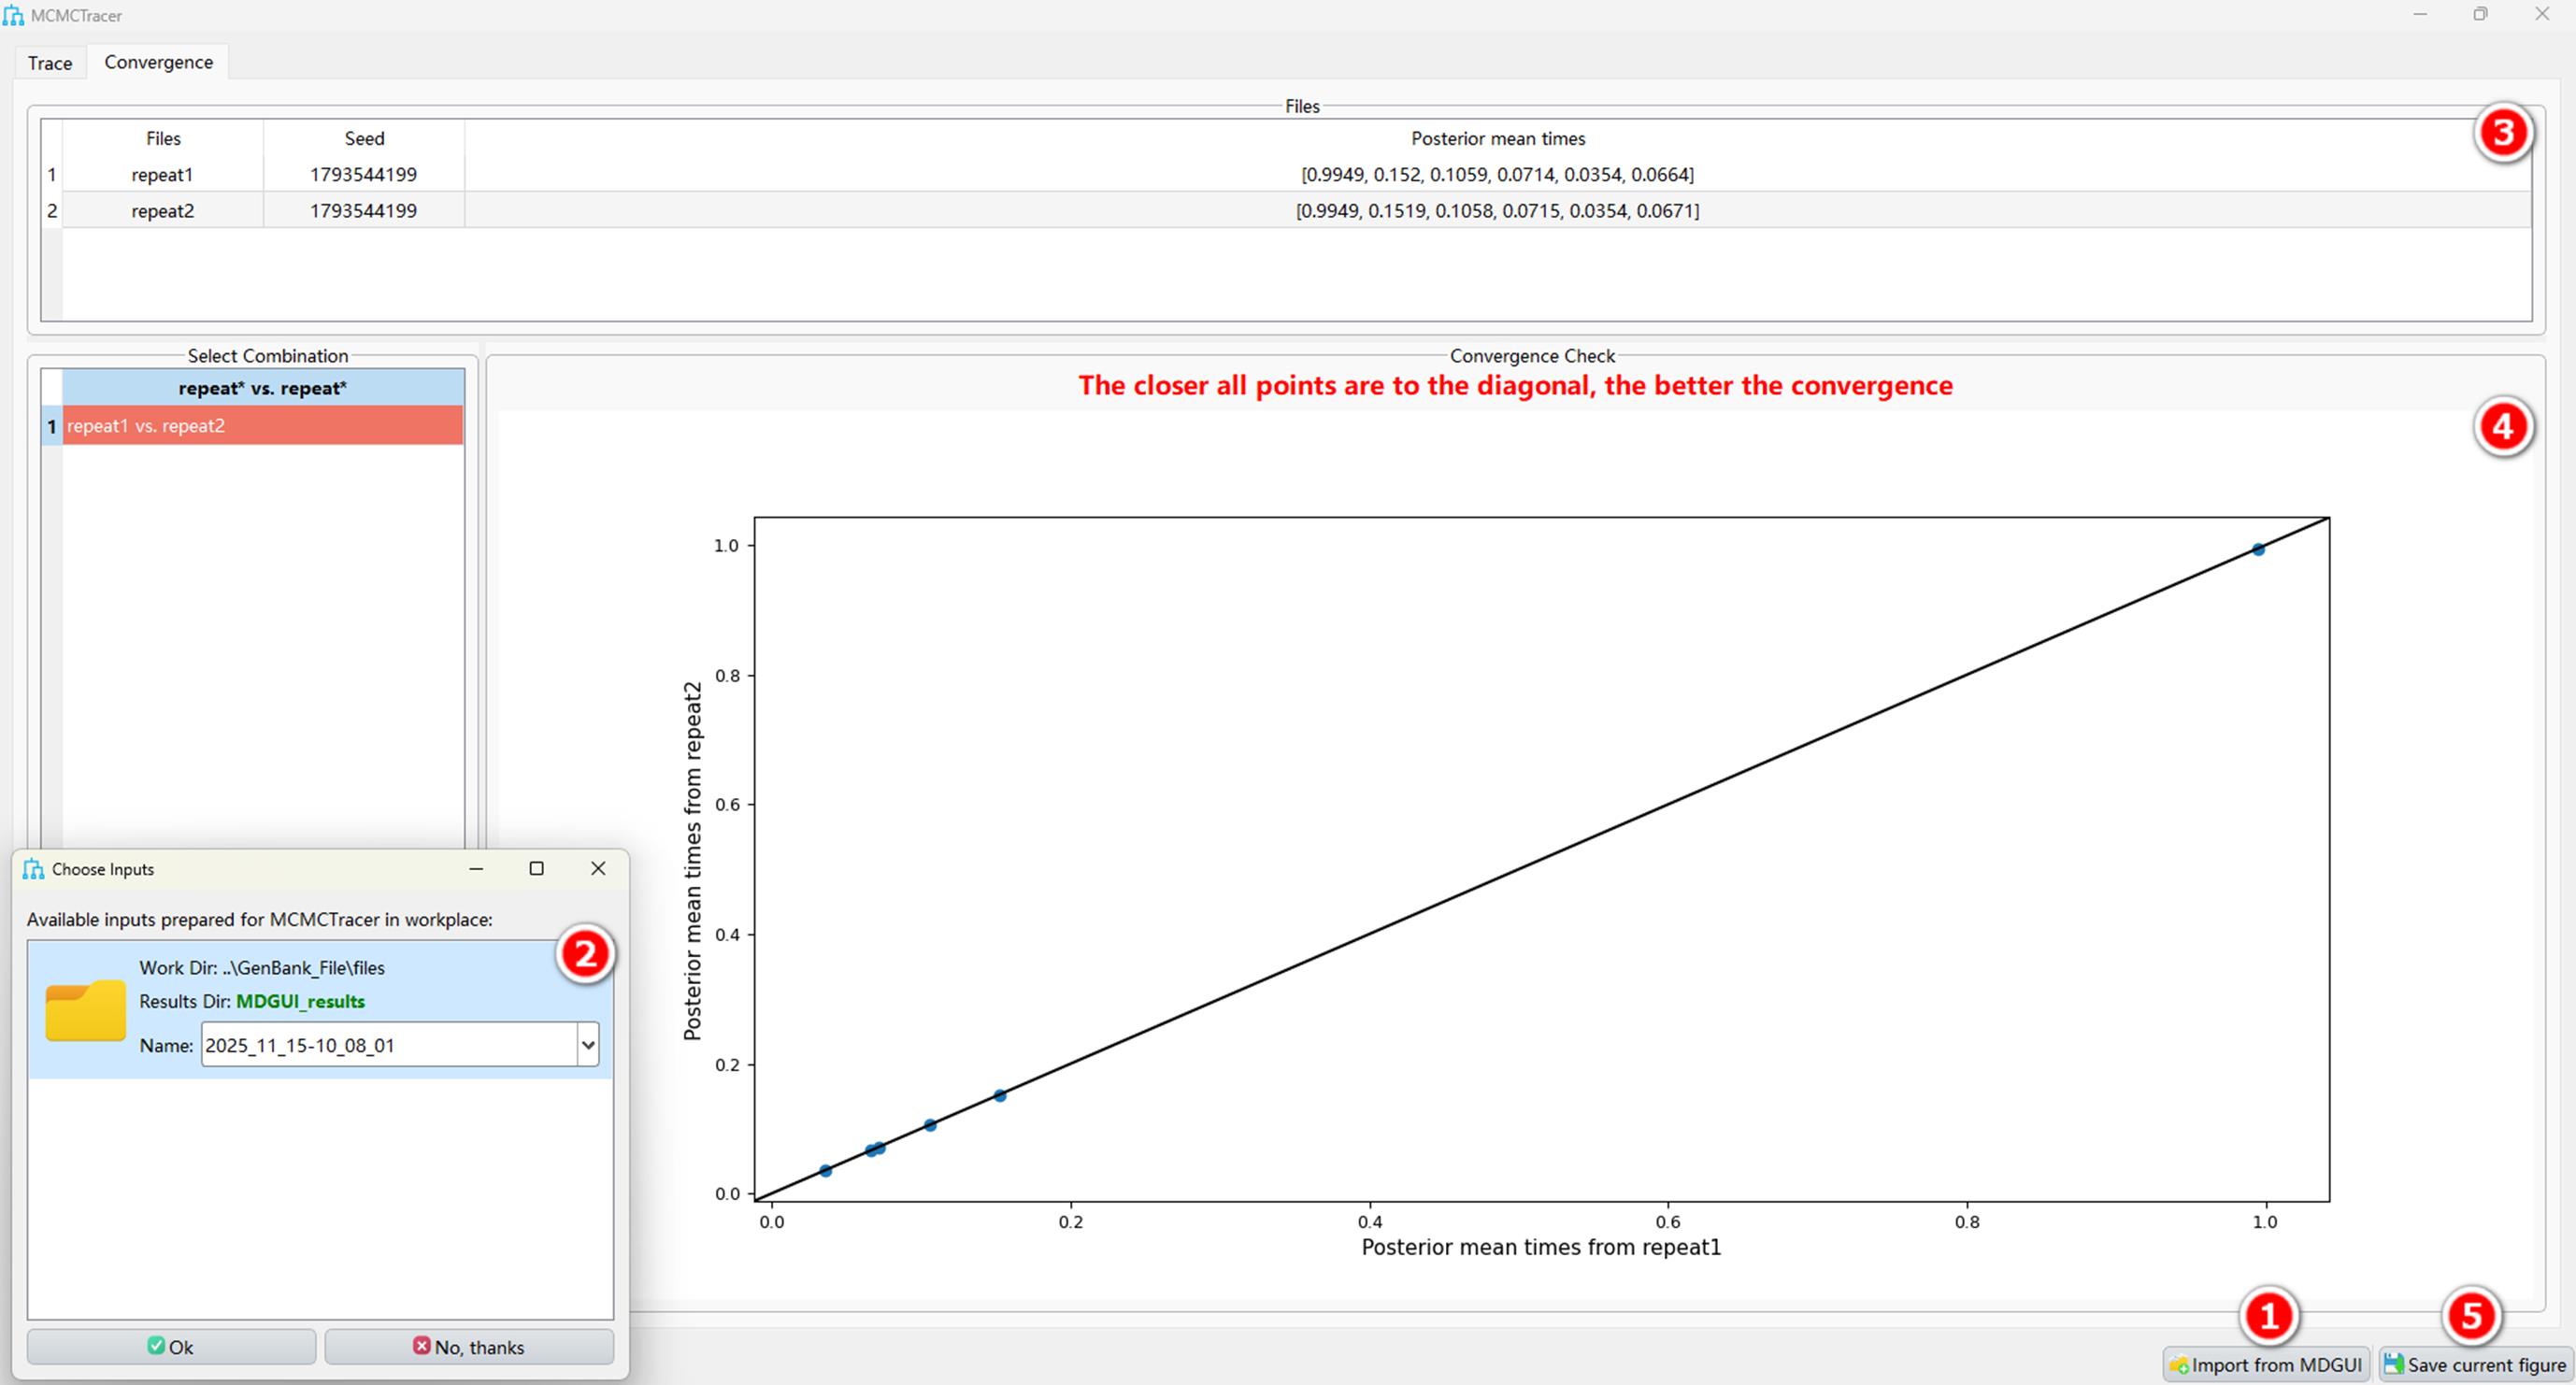
Figure 17. MCMCTracer convergence diagnostics. Example outputs showing scatterplot and posterior summaries used to evaluate MCMC convergence: (1) button for directly loading results generated by MDGUI; (b) pop-up dialog box for selecting the MDGUI analysis result folder; (c) area displaying automatically recognized run information, such as seed and posterior mean times; (d) scatterplot area for assessing convergence between repeat1 and repeat2 results; (e) button for saving the convergence diagnostic plot.
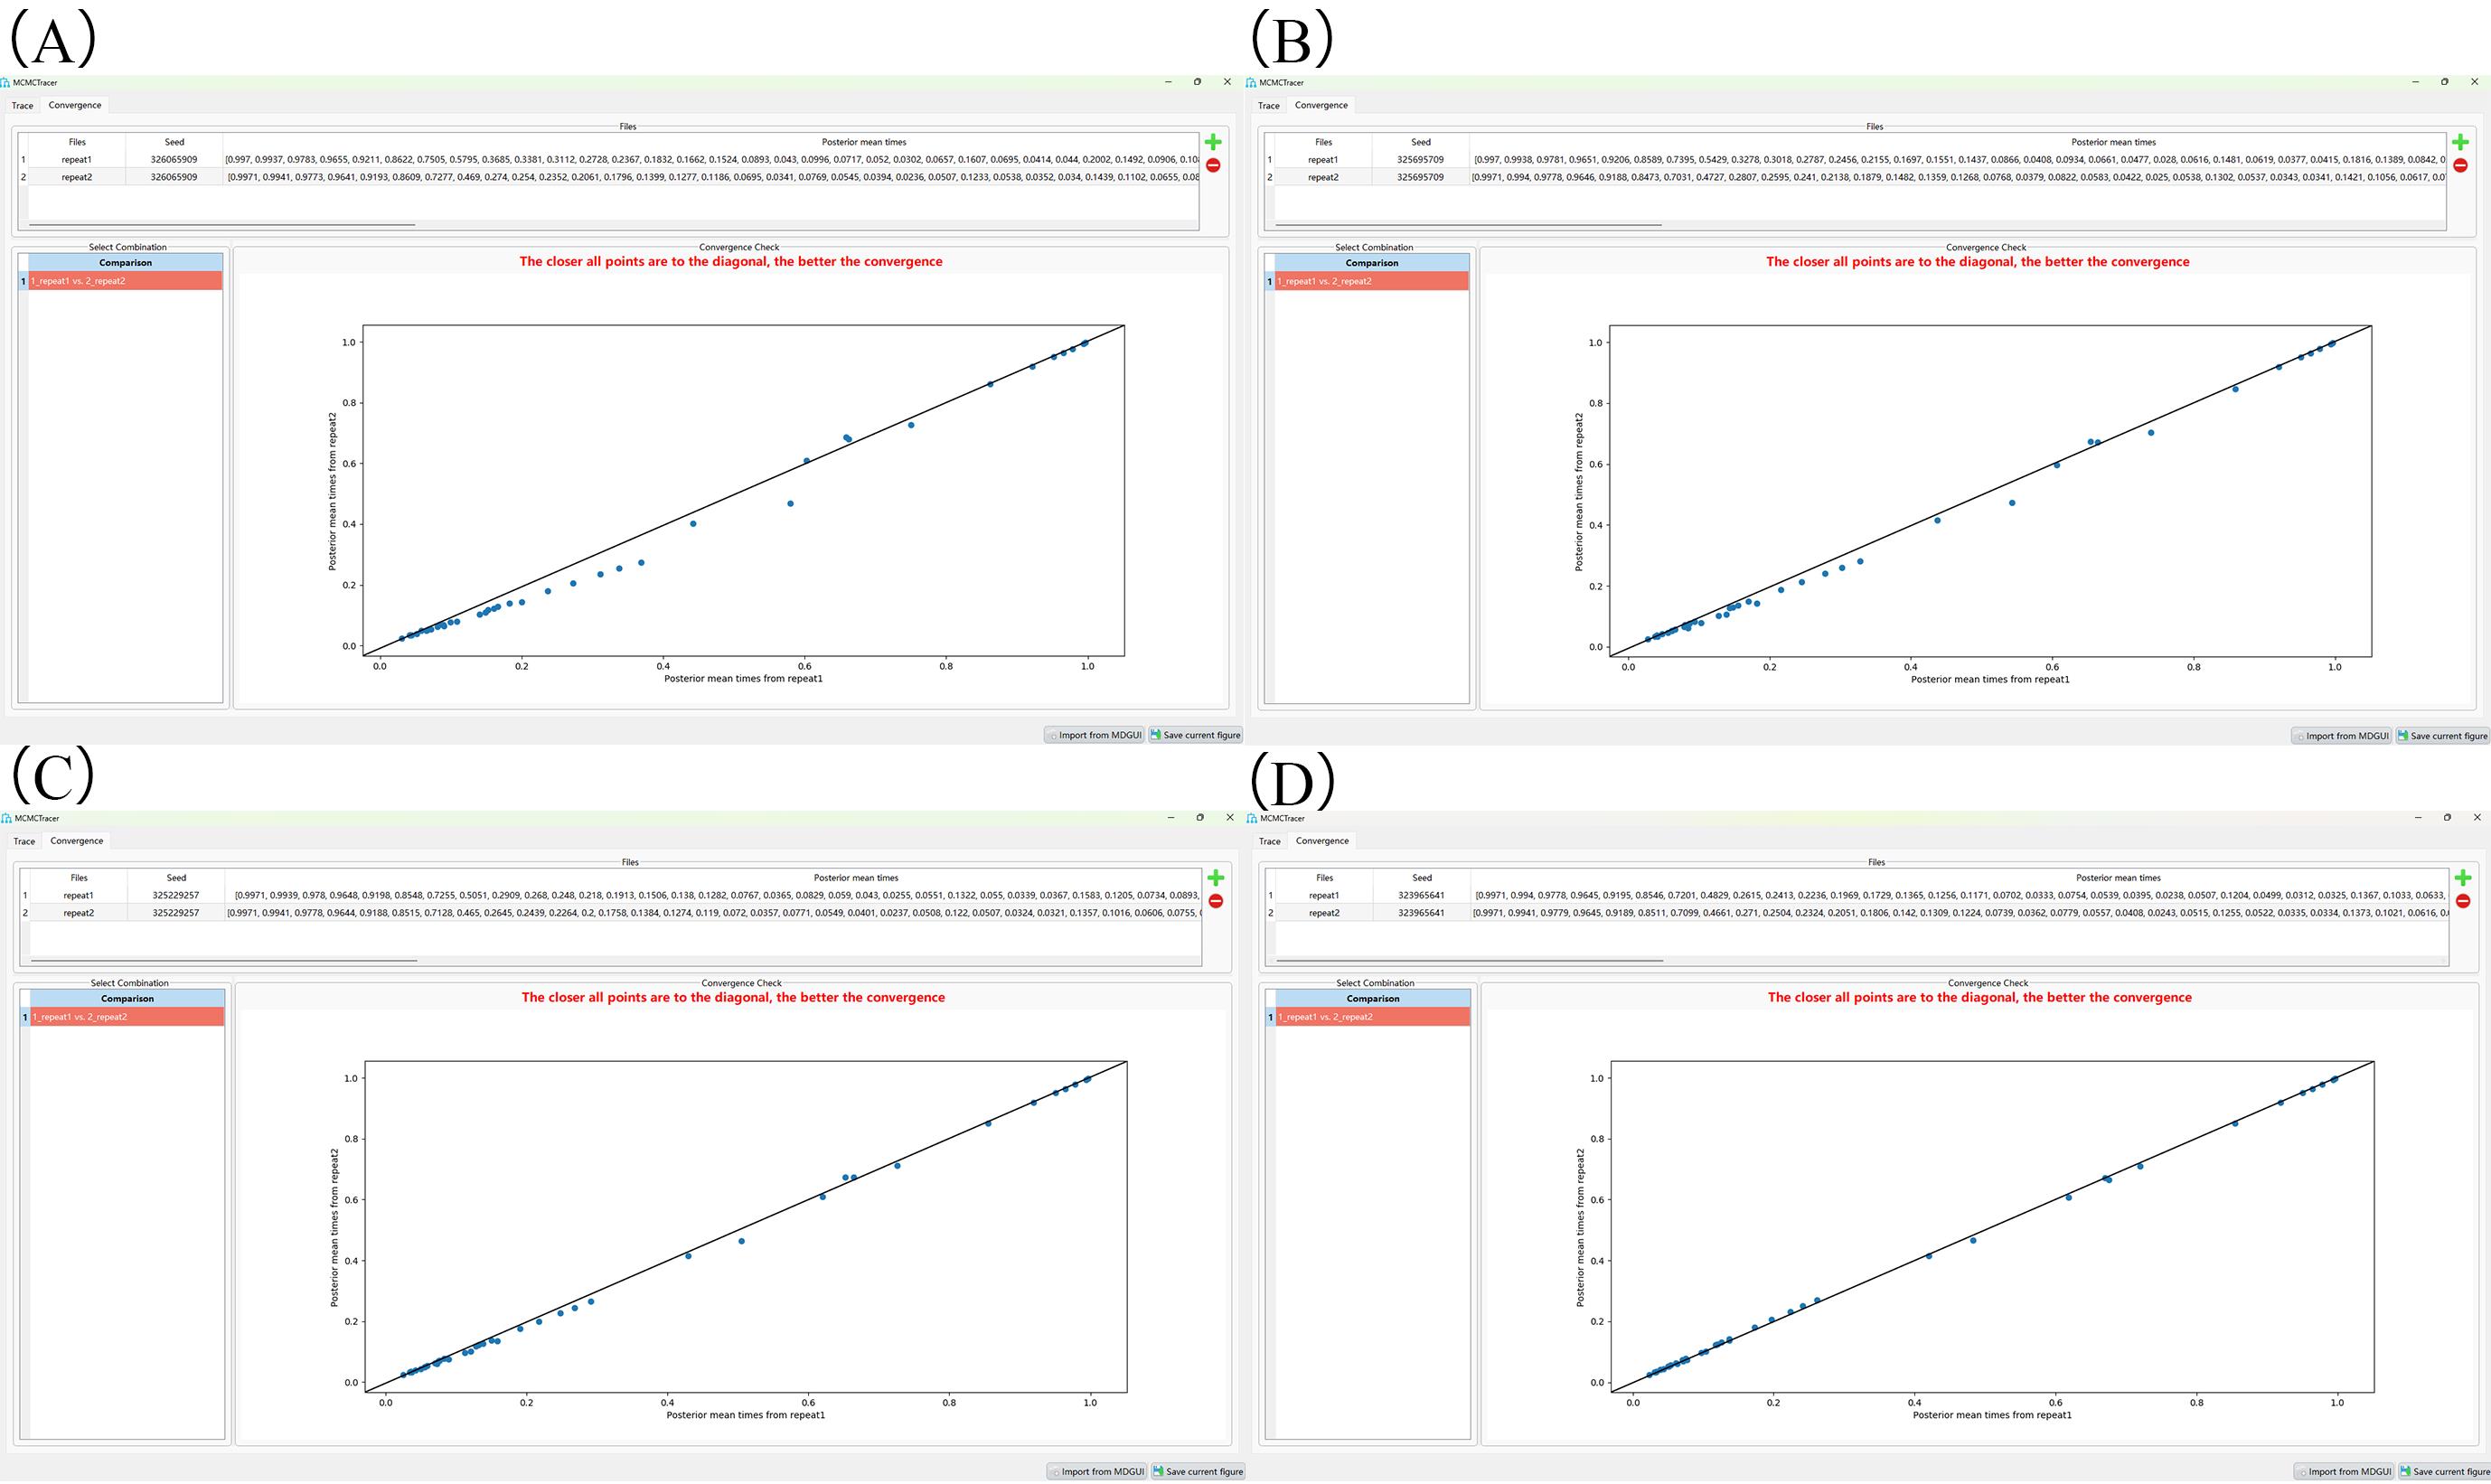
Figure 18. Real-time convergence diagnostics at different stages of an MCMCtree run. (A) Convergence status at 15% progress. (B) Convergence status at 45% progress. (C) Convergence status at 75% progress. (D) Convergence status at 100% progress (run completed).
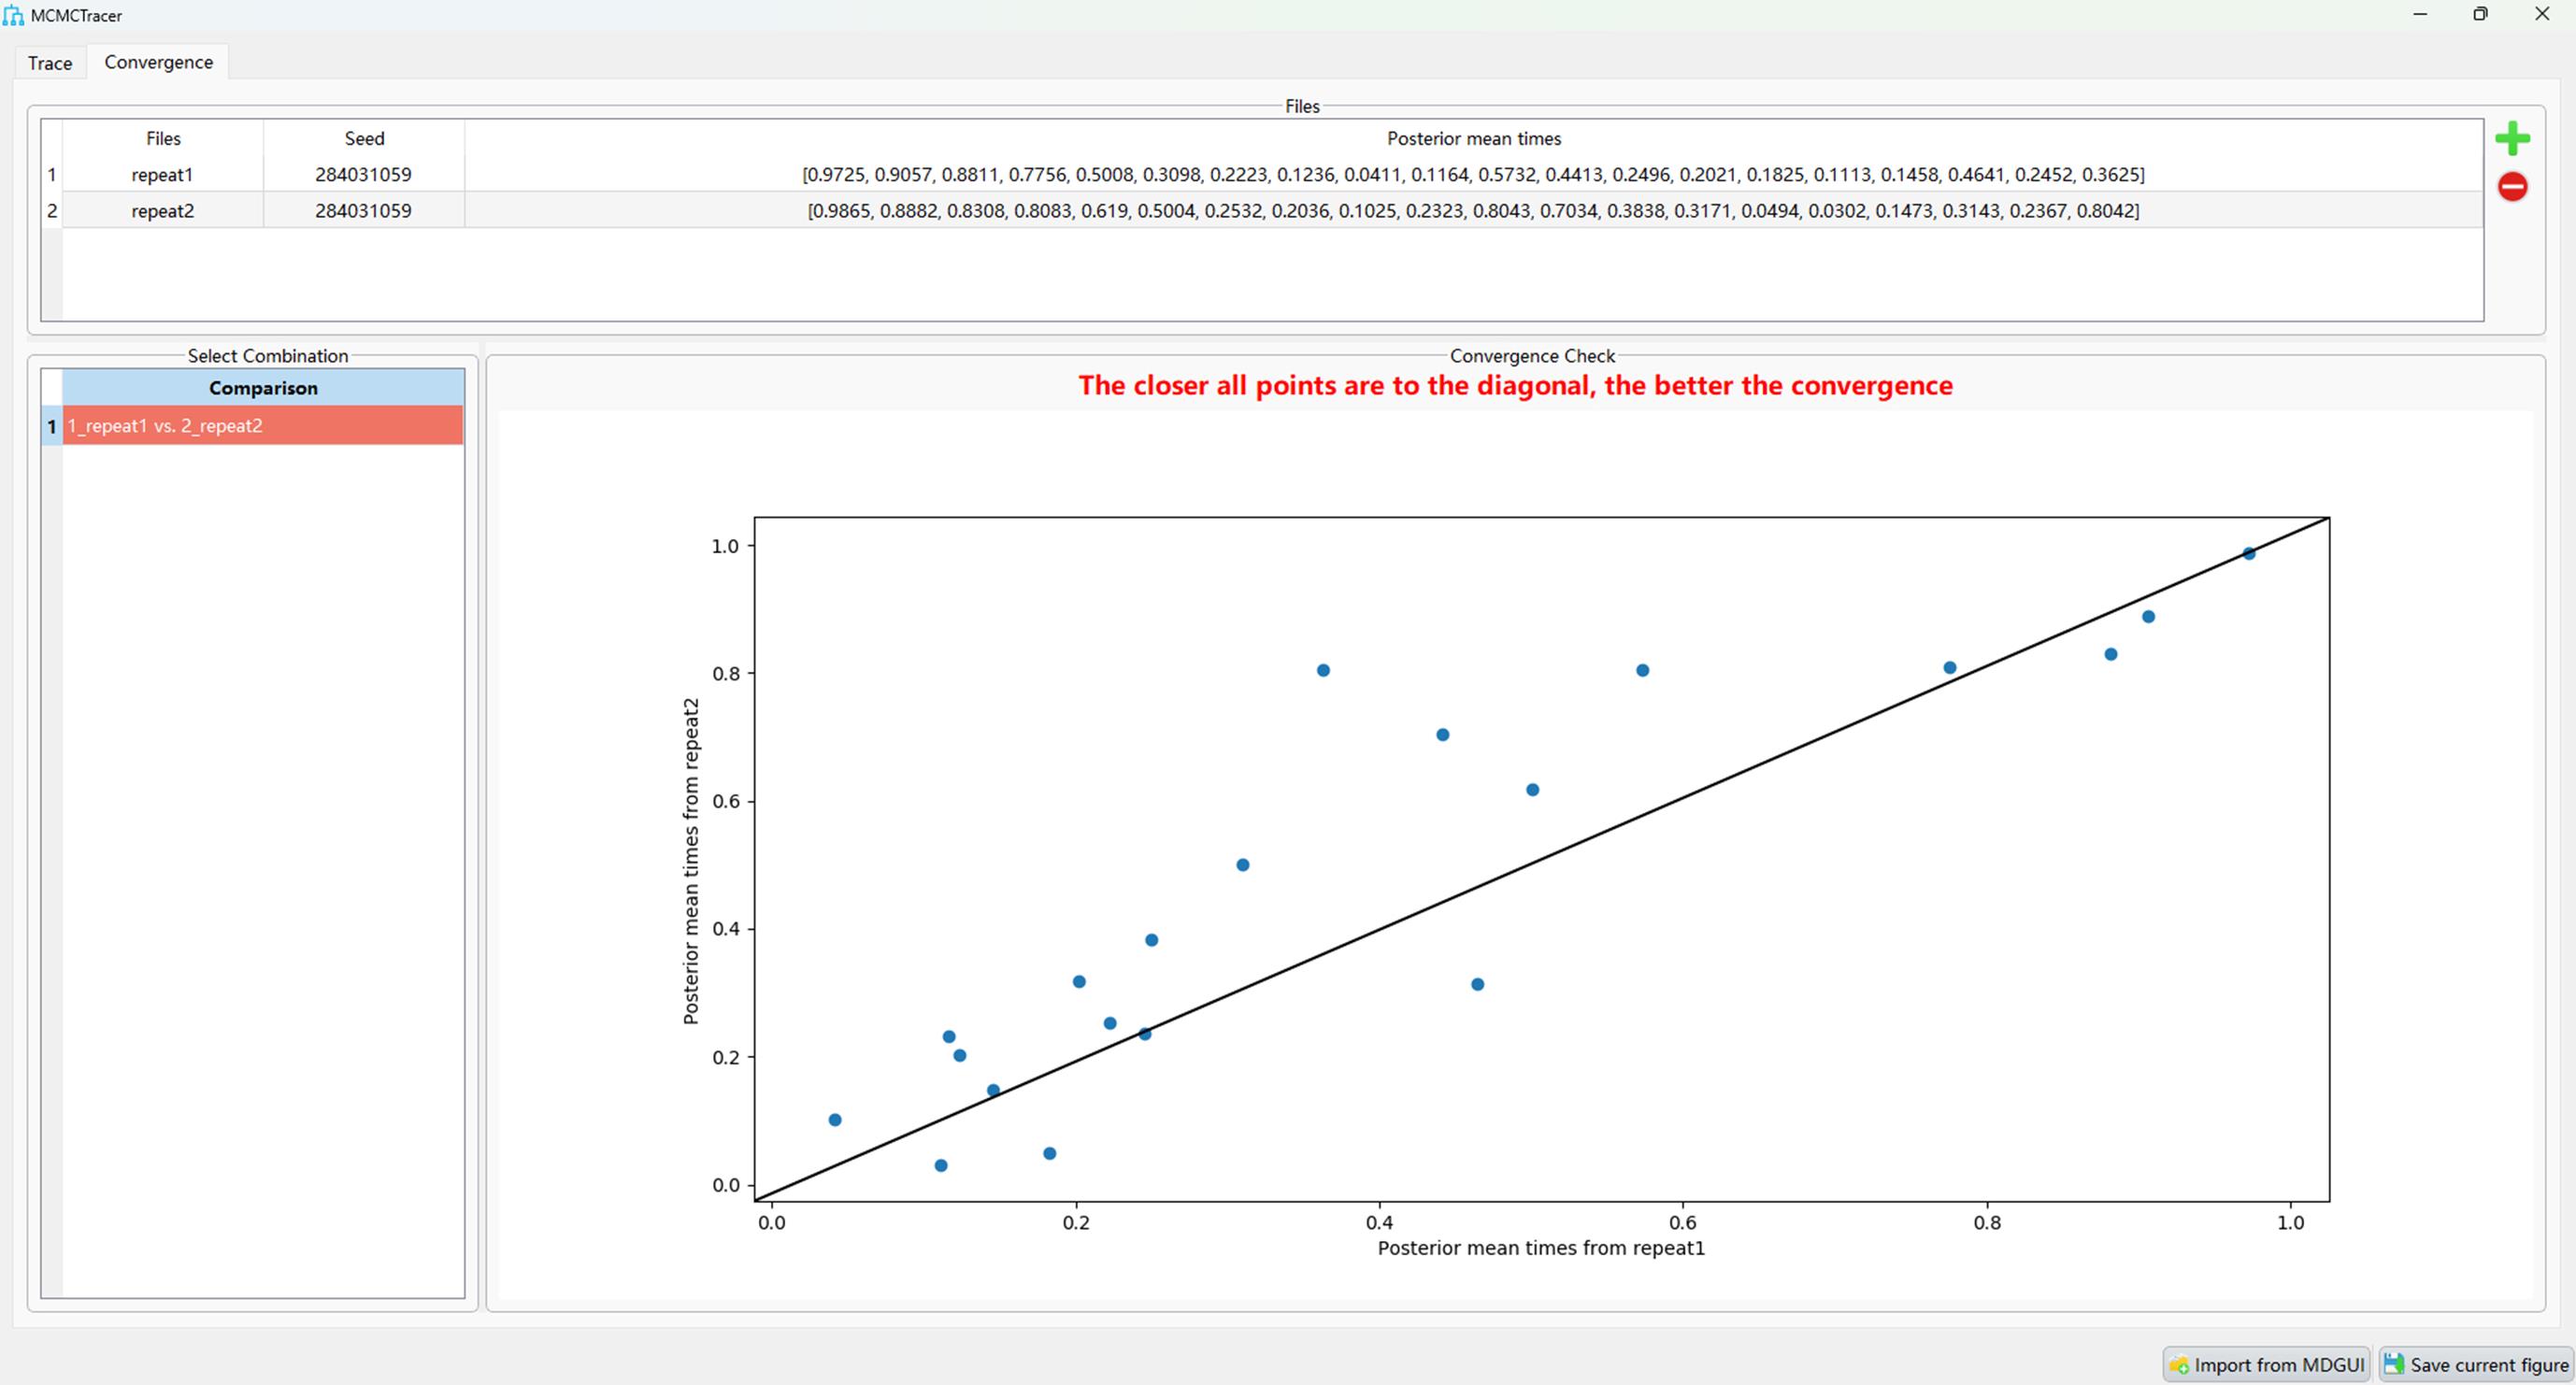
Figure 19. Example of a failed convergence result in MCMCTracer
C. TimeTreeAnno
TimeTreeAnno is designed specifically for the visualization and annotation of timetrees generated by various molecular clock analysis software packages (e.g., MCMCtree, BEAST, r8s, MrBayes, etc.) (Figure 20).
1. File import and visualization
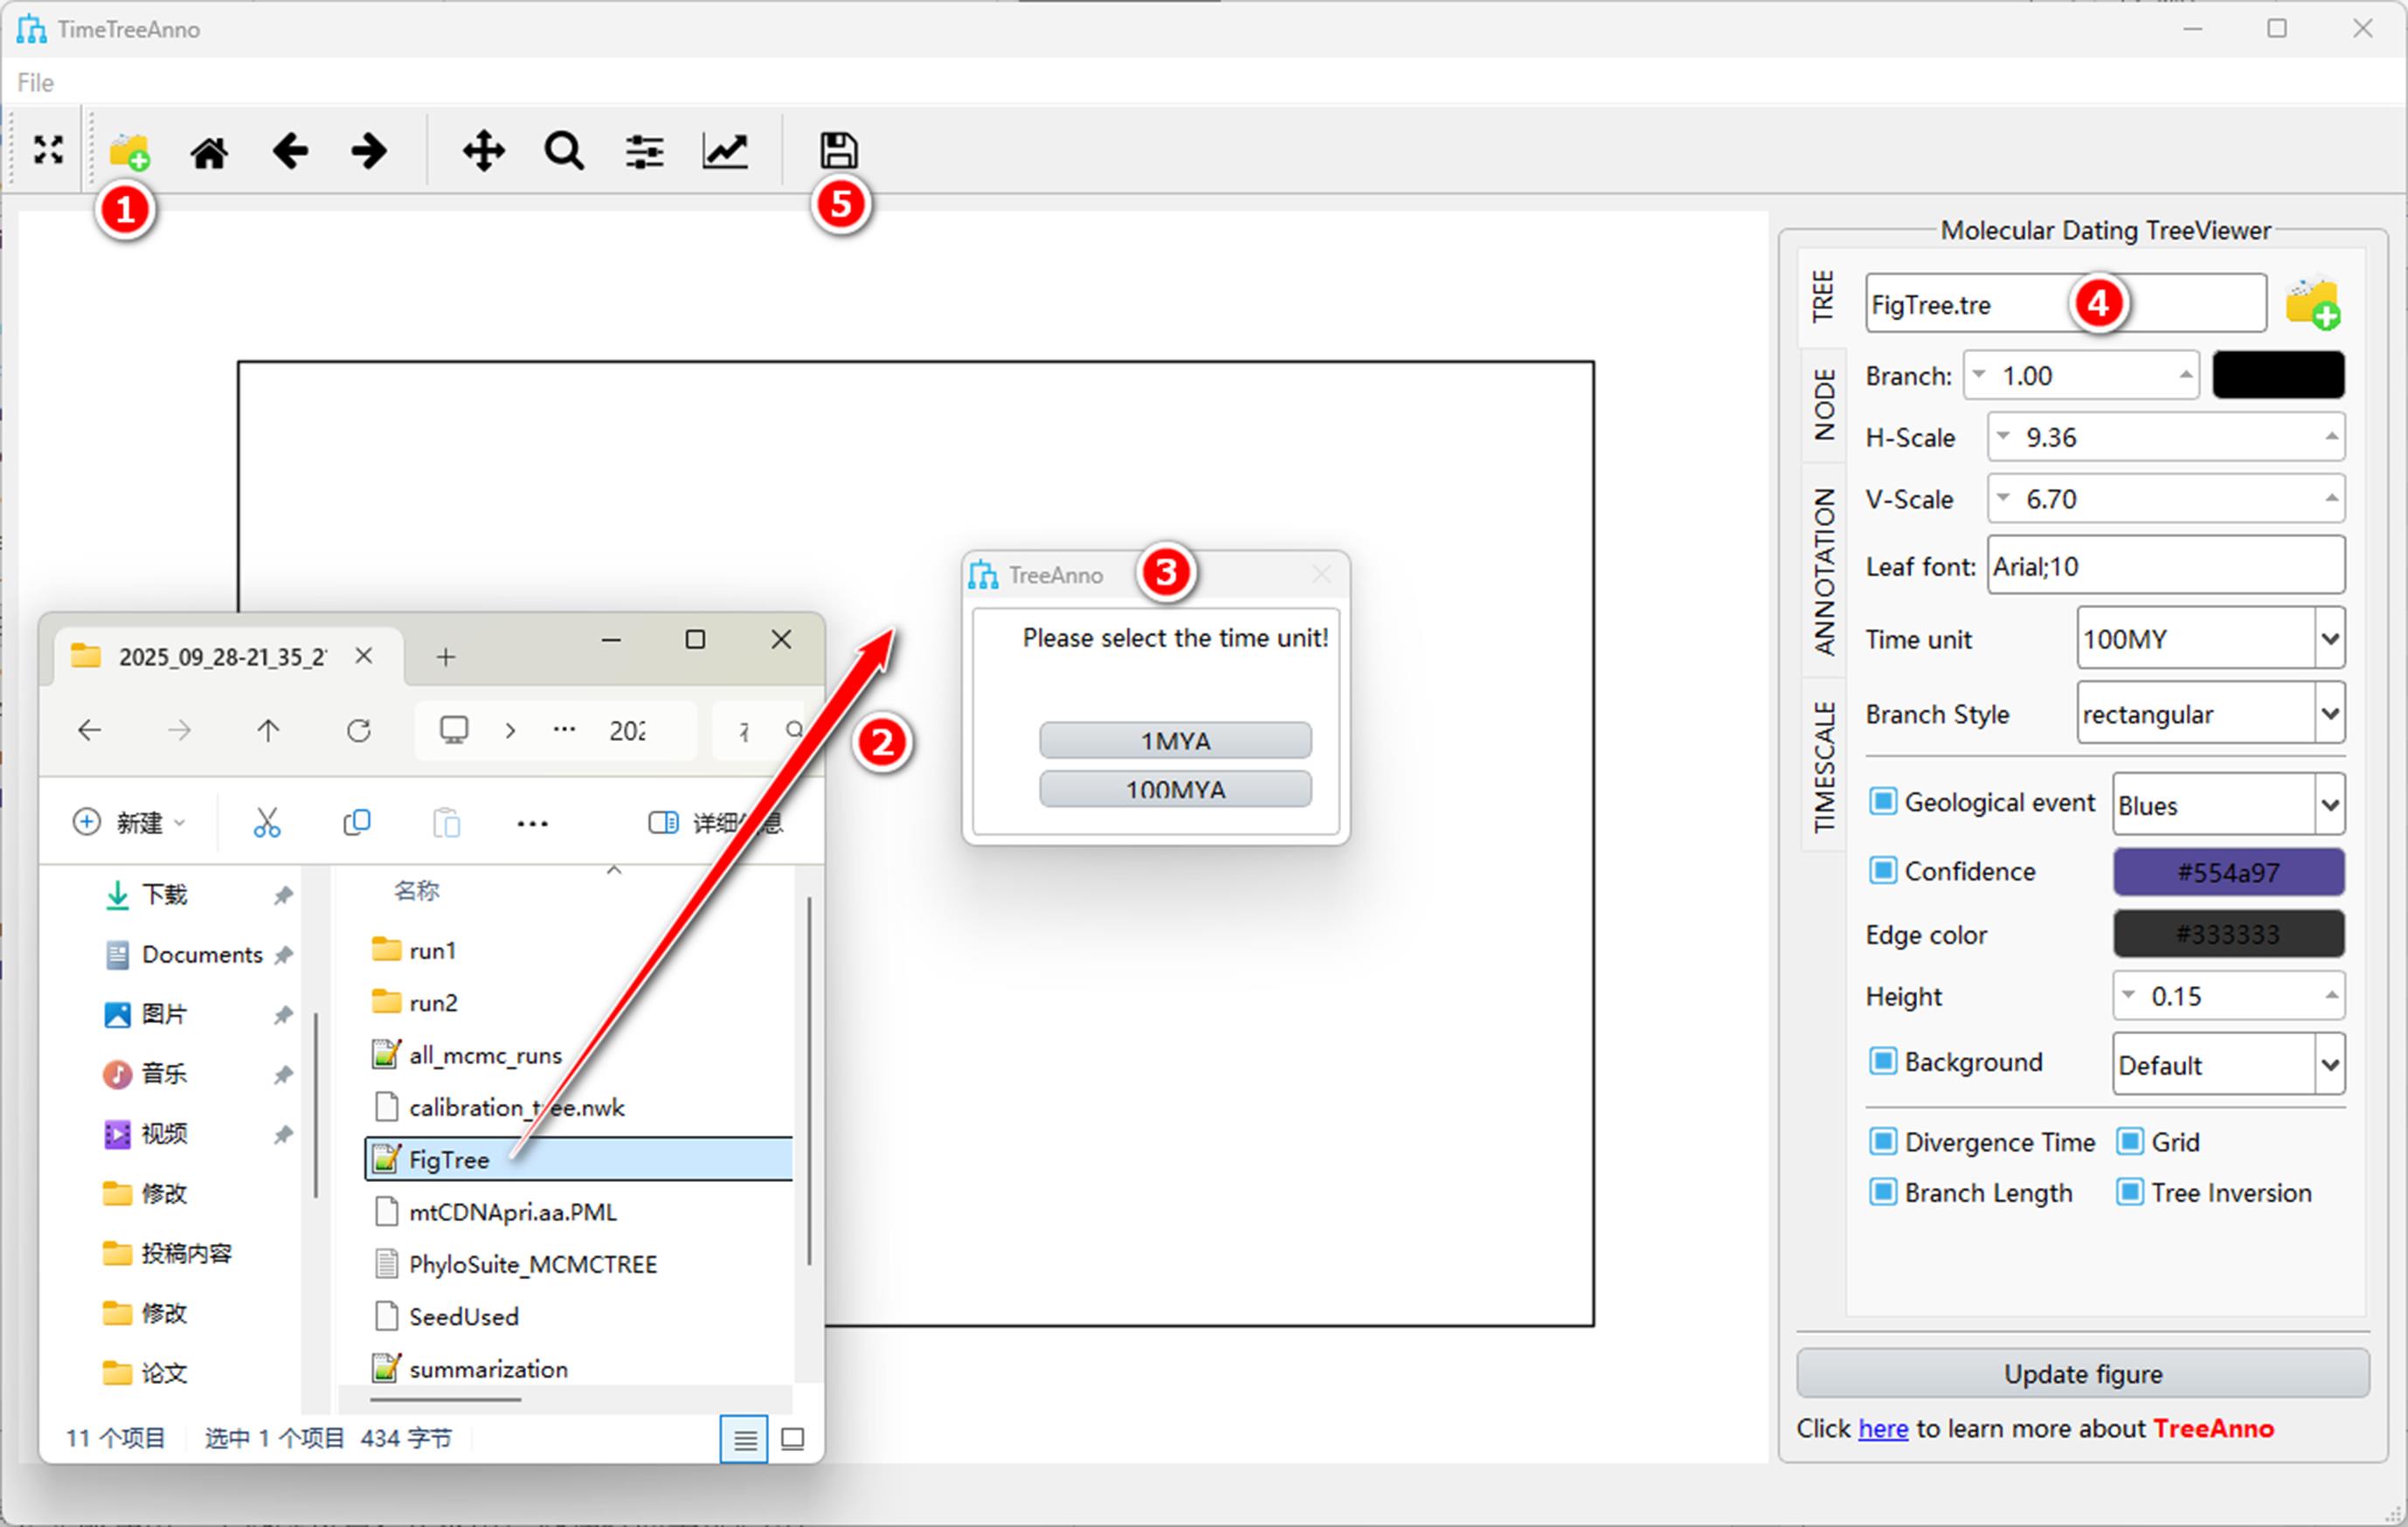
Figure 20. Main interface of TimeTreeAnno. Overview of the visualization for annotating timetree: (1) button for importing a tree file; (2) drag-and-drop import for loading a timetree file; (3) dialog box for selecting the time unit used in the imported tree file; (4) file name display area for the loaded tree file; (5) main visualization and control area for displaying, editing, and exporting the annotated timetree.
a. Upon launching TimeTreeAnno, users can import a tree file by clicking the import button and selecting the desired file from the pop-up dialog box.
b. Alternatively, users can drag and drop the timetree file directly onto the TimeTreeAnno interface. For instance, the “FigTree.tre” file generated in the MCMCtree result folder can be dragged from the system file explorer into the program window.
c. Once the tree file is imported, a dialog box will prompt users to select the time unit used in the tree file (e.g., 1 MYA or 100 MYA).
d. After import, the name of the loaded file will be displayed.
e. TimeTreeAnno provides a save button, allowing users to export and save the annotated and refined tree plot once the desired visualization is achieved. After confirming the time units, the program automatically parses the tree file and generates a polished timetree. The phylogenetic tree section primarily displays the topology and divergence time confidence intervals (CI); the top and bottom scales serve as time rulers; “100 MYA” indicates the time unit; and the colored blocks at the bottom represent geological epochs (Figure 21). Configuration of various image elements can be performed via the control panel on the right side of TimeTreeAnno.
i. The TREE tab allows users to adjust the image aspect ratio, visual elements, color schemes, background settings, and more.
ii. The NODE tab displays all nodes within the tree, distinguishing node types via different colors, and supports the copying of node names.
iii. The ANNOTATION tab allows users to add supplementary annotation elements to the image, such as text annotations and clade coloring.
Tip: Some annotation functions within the ANNOTATION tab are currently under active development and refinement.
iv. After modifying parameters, users can refresh the image by clicking the Update figure button.
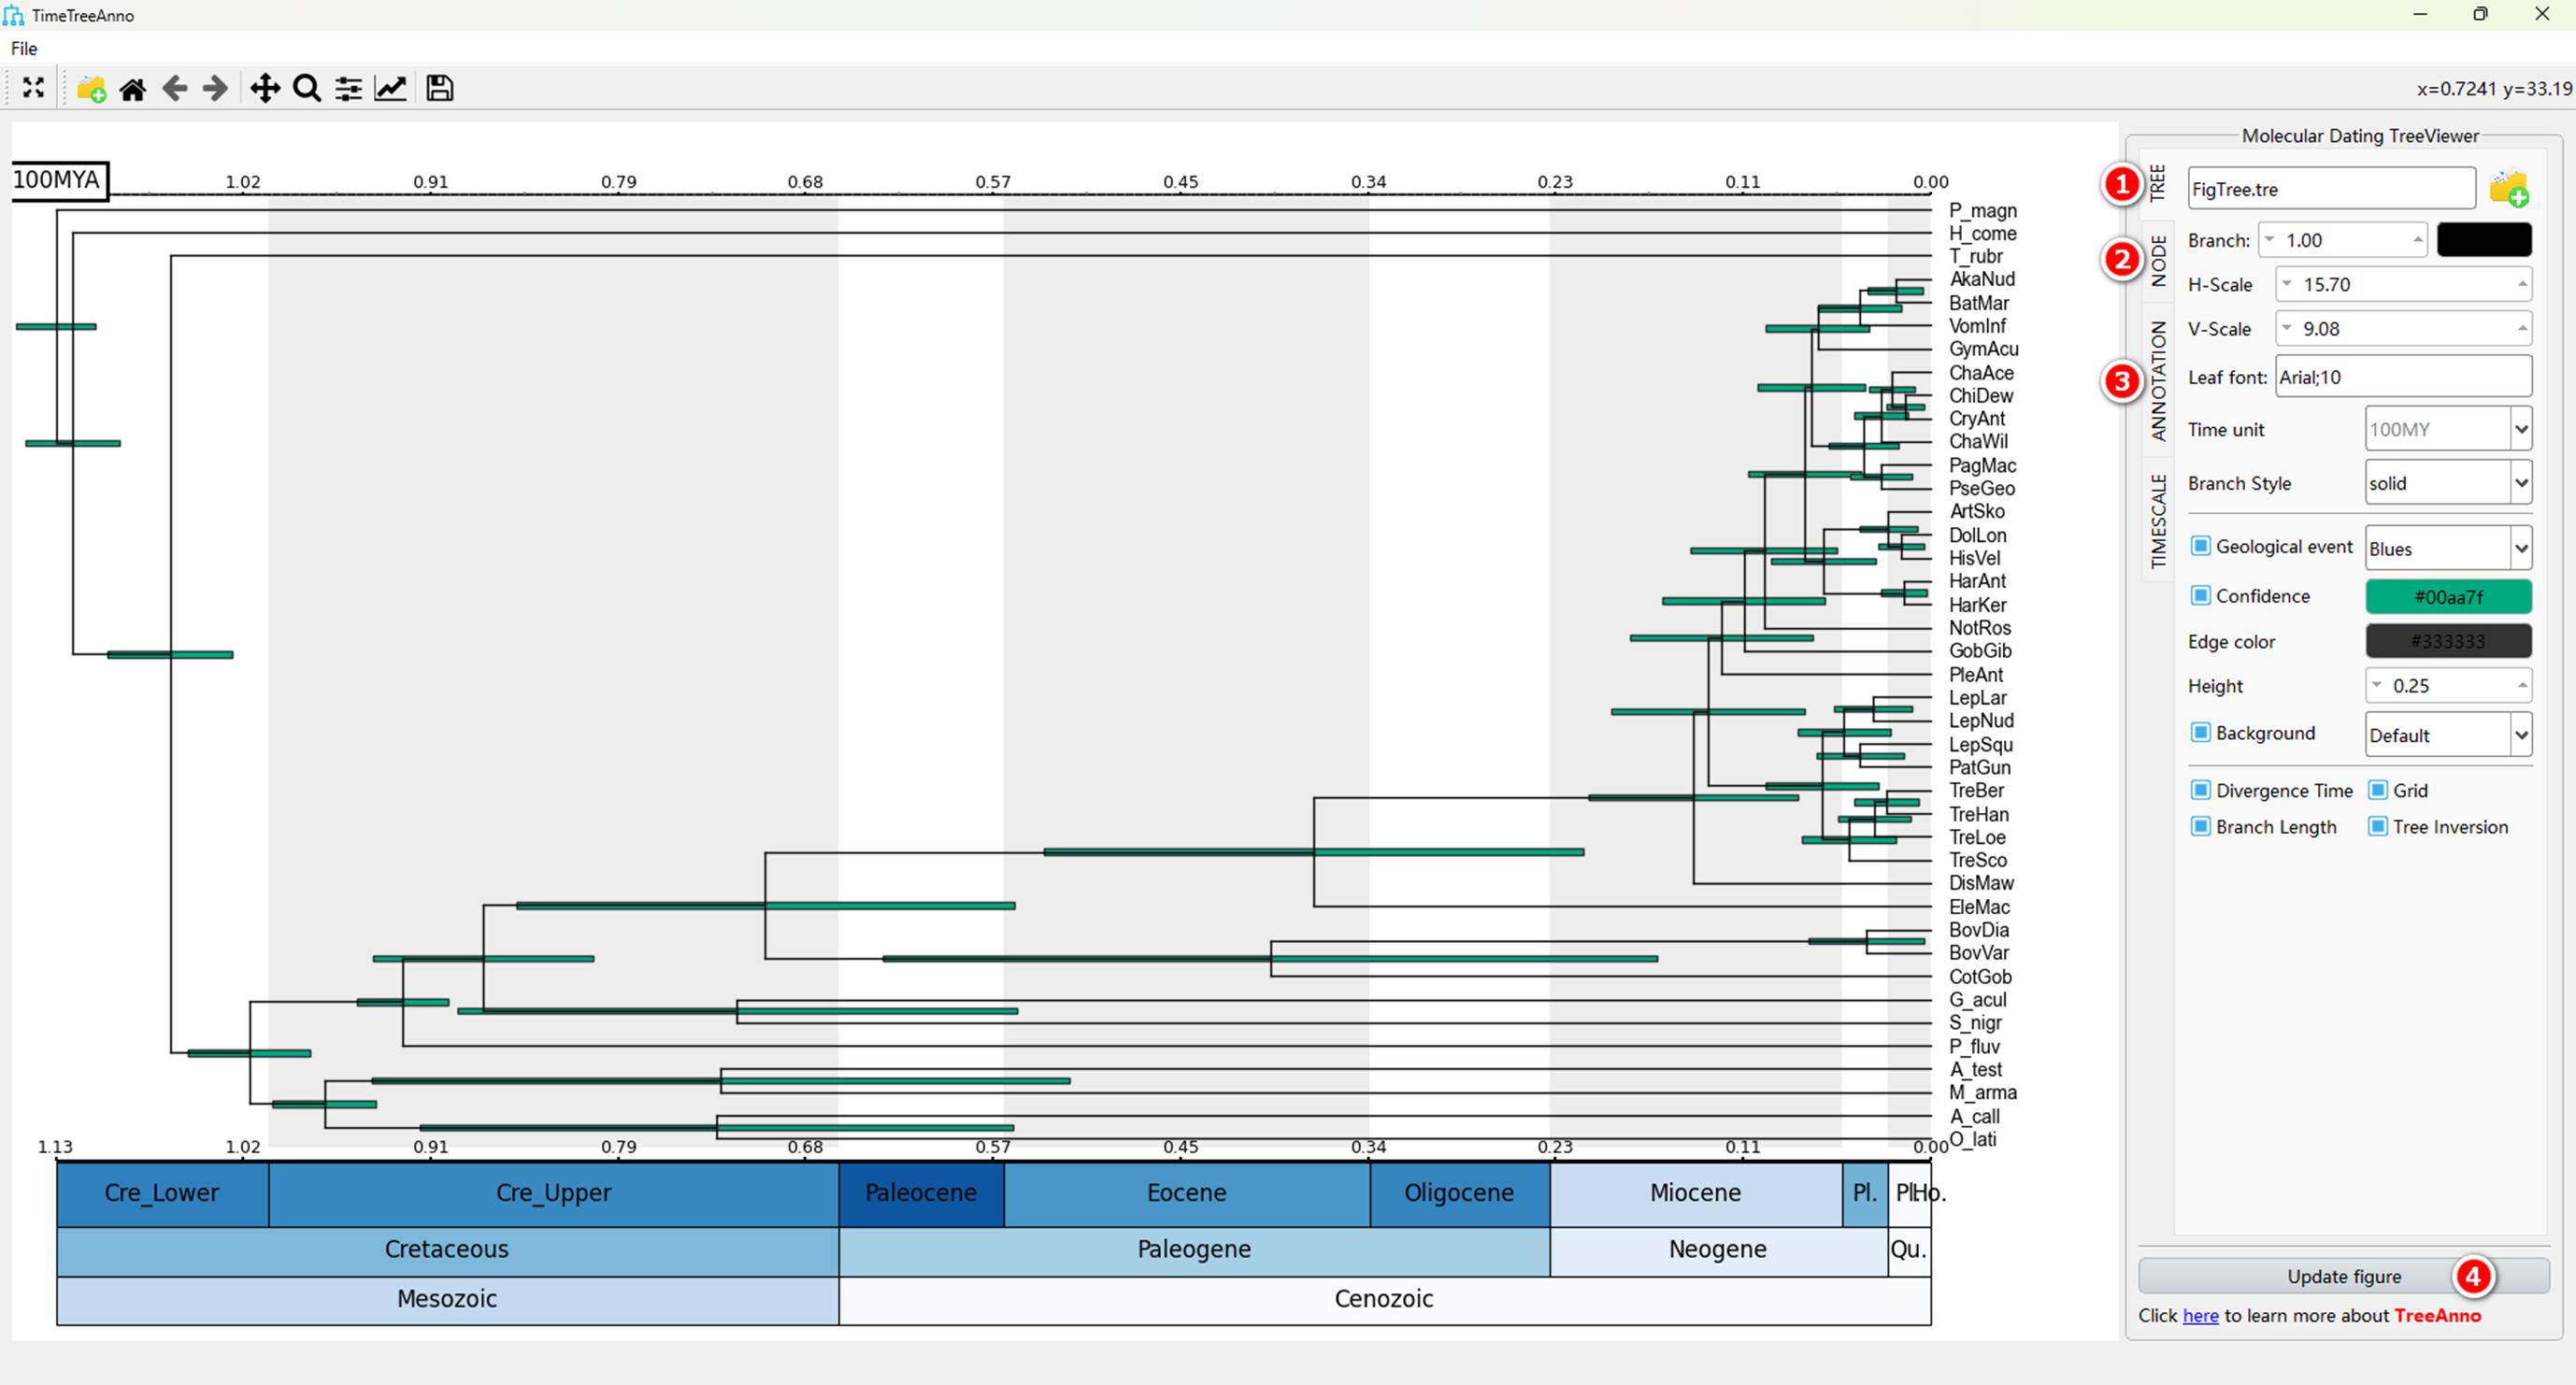
Figure 21. Example of an annotated timetree in TimeTreeAnno. Visualization of a timetree displaying geological time scales, node ages, and confidence intervals: (1) TREE tab for adjusting the tree layout and visual appearance; (2) NODE tab for displaying node information and supporting node name copying; (3) ANNOTATION tab for adding extra annotation elements, such as text labels and clade coloring.
2. Export figures
a. Users can select the Save as option from the dropdown list in the File menu, which opens the save settings window (Figure 22).
b. Alternatively, users can save the image directly using the dedicated save button.
c. Users can choose to save the image in various formats, including JPEG, PNG, SVG, and PDF.
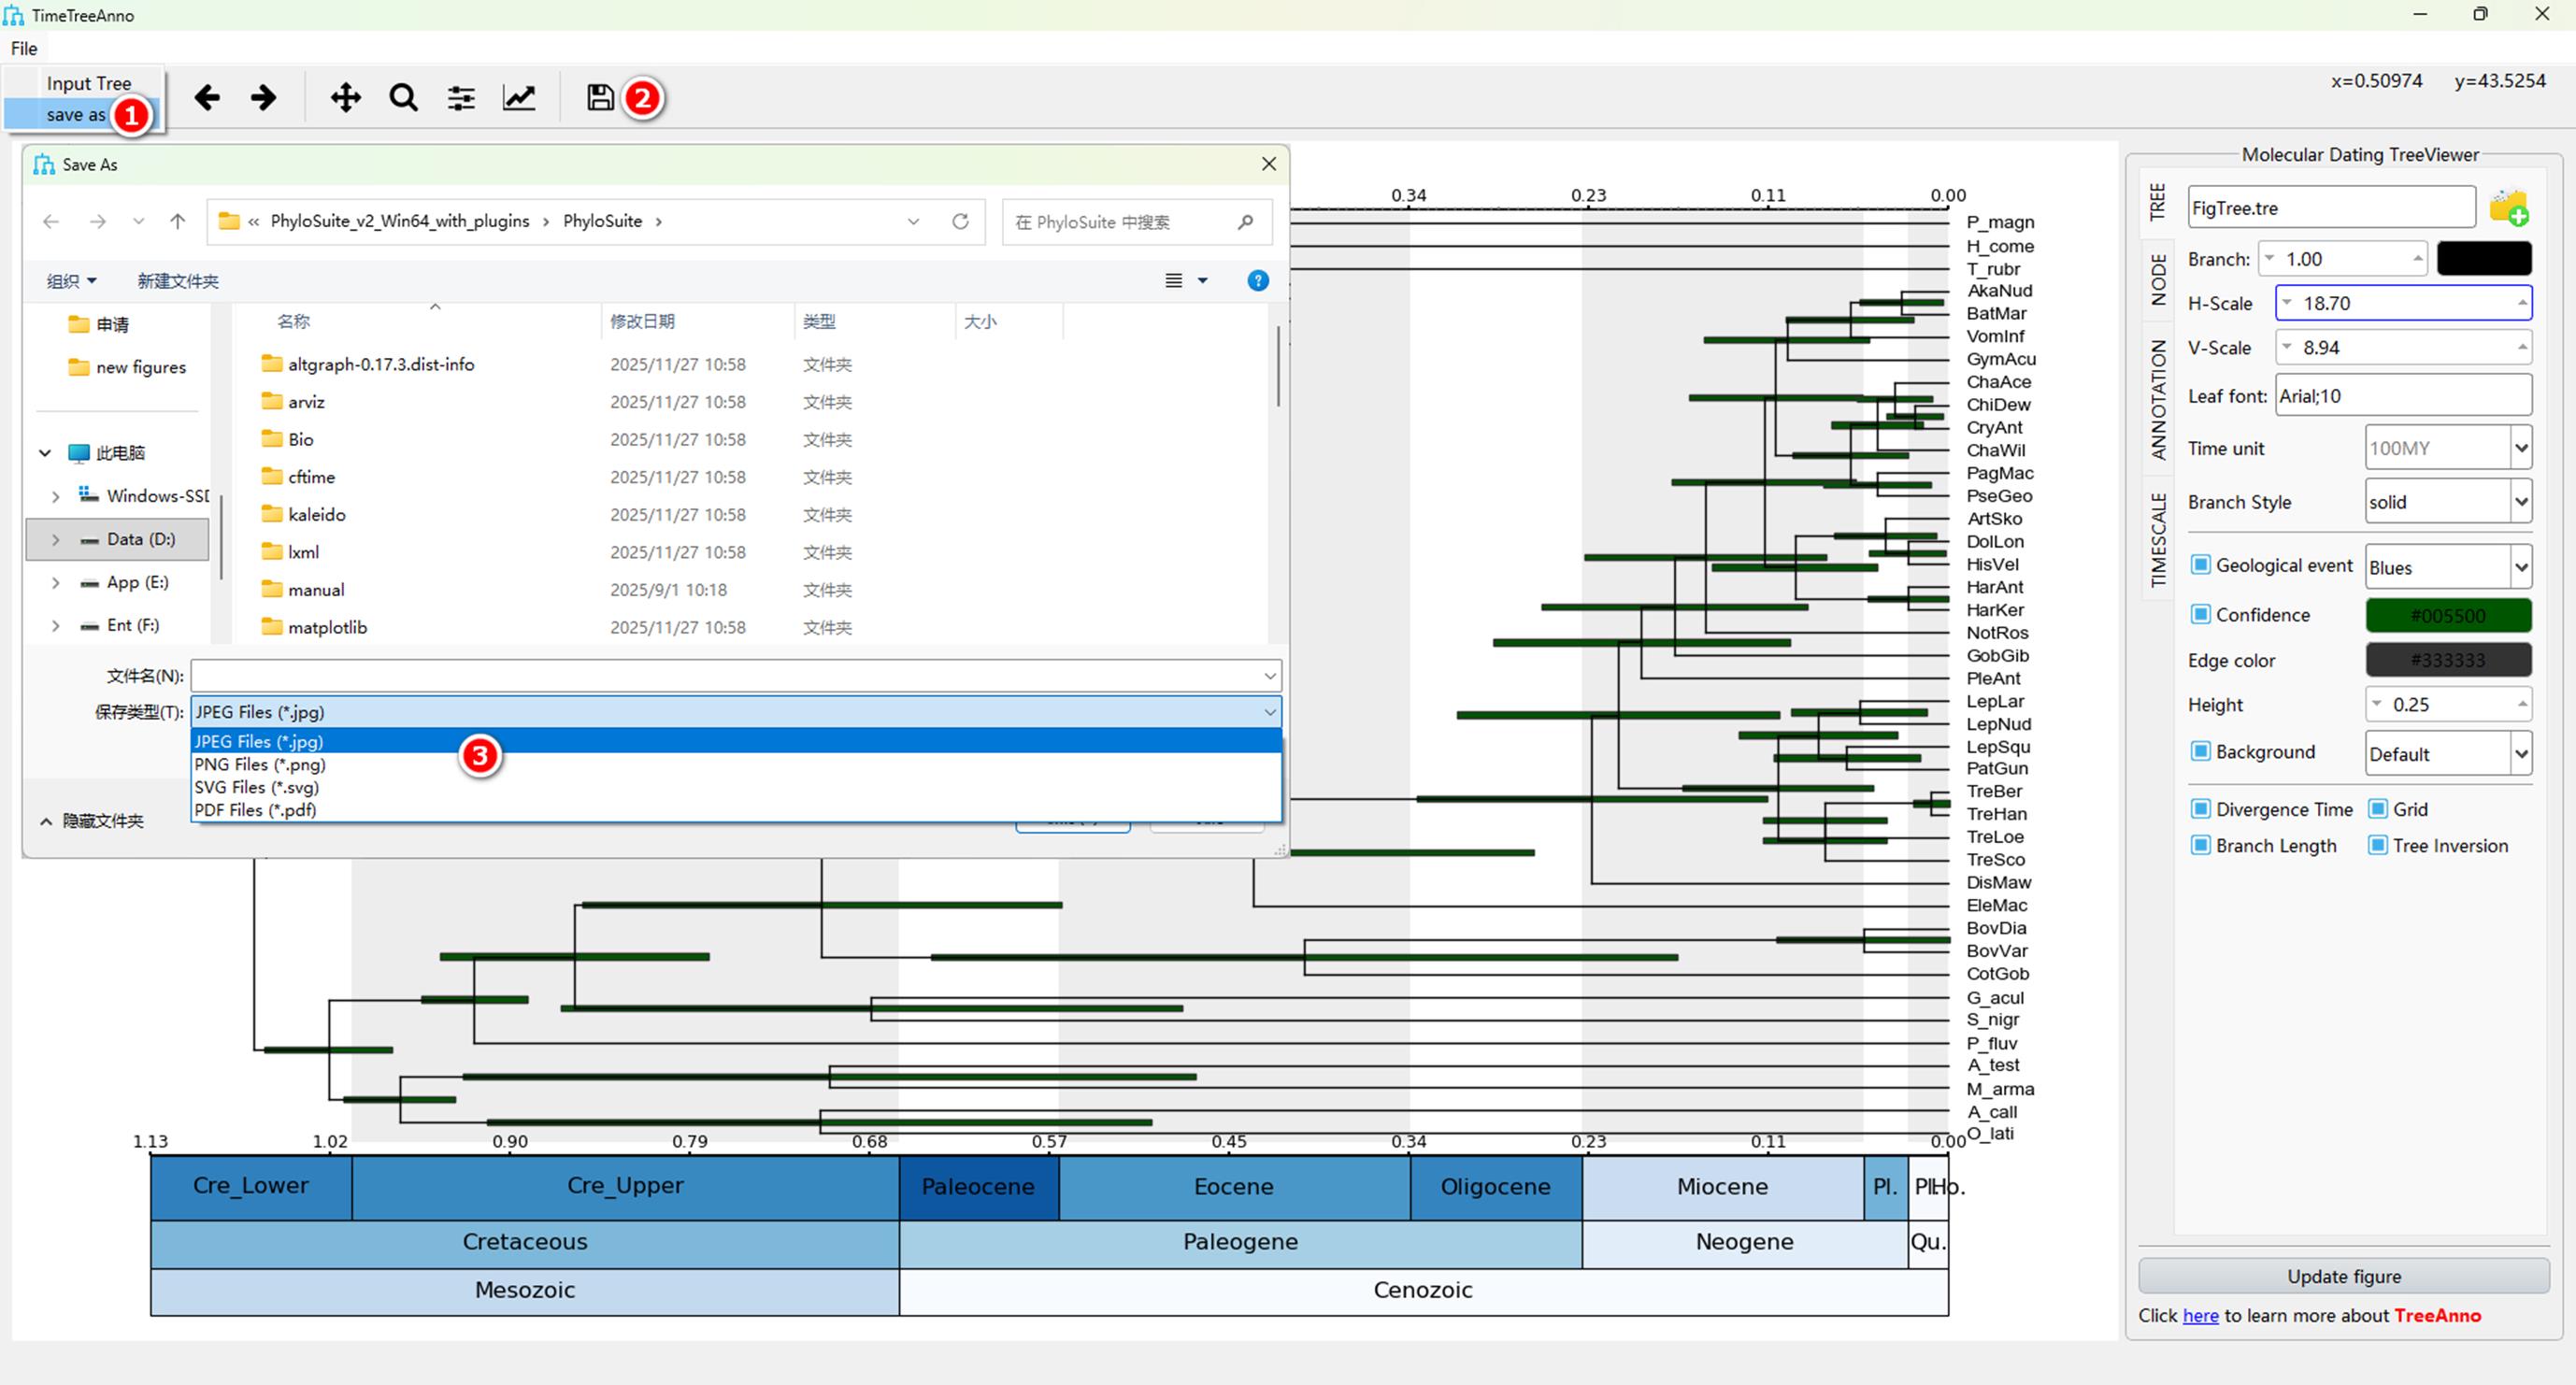
Figure 22. Export TimeTreeAnno figures. TimeTreeAnno provides multiple export options for generating publication-ready figure files: (1) option for exporting the current figure settings window; (b) button for exporting the current figure; (c) supported output formats, including JPEG, PNG, SVG, and PDF.
D. MDGUI-r8s
The basic operational workflow for file input in the r8s component is similar to that of the MCMCtree component, though there are slight differences in the format and saving of time calibration information.
1. File input
Like MDGUI-MCMCtree, the MDGUI-r8s plugin also supports three methods for file import (see Section A).
Tip: The appearance and functionality of MDGUI–r8s differ across operating systems (Windows, macOS, and Linux). On Windows, MDGUI invokes the Python-based pyr8s package (https://github.com/iTaxoTools/pyr8s), whereas on Linux and macOS it directly calls the native r8s program (which users must install and specify themselves). Consequently, r8s interface parameters may vary across systems. The parameter options available in Linux and macOS are richer and more granular (Figures 23 and 24). Therefore, strict cross-platform reproducibility should not be assumed, and analyses performed on Windows and on Linux/macOS should be regarded as platform-dependent implementations unless cross-platform consistency has been explicitly verified. The software automatically detects the user’s operating system and displays the corresponding parameter interface, requiring no manual switching by the user.
When describing an MDGUI–r8s analysis in a future Methods section, users are recommended to report the operating system, the backend used (pyr8s on Windows or native r8s on Linux/macOS), the program version, and any key non-default parameters, so that the computational setting is transparent and easier to reproduce.
a. Sequence alignment file (alignment): Upload the multiple sequence alignment file (supports FASTA, NEXUS, PHYLIP, etc.).
b. Tree File (Treefile): Upload a tree file containing phylogenetic relationships of species in the alignment file and branch lengths (“.nwk” format is recommended).
c. After importing the tree file, click the Add calibration points in tree button to open the visual management interface for fossil calibration information.
Users must ensure that the species names in both files are identical. The software will automatically verify name matching and display the count of recognized valid species on the interface. Upon successful import, users can use this count to preliminarily confirm that the files have been read correctly.
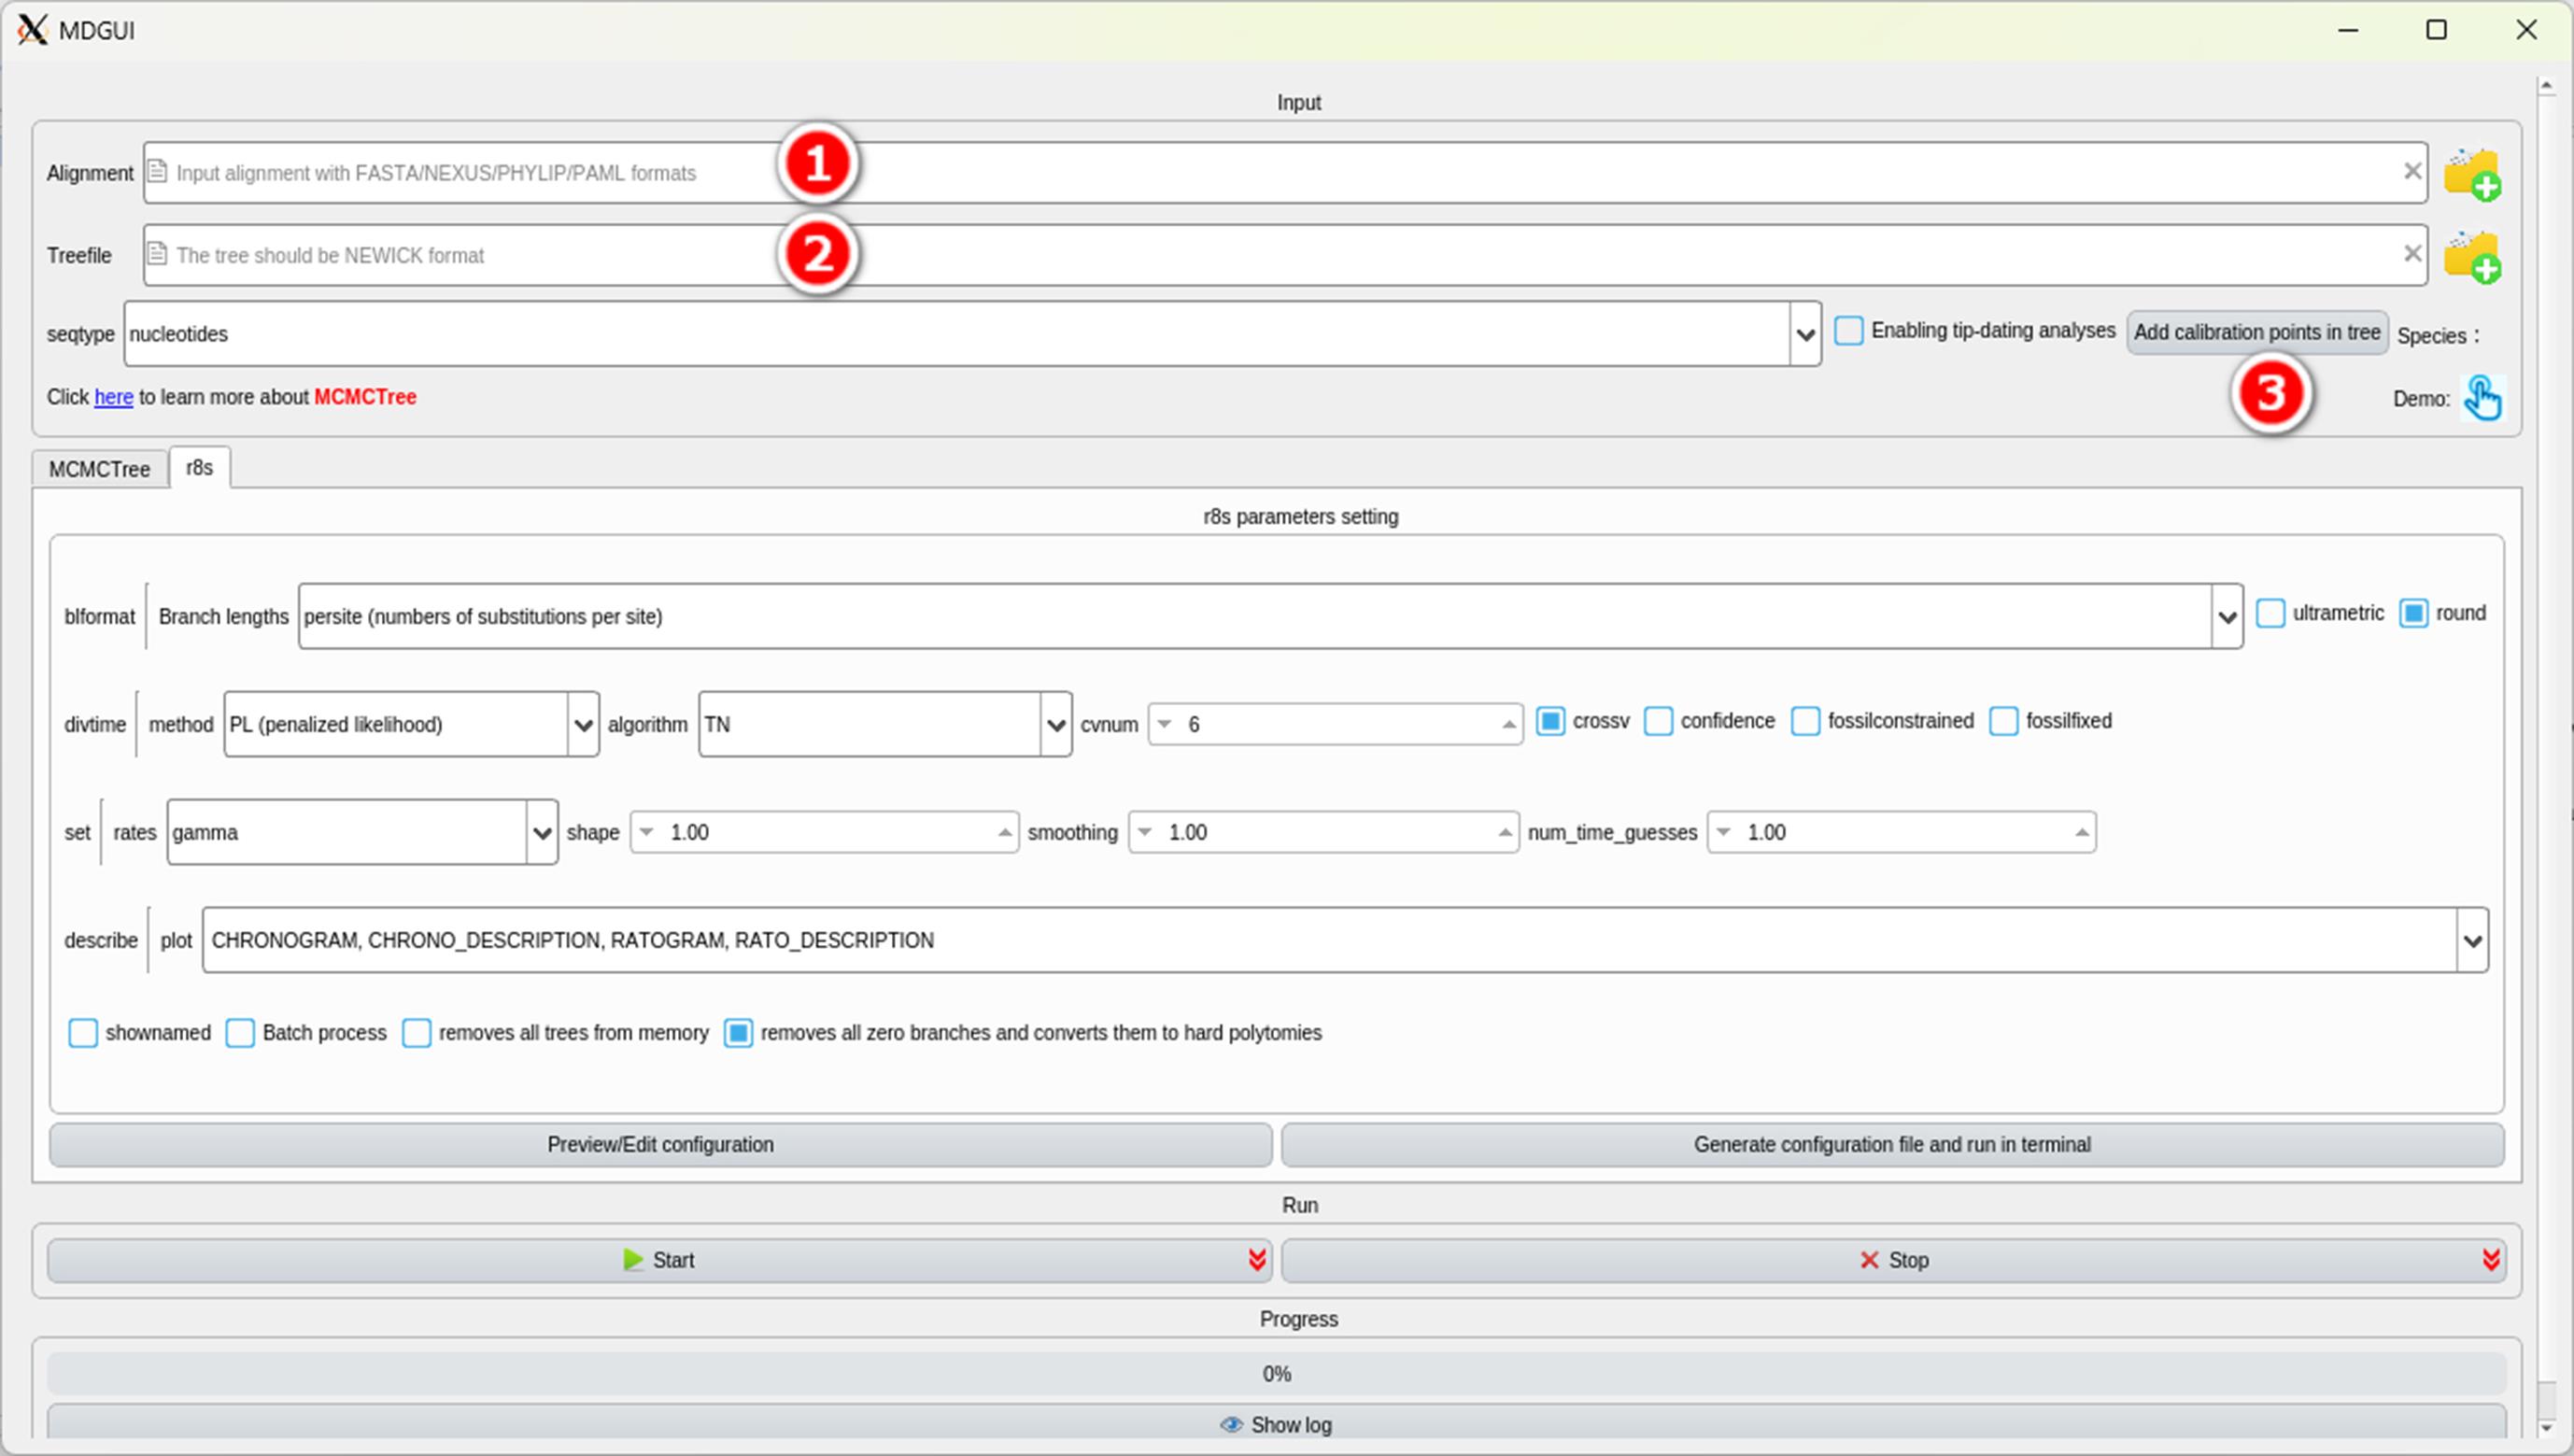
Figure 23. Main interface of MDGUI-r8s (Linux/macOS). Users can choose the MDGUI–r8s module to perform molecular dating analyses: (1) alignment file input box; (b) tree file input box; (c) button for opening the fossil calibration management interface.
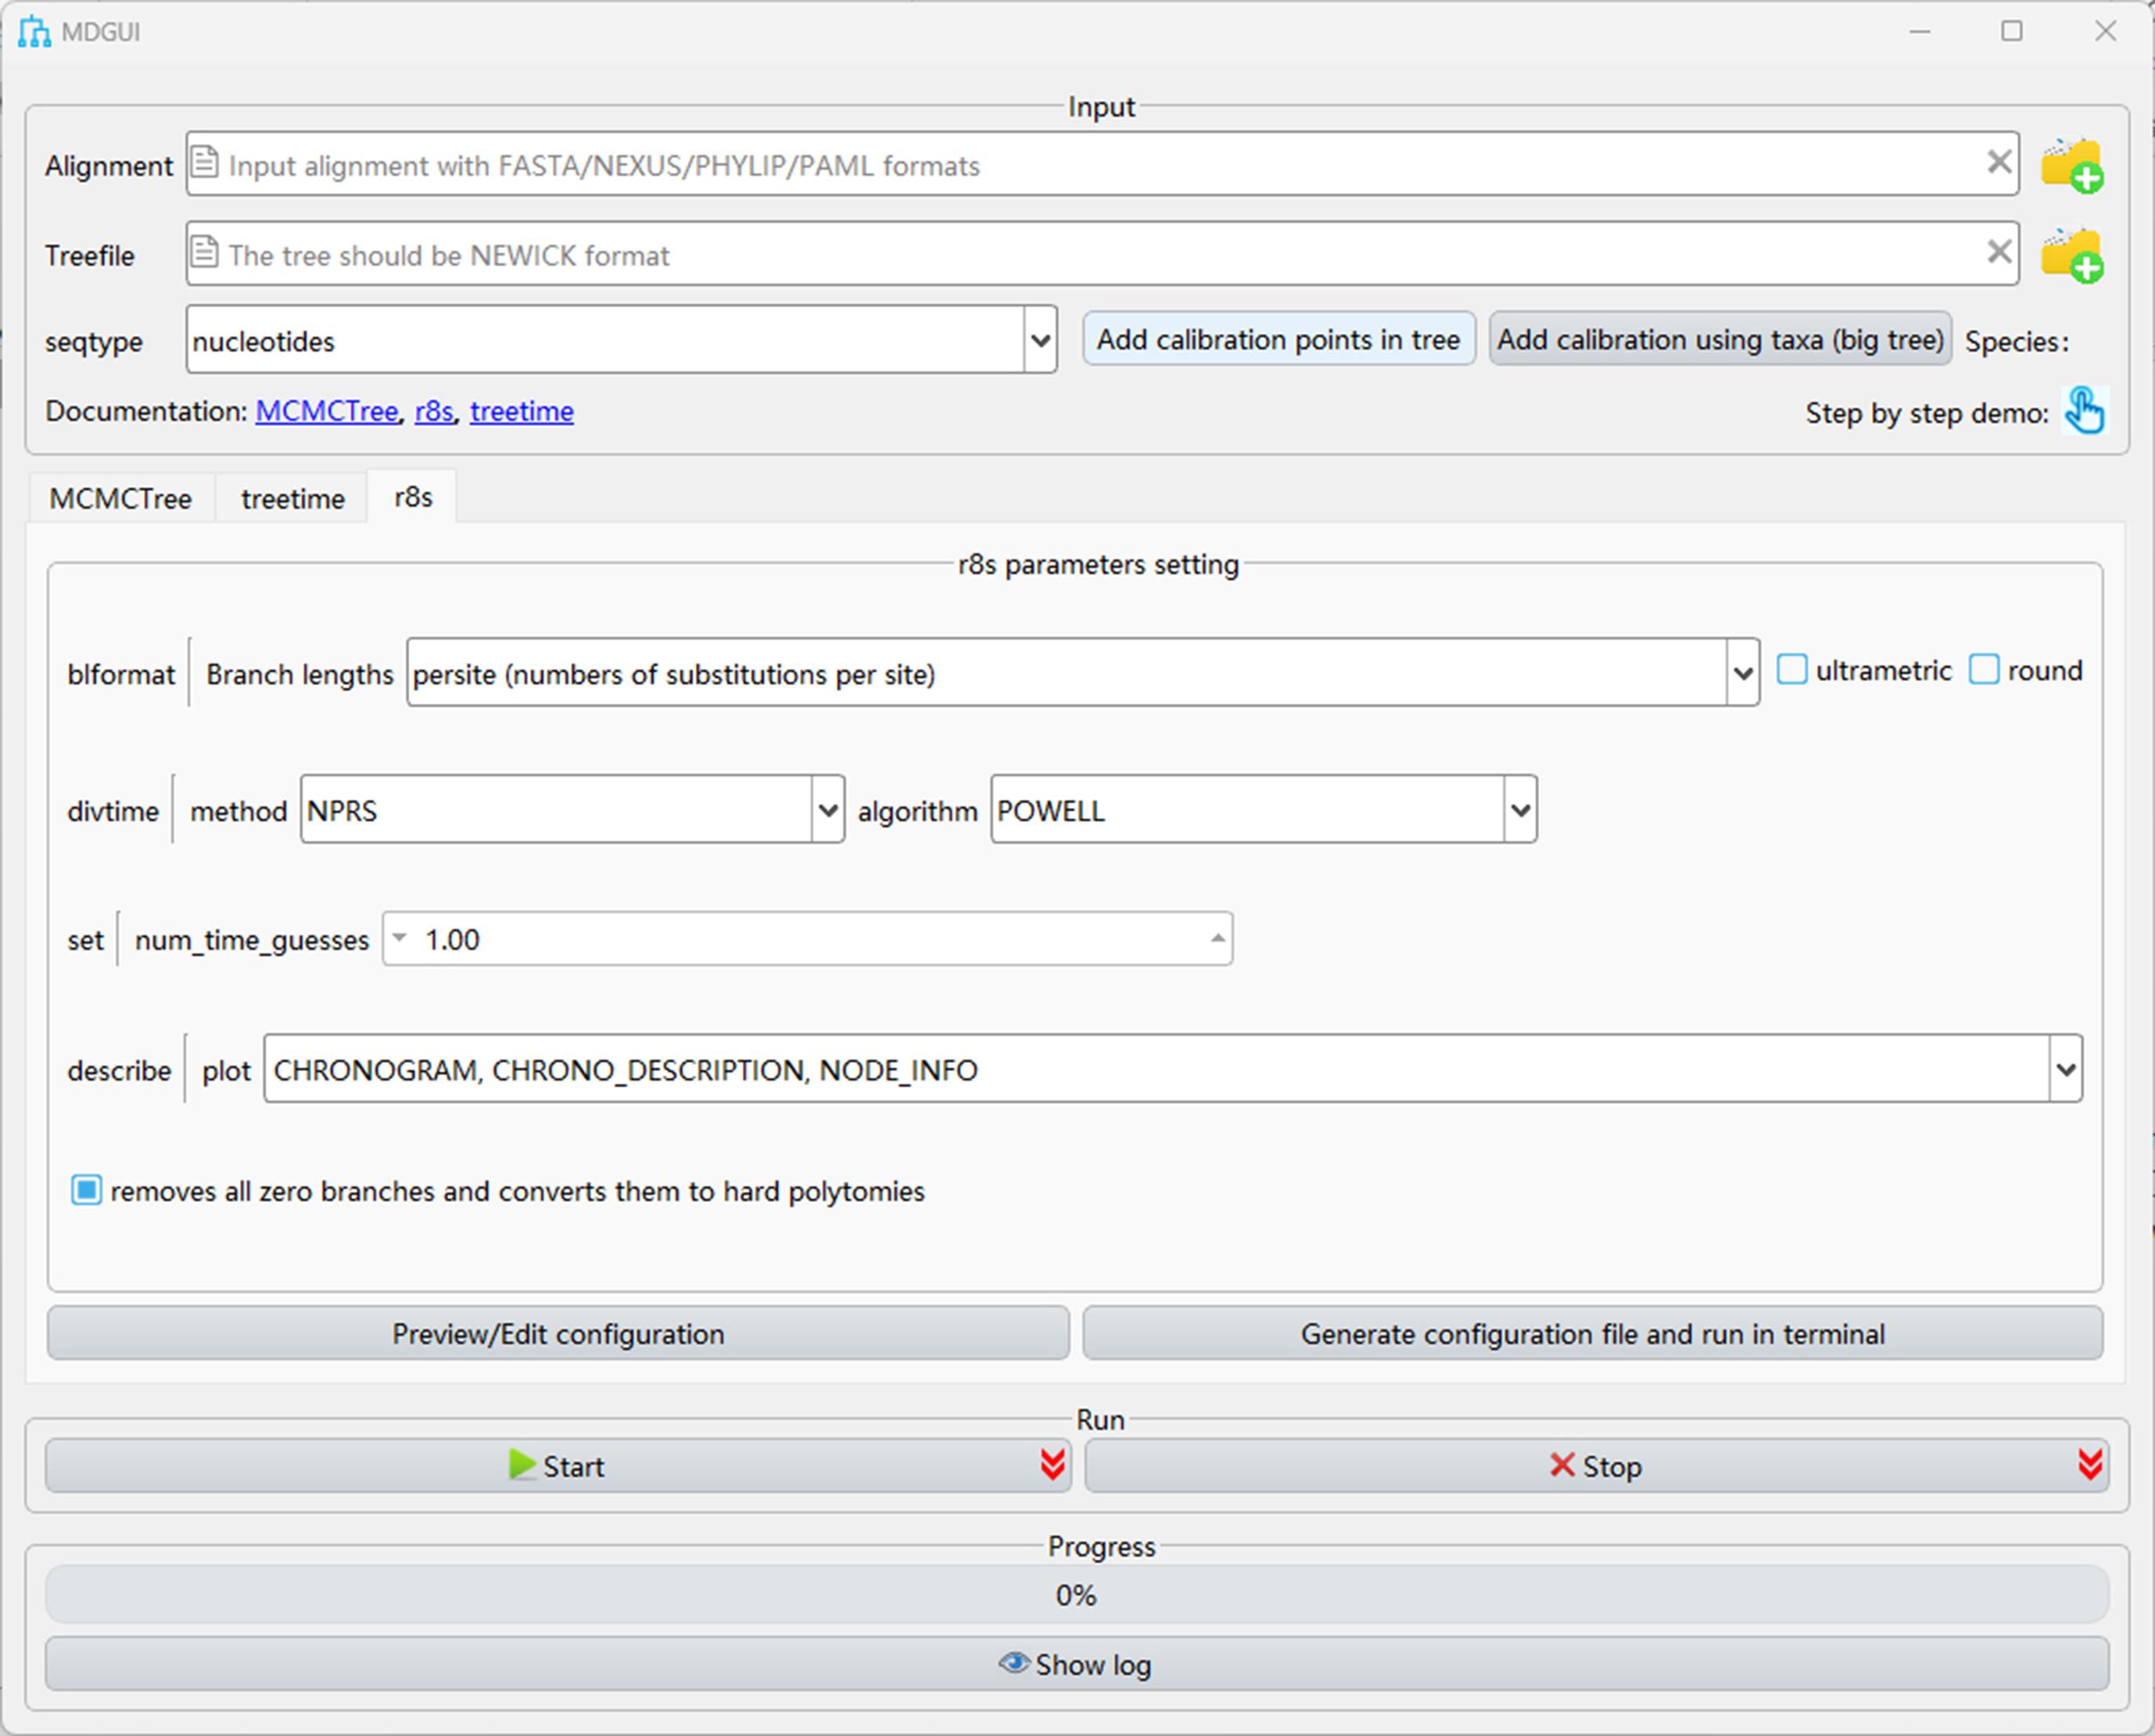
Figure 24. Main interface of MDGUI-r8s (Windows)
2. Adding fossil calibration points
a. When adding fossil calibration points for MDGUI–r8s, the procedure is the same as in Section A2. However, users need to switch the Calibration formats window to the r8s tab to select the appropriate r8s-specific calibration format (Figure 25).
b. The software provides all formats supported by the component itself. Users simply check the box next to the desired format, modify the numerical values, and finally click the OK button to complete the addition of calibration information.
In r8s software, four main commands are used to set prior constraints on node ages:
(1) Calibration: Provides soft calibration and defines a reasonable range for the node age; this is the most commonly used setting (the basic unit is 1 million years).
(2) Constraint: Enforces a hard calibration boundary, with the node age being forced to fall within a specified minimum and maximum interval.
(3) Fixage: Used only when a node’s age has extremely high confidence. It completely fixes the node age to a specific value, locking it for the estimation of other node ages on the tree.
(4) Unfixage node: Cancels the fixage constraint on a node, allowing its age to revert to a free variable to be re-estimated in subsequent analyses.
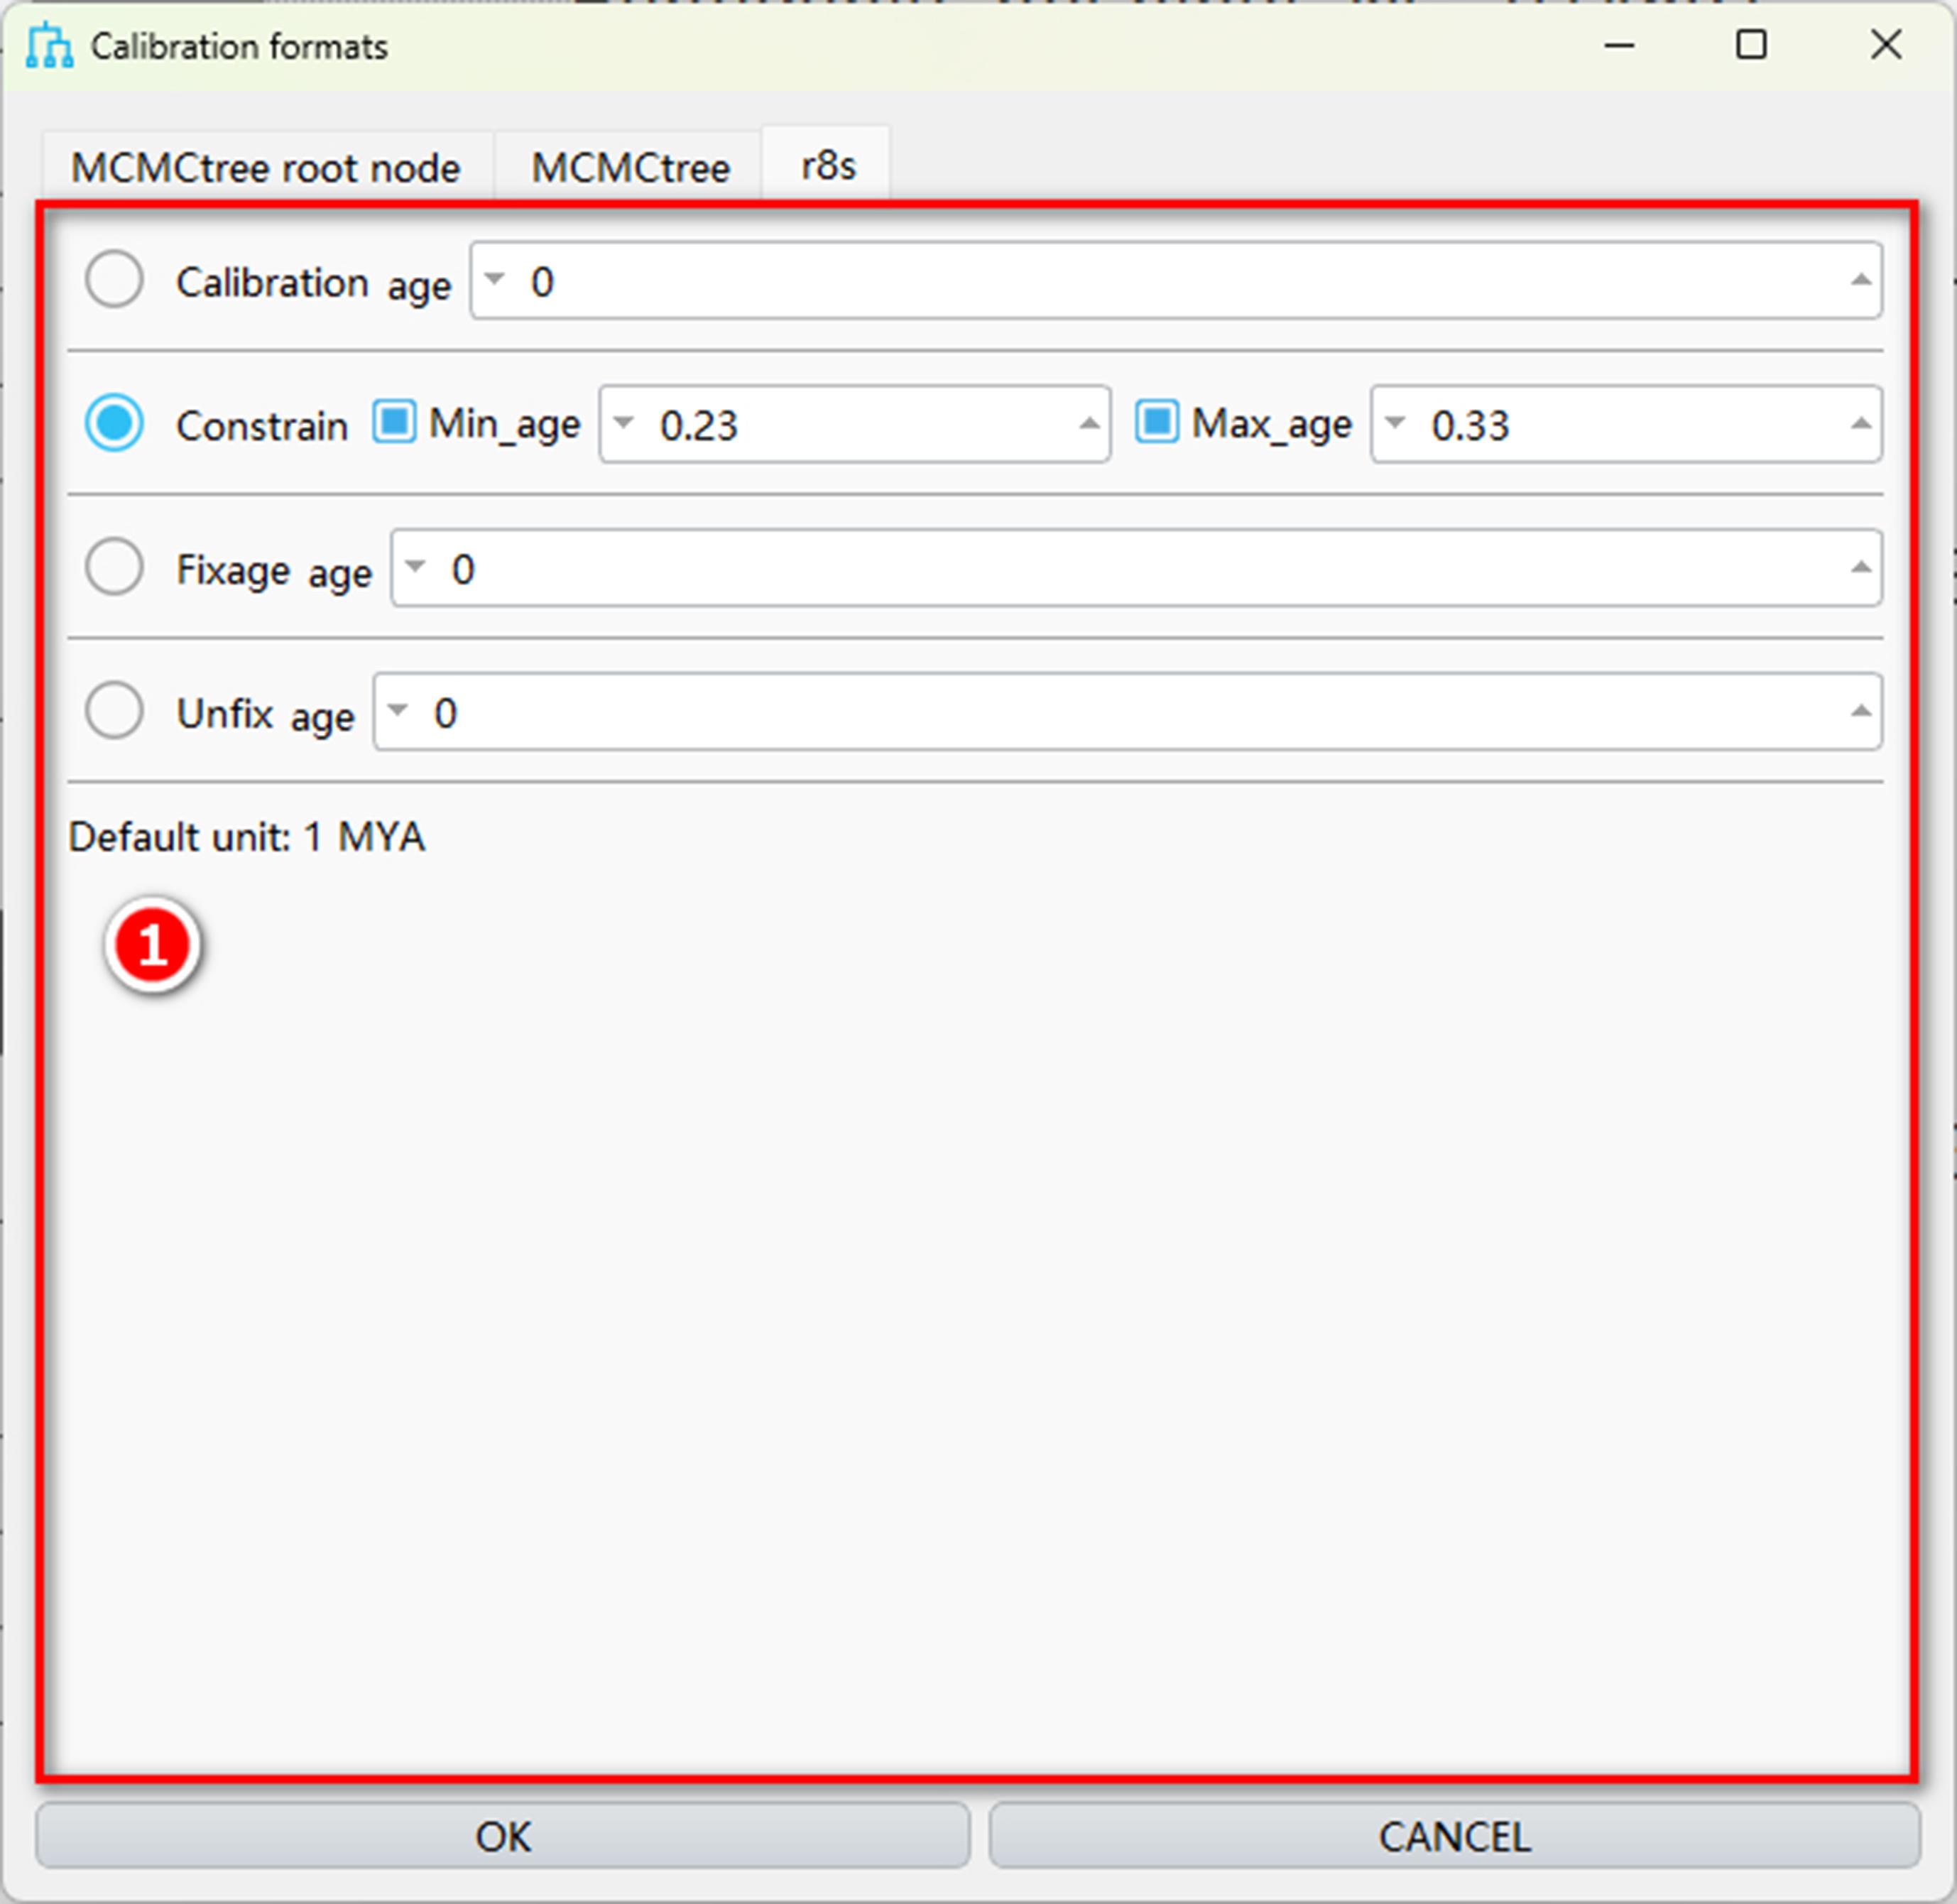
Figure 25. Setting r8s fossil calibrations. (1) Window for setting fossil calibrations in r8s, showing four supported calibration formats for r8s analysis.
3. MDGUI-r8s parameter settings
Once file preparation is complete, users can proceed to configure r8s analysis parameters.
a. Specify the output content (describe | plot): Check the results you wish the software to output here (Figure 26).
Checking “cladogram” will output the topology of the phylogenetic tree.
Checking “phylo_description” will output a tree where branch lengths represent the number of base substitutions.
Checking “node_info” will provide information on every node in the result.
Tip: To ensure the accuracy of parameter settings, it is recommended that users consult the official manual (https://image.sciencenet.cn/olddata/kexue.com.cn/upload/blog/file/2010/3/201032420201531842.0.pdf) to fully understand the specific meaning of each parameter before running the analysis.

Figure 26. MDGUI-r8s Describe settings. (1) available Describe setting options, where different selections may result in distinct output files in the final results directory.
b. Preview/edit configuration: If users wish to manually modify parameters, they can click the Preview/Edit configuration button (Figure 27). The pop-up window displays the text content of the final r8s execution file (r8s_cmd_data.txt), generated based on all current interface settings. Users can review the content here or edit/add parameters in text format. Once confirmed, clicking the SAVE AND RUN button within the window will execute r8s using the updated parameters.
c. Generate a configuration file and run in terminal: This function enables users to save an r8s run configuration file generated via the interface settings, which can then be used to run r8s in a terminal window.
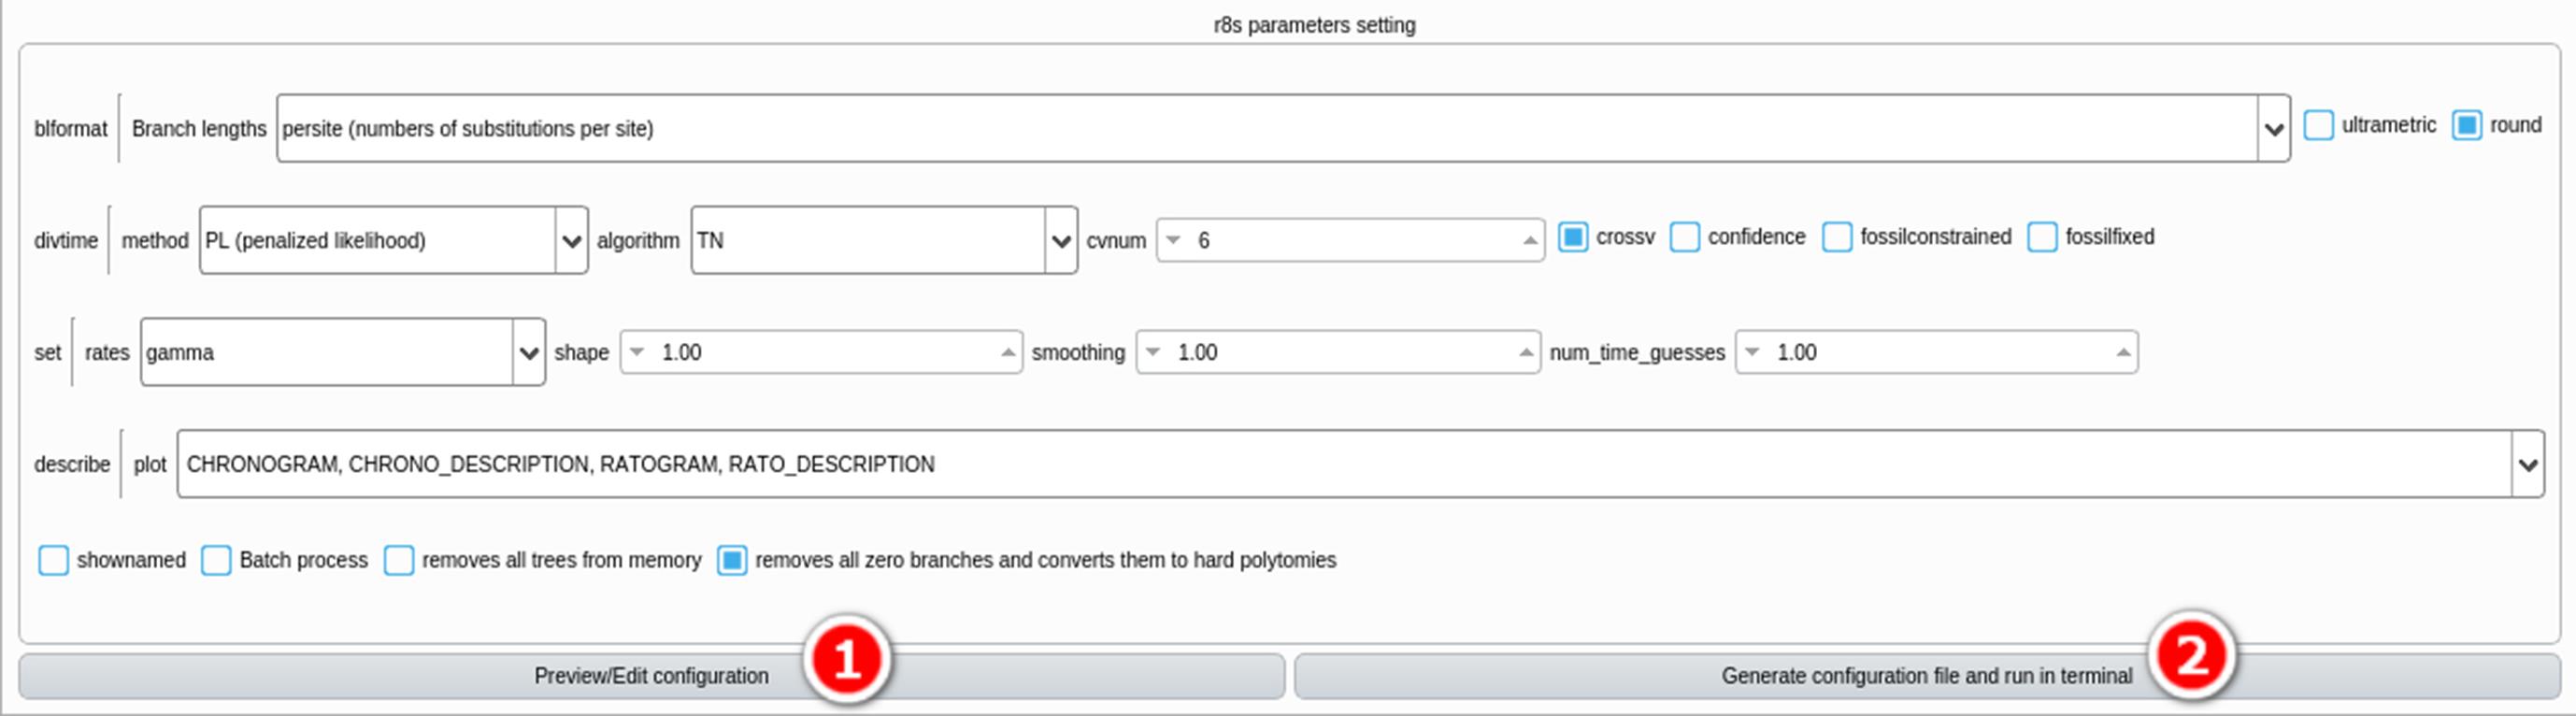
Figure 27. MDGUI-r8s parameter settings. Users can preview and verify parameter settings before executing the r8s analysis: (1) button for previewing or editing the final r8s configuration file; (2) button for generating a configuration file.
4. Results and output
a. Folder naming
i. As for the MCMCtree, the r8s result folder name defaults to the specific start time of the analysis (e.g., 2025_10_10–11_18_43). If users manually modify the output name prior to clicking the Start button, the folder will be assigned the user-defined name (Figure 28).

Figure 28. Rename the r8s result folder. (1) The output folder name setting, allowing users to rename the result folder of the r8s analysis.
b. Folder contents
i. The software will generate corresponding timetree result files based on the user’s selections in the “describe | plot” parameter section (Figure 29). Different settings yield different output files; for example, selecting “cladogram” generates a nwk tree containing only topology, while selecting “chronogram” generates a nwk tree where branch lengths represent time (refer to the official manual “https://image.sciencenet.cn/olddata/kexue.com.cn/upload/blog/file/2010/3/201032420201531842.0.pdf” for details).
ii. The “r8s_cmd_data.txt” file records the complete execution instructions and topology information used for the r8s analysis; this file can also be used to run the analysis in a terminal window.
iii. If “ratogram” is selected in the “describe | plot” options, a rate tree file named “ratogram.nwk”, containing evolutionary rate information for each branch, will be generated.
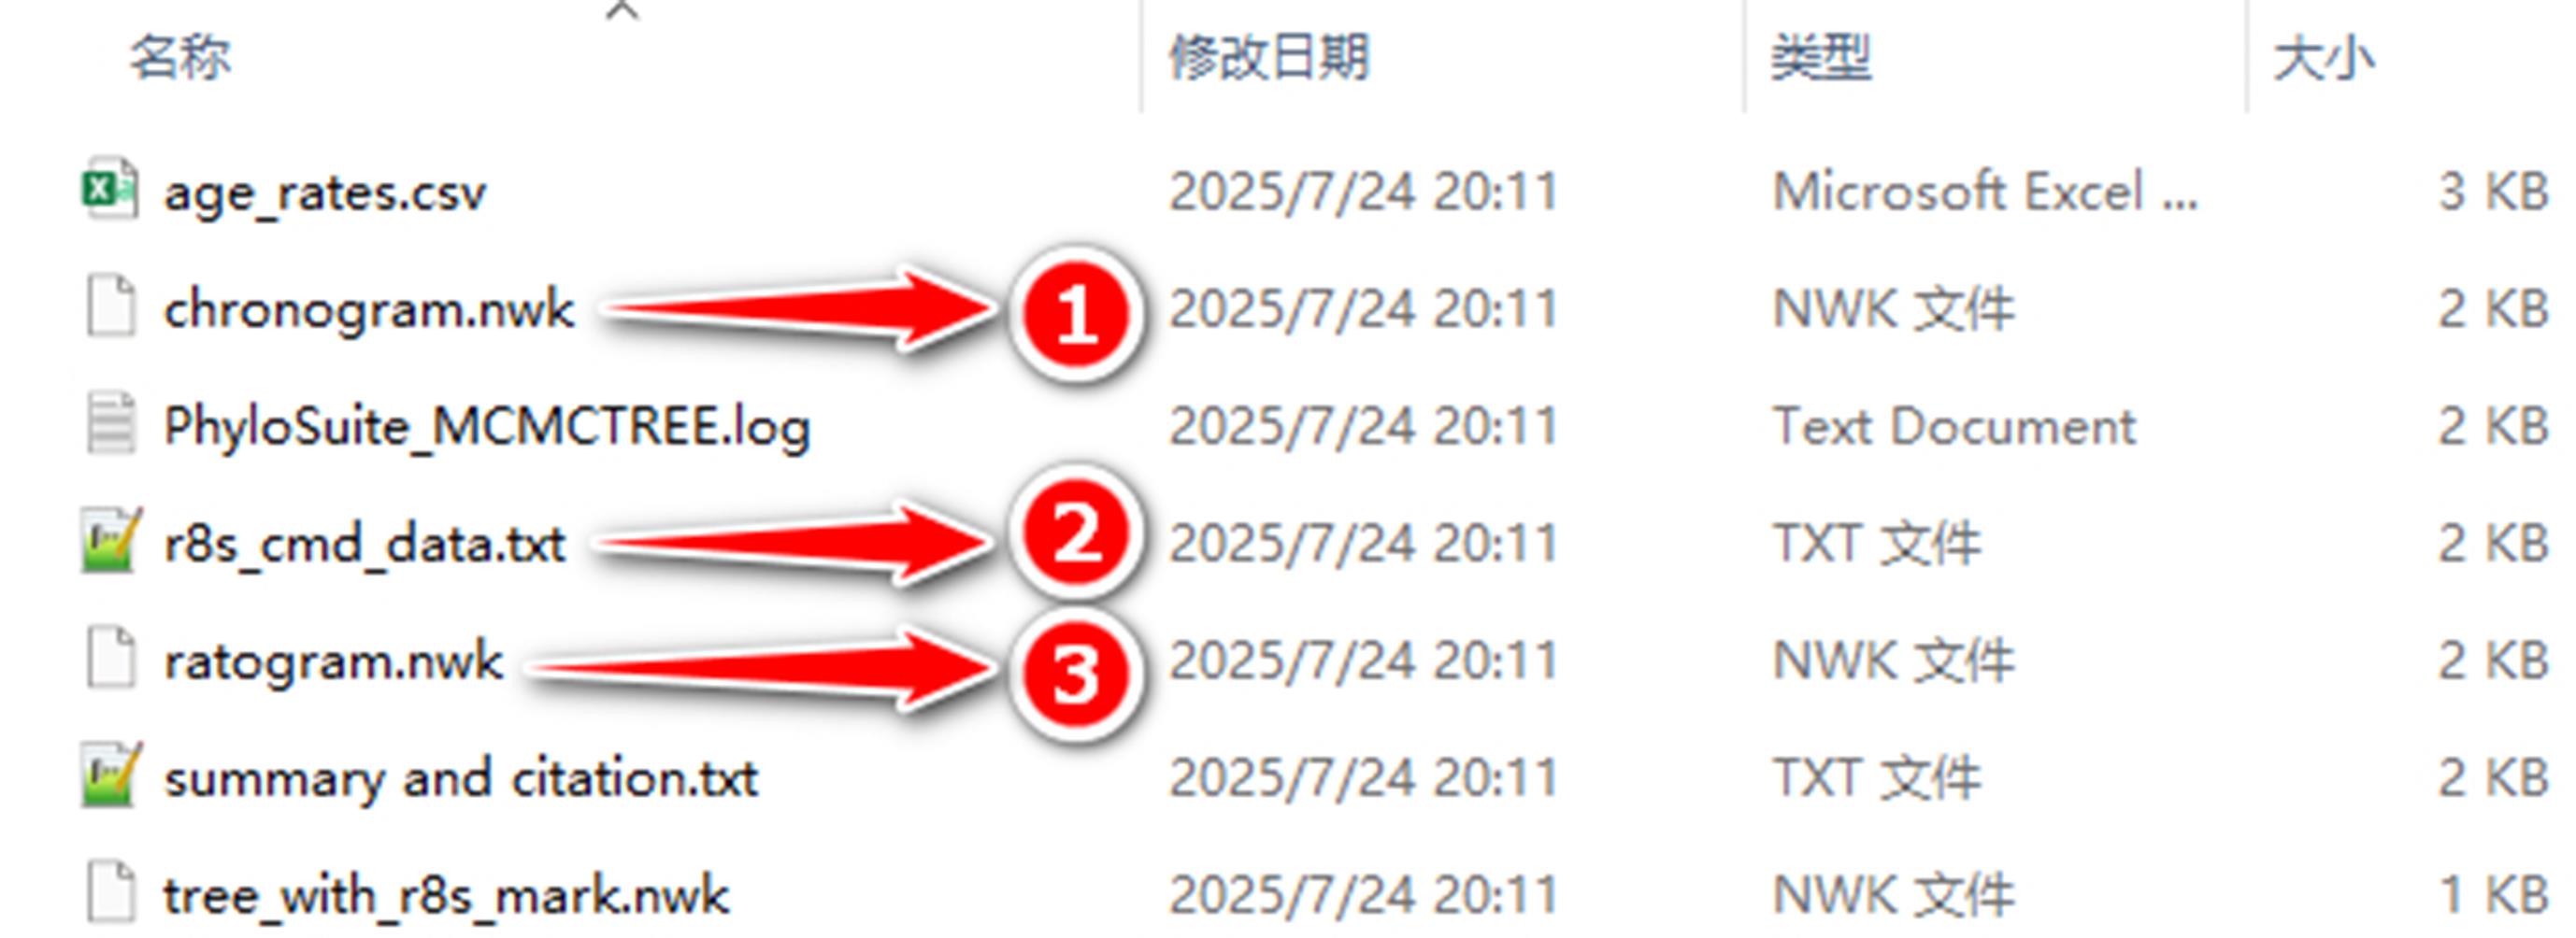
Figure 29. r8s result folder. Output folder contents generated after running r8s through MDGUI: (1) tree output file generated according to the selected Describe option; (2) “r8s_cmd_data.txt” file containing the complete execution instructions and topology information used for the r8s analysis; (3) “ratogram.nwk” file containing branch-specific evolutionary rate information.
Result interpretation
To evaluate whether a molecular dating analysis has performed satisfactorily, we recommend examining the results jointly in both MCMCTracer and TimeTreeAnno. MCMCTracer is mainly used to assess convergence and sampling adequacy, whereas TimeTreeAnno helps users evaluate whether the inferred dated tree is numerically reasonable and biologically interpretable. A reliable analysis should show acceptable convergence and effective sampling in MCMCTracer, together with a dated tree in TimeTreeAnno whose node age estimates and credibility intervals are broadly consistent with the selected calibrations and timescale. Good convergence and ESS are necessary, but they do not by themselves guarantee that the inferred dating results are correct; calibration settings, model assumptions, and time scaling should also be checked.
Interpreting MCMCTracer results
In the scatterplot comparing repeated runs, points from well-converged runs should cluster closely around the x = y diagonal. Tight clustering near the diagonal indicates better agreement between runs and, therefore, better convergence, whereas a widely scattered pattern suggests poorer convergence across runs (Figure 19).
The effective sample size (ESS) should also be examined. In practice, ESS values greater than 200 are generally considered good, whereas lower ESS values indicate insufficient effective sampling. In MCMCTracer, ESS values below the recommended threshold are highlighted in a different color, allowing users to identify potentially problematic parameters more easily. If many parameters show low ESS values, the run may need to be extended, or the sampling-related settings may need to be adjusted.
Trace plots and related summaries should also be inspected. Parameters should typically fluctuate around a stable level without obvious abrupt shifts. If serious convergence problems are observed, users should first check the input data and parameter settings and then consider increasing the chain length or adjusting other sampling-related settings to further assess convergence.
Interpreting TimeTreeAnno results
In the annotated time tree, users should examine whether node age estimates and their credibility intervals are overall plausible. Extremely wide intervals may indicate substantial uncertainty in the data, calibrations, or model settings, and may also suggest inadequate convergence or effective sampling.
Users should also check whether the inferred dates are broadly consistent with the fossil calibration scheme and the geological timescale used in the analysis. The overall temporal pattern should agree with the calibration logic and timescale. If the inferred dates show clear inconsistencies, users should re-check the calibration settings, parameter configuration, and especially the time-unit scaling, since inconsistent time units can easily produce apparently unreasonable dating results.
Validation of protocol
To validate the reproducibility and stability of the proposed workflow, we performed multiple independent molecular dating analyses using the same nuclear genome dataset under identical parameter settings. All runs were conducted with the same total number of MCMC generations, sampling frequency, burn-in proportion, substitution models, clock models, and fossil calibration configurations. The validation data shown in Figure 30 were generated on Windows. The detailed parameter settings used for these validation analyses are shown in Figure 31. Across repeated runs, divergence-time estimates of the same internal nodes were similar across independent runs conducted under identical settings, indicating stable and reproducible inference within the tested computing environment (Figure 30).
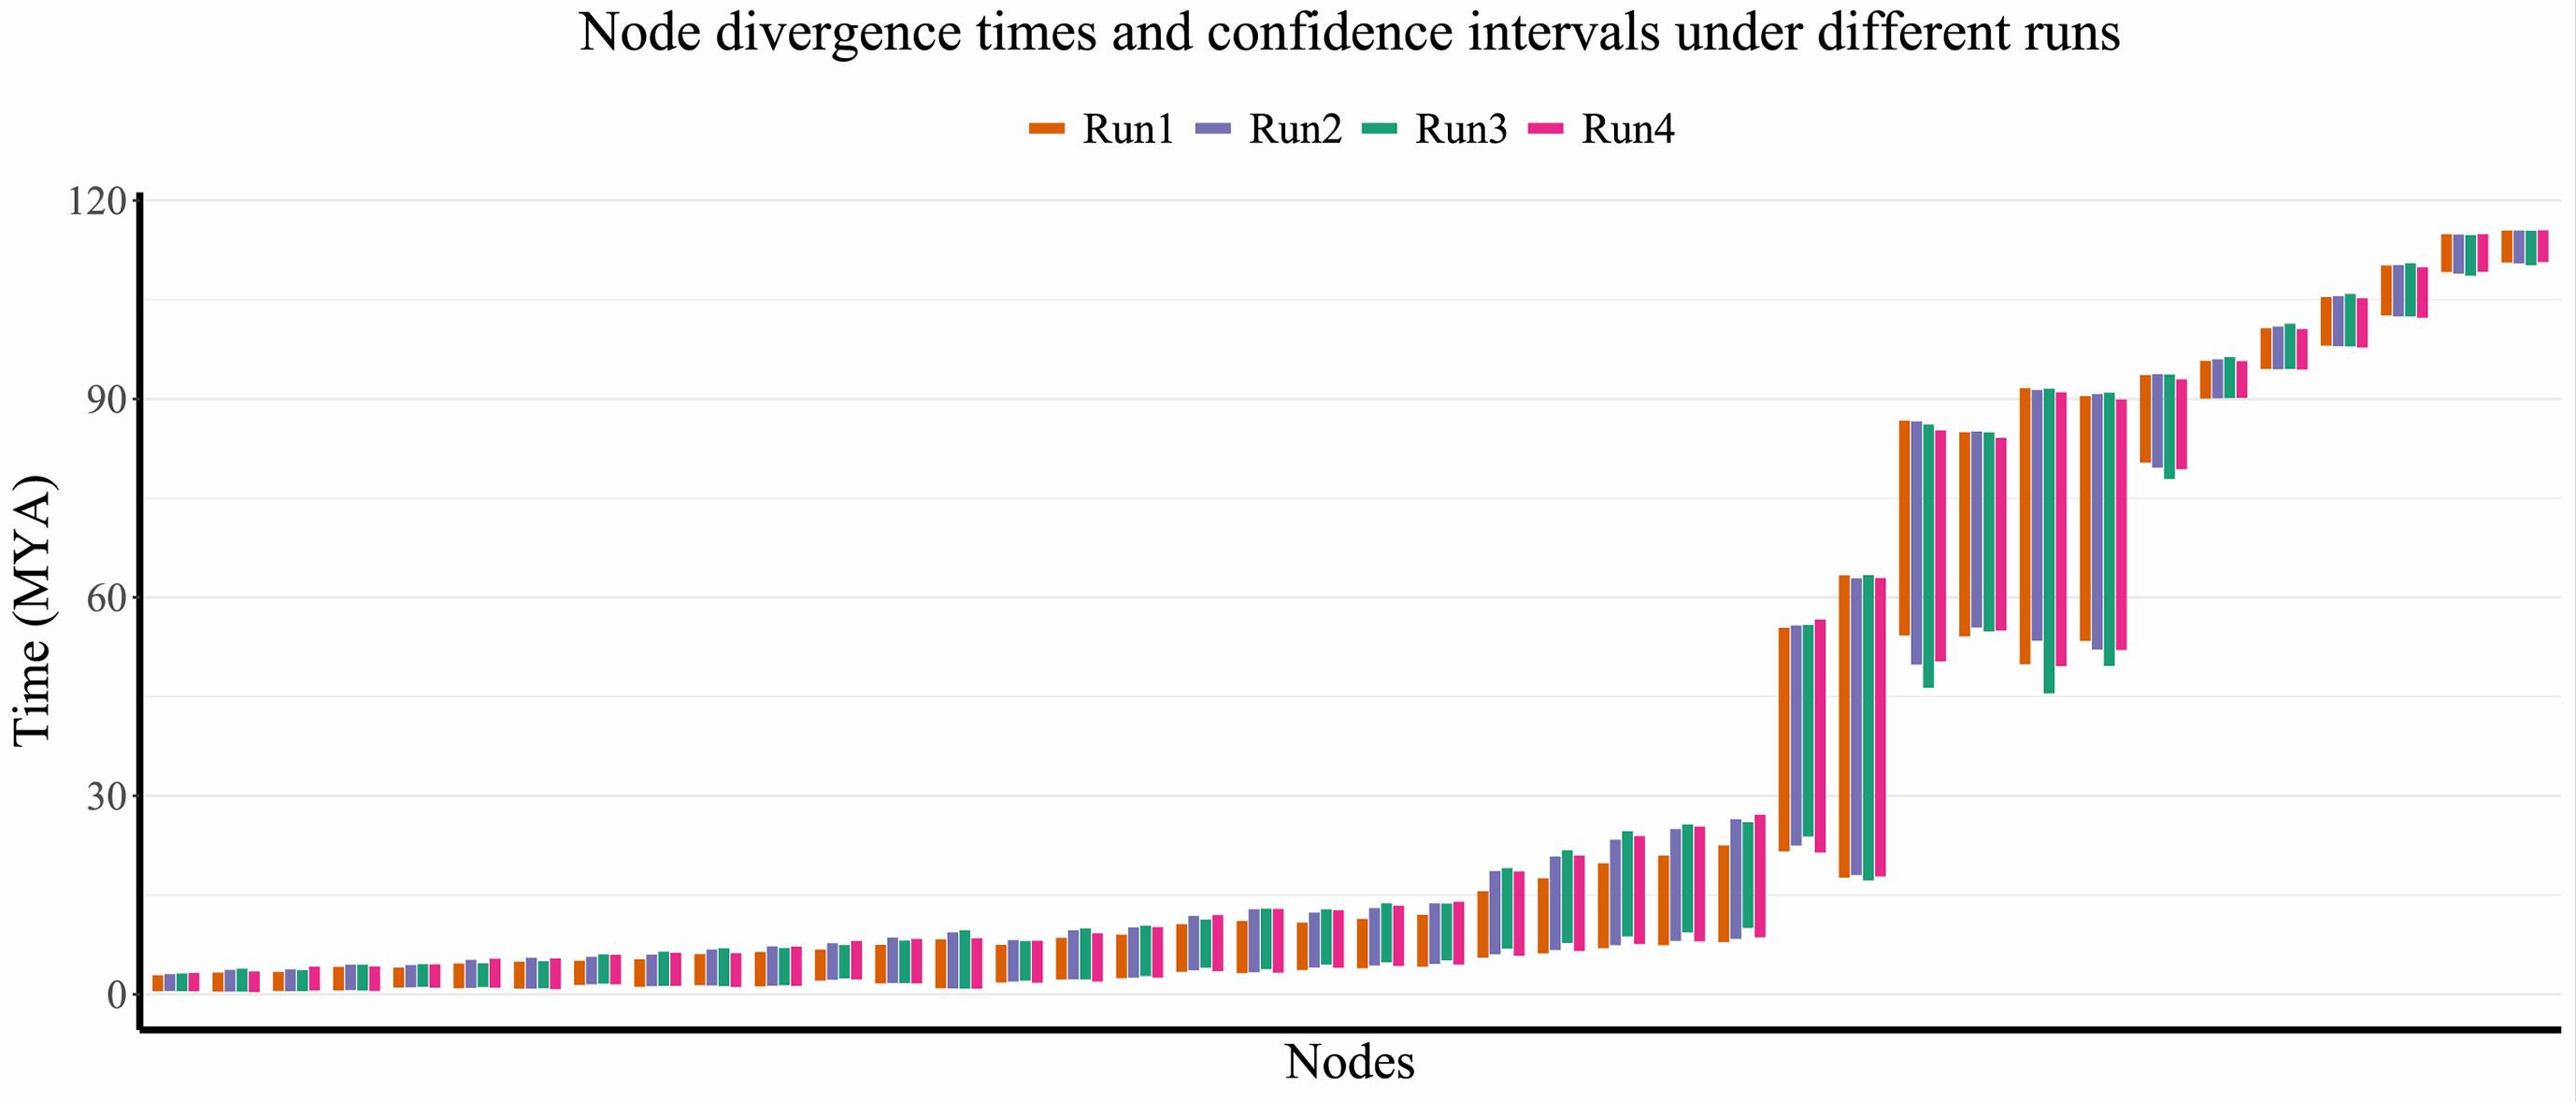
Figure 30. Reproducibility of divergence-time estimates across independent runs. Bar plots summarize divergence-time and confidence interval for the nodes obtained from multiple independent runs conducted using the same dataset and identical parameter configurations. The similarity of node age estimates across runs demonstrates stable and reproducible inference under fixed analytical settings.
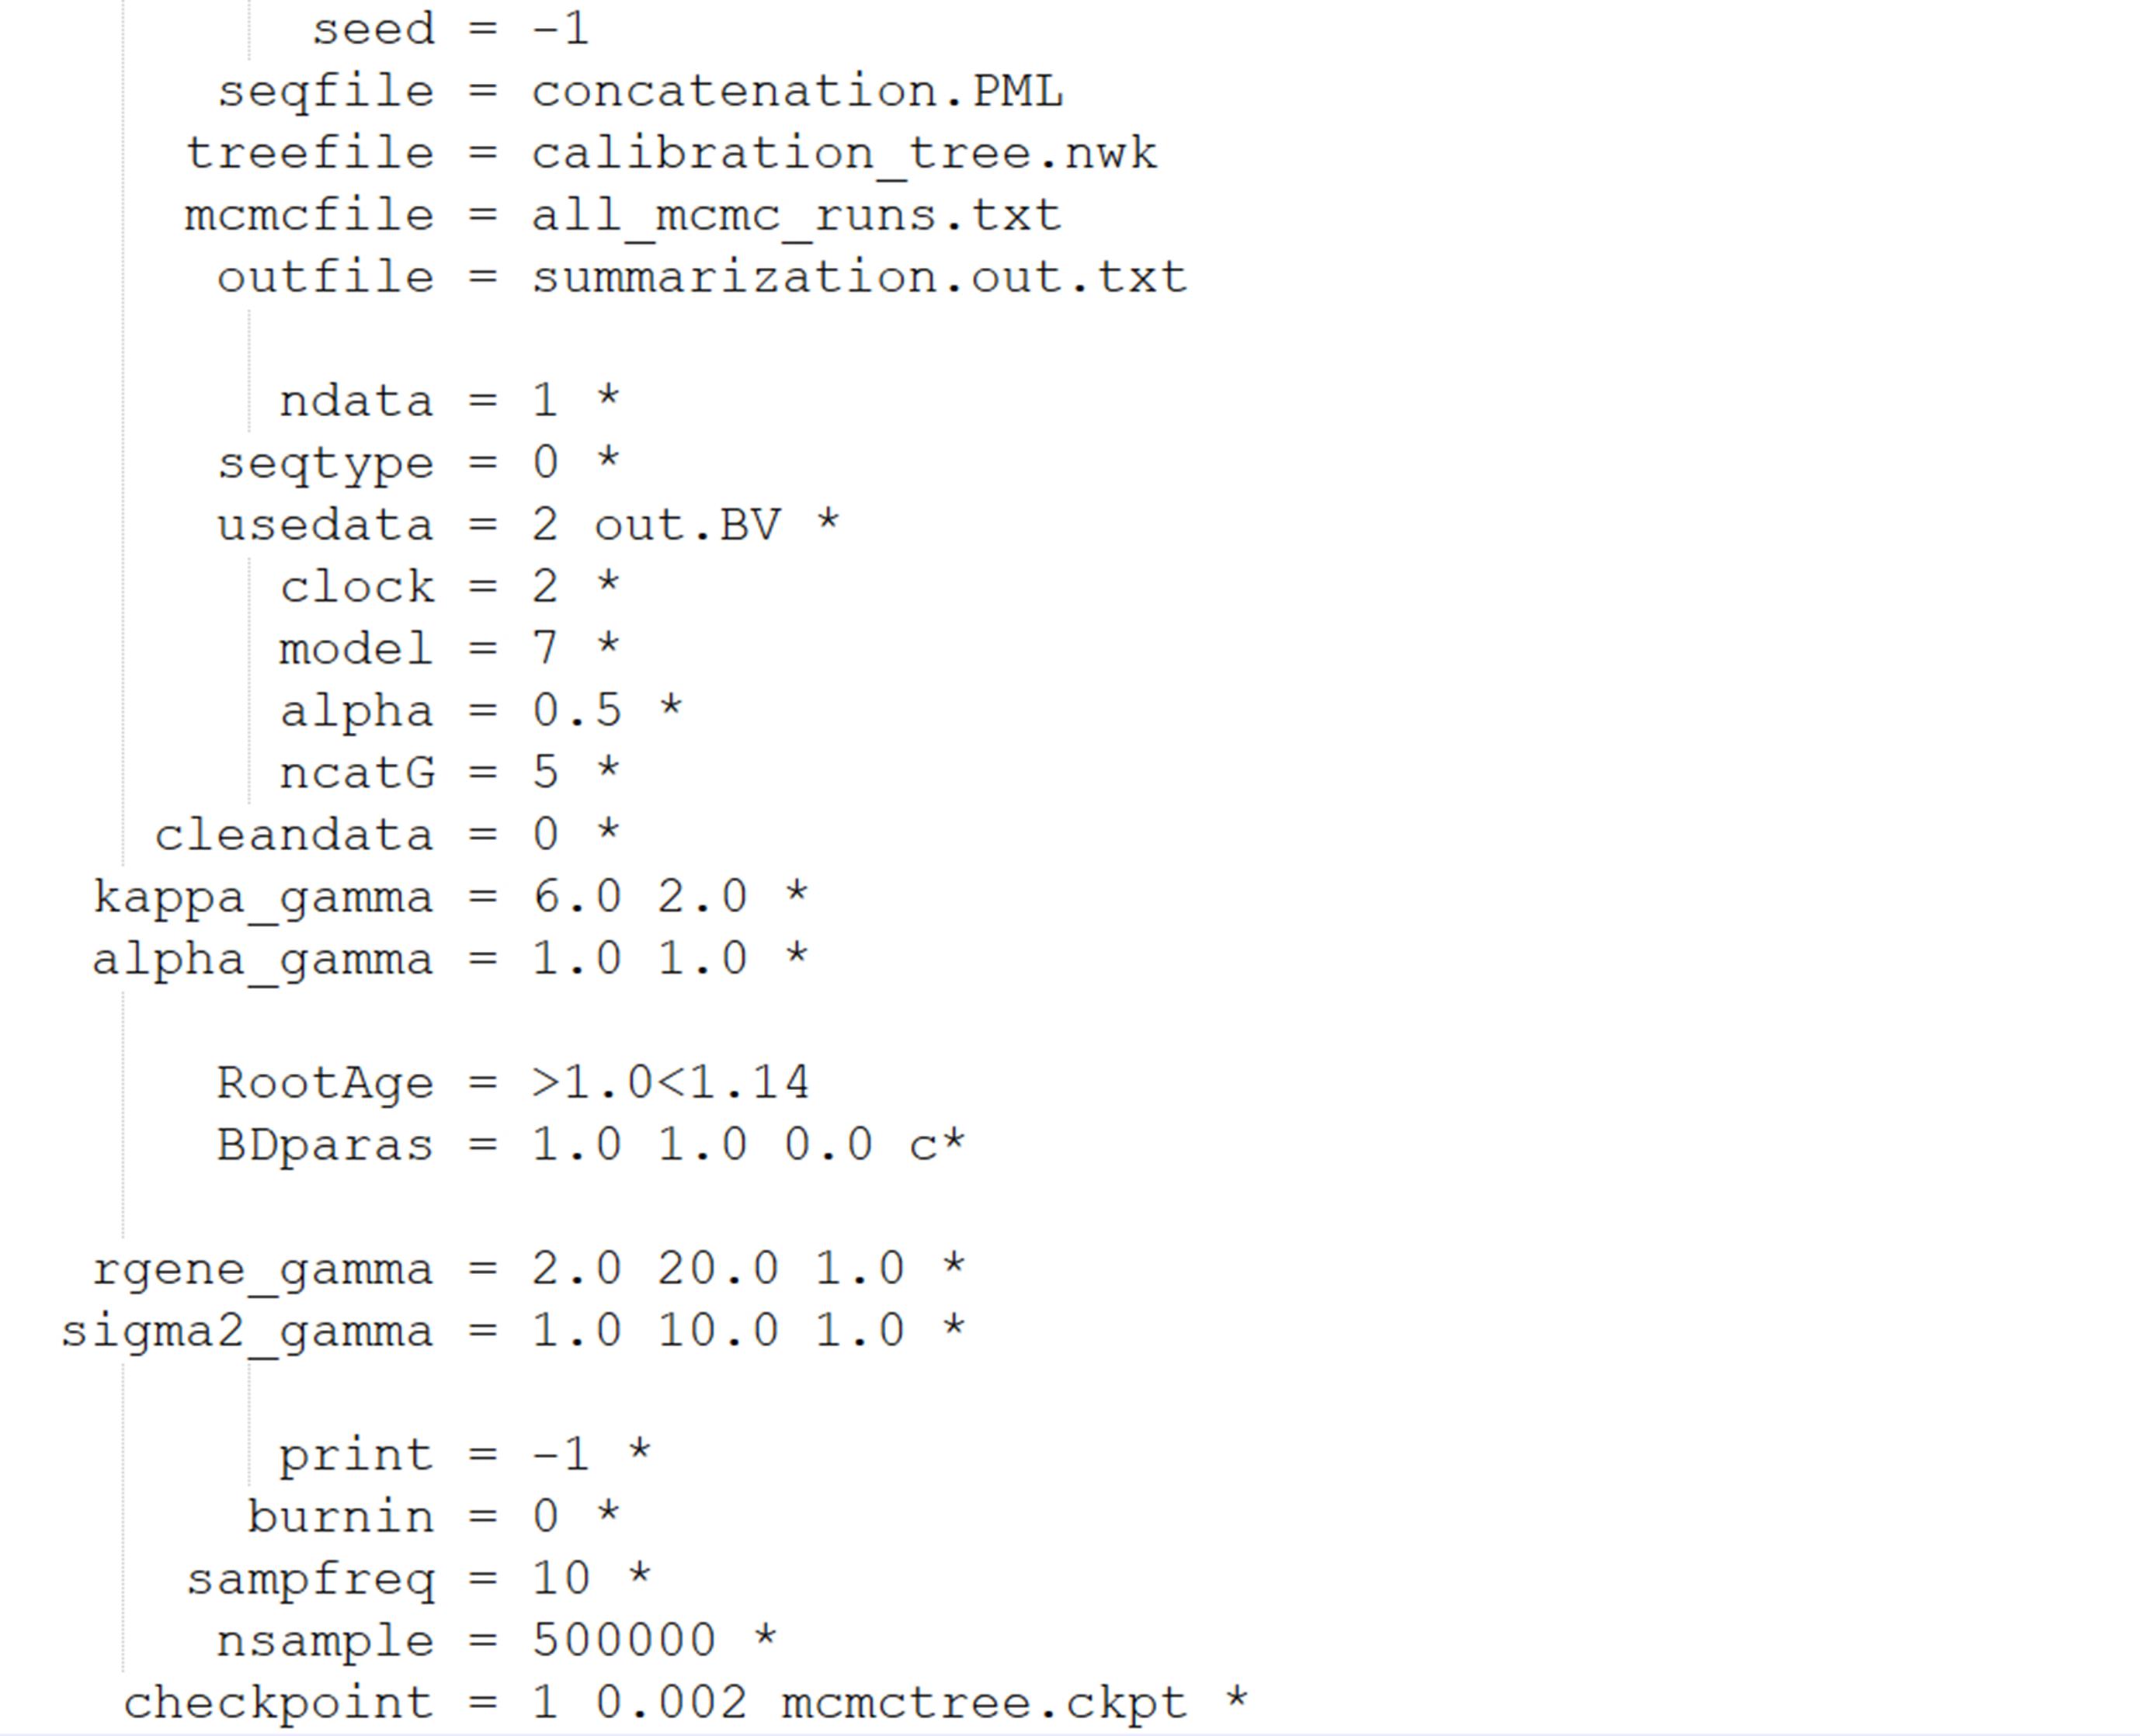
Figure 31. Parameter settings used for the validation analyses. Screenshot showing the main run parameters used to generate the validation results.
General notes and troubleshooting
General notes
1. IQ-TREE for Hessian matrix calculation: When utilizing IQ-TREE to calculate the Hessian matrix within MDGUI, users should select IQ-TREE v3 or later in the settings. The path specified in PhyloSuite v2 should therefore point to an IQ-TREE v3 (or higher) executable.
2. External executable files: When downloading and configuring external programs for use in PhyloSuite v2, such as IQ-TREE, users are advised to download them only from the official repository or official release page of the corresponding software, so as to avoid running tampered or maliciously modified binaries.
3. TimeTreeAnno is a lightweight and efficient tool for basic timetree annotation, focusing on geological time scales, node ages, and user-defined labels. It is important to note that r8s analysis generates precise point estimates for divergence times rather than probability ranges (such as 95% HPD intervals produced by MCMCtree).
4. Disclaimer on software execution environment: The execution of the workflow may be affected by differences in operating systems, local security policies, and software dependencies. In some environments (e.g., company-managed computers), certain scripts or external executables may be blocked for security reasons. Users should therefore ensure that the required permissions and dependencies are available in their local environment before running the workflow.
Troubleshooting
Problem 1: On a Windows system, the program displays the message “app is running” when launching PhyloSuite.
Possible cause: A background process of the application is still active from a previous session.
Solution: Open the Task Manager, locate the “PhyloSuite” process, terminate it (End Task), and then restart the application (Figure 32).
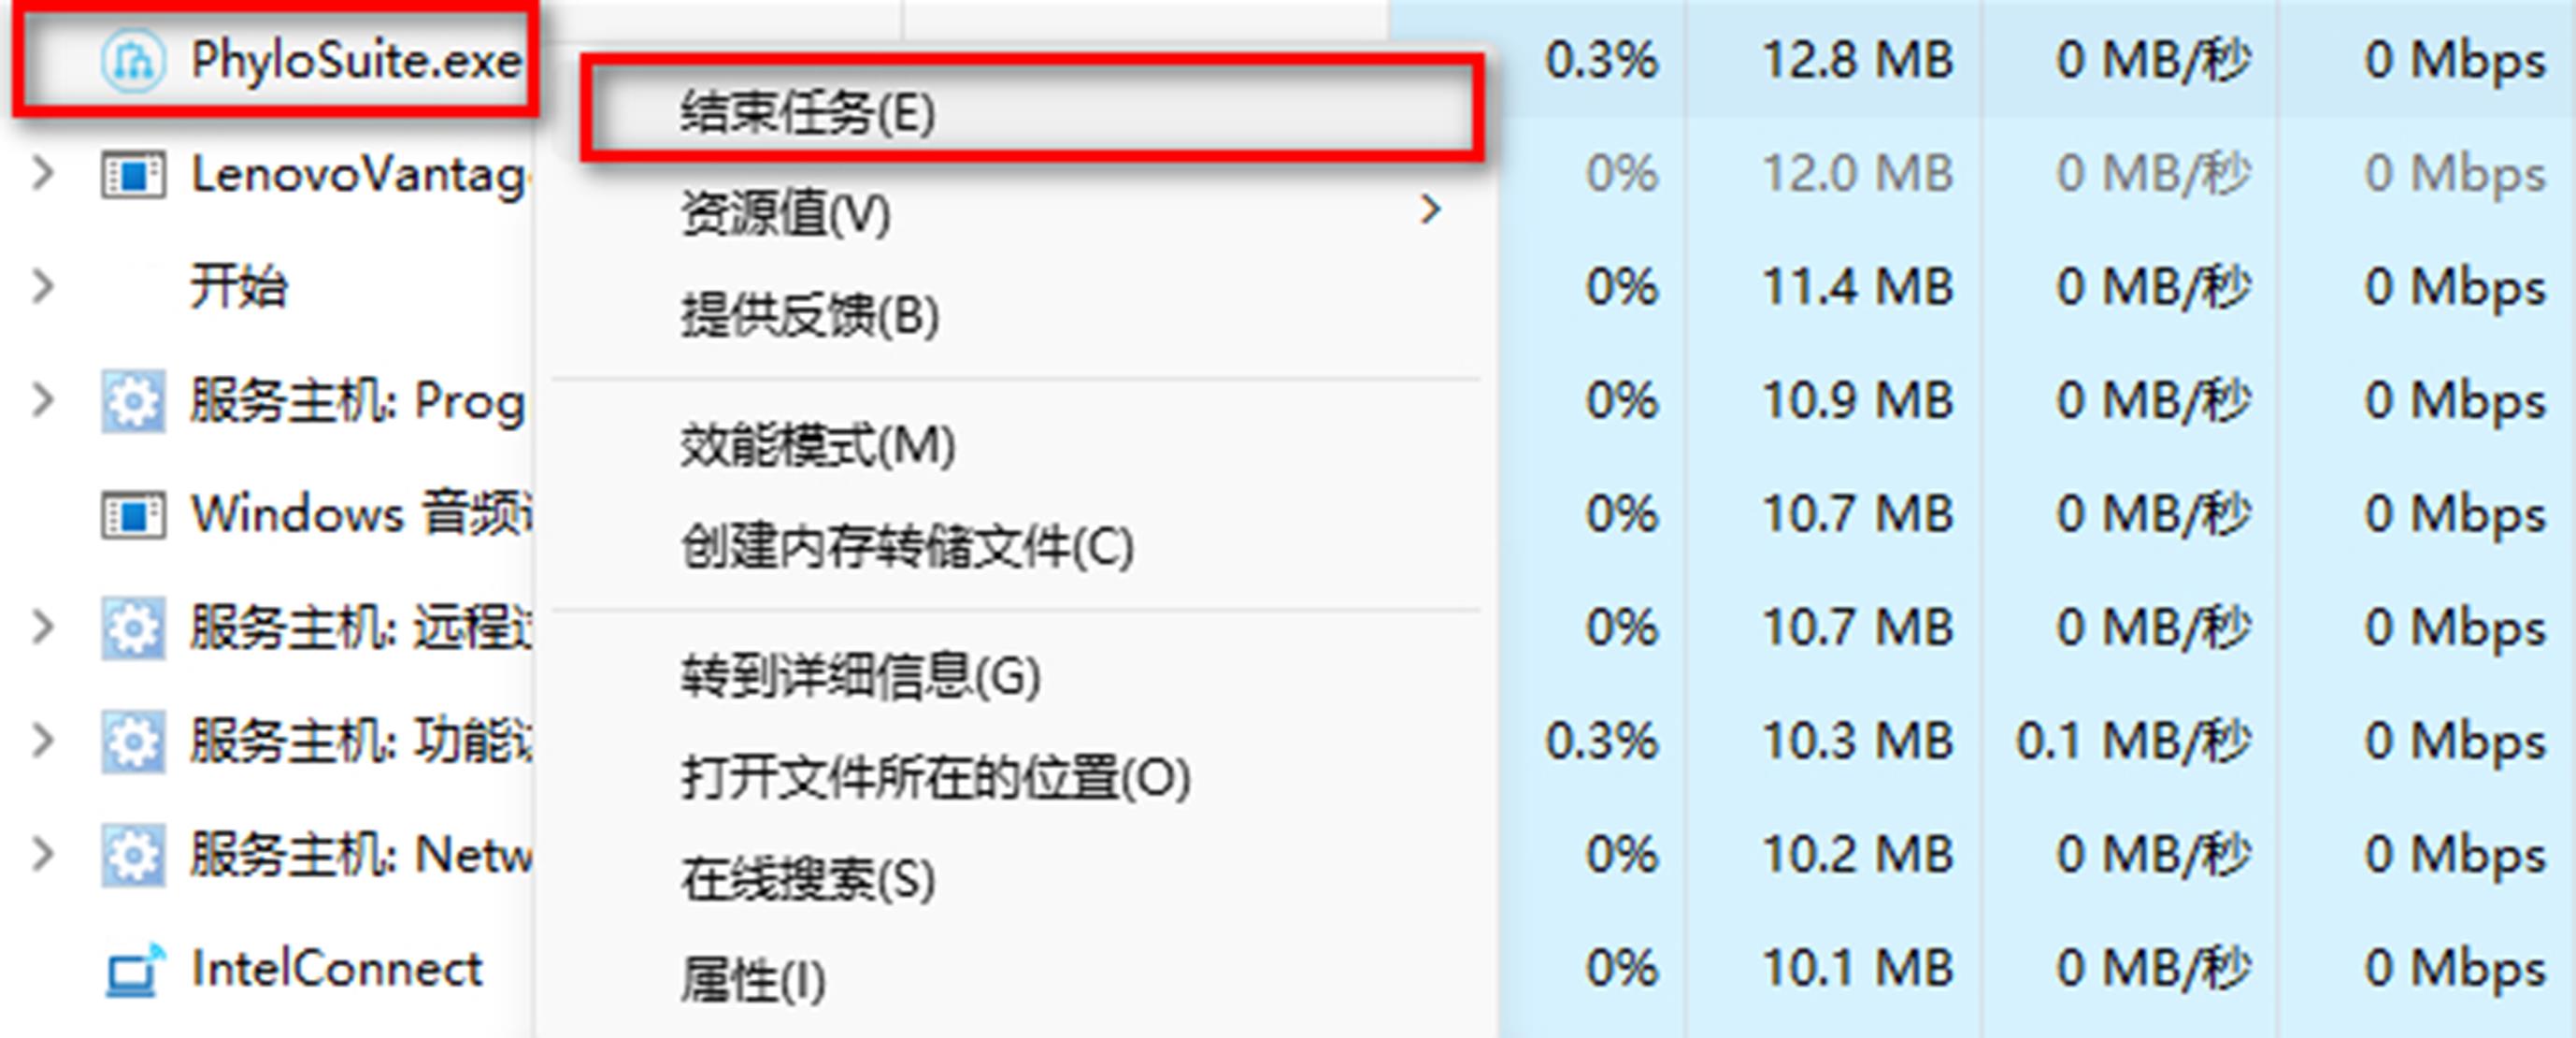
Figure 32. Ending the PhyloSuite process in Task Manager. Screenshot showing how to terminate the PhyloSuite process in Task Manager as part of the troubleshooting procedure.
Problem 2: The program displays the message “Please install IQ-TREE v3 (for model selection and generation of Hessian matrix) first!” when launching MDGUI.
Possible cause: The IQ-TREE executable path is not specified, or the configured version is too old (not v3 or later).
Solution: Navigate to the settings menu and re-configure or install the specified version of IQ-TREE (Figure 33).
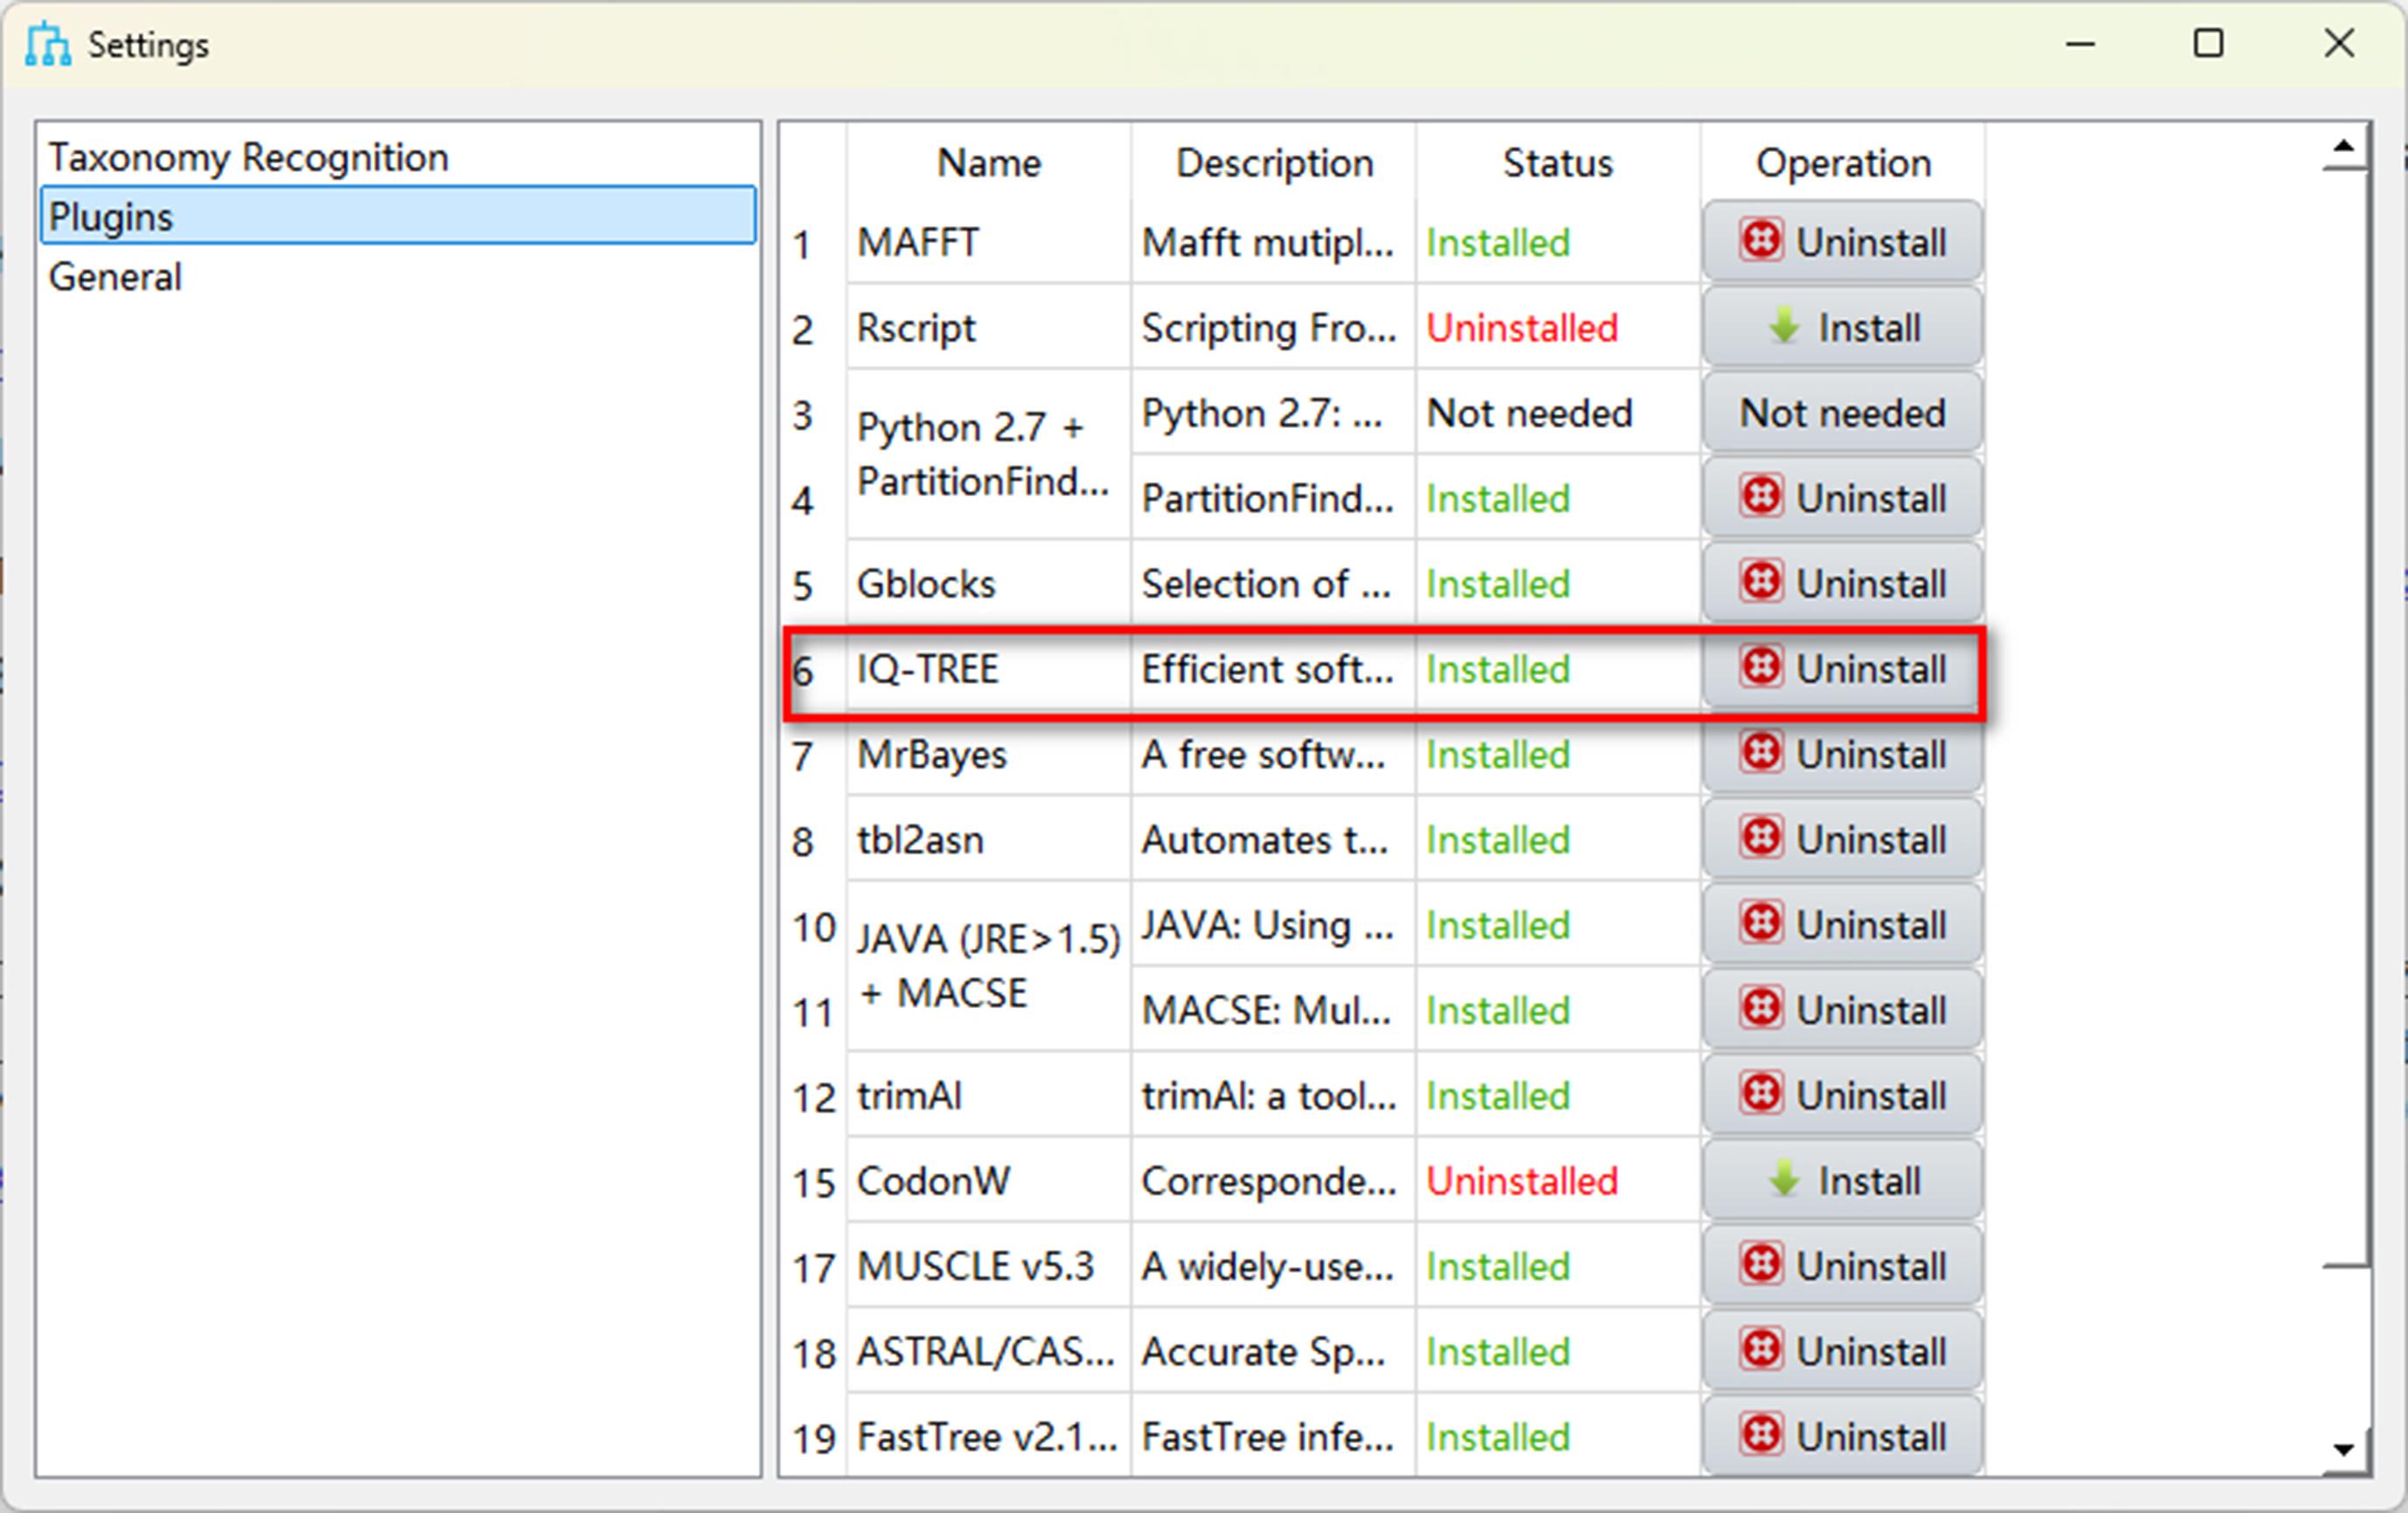
Figure 33. Downloading and configuring IQ-TREE in the plugins panel. Screenshot showing where to re-download and set IQ-TREE in the plugins section of the Settings interface.
Problem 3: Geological events or time scales are displayed incorrectly or appear disordered in TimeTreeAnno.
Possible cause: Incorrect selection of time units during file import.
Solution: Verify that the time unit selected (e.g., 100 MYA vs. 1 MYA) matches the unit used during the molecular dating analysis and the setting chosen when importing the timetree file into the TimeTreeAnno.
Problem 4: The interface lags or becomes unresponsive after importing MCMC sample files into MCMCTracer.
Possible cause: User interaction with the interface occurred before the file import process was fully completed.
Solution: Please wait patiently until the file import is finished and the statistical graphs are fully rendered before performing other operations.
Acknowledgments
Writing—Original Draft, D. Zhao; Writing—Review & Editing, D. Zhao, I. Jakovlić, and D. Zhang; Investigation and Software Testing, D. Zhao, X. T. Liu, I. Jakovlić, and D. Zhang.
This work was supported by the Science and Technology Projects of Xizang Autonomous Region, China (grant numbers XZ202502JD0017, XZ202402ZD0005, XZ202502JD0025), the Graduate High-level Talent Training Program of Xizang University (grant number 2025-GSP-S095; supervisor: Prof. Dong Zhang), the National Natural Science Foundation of China (grant numbers 32422089, 32360927), the Fundamental and Interdisciplinary Disciplines Breakthrough Plan of the Ministry of Education of China (grant number JYB2025XDXM910); and the State Key Laboratory of Herbage Improvement and Grassland Agro-ecosystems (Lanzhou University) (grant number HL2025IGB0).
This protocol describes the detailed workflow and application of the molecular dating modules (MDGUI, TimeTreeAnno, and MCMCTracer) originally introduced and validated in [13].
We strictly tailored this protocol to the PhyloSuite v2 platform. We are deeply grateful to the broad community of PhyloSuite users for their valuable feedback and suggestions, which have been instrumental in the continuous improvement and refinement of the software.
Competing interests
The authors declare no conflicts of interest.
References
- Felsenstein, J. (1981). Evolutionary trees from DNA sequences: A maximum likelihood approach. J Mol Evol. 17(6): 368–376. https://doi.org/10.1007/bf01734359
- Zuckerkandl, E. and Pauling, L. (1965). Evolutionary Divergence and Convergence in Proteins. Evolving Genes and Proteins. 97–166. https://doi.org/10.1016/b978-1-4832-2734-4.50017-6
- Ho, S. Y. (2014). The changing face of the molecular evolutionary clock. Trends Ecol Evol. 29(9): 496–503. https://doi.org/10.1016/j.tree.2014.07.004
- Reis, M. d. and Yang, Z. (2011). Approximate Likelihood Calculation on a Phylogeny for Bayesian Estimation of Divergence Times. Mol Biol Evol. 28(7): 2161–2172. https://doi.org/10.1093/molbev/msr045
- Smith, S. A., Brown, J. W. and Walker, J. F. (2018). So many genes, so little time: A practical approach to divergence-time estimation in the genomic era. PLoS One. 13(5): e0197433. https://doi.org/10.1371/journal.pone.0197433
- Yang, Z. (2007). PAML 4: Phylogenetic Analysis by Maximum Likelihood. Mol Biol Evol. 24(8): 1586–1591. https://doi.org/10.1093/molbev/msm088
- Sanderson, M. J. (2003). r8s: inferring absolute rates of molecular evolution and divergence times in the absence of a molecular clock. Bioinformatics. 19(2): 301–302. https://doi.org/10.1093/bioinformatics/19.2.301
- Yang, Z. and Rannala, B. (2005). Bayesian Estimation of Species Divergence Times Under a Molecular Clock Using Multiple Fossil Calibrations with Soft Bounds. Mol Biol Evol. 23(1): 212–226. https://doi.org/10.1093/molbev/msj024
- Parham, J. F., Donoghue, P. C. J., Bell, C. J., Calway, T. D., Head, J. J., Holroyd, P. A., Inoue, J. G., Irmis, R. B., Joyce, W. G., Ksepka, D. T., et al. (2011). Best Practices for Justifying Fossil Calibrations. Syst Biol. 61(2): 346–359. https://doi.org/10.1093/sysbio/syr107
- Warnock, R. C. M., Parham, J. F., Joyce, W. G., Lyson, T. R. and Donoghue, P. C. J. (2015). Calibration uncertainty in molecular dating analyses: there is no substitute for the prior evaluation of time priors. Proc R Soc B Biol Sci. 282(1798): 20141013. https://doi.org/10.1098/rspb.2014.1013
- Rambaut, A., Drummond, A. J., Xie, D., Baele, G. and Suchard, M. A. (2018). Posterior Summarization in Bayesian Phylogenetics Using Tracer 1.7. Syst Biol. 67(5): 901–904. https://doi.org/10.1093/sysbio/syy032
- Zhang, D., Gao, F., Jakovlić, I., Zou, H., Zhang, J., Li, W. X. and Wang, G. T. (2019). PhyloSuite: An integrated and scalable desktop platform for streamlined molecular sequence data management and evolutionary phylogenetics studies. Mol Ecol Resour. 20(1): 348–355. https://doi.org/10.1111/1755-0998.13096
- Zhao, D., Ye, T., Gao, F., Jakovlić, I., La, Q., Tong, Y., Liu, X., Song, R., Liu, F., Lian, Z., et al. (2025). PhyloSuite v2: The development of an all‐in‐one, efficient and visualization‐oriented suite for molecular dating analysis and other advanced features. Imeta. 4(6): e70095. https://doi.org/10.1002/imt2.70095
- Wong, T., Ly-Trong, N., Ren, H., Baños, H., Roger, A., Susko, E., Bielow, C., De Maio, N., Goldman, N., Hahn, M., et al. (2025). IQ-TREE 3: Phylogenomic Inference Software using Complex Evolutionary Models. e32942/x2p62n. https://doi.org/10.32942/x2p62n
- Xiang, C., Gao, F., Jakovlić, I., Lei, H., Hu, Y., Zhang, H., Zou, H., Wang, G. and Zhang, D. (2023). Using PhyloSuite for molecular phylogeny and tree‐based analyses. Imeta. 2(1): e87. https://doi.org/10.1002/imt2.87
Article Information
Publication history
Received: Feb 11, 2026
Accepted: Apr 2, 2026
Available online: Apr 26, 2026
Published: May 20, 2026
Copyright
© 2026 The Author(s); This is an open access article under the CC BY-NC license (https://creativecommons.org/licenses/by-nc/4.0/).
How to cite
Zhao, D., Jakovlić, I., Liu, X., Wang, S., Zhang, D. and Ye, T. (2026). A Step-by-Step GUI-Based Protocol for Molecular Dating Analysis Using PhyloSuite v2. Bio-protocol 16(10): e5688. DOI: 10.21769/BioProtoc.5688.

 Download Citation in RIS Format
Category
Bioinformatics and Computational Biology
Systems Biology > Genomics > Phylogenetics
Do you have any questions about this protocol?
Post your question to gather feedback from the community. We will also invite the authors of this article to respond.
 Post a Question


