


- Protocols

- Articles and Issues
- For Authors
- About
- Become a Reviewer


Quantitative Analysis of Splenic Natural Killer Cells of Mice Using Imaging Flow Cytometry



Published: Vol 16, Iss 8, Apr 20, 2026 DOI: 10.21769/BioProtoc.5666 Views: 529
Reviewed by: Sucheta ChopraSanjay Kumar KureelAnonymous reviewer(s)
 PDF
PDF  Ask a question
Original research article
The authors used this protocol in:
Aug 2022
Advertisement

Protocol Collections
Comprehensive collections of detailed, peer-reviewed protocols focusing on specific topics




Related protocols
Abstract
Natural killer (NK) cells are crucial innate immune effectors, mediating cytotoxicity against cancer and infected cells through receptors such as NKG2D. Reliable quantification of NK cell subsets is essential for evaluating NK cell-based immune responses in cancer research. Unlike other assays, including traditional flow cytometry used in assessing NK cells, imaging flow cytometry (IFC) is a simple and direct method for quantitative analysis of NK cells. This protocol describes the necessary procedures, including harvesting splenocytes, acquiring these cells labeled with NKG2D antibodies, and analyzing IFC data with IDEAS® software. We applied this protocol to quantitatively assess the number of splenic NKG2D+ NK cells in mice injected with SVTneg2 cancer cells (which carry the p53 G242A missense mutation) and compared them to mice injected with EMT6 cancer cells (which have wild-type p53) or normal fibroblasts. We found that the SVTneg2 cancer cells significantly decreased the number of NKG2D+ NK cells in mice by approximately 2-fold (933 cells vs. 2360 cells, p < 0.001) compared with mice injected with EMT6 cancer cells. This IFC protocol can be applied to directly quantify NK cells in vivo. This quantitative protocol allows novices to quickly handle the analysis of cytotoxic NK cells with a single NKG2D marker. Further multicolor flow cytometry and cytokine assay may be required to precisely define the subtypes and effects of NK cells in anticancer immunity.
Key features
• A simple and direct assay using imaging flow cytometry (IFC) to quantify cytotoxic NKG2D NK cells against breast cancer cells in mice.
• Simultaneously collect the flow cytometry characters and each cell image of NK cells and other populations.
• Step-by-step identification of interested NK cells mainly relying on image gating (focus, size, morphology).
• Highly reliable and applicable to analyze other immune cell subsets or tumor-associated populations with corresponding conjugate antibodies.
Keywords: Natural killer cells Imaging flow cytometry
Immune cytotoxicity
Cancer cells
Analyzing IFC data
Imaging flow cytometry
Immune cytotoxicity
Cancer cells
Analyzing IFC data
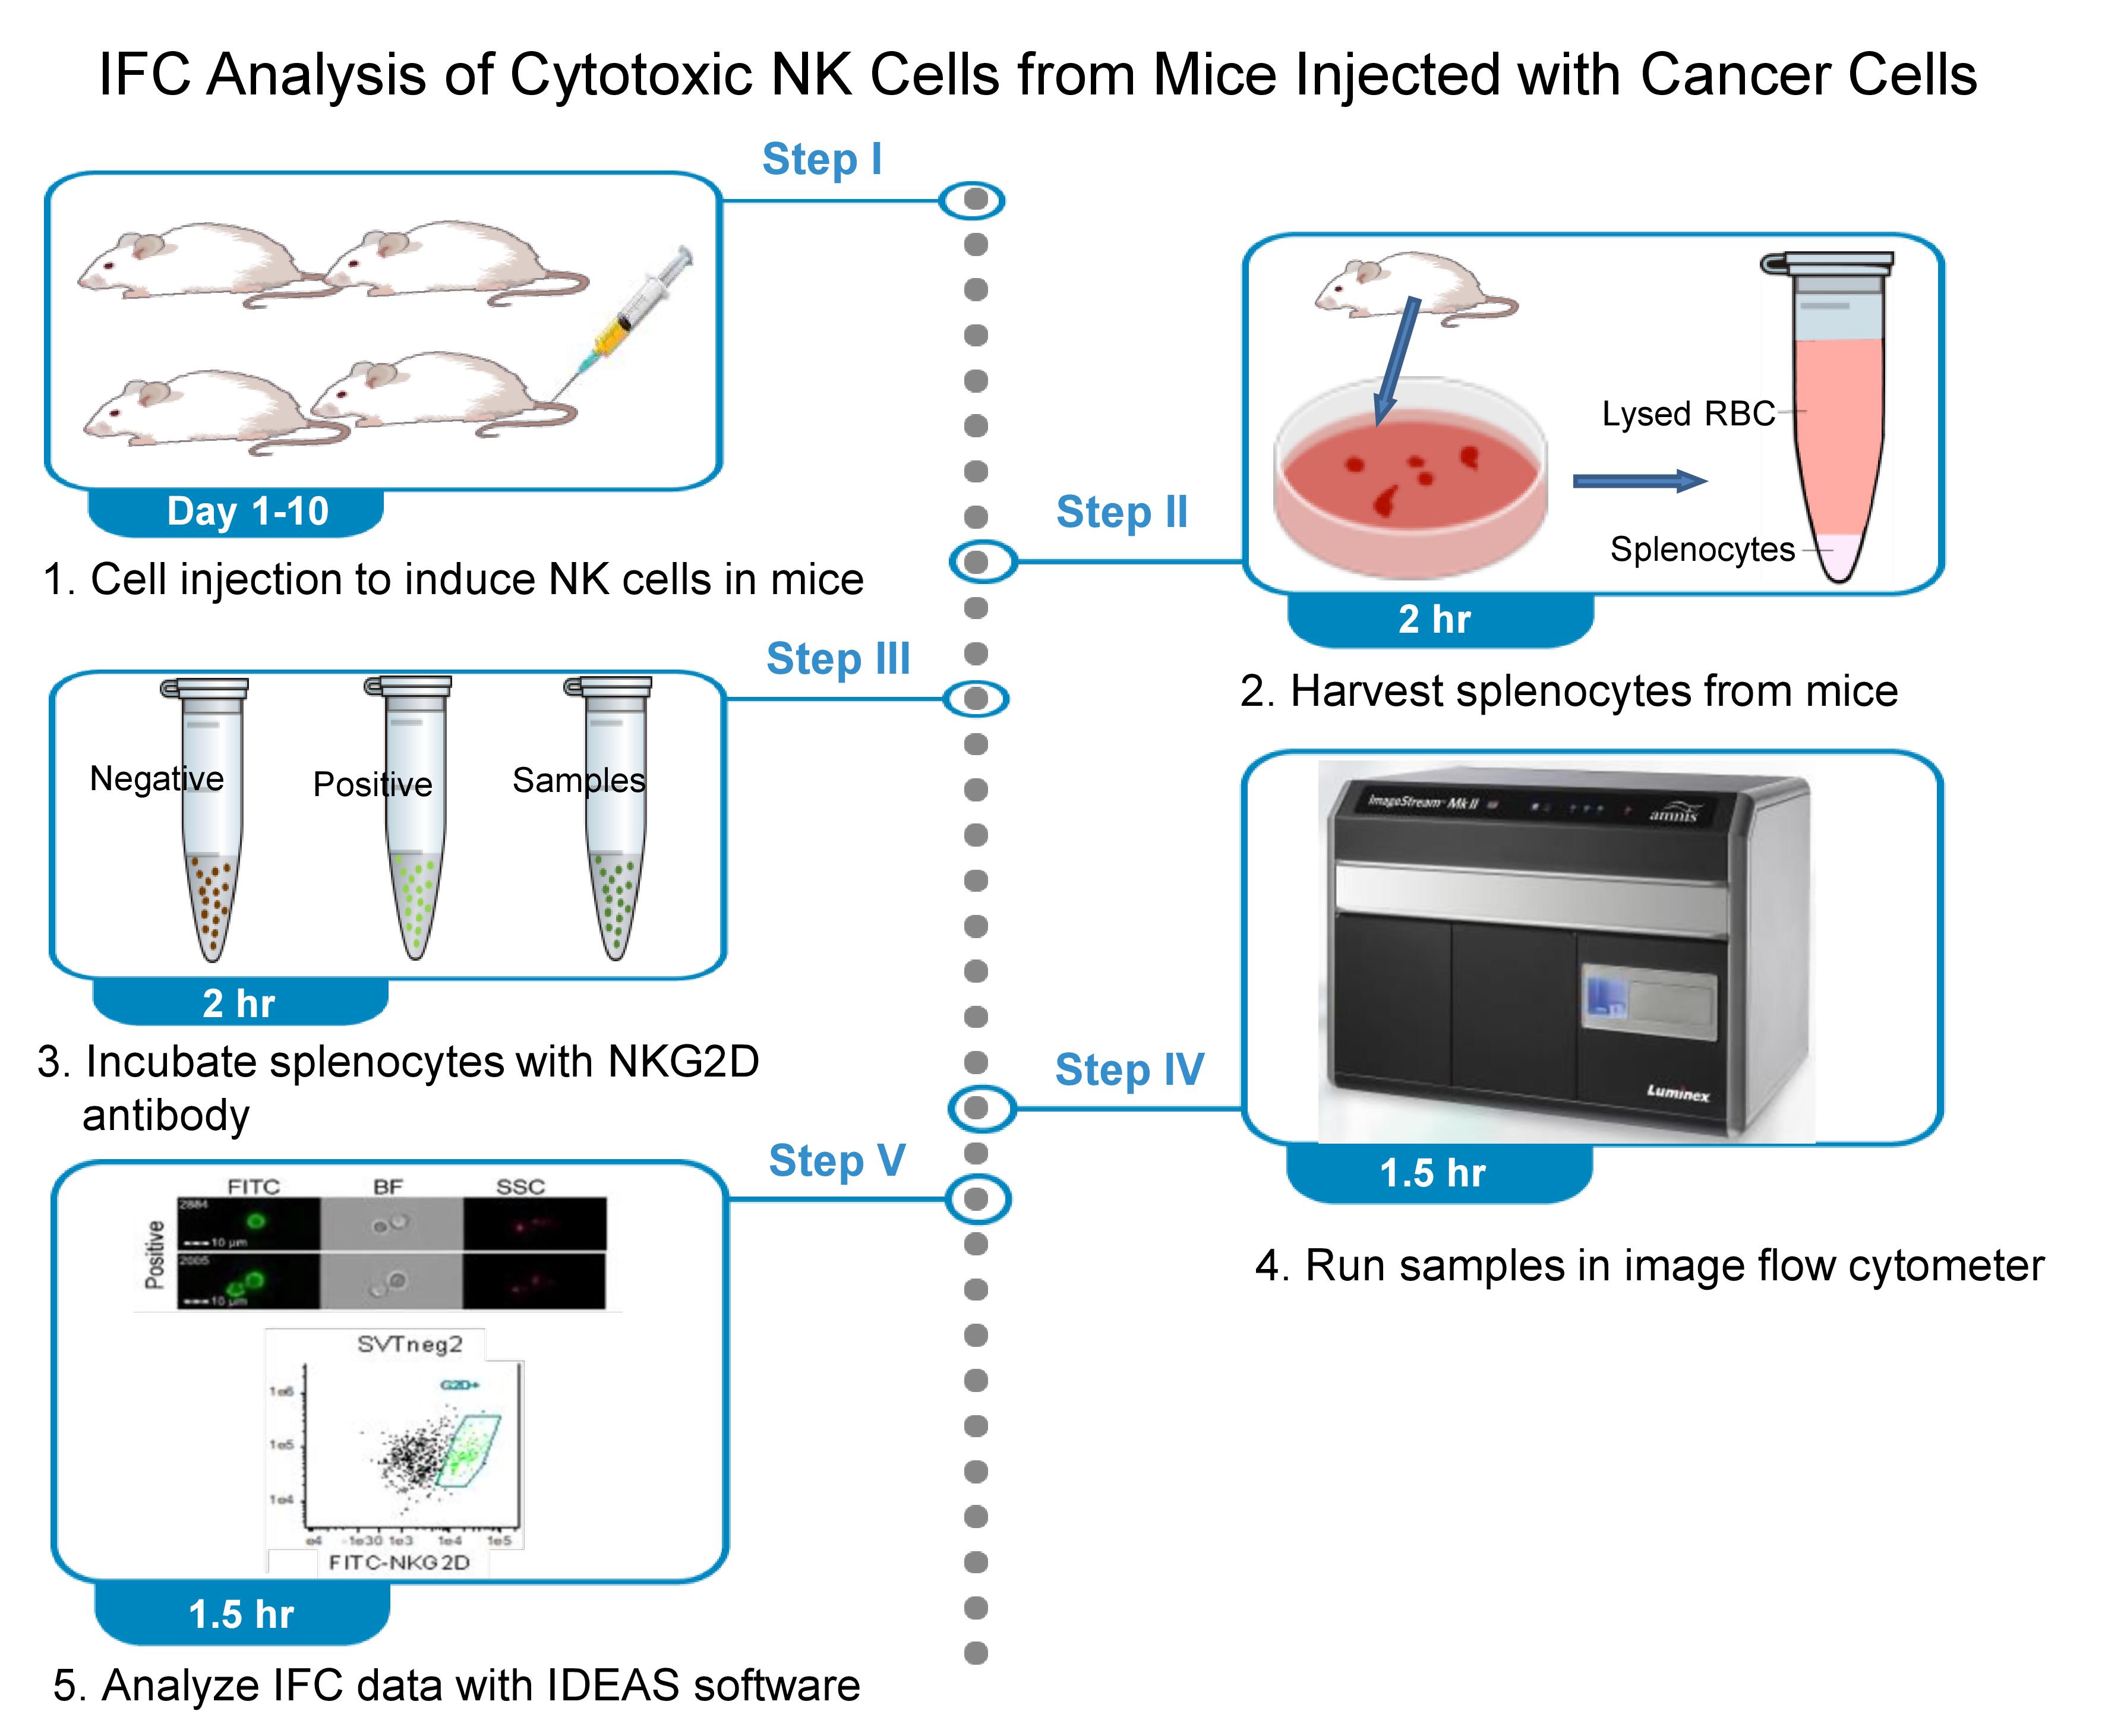
Graphical overview
Background
Natural killer (NK) cells are key effectors for innate immunity that play a pivotal role in immune surveillance and cytotoxicity against cancer [1]. Recent works highlighted the potential of NK cells in cancer immunotherapy, owing to their directed cytotoxic capabilities and their roles in orchestrating broader immune responses to cancer cells [2]. With surface receptors recognizing other cells expressing low levels of major histocompatibility complex (MHC) class I molecules, NK cells can mount potent assaults on cancerous or infected cells and destroy those cells by secreting various cytokines [3]. NK group member 2D (NKG2D, also known as CD314) is one of the most common activating receptors on NK cells. By the binding of NKG2D receptors to the ligands on cancer cells, NK cells can be activated in immune recognition [4]. However, many cancer cells are enabled to aberrantly express the NKG2D ligands, thus avoiding recognition so as to inactivate and even destroy NK cells [5,6]. p53 protein acts as a powerful transcriptional factor that upregulates the stimulatory NKG2D ligands, including retinoic acid early transcript 1 (RAET1), histocompatibility antigen 60 (H60), and mouse UL16-binding protein-like transcript 1 (Mult1) of murine cancer cells, to activate NK cells against tumors [7,8]. Missense mutants of p53 proteins are frequently detected in cancer cells and exhibit gain-of-function to promote tumor progression [9]. Both loss of the function of wild-type p53 protein and gain-of-function of p53 mutants can alter NKG2D ligands, either by decreasing stimulatory ligands (such as Mult1, ULPB1) or by increasing inhibitory ligands (such as H60a, RAET1E2), and then inactivate NK cells [6,8,10,11]. In an effort to garner evidence on p53 and NK cell activation, we designed a method to quantitatively analyze cytotoxic NK cells using imaging flow cytometry (IFC)—a technology that combines multiparametric flow cytometry and fluorescence microscopy [8,12].
A wide variety of NK cell subsets exist in a variable tissue microenvironment, reflecting different maturation stages with functional capabilities. The NKG2D+ subset of NK cells is the major phenotype of NK cells and is highly cytotoxic to cancer cells [13–16]. It has been estimated that NKG2D+ splenic cells included only approximately 3% of γδ T cells, αβ CD8+ T cells, and macrophages [14–17]. IFC combines the high-event-rate nature of flow cytometry with the advantages of single-cell image acquisition associated with microscopy [18].
Tissue NK cells can be quantitatively analyzed using several methods, including traditional flow cytometry and advanced analysis techniques, such as multicolor flow cytometry or high-parameter cytometry, single-cell proteo-genomics, and molecular imaging. However, these often lack the detailed morphological information needed to distinguish true positive cells from nonspecific staining or background noise for precise quantification [19]. We developed IFC as a tool to measure the cytotoxic subtype of NK cells with the NKG2D marker through quantitative comparison with high-resolution confocal microscopy. We show that IFC can be used as a simple and direct measure of cytotoxic NK cells against tumors, as this technology possesses greater dimensionality than standard flow cytometry. This cell-imaging dimensionality significantly improves discrimination of true NKG2D+ NK cells from nonspecific staining or background noise using double-gating, including brightfield and fluorescence. IFC enables the analysis of spatial and structural details of cell populations with greater precision, which is critical for identifying cell features that conventional flow cytometry is unable to reach.
This protocol describes the steps to quantify cytotoxic NK cells (NKG2D+) of mice after injections of breast cancer cells. With minor modifications, such as replacing the conjugated CD8 antibody, we also used it to analyze CD8+ T cells [8]. This protocol can be applied to analyze cytotoxic NK cells with the NKG2D receptor in cell culture and animal tissues. Further analysis, such as multicolor IFC and cytokine assay, is required to precisely characterize the subsets and effects of NK cells in immunity [20].
Materials and reagents
Biological materials
1. Mouse: BALB/c, female, 4–5 weeks of age (Charles River, strain code: 028, BALB/cAnNCrl)
2. EMT6 cells (mouse, mammary carcinoma, BALB/cKa strain, wild-type Trp53) (American Type Culture Collection, CRL-2755)
3. SVTneg2 cells (mouse, mammary carcinoma, BALB/c strain, Trp53 G242A) (Charitè Universitätsmedizin Berlin, Dr. Andreas Klein, Institute of Biochemistry)
4. Fibroblasts (BALB/c mouse, lung) (Cell Biologics, catalog number: BALB-5013)
Note: Fibroblasts can also be isolated from BALB/c mice.
Reagents
1. FITC anti-mouse CD314 (NKG2D) antibody, clone C7, 0.5 mg/mL in 100 μL (BioLegend, catalog number: 115711)
2. FITC anti-p53 antibody, mouse IgG2b, clone DO-7 (BioLegend, catalog number: 645804)
3. HBSS supplemented with 10% FBS (Fisher Scientific, catalog number: 24020117)
4. Ketamine hydrochloride (Sigma-Aldrich, catalog number: K2753)
5. Xylazine hydrochloride (Sigma-Aldrich, catalog number: X1251-1G)
6. Bovine serum albumin (BSA) (Sigma-Aldrich, catalog number: A9418)
7. Normal mouse serum (NMS) (Fisher Scientific, catalog number: 10410)
8. DPBS 10× (500 mL) (Fisher Scientific, catalog number: AAJ61917K3)
9. DMEM base medium (no glucose) (Fisher Scientific, catalog number: 11-966-025)
10. RPMI 1640 base medium (Fisher Scientific, catalog number: 11-875-093)
11. Penicillin-streptomycin-glutamine (100×) (Fisher Scientific, catalog number: 10-378-016)
12. Trypsin-EDTA (0.25%) (Fisher Scientific, catalog number: 25-200-056)
13. ACK (ammonium-chloride-potassium) lysing buffer (Fisher Scientific, catalog number: A1049201)
14. Sheath fluid (Millipore, catalog number: BSS-1006-B)
15. Cleanser (Beckman Coulter, catalog number: 8546929)
16. 5% sodium hypochlorite (sterilizer) (VWR, catalog number: JT9416-1)
17. 70% isopropanol (debubbler) (Sigma-Aldrich, catalog number: 67-63-0)
18. Deionized water (Milli-Q water) (Millipore Milli-Q water purified, catalog number: ZRXQ005US)
Solutions
1. DMEM growth medium (see Recipes)
2. RPMI 1640 growth medium (see Recipes)
3. Euthanasia solution (see Recipes)
4. 1× phosphate buffer saline (PBS) (see Recipes)
5. 2% NMS in PBS (see Recipes)
Recipes
1. DMEM growth medium
| Reagent | Final concentration | Volume for 20 mice |
|---|---|---|
| Fetal bovine serum (FBS) | 10% | 50 mL |
| Penicillin/streptomycin/glutamine | 1% | 5 mL |
| DMEM base medium | 445 mL | |
| Total | 500 mL |
Keep at 4 °C for up to one month.
2. RPMI 1640 growth medium
| Reagent | Final concentration | Volume for 20 mice |
|---|---|---|
| FBS | 10% | 50 mL |
| Penicillin/streptomycin/glutamine | 1% | 5 mL |
| RPMI 1640 medium | 445 mL | |
| Total | 500 mL |
Keep at 4 °C for up to one month.
3. Euthanasia solution
| Reagent | Final concentration | Volume for 20 mice |
|---|---|---|
| Ketamine hydrochloride (100 mg/mL) | 10 mg/mL | 2 mL |
| Xylazine hydrochloride (20 mg/mL) | 1 mg/mL | 1 mL |
| PBS 1× | n/a | 17 mL |
| Total | n/a | 20 mL |
Critical: This stock has to be sterile; prepare it in a laminar flow hood.
Keep at 4 °C for up to three days.
4. 1× PBS
| Reagent | Final concentration | Volume for 20 mice |
|---|---|---|
| Sterile PBS 10× | 1× | 5 mL |
| MilliQ water (autoclaved) | 45 mL | |
| Total | 50 mL |
Critical: This stock has to be sterile; prepare it in a laminar flow hood.
Keep at 4 °C for up to one week.
5. 2% NMS in PBS
| Reagent | Final concentration | Volume for 20 mice |
|---|---|---|
| Sterile PBS 10× | 1× | 5 mL |
| MilliQ water (autoclaved) | 44 mL | |
| NMS | 2% | 1 mL |
| Total | 50 mL |
Critical: This stock has to be sterile; prepare it in a laminar flow hood.
Keep at 4 °C for up to one week.
Laboratory supplies
1. Conical centrifuge tubes, 25 mL (Fisher Scientific, catalog number: 05-413-921)
2. Microcentrifuge tubes, 1.5 mL (Fisher Scientific, catalog number: 05-408-129)
3. Standard dissecting scissors (straight) (Fisher Scientific, catalog number: 08-951-20)
4. Dissecting dressing forceps (Fisher Scientific, catalog number: 13-812-40)
5. Syringe and needle (0.3 mL, 30-G) (Fisher Scientific, catalog number: 50-209-2910)
6. Syringe (3 mL, 21-G) (Fisher Scientific, catalog number: 14-823-55)
7. Cell strainers, 70 μm, sterile (Fisher Scientific, catalog number: 07-201-431)
Equipment
1. Imaging flow cytometer (EMD Millipore, model: ImageStreamX Mark II)
2. CO2 incubator for cell culture (Thermo Fisher Scientific, model: 3310)
3. Refrigerator (4 °C)
4. Centrifuge (Eppendorf, model: 5804R, 15 amp version)
Software and datasets
1. IDEAS software (CYTEK, https://cytekbio.com/pages/imagestream)
Procedure
Note: The protocol describes the step-by-step process to analyze the alteration of natural killer (NK) cells quantitatively in mice following injections of breast cancer cells.
A. Preparation of animal models, solutions, and buffers
1. Divide mice (BALB/c, female, 4–5 weeks of age) randomly into 4 groups (5 mice per group), which will be injected with cells of EMT6, SVTneg2, mouse fibroblast, and saline.
Note: All animal experiments were approved by the Institutional Animal Care and Use Committee, University of Louisiana at Monroe (23MAY-YYL-01, May 3, 2023), and were carried out in strict accordance with good animal practice as defined by NIH guidelines.
2. Prepare 20 mL of euthanasia solution (see Recipes).
3. Prepare 50 mL of PBS (see Recipes).
B. Injections of cancer cells into mice to increase the number of cytotoxic NK cells
1. Culture EMT6 and SVTneg2 cells in DMEM growth medium and maintain in an incubator humidified with 95% air and 5% CO2 at 37 °C. Culture mouse fibroblasts in RPMI 1640 growth medium.
2. Passage these cells in new flasks with culture media every 3 days, using Trypsin-EDTA (0.25%) to detach the cells, followed by removing the spent culture media and washing with PBS (1×).
3. After 4 passages, harvest cells with 0.25% trypsin-EDTA solution followed by a PBS wash. Count cells and prepare a cell suspension solution of 1 × 10⁶ cells/10 μL (200 μL for 5 mice).
4. Intraperitoneally administer euthanasia solution (10 μL/g body weight, ~300 μL/mouse) using a syringe (3 mL, 21 G needle) into each mouse. Wait approximately 5 min until the mouse is anesthetized (it may take ~25 min).
5. Inject cell suspensions of EMT6, SVTneg2, and fibroblasts, at 3 × 10⁶ cells/mouse in 30 μL (0.3 mL syringe with 30 G needle) into the tail vein of mice (BALB/c, 5 mice/group) on day 1.
6. Repeat steps B4–5 on days 4, 7, and 10.
Critical: Handle cells and injections under a laminar flow hood.
C. Spleen dissection and splenic cell isolation to collect activated NK cells
1. Prepare 2% NMS in PBS solution for staining and washing steps (see Recipes) and maintain on ice.
2. Administer euthanasia solution (10 μL/g body weight, ~300 μL/mouse) intraperitoneally to euthanize the mice on day 10, 4 h after the final cell injection. Following confirmation of euthanasia, sacrifice the mice by cervical dislocation and fix the mouse legs with pieces of paper tape (1 in) on the surgical tray.
3. Wipe the upper abdomen skin with 70% ethanol, harvest the spleen aseptically with dissecting forceps and scissors, and rinse with HBSS solution.
4. Mince spleen into pieces with dissecting scissors in 3 mL of HBSS solution in a 60-mm Petri dish in an ice box.
5. Press the pieces against the bottom of the dish with the plunger of a 3-mL syringe and keep a circling motion until mostly fibrous tissue remains.
6. Draw up and expel the suspension through a 3-mL syringe with a 21-G needle several times to disperse clumps.
7. Expel the suspension into a centrifuge tube (25 mL) through a 70-μm cell strainer. Wash the Petri dish with 3 mL of HBSS solution. Repeat the wash and transfer cells into the centrifuge tube.
8. Wash the collected splenocytes twice with HBSS, followed by centrifugation at 580× g for 5 min.
9. Resuspend the cell pellet in 1 mL of HBSS solution, add 10 mL of ACK lysing buffer (25 mL centrifuge tubes), mix, and incubate at room temperature for 5 min.
10. Remove supernatant and collect splenocytes by centrifugation at 580× g for 5 min at 4 °C. Resuspend the splenocytes in 2 mL of 2% NMS in PBS to block Fc receptors. These splenocytes can be cryopreserved for future use.
Critical: The cell suspension has to be sterile; prepare it under a laminar flow hood. The 2% NMS in PBS solution, which includes mouse IgG, can block Fc receptors on splenocytes and reduce nonspecific binding for flow cytometry. It is highly recommended to use a commercial FcR blocker for precise results; however, the antibody included in the FcR blocker (anti-CD16/CD32b) may have an effect on NK activation during incubation [21].
D. Incubation of cells with the antibody to label NKG2D-positive cells
1. Prepare cell suspensions of all samples:
a. Count viable cells of all samples with a hemocytometer by trypan blue exclusion.
b. Prepare 100 μL of cell suspension in 1.5 mL microcentrifuge tubes, including 106 cells in 2% NMS in PBS (1 × 10⁷ cell/mL).
c. Prepare two vials (106 cells/100 μL in 1.5 mL tubes) for each sample. Label as stained and unstained.
2. Add 2 μL of FITC anti-mouse NKG2D antibody (1:50, ~1.0 μg per 106 cells) to each cell tube of samples marked as stained. Add 2 μL of FITC p53 antibody to the negative-control tube and 2 μL of NMS in PBS to the unstained tube.
3. Incubate the cells with the FITC NKG2D antibody for 45 min at 4 °C in a refrigerator. Cover tubes with aluminum foil to prevent fluorescence quenching.
4. Wash cells with 1 mL of PBS supplemented with 2% FBS:
a. Add 1 mL of PBS solution and centrifuge the cells at 580× g for 5 min at 4 °C.
b. Remove the supernatant, resuspend the cell pellets in 1 mL of PBS, and centrifuge the cells at 580× g for 5 min at 4 °C.
c. Resuspend the cell pellets in 50 μL of PBS solution in a 1.5 mL microcentrifuge tube.
Critical: Fluorescence quenching may occur in the presence of light. Keep samples in the dark (e.g., covering with aluminum foil) as much as possible when handling fluorescent antibodies.
E. IFC data acquisition
1. Start up and calibration of ImageStreamX Mark II:
a. Power up the system with the computer and then launch the ISX application.
b. Check the buffer containers (sheath fluid, cleanser, sterilizer, debubbler, rinse), to ensure that all are full and the waste tank is empty.
c. Select Startup; the instrument will flush the ISX system and load sheath fluid.
d. In the Calibration view, press Stat all calibration and tests. When all tests pass, the ASSIST button turns green, indicating the system is ready to run the samples.
2. Select File experiment template from the File menu:
a. Select File and load the default template.
b. Press Load and load unstained controls (EMT6, splenocytes of mice injected with EMT6 cells; SVTnegs, splenocytes of mice injected with SVTneg2 cells), negative controls (EMT6 or SVTneg2 stained with FITC p53 antibody), and a positive control (EMT6 stained with FITC-conjugated NKG2D antibody) in a 1.5 mL microcentrifuge tube.
c. In the Illumination section, check and turn on the appropriate lasers (405, 488, 642 nm).
d. Create dot plots and regions to identify the cells or events to collect (5,000 or the number you require).
e. Set the acquisition parameters, including file name, destination folder, number of events, and population(s) to collect for your experiments.
f. Choose/accept file format, either .rif (IDEAS) or .fcs (FACS software); both are shown in the file drop-down menu.
3. Continue collecting all experiment files using consistent instrument settings (brightfield will be in channels 1 and 9, SSC ~40 mw channel 6, and the cells to collect R1 using bright area vs. aspect ratio to identify single cells) and transfer files to your USB drive.
4. Save an experiment template by selecting Save Template from the File menu for further assays.
5. Shut the system off by pressing the Shutdown button. The system will sterilize itself in ~40 min.
Data analysis
IFC data analysis using IDEAS®
1. Double-click the Start Analysis button and select the data file to open (.rif, positive; EMT6 stained with FITC NKG2D).
2. Apply compensation that will set up the template for data analysis. This step occurs when opening a rif. Choose a compensation matrix or create one. Click Next.
3. Apply template to use the default FeatureFinder6.2.
4. Set image display properties: IDEAS will now optimize the settings for your image display; choose Ch02, Ch04, and Ch06 for stained NKG2D, brightfield (BF), and side-scatter (SSC), respectively.
5. Name your sample files. It is recommended to keep the default names.
6. Select a Wizard to begin analysis; double-click Begin Analysis (Figure 1).
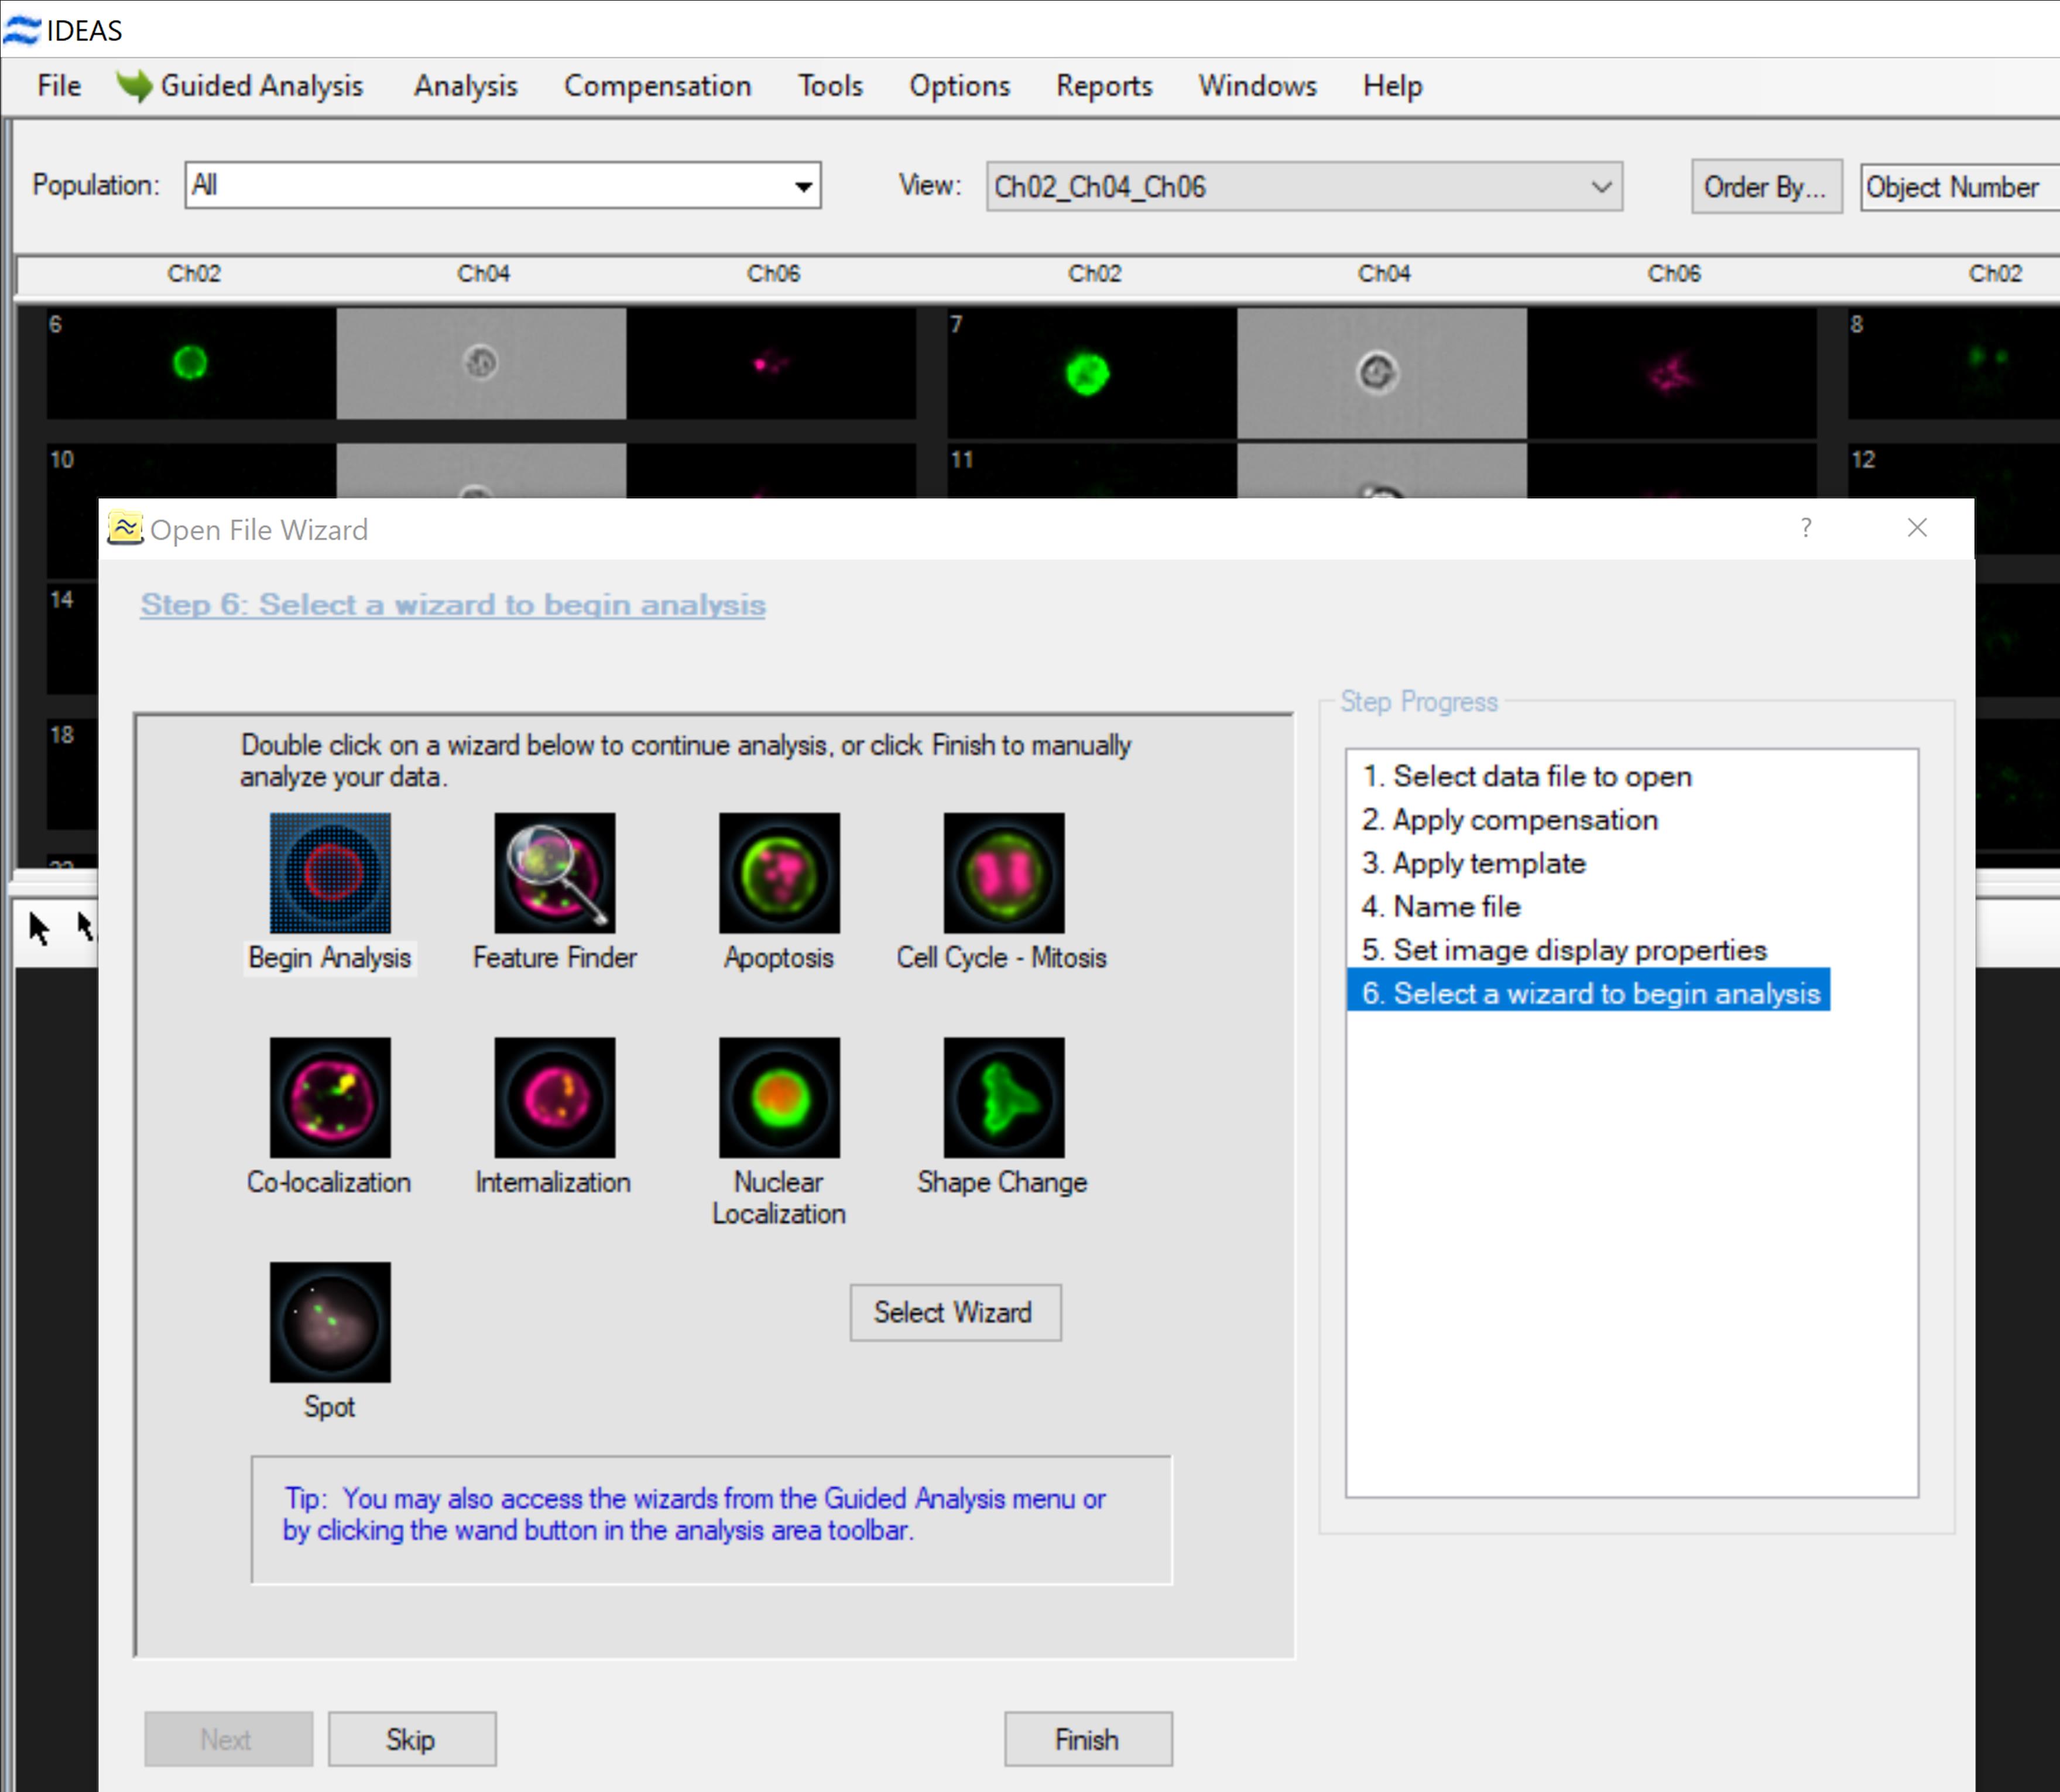
Figure 1. Start analysis of imaging flow cytometry (IFC) data in splenic cells, including the NKG2D+ population. The compensation, template, and image properties were applied to the raw image files and Wizard analysis–characterized flow cytometry data with cell images.
7. Every Wizard begins the same set of graphs for choosing focused, single, positive events (Figure 2). The specific application wizards listed above will also help create special features. We create one for further analysis of NK cells.
a. Gate cells in best focus. A histogram of the brightfield channel gradient RMS (root mean square) values for the “All” population is added to the analysis area (Figure 2, bottom-left corner). Click on the bins in the histogram to view the images in each bin. The cells with better focus have higher gradient RMS values. Begin your region at the bin after the gradient RMS value you wish to exclude (such as dead cells or noncellular particles), and continue the region to the maximum in the plot (R1 in Figure 2, bottom-left corner).
b. Gate single cells. A scatterplot of the brightfield area versus aspect ratio for the population chosen in step 7a is added to the analysis area (Figure 2–3, bottom-middle side). Single cells will have an intermediate area value and a high aspect ratio. Click on the dots to view the image associated with that dot. The images are presented in the order defined by the drop-down menu above the image gallery (Figure 2, top-left corner). You may choose an already existing population and justify with a rectangle (R2) to exclude dead cells or noncellular particles, by clicking individual cells to visualize in Ch2 and Ch4.
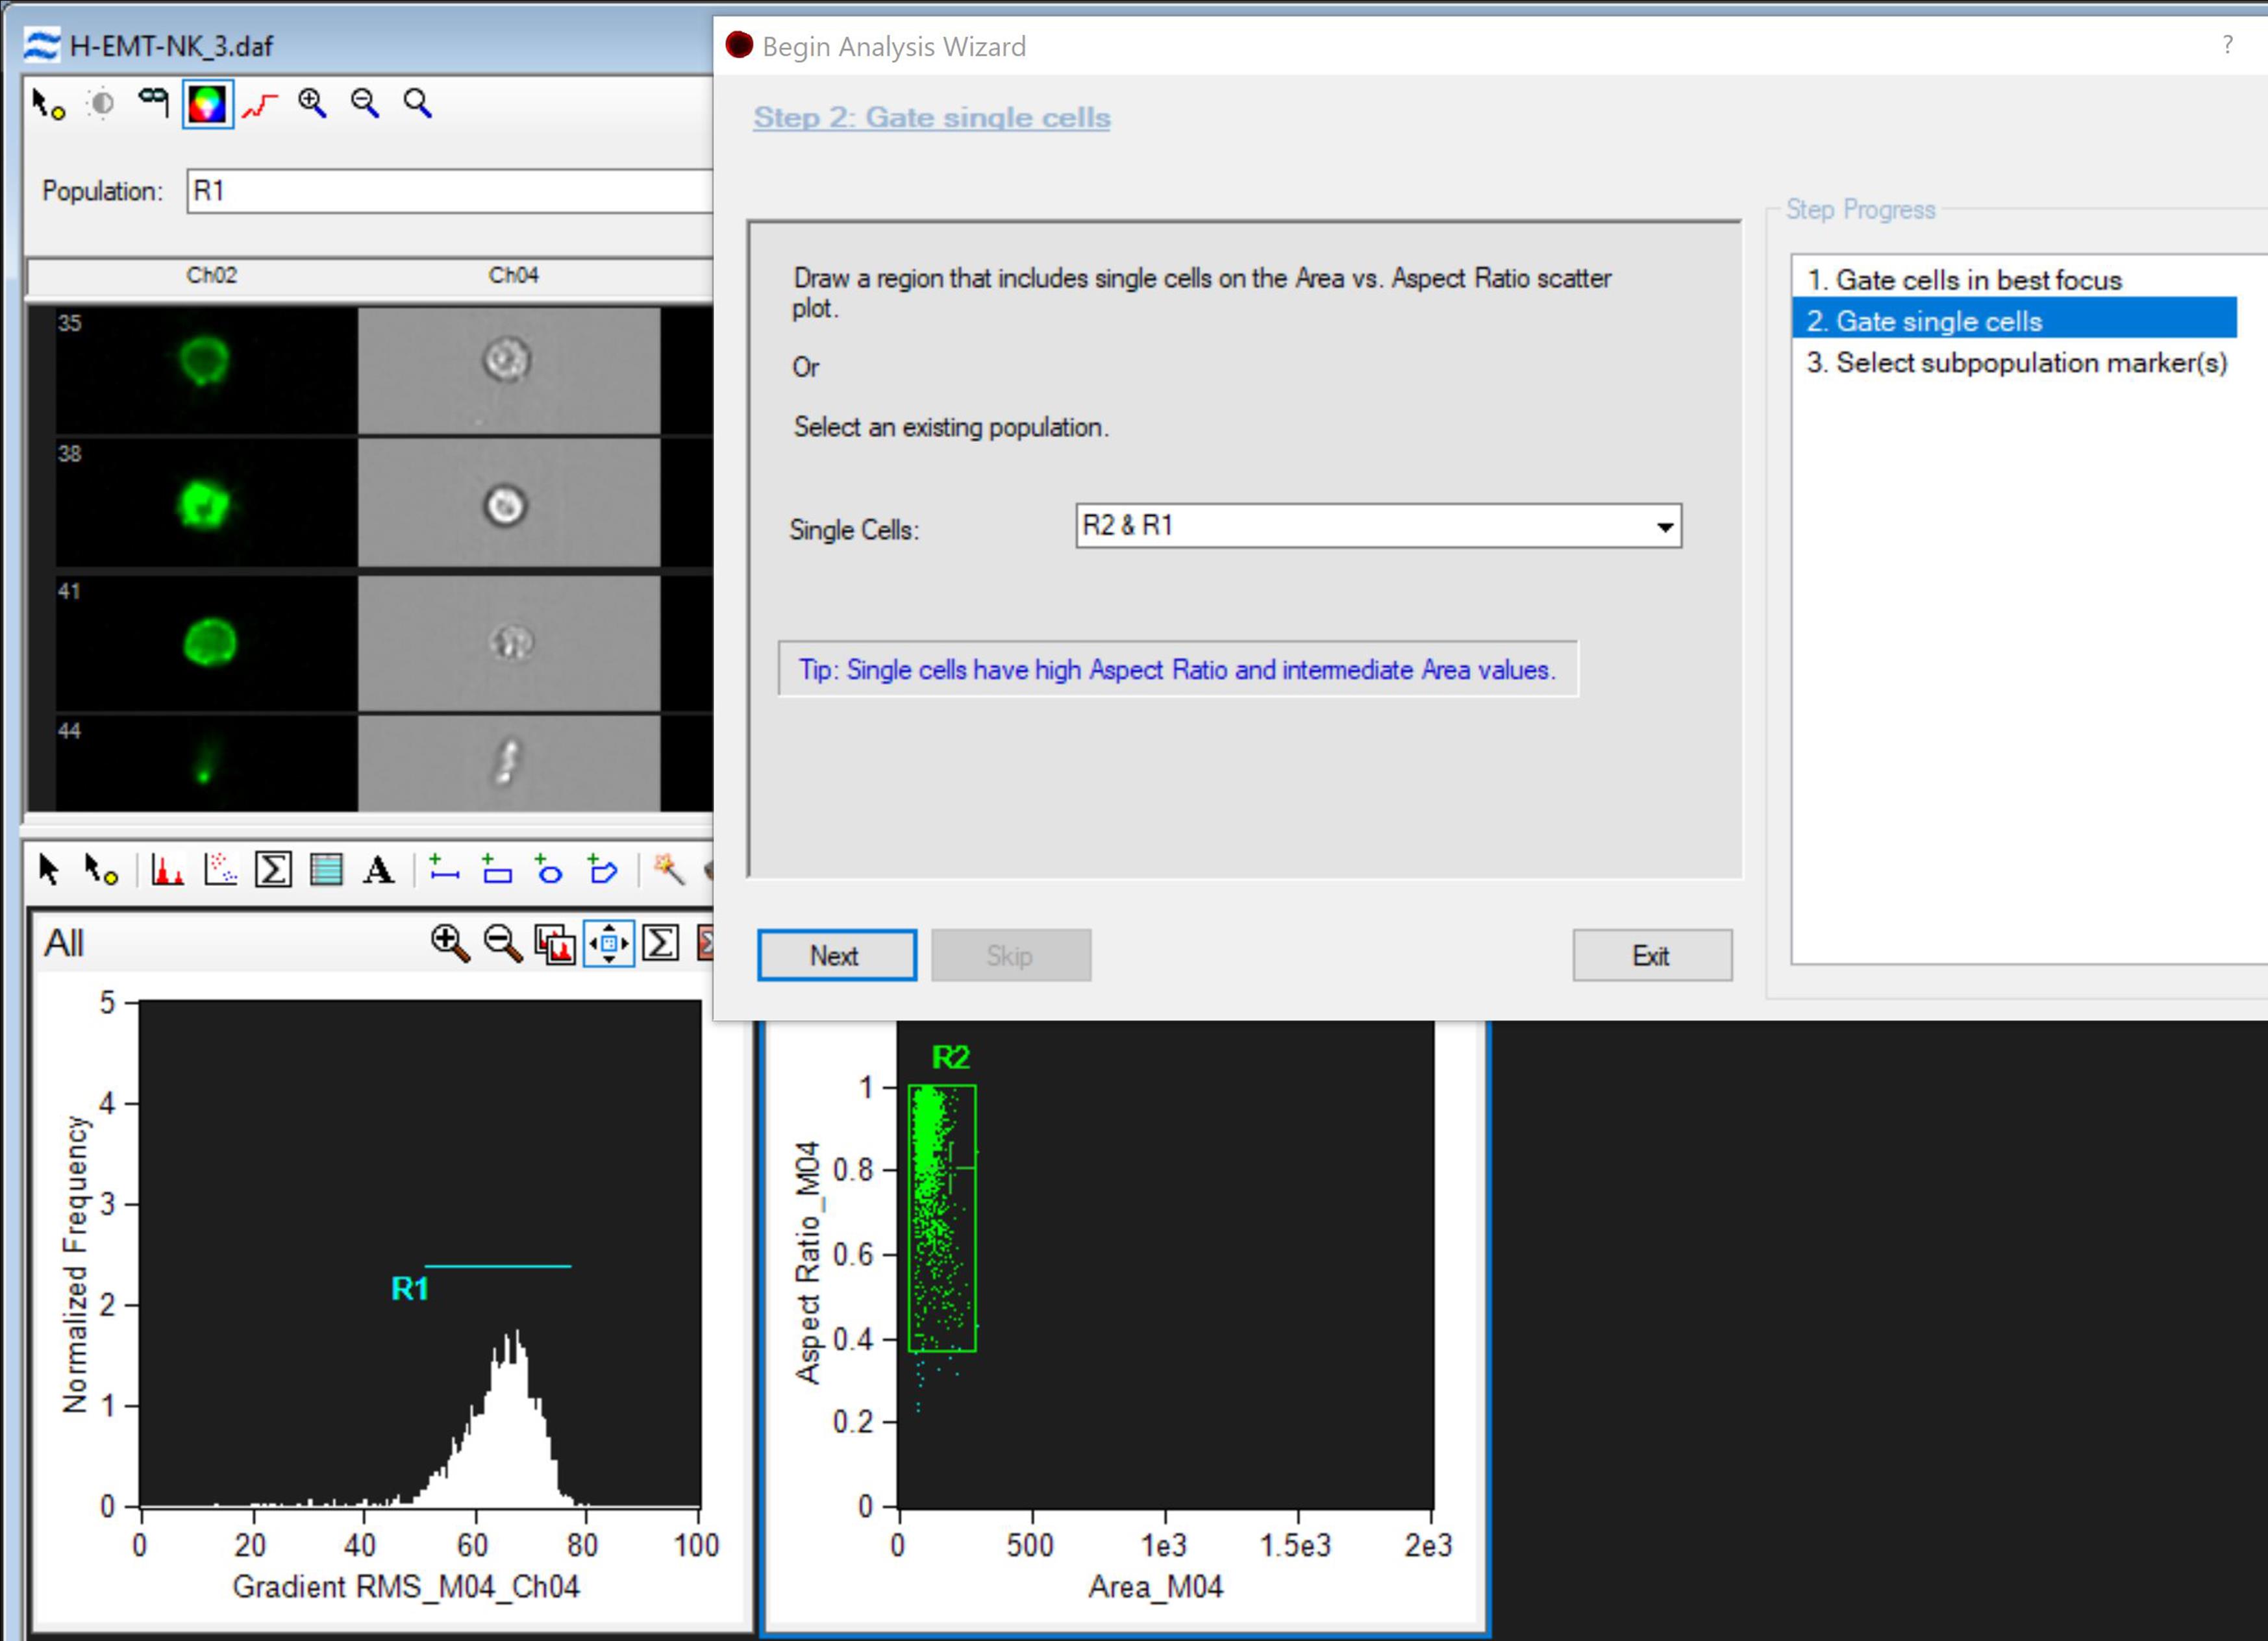
Figure 2. Begin analysis wizard. Gate cells in best focus in a histogram using the brightfield channel gradient root mean square (RMS) values, gate single cells in a scatterplot using the brightfield area versus aspect ratio with bin (R1) and rectangle (R2), and then select the subpopulation marker in the scatterplot using fluorescence intensity.
8. Use the sequential gating method to identify NK-NKG2D+ cells with images (Figure 3):
a. Select the subpopulation marker(s). Choose Ch02 to identify the population (NKG2D+) based on intensity and Ch06 as SSC to characterize the granular density of cells. Click Next to add the scatterplot to the analysis area (R3) (Figure 3).
b. Subpopulation characteristics: Select the scatterplot of the subpopulation with the polygon region and press the right button; the menus show all characteristics of the subpopulation that can be modified (Figure 3).
c. Define the NKG2D subpopulation: Click Graph Properties, name NKG2D in the Title, and select Intensity_MC_Ch02 in X Axis Feature and Intensity_MC_Ch06 in Y Axis Feature (Figure 4). Additional features of these channels can be selected to further distinguish subpopulations.
d. Refine NKG2D+ NK cells: Click the images of cells to define cells in the circled subpopulation (green +). By comparing fluorescence intensities and cell sizes in the fluorescence field with the brightfield, redefine the region (R3) of NKG2D cells by modifying the shape and size of the circle (Figure 5). Then, label the R3 using particular masks and characteristics based on the corresponding negative samples.
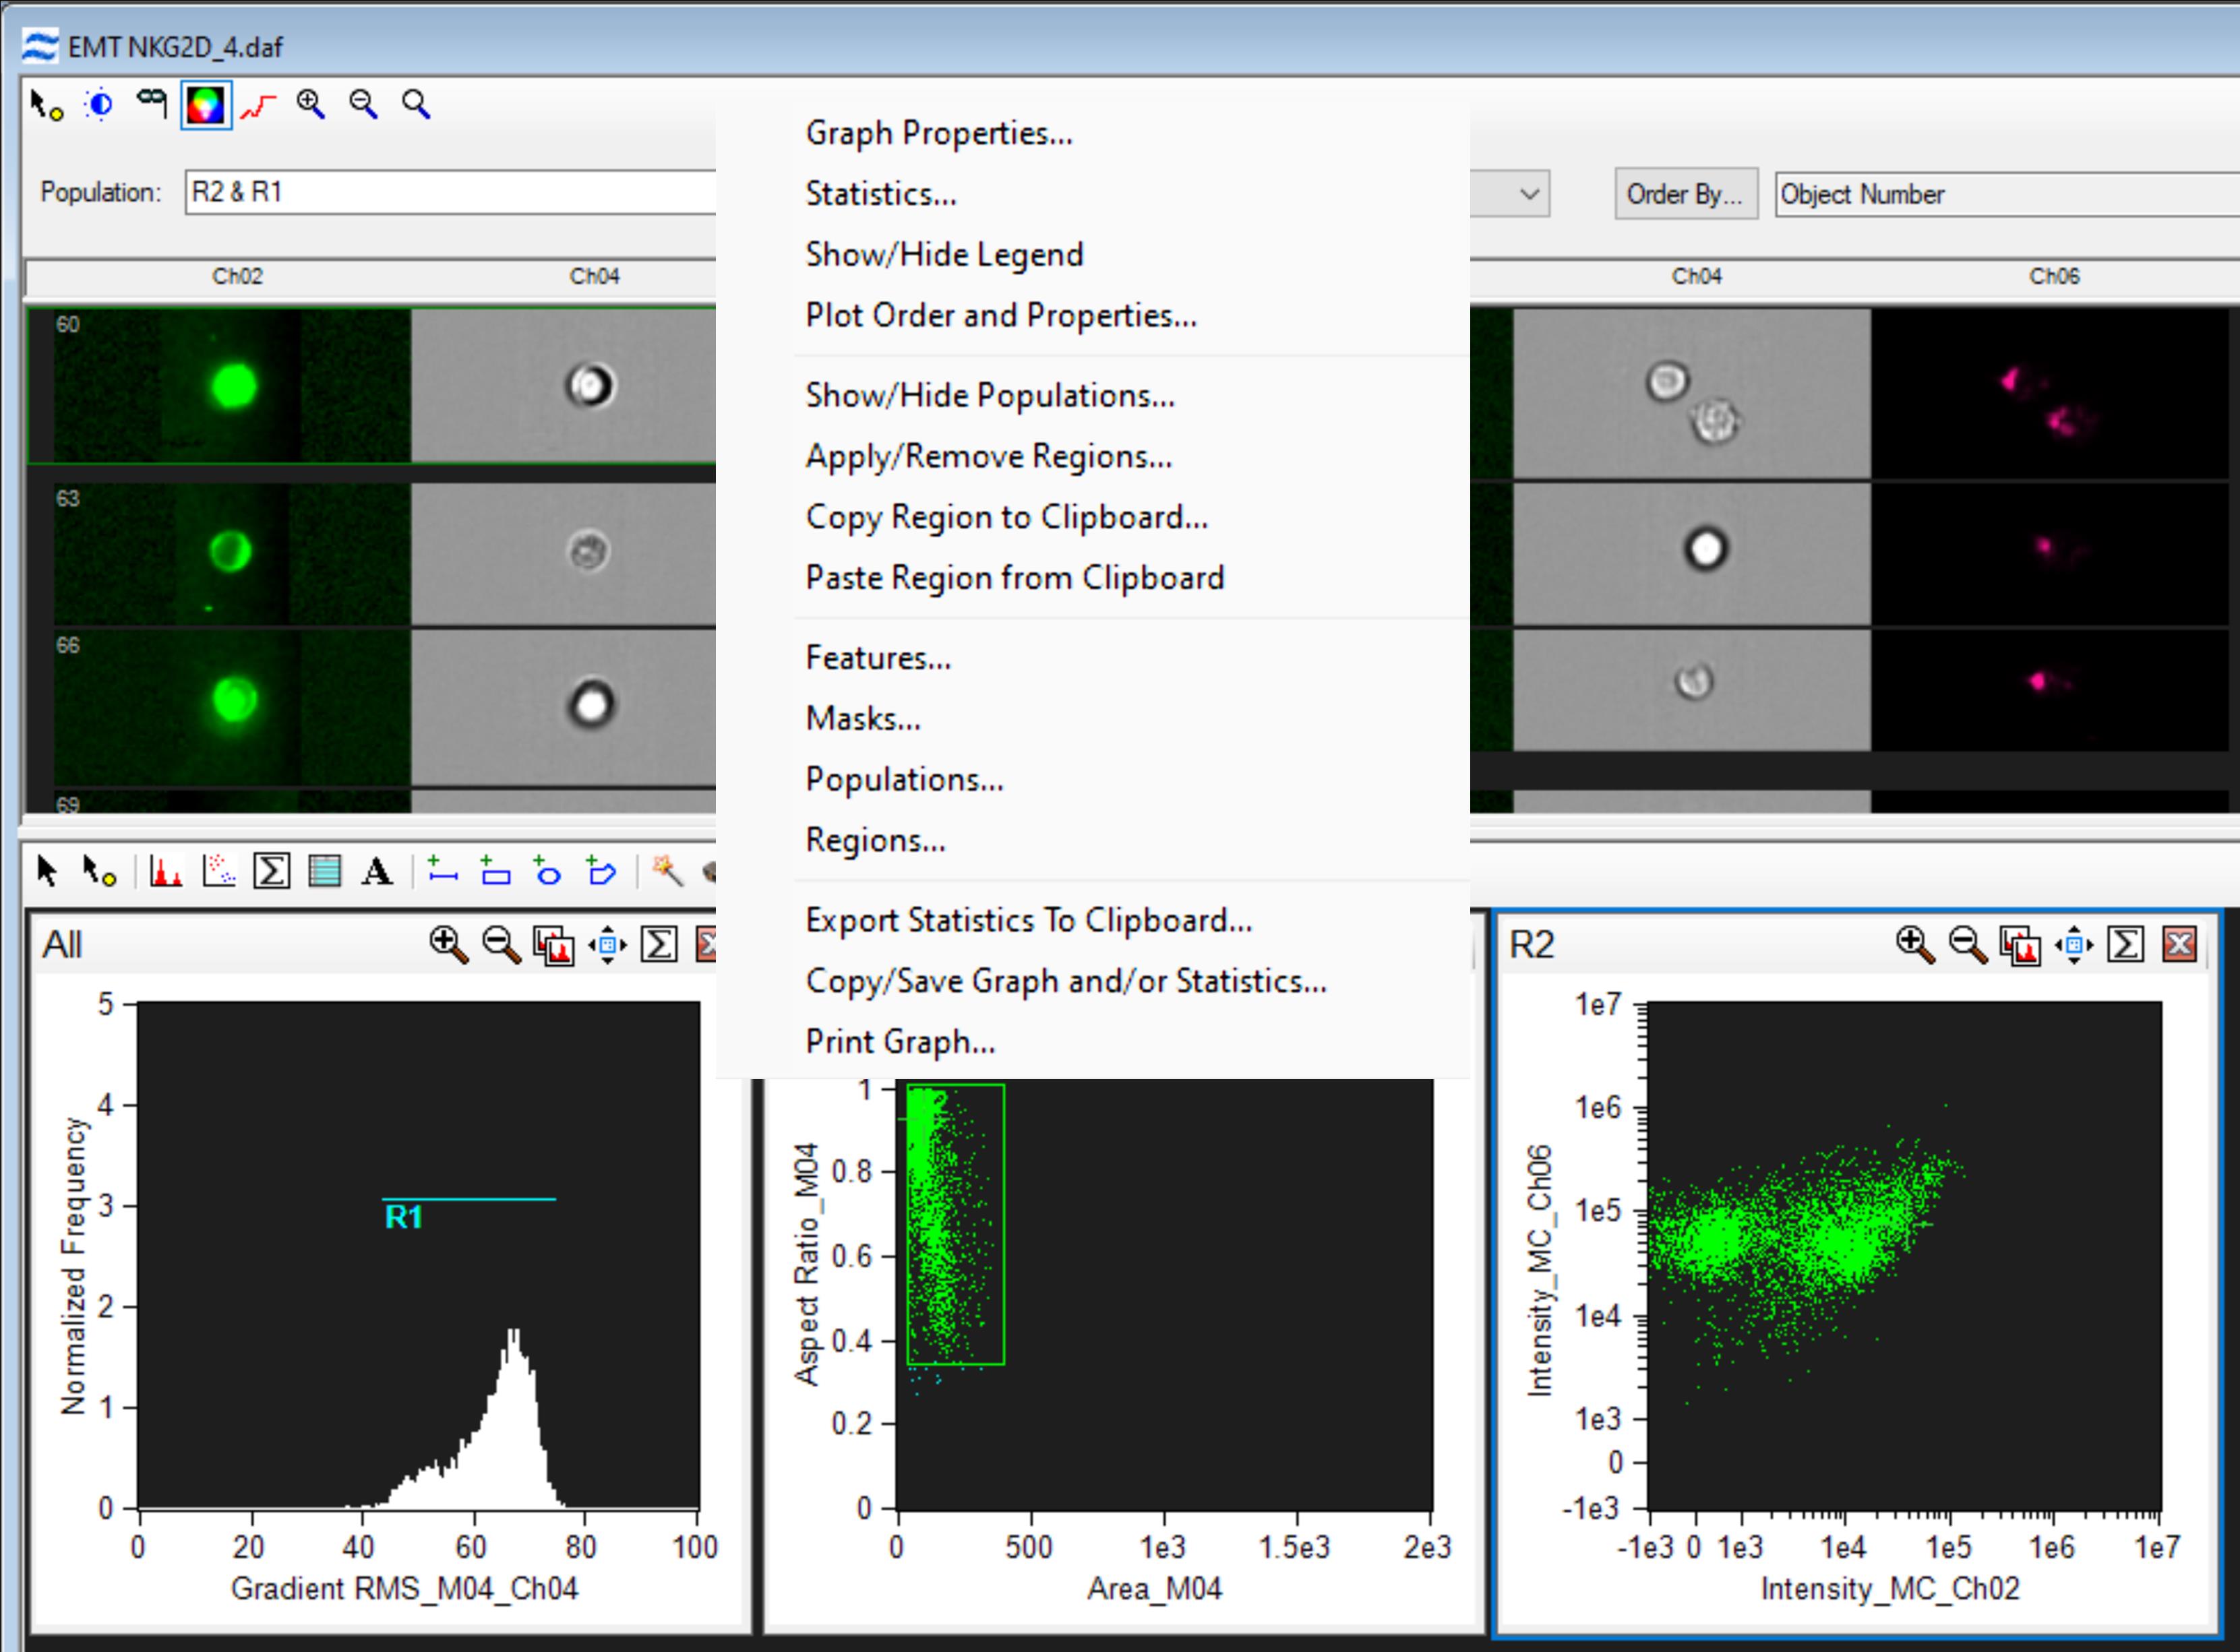
Figure 3. Characteristics of the subpopulation scatterplot. Characteristics of the subpopulation include graph properties, statistics, features, and others that can be further defined or modified.
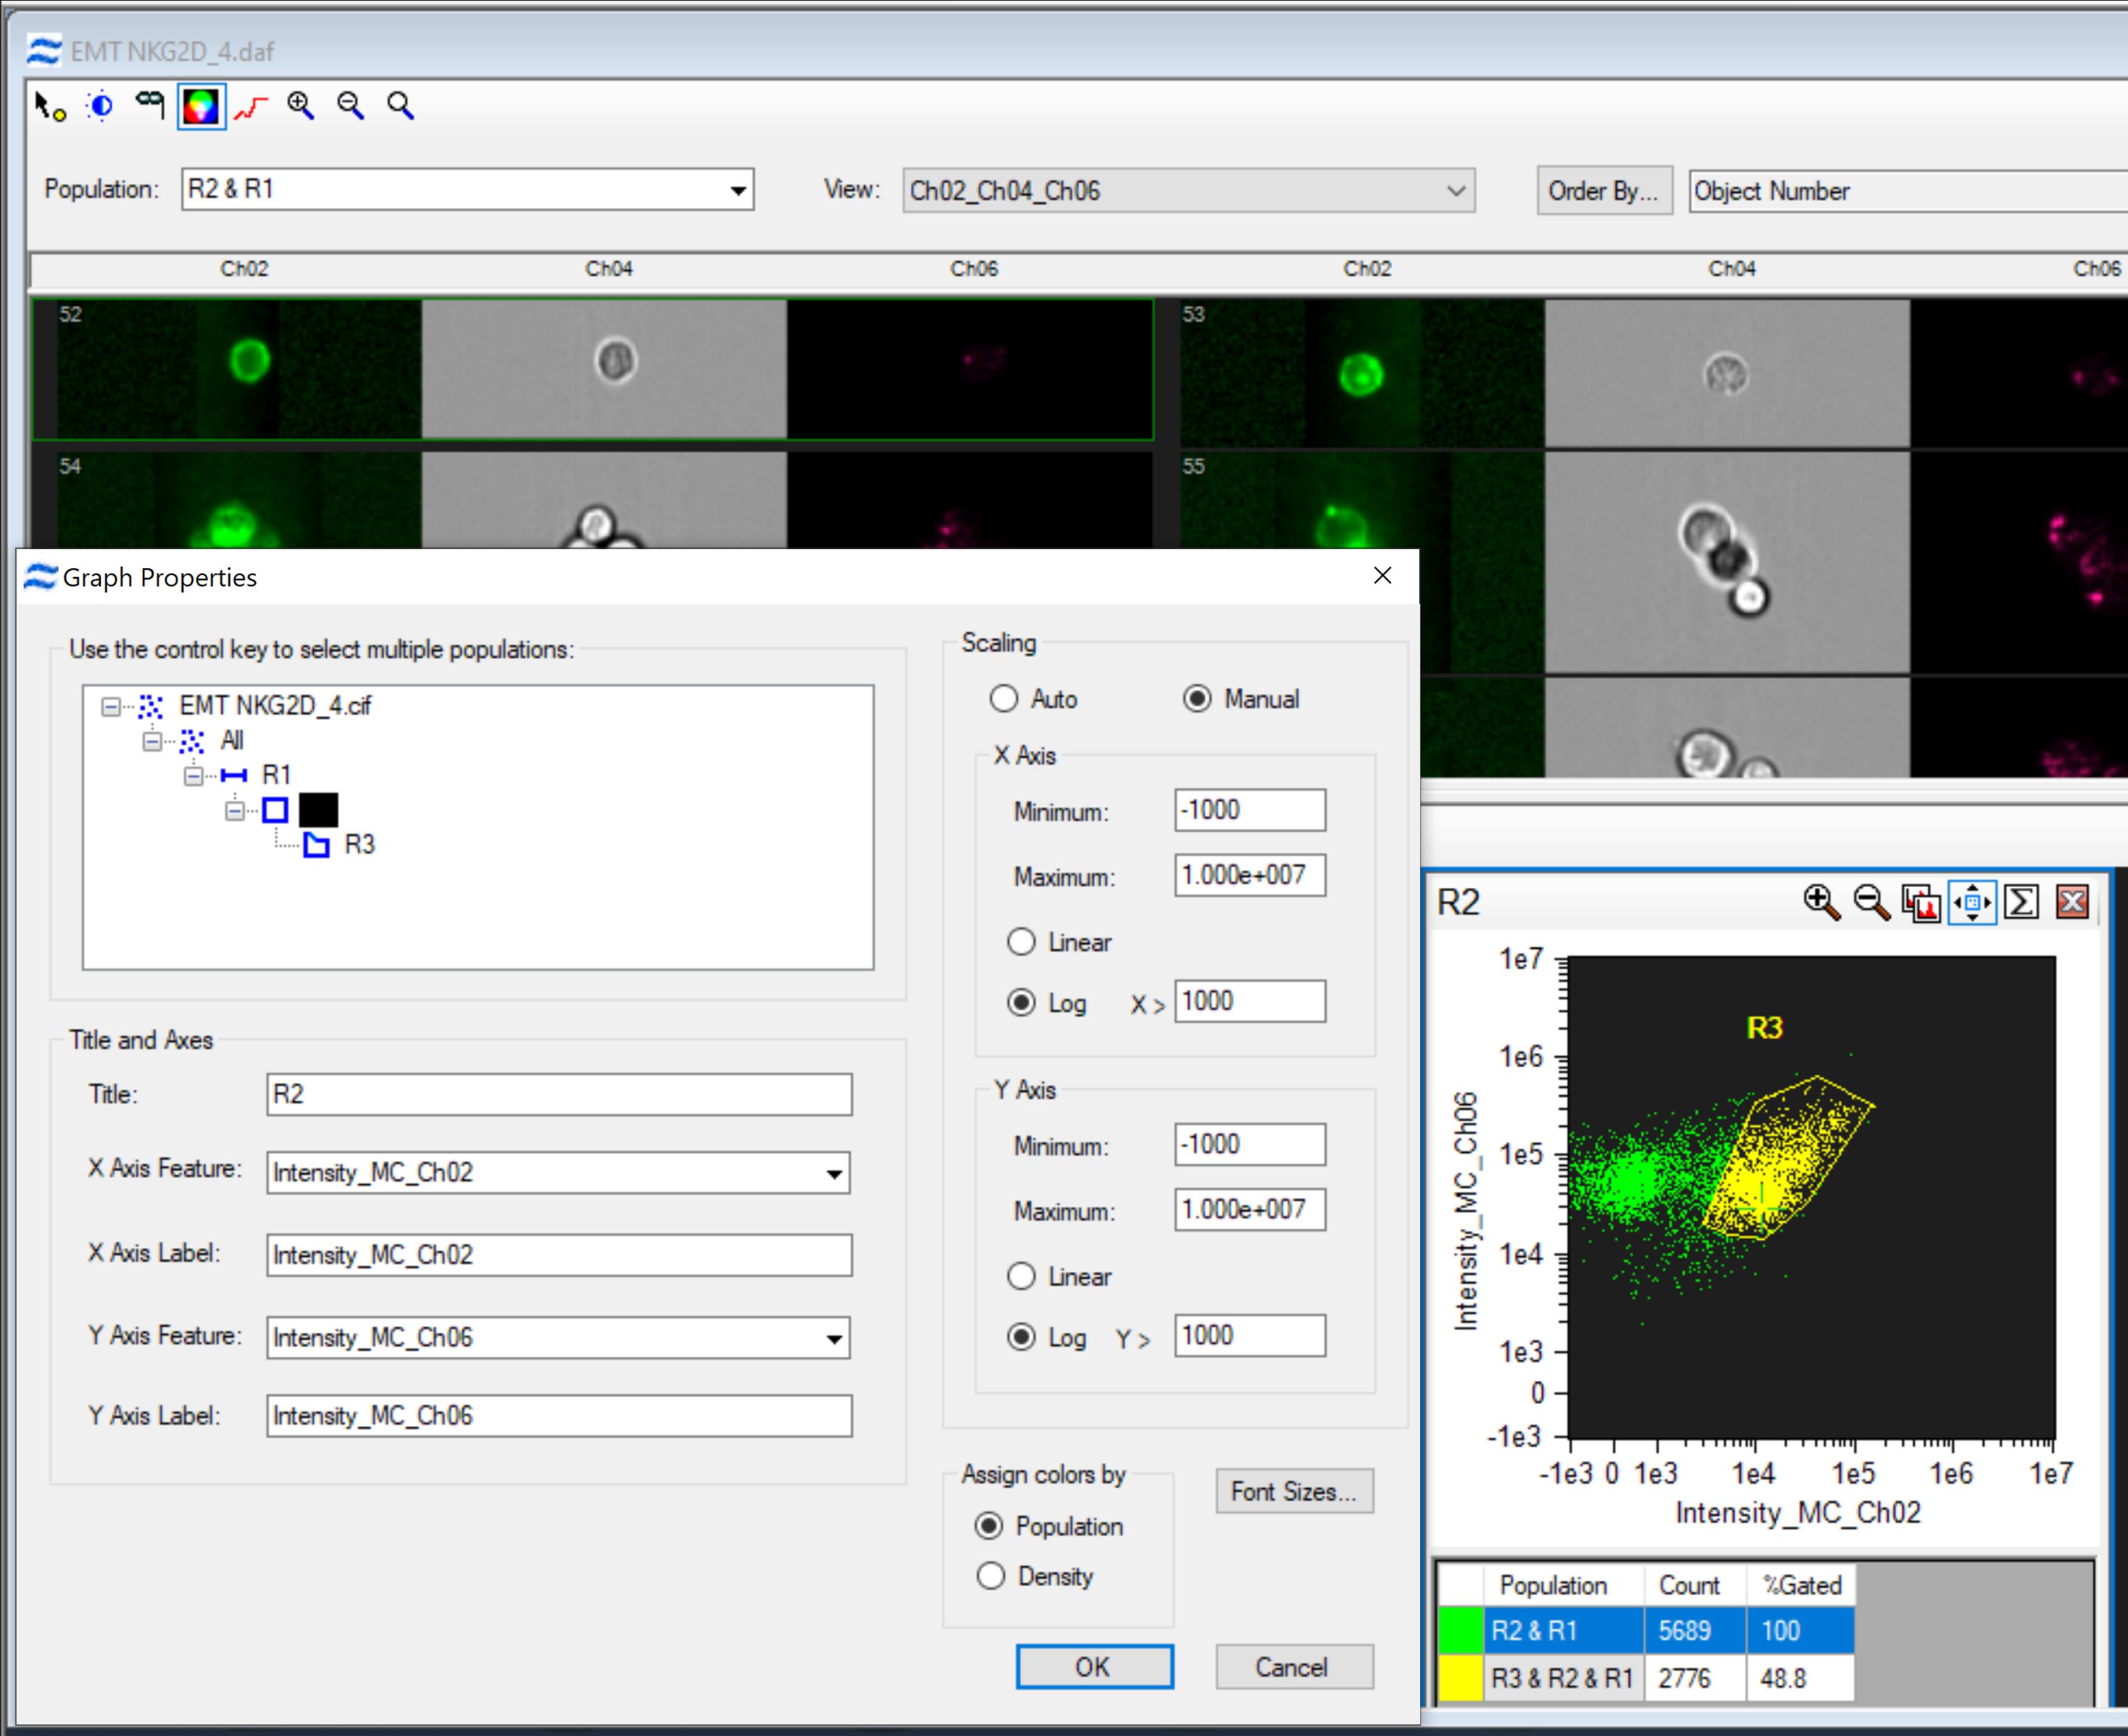
Figure 4. Defining the graph properties of the NKG2D subpopulation. Gating the NKG2D+ cells with the polygon region is defined as the fluorescence intensity to brightfield intensity (Intensity_MC_Ch02 vs. Intensity_MC_Ch06). Other features from Ch02 and Ch06 are available to be selected for further distinguishing subpopulation(s).
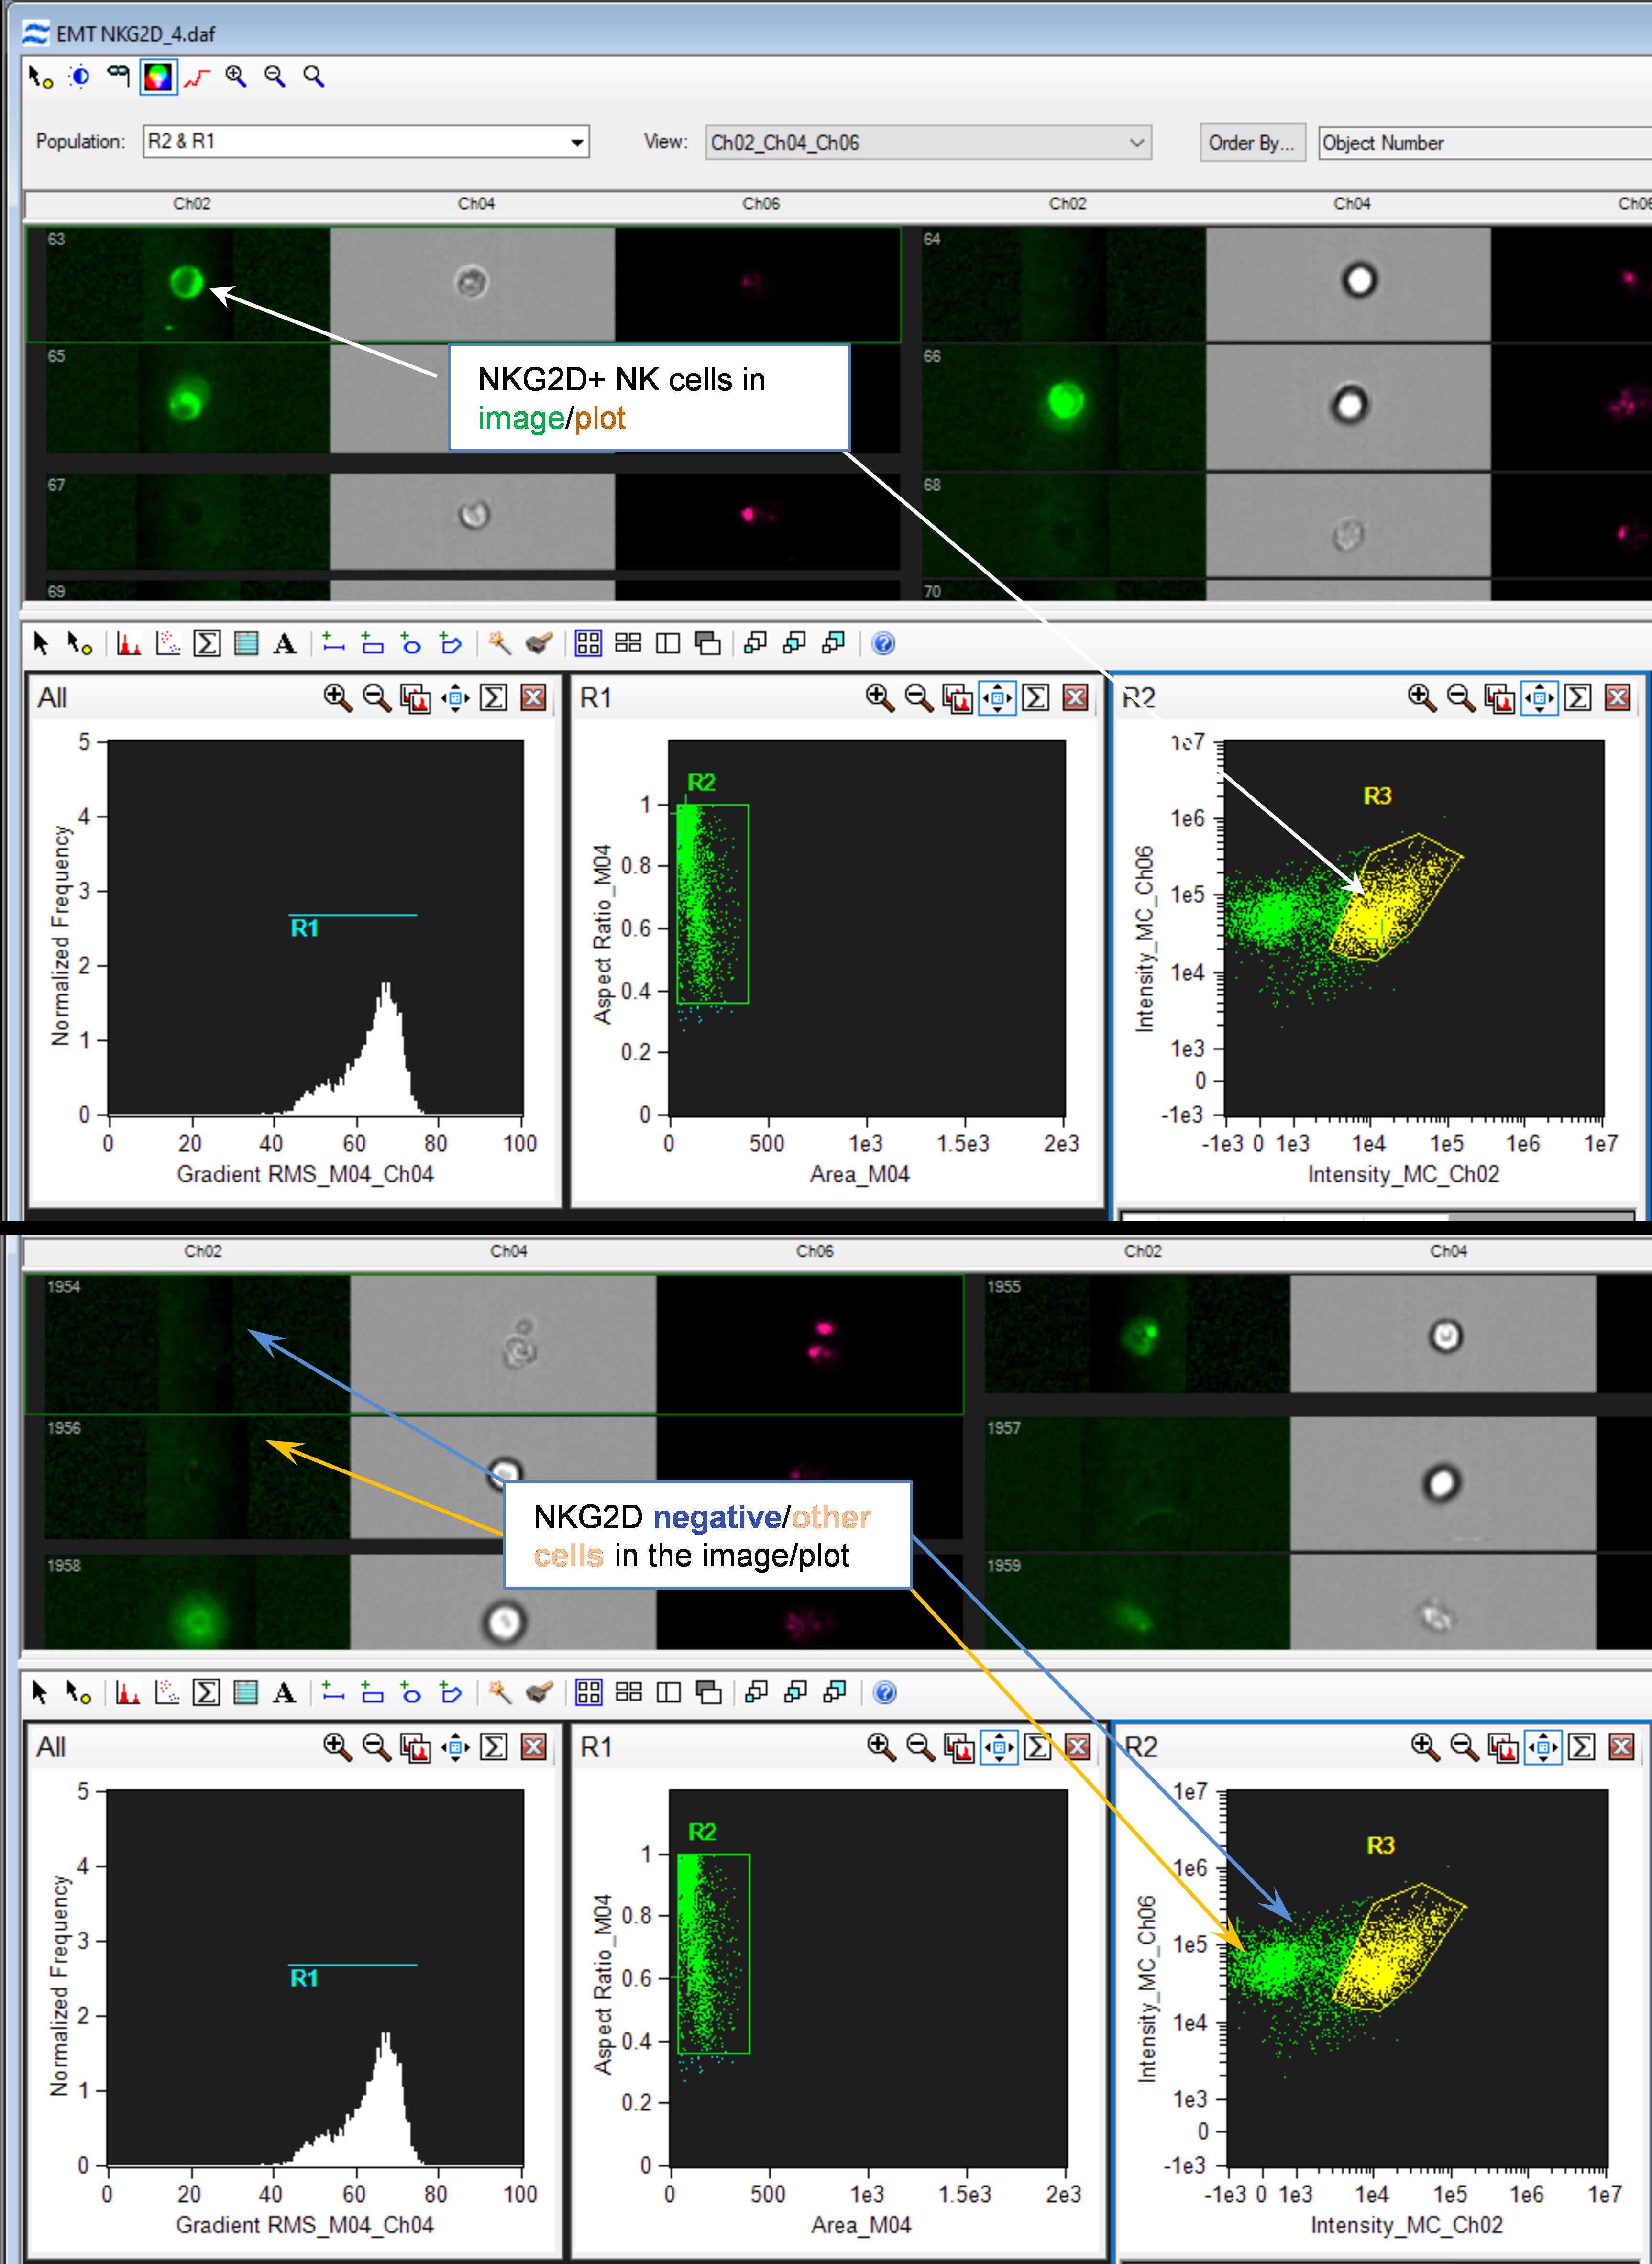
Figure 5. Refining NKG2D+ natural killer (NK) cells. The subpopulation of NKG2D+ NK cells was circled by adjusting the polygon region of the gate, including only NKG2D+ cells with certain intensities and sizes.
9. Click Save the file as NKG2D Template (.ast).
10. Select the data file among the unstained controls (either EMT6 or SVTneg2) as step 1 and follow steps 2–8 [applying NKG2D (.ast) as the template in step 3] to further refine NKG2D-negative cells in the polygon. Save the refined file as NKG2D negative template (.ast).
11. Select the data file among the negative controls (either EMT6 or SVTneg2 stained with FITC p53 antibody) as step 1, and follow steps 2–8 [applying NKG2D (.ast) as the template in step 10].
12. Save the refined file as NKG2D negative template (.ast) for sample analysis. The cell population in the polygon is applied as background fluorescence to refine the NKG2D+ population.
13. Perform batch analysis on all data files in the experiment using the compensation matrix and analysis template, NKG2D (.ast), that you saved in step 12.
Validation of protocol
This protocol has been used and validated in the following research article:
• Uddin et al. [8]. p53 missense mutant G242A subverts natural killer cells in sheltering mouse breast cancer cells against immune rejection. Exp Cell Res. 2022. 417(1): p. 113210
Briefly, our studies have shown that it is more precise to gate NKG2D+ cells by selecting a scatterplot with the polygon region (step 8b in Data analysis; Figures 4 and 5). We selected a polygon as the template, in which background fluorescence was justified with nonspecific IgG (FITC-p53), to double-gate and characterize the NKG2D+ cells in all samples (Figure 6B). The numbers of splenic NKG2D+ NK cells were quantitatively assessed in mice after injecting mouse SVTneg2 cancer cells (missense mutant p53 G242A+/+), comparing with EMT6 cancer cells (wild-type p53) and fibroblasts (wild-type p53) (Figure 6). This showed that p53 G242A+/+ (corresponding to human p53 G245A+/+) significantly decreased NKG2D+ NK cells by more than 2-fold (p < 0.001).
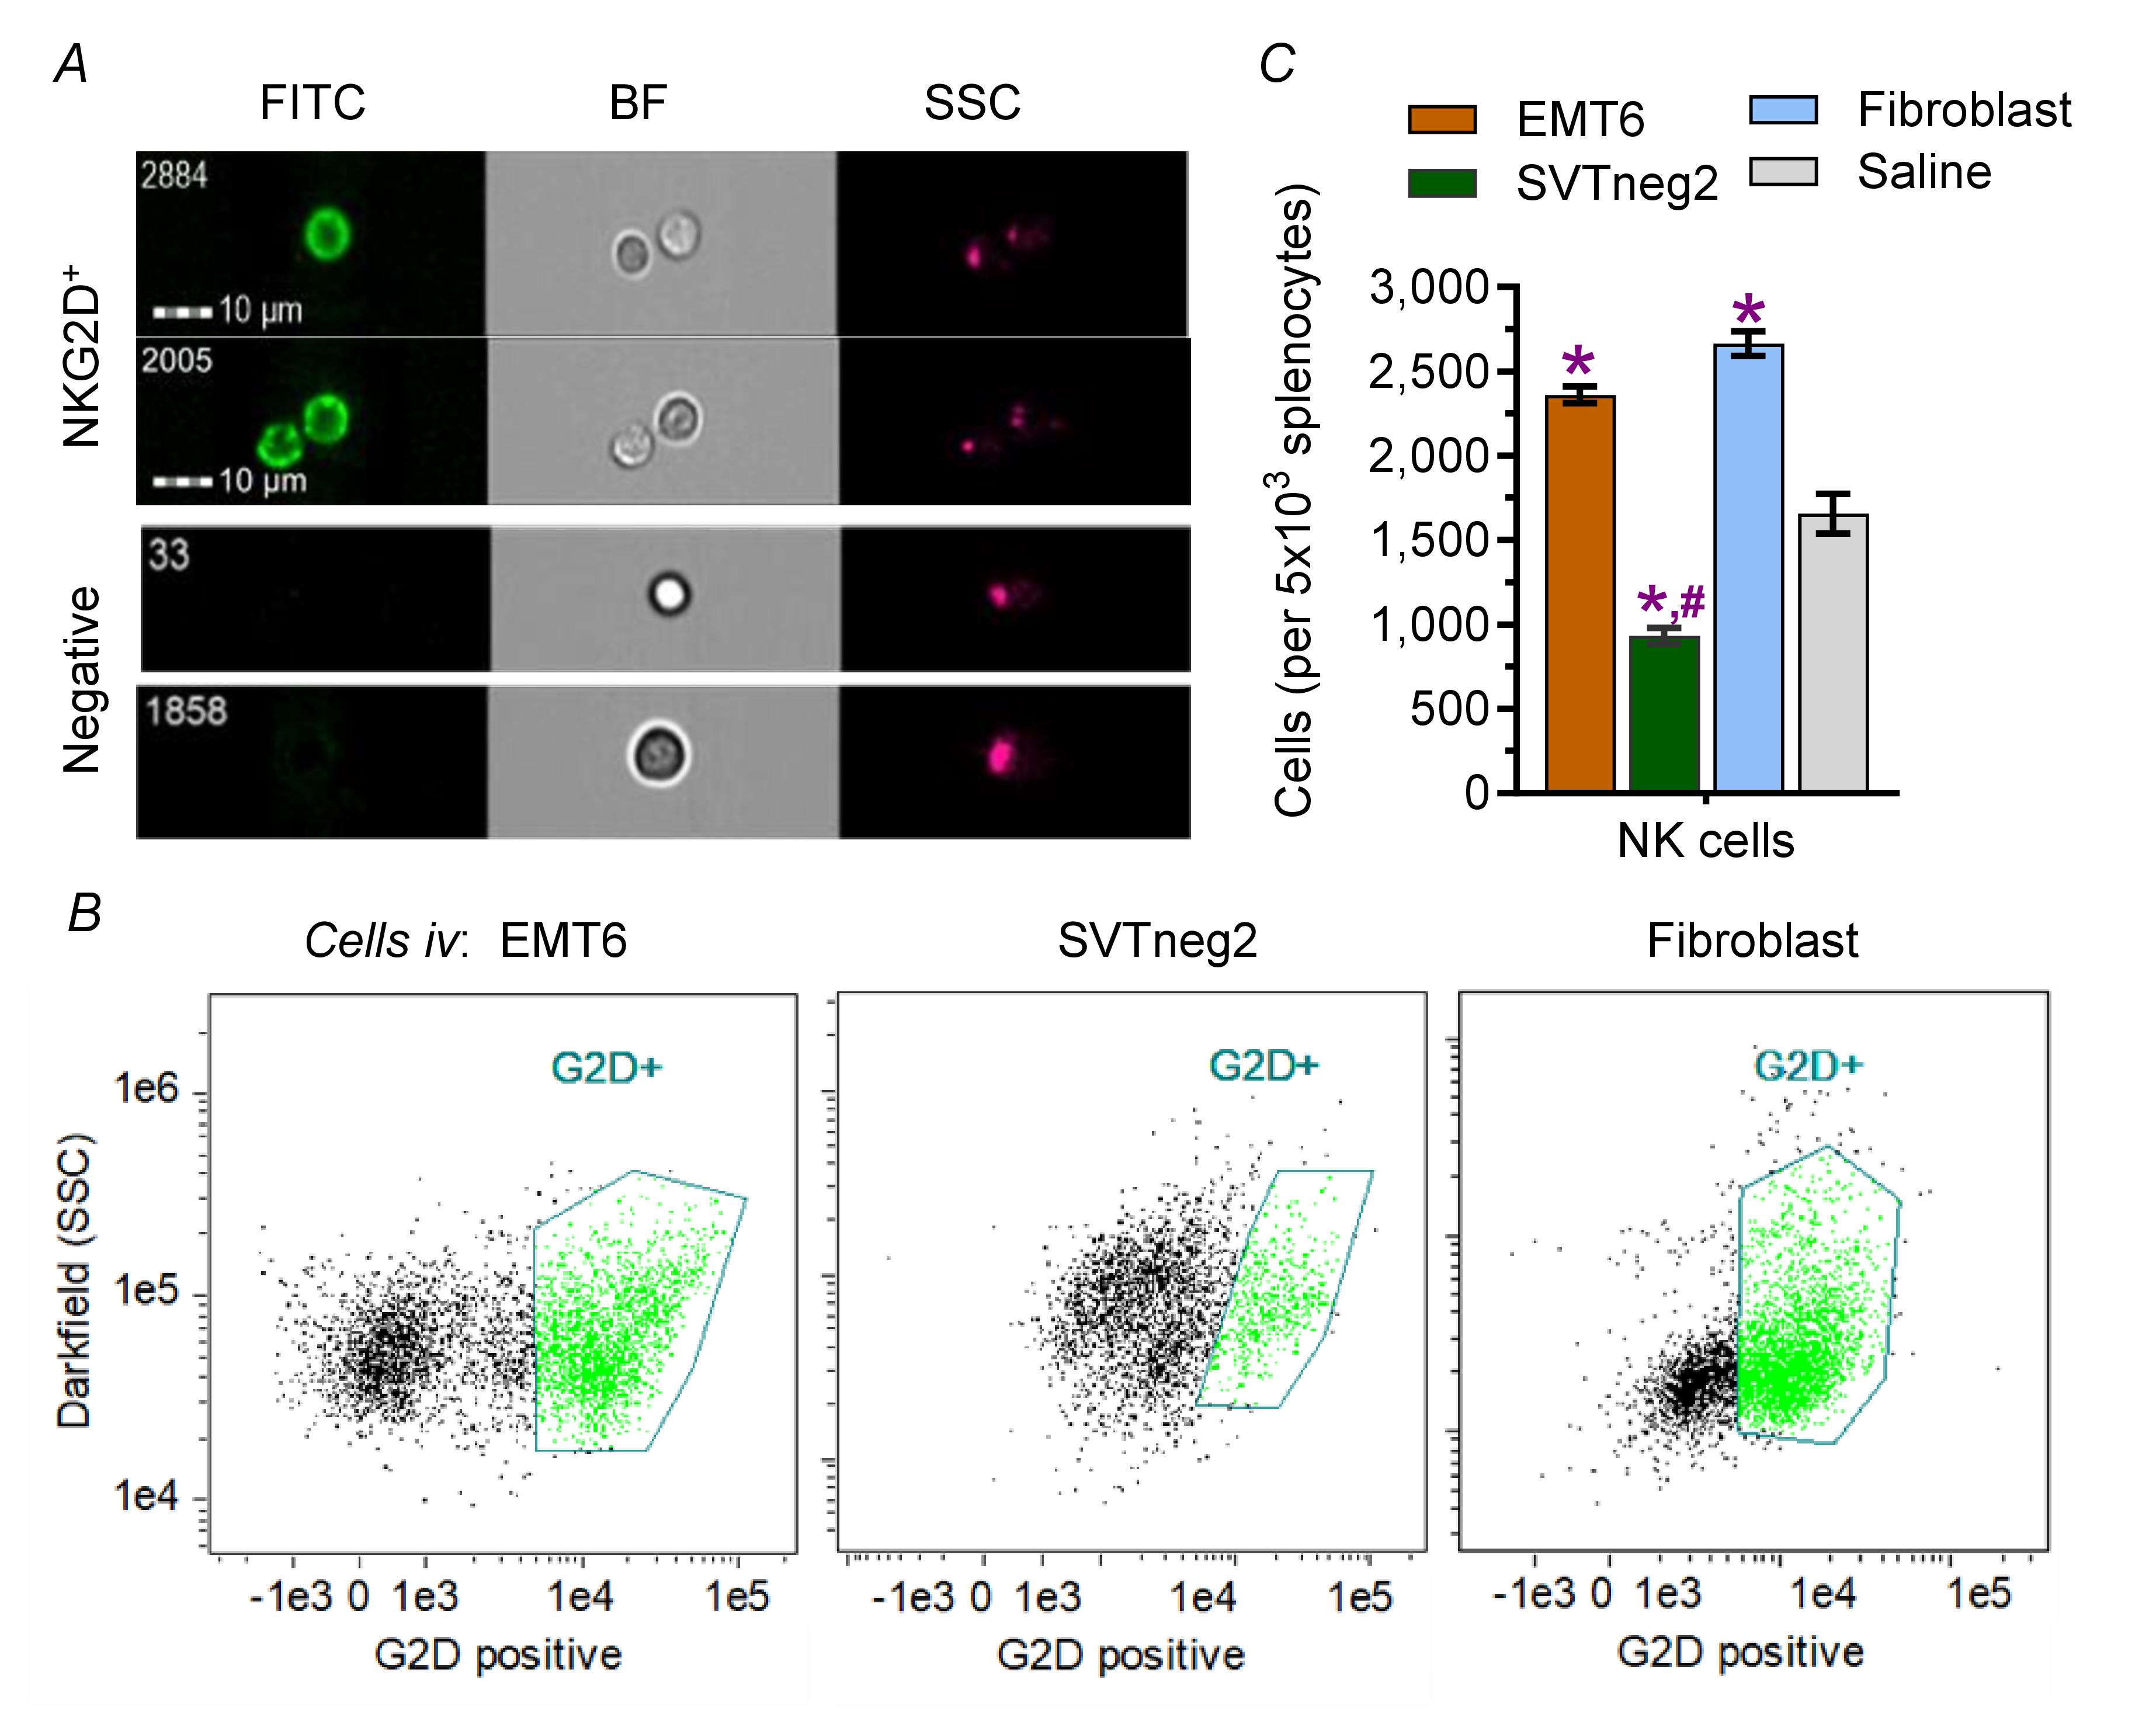
Figure 6. Activating effects of p53 in cancer cells on mouse splenic natural killer (NK) cells. Cells (3 × 10⁶ cells/mouse) of EMT6 (wt-p53) or SVTneg2 (mm-p53 G242A) breast cancer lines and normal fibroblasts (wt-p53) were administered into the tail veins of mice (WT Trp53, once every 3 days; on days 1, 4, 7, and 10; 5 mice/group). Spleens were dissected on day 10, and isolated splenocytes were analyzed using imaging flow cytometry (IFC) following incubation with NKG2D antibody for epitope detection. (A) NK cells were characterized by FITC-NKG2D+ (FITC green) and compared with brightfield (BF) and side-scatter (SSC). (Top two panels) NKG2D+ NK cells, based on fluorescence in the FITC channel and cell sizes in both FITC and BF channels. (Bottom two panels) NKG2D-negative cells, including NKG2D- NK cells and other splenocytes. (B) Populations of NK cells. NKG2D+ (G2D+) is depicted. NK cells were gated using the polygon including NKG2D+ cells. FITC-p53 was applied as the background fluorescence, as described in Data analysis (steps 11–12). (C) SVTneg2 cancer cells decreased NK cells among mouse splenocytes at the end of the series of cell injections. Multiple comparisons were carried out via one-way ANOVA with Tukey’s post hoc test. *p < 0.001 compared with mice injected with saline; #p < 0.001 compared with mice injected with EMT6 cells or fibroblasts. Prism 9.1 was used for statistical analysis and for generating Figure 6C.
General notes and troubleshooting
General notes
In this protocol, we focused on assessing the alterations of cytotoxic NKG2D+ NK cells in mouse spleens. Note that NKG2D+ cells also include approximately <1% of other immune cells, and not all activated NK cells. This simple and direct assessment can screen other agents for activating cytotoxic NK cells, and other cytotoxic analyses are necessary to characterize the roles played by NK cells.
After inquiry of the events (step E3), a strategy is implemented to reliably distinguish different cell populations based on the identified cell image with the surface marker, NKG2D. We first gated on cells using a dot plot depicting forward and side scatter parameters (Figure 2). We then excluded cell doublets using forward scatter height and side scatter height with cell images (Figures 3 and 4). The template is further characterized with a negative control and with minor modifications to different experimental conditions.
Troubleshooting
Problem 1: Clogging or low flow and low cell counts.
Possible cause: Improper cell preparation, such as clogged filters, air bubbles, or insufficient pressure.
Solutions: 1) Strain samples through a 70 μm nylon mesh strainer before sample loading. 2) Following the operation process of the instrument, refill all different solutions to the top and tightly close the containers before turning on the IFC instrument. It also helps to use an anti-clumping buffer, such as EDTA or Accumax, to replace the PBS solution for antibody incubation.
Problem 2: Poor image quality.
Possible cause: Issues with the fluorescent conjugate and sample preparation.
Solutions: Selected fluorescent conjugates should be consistent with the laser power and detection filters of the IFC instrument. Incubate fluorescent antibodies with freshly prepared cell samples. Also, separated cell suspension and optimal conditions for antibody incubation should help to improve the image quality.
Acknowledgments
Conceptualization, Y.Y.L.; methodology, M.S.M., M.B.U.; formal analysis, M.S.M., M.B.U., M.N.A.; investigation, M.S.M., M.B.U.; writing—original draft preparation, M.S.M., M.N.A., M.B.U.; writing—review and editing, M.N.A., M.S.M., M.B.U., Y.Y.L.; supervision, Y.Y.L.; project administration, Y.Y.L. All authors have read and agreed to the published version of the manuscript.
This research was supported by National Institutes of Health Grants (R15CA167476) from the National Cancer Institute and (P20GM103424-11) from the National Institute of General Medical Sciences (to Y.Y.L.).
All animal experiments were approved by the Institutional Animal Care and Use Committee at the University of Louisiana at Monroe and carried out in strict accordance with good animal practice as defined by NIH guidelines.
Data availability statement: Software support was provided by EMD Millipore, Burlington, MA.
We thank Dr. Andreas Klein (Institute of Biochemistry, Charitè Universitätsmedizin Berlin, Germany) and Dr. Ian Tannock (Ontario Cancer Institute, Toronto, ON, Canada) for providing murine breast carcinoma cells.
This protocol was used in [8].
Competing interests
Y.Y.L. is a board director of Mycobacterium DX Research Lab, Inc. The authors declare no competing interests.
References
- Saadh, M. J., Rasulova, I., Khalil, M., Farahim, F., Sârbu, I., Ciongradi, C. I., Omar, T. M., Alhili, A., Jawad, M. J., Hani, T., et al. (2024). Natural killer cell-mediated immune surveillance in cancer: Role of tumor microenvironment. Pathol Res Pract. 54: 155120. https://doi.org/10.1016/j.prp.2024.155120
- Wolf, N. K., Kissiov, D. U. and Raulet, D. H. (2022). Roles of natural killer cells in immunity to cancer, and applications to immunotherapy. Nat Rev Immunol. 23(2): 90–105. https://doi.org/10.1038/s41577-022-00732-1
- Vivier, E., Raulet, D. H., Moretta, A., Caligiuri, M. A., Zitvogel, L., Lanier, L. L., Yokoyama, W. M. and Ugolini, S. (2011). Innate or Adaptive Immunity? The Example of Natural Killer Cells. Science. 331(6013): 44–49. https://doi.org/10.1126/science.1198687
- Raulet, D. H., Gasser, S., Gowen, B. G., Deng, W. and Jung, H. (2013). Regulation of Ligands for the NKG2D Activating Receptor. Annu Rev Immunol. 31(1): 413–441. https://doi.org/10.1146/annurev-immunol-032712-095951
- Raulet, D. H. and Guerra, N. (2009). Oncogenic stress sensed by the immune system: role of natural killer cell receptors. Nat Rev Immunol. 9(8): 568–580. https://doi.org/10.1038/nri2604
- Schmiedel, D. and Mandelboim, O. (2018). NKG2D Ligands–Critical Targets for Cancer Immune Escape and Therapy. Front Immunol. 9: e02040. https://doi.org/10.3389/fimmu.2018.02040
- Iannello, A., Thompson, T. W., Ardolino, M., Lowe, S. W. and Raulet, D. H. (2013). p53-dependent chemokine production by senescent tumor cells supports NKG2D-dependent tumor elimination by natural killer cells. J Exp Med. 210(10): 2057–2069. https://doi.org/10.1084/jem.20130783
- Uddin, M. B., Roy, K. R., Hill, R. A., Roy, S. C., Gu, X., Li, L., Zhang, Q. J., You, Z. and Liu, Y. Y. (2022). p53 missense mutant G242A subverts natural killer cells in sheltering mouse breast cancer cells against immune rejection. Exp Cell Res. 417(1): 113210. https://doi.org/10.1016/j.yexcr.2022.113210
- Liu, Y. Y. (2011). Resuscitating Wild-Type p53 Expression by Disrupting Ceramide Glycosylation: A Novel Approach to Target Mutant p53 Tumors. Cancer Res. 71(20): 6295–6299. https://doi.org/10.1158/0008-5472.can-11-0700
- Textor, S., Fiegler, N., Arnold, A., Porgador, A., Hofmann, T. G. and Cerwenka, A. (2011). Human NK Cells Are Alerted to Induction of p53 in Cancer Cells by Upregulation of the NKG2D Ligands ULBP1 and ULBP2. Cancer Res. 71(18): 5998–6009. https://doi.org/10.1158/0008-5472.can-10-3211
- Cao, W., Xi, X., Hao, Z., Li, W., Kong, Y., Cui, L., Ma, C., Ba, D. and He, W. (2007). RAET1E2, a Soluble Isoform of the UL16-binding Protein RAET1E Produced by Tumor Cells, Inhibits NKG2D-mediated NK Cytotoxicity. J Biol Chem. 282(26): 18922–18928. https://doi.org/10.1074/jbc.m702504200
- Viswanath, D. I., Mace, E. M., Hsu, H. T. and Orange, J. S. (2017). Quantification of natural killer cell polarization and visualization of synaptic granule externalization by imaging flow cytometry. Clinical Immunology. 177: 70–75. https://doi.org/10.1016/j.clim.2016.03.004
- Duan, S., Guo, W., Xu, Z., He, Y., Liang, C., Mo, Y., Wang, Y., Xiong, F., Guo, C., Li, Y., et al. (2019). Natural killer group 2D receptor and its ligands in cancer immune escape. Mol Cancer. 18(1): e1186/s12943–019–0956–8. https://doi.org/10.1186/s12943-019-0956-8
- López-Soto, A., Huergo-Zapico, L., Acebes-Huerta, A., Villa-Alvarez, M. and Gonzalez, S. (2015). NKG2D signaling in cancer immunosurveillance. Int J Cancer. 136(8): 1741–1750. https://doi.org/10.1002/ijc.28775
- Raulet, D. H. (2003). Roles of the NKG2D immunoreceptor and its ligands. Nat Rev Immunol. 3(10): 781–790. https://doi.org/10.1038/nri1199
- Sacco, K. A., Notarangelo, L. D. and Delmonte, O. M. (2023). When to suspect inborn errors of immunity in Epstein–Barr virus–related lymphoproliferative disorders. Clin Microbiol Infect. 29(4): 457–462. https://doi.org/10.1016/j.cmi.2022.10.003
- Diefenbach, A., Jamieson, A. M., Liu, S. D., Shastri, N. and Raulet, D. H. (2000). Ligands for the murine NKG2D receptor: expression by tumor cells and activation of NK cells and macrophages. Nat Immunol. 1(2): 119–126. https://doi.org/10.1038/77793
- Basiji, D. and O'Gorman, M. R. G. (2015). Imaging flow cytometry. Journal of Immunological Methods. 423: 1–2. https://doi.org/10.1016/j.jim.2015.07.002
- Barteneva, N. S., Fasler-Kan, E. and Vorobjev, I. A. (2012). Imaging flow cytometry: coping with heterogeneity in biological systems. J Histochem Cytochem. 60(10): 723–33. https://doi.org/10.1369/0022155412453052
- Li, Y., Basar, R., Wang, G., Liu, E., Moyes, J. S., Li, L., Kerbauy, L. N., Uprety, N., Fathi, M., Rezvan, A., et al. (2022). KIR-based inhibitory CARs overcome CAR-NK cell trogocytosis-mediated fratricide and tumor escape. Nat Med. 28(10): 2133–2144. https://doi.org/10.1038/s41591-022-02003-x
- Aguilar, O. A., Gonzalez-Hinojosa, M. D. R., Arakawa-Hoyt, J. S., Millan, A. J., Gotthardt, D., Nabekura, T. and Lanier, L. L. (2023). The CD16 and CD32b Fc-gamma receptors regulate antibody-mediated responses in mouse natural killer cells. J Leukocyte Biol. 113(1): 27–40. https://doi.org/10.1093/jleuko/qiac003
Article Information
Publication history
Received: Jan 9, 2026
Accepted: Mar 17, 2026
Available online: Apr 1, 2026
Published: Apr 20, 2026
Copyright
© 2026 The Author(s); This is an open access article under the CC BY-NC license (https://creativecommons.org/licenses/by-nc/4.0/).
How to cite
Amin, M. N., Mostaq, M. S., Uddin, M. B. and Liu, Y. (2026). Quantitative Analysis of Splenic Natural Killer Cells of Mice Using Imaging Flow Cytometry. Bio-protocol 16(8): e5666. DOI: 10.21769/BioProtoc.5666.

 Download Citation in RIS Format
Category
Immunology > Immune cell staining > Flow cytometry
Cell Biology > Single cell analysis > Flow cytometry
Cancer Biology > Tumor immunology > Cell biology assays
Do you have any questions about this protocol?
Post your question to gather feedback from the community. We will also invite the authors of this article to respond.
 Post a Question


