


- Protocols

- Articles and Issues
- For Authors
- About
- Become a Reviewer


TIE-UP-SIN: A Method for Enhanced Identification of Protein–Protein Interactions

Published: Vol 16, Iss 8, Apr 20, 2026 DOI: 10.21769/BioProtoc.5663 Views: 513
Reviewed by: Alessandro DidonnaKasturika ShankarAnonymous reviewer(s)
 PDF
PDF  Ask a question
Original research article
The authors used this protocol in:

Sep 2025
Advertisement



Protocol Collections
Comprehensive collections of detailed, peer-reviewed protocols focusing on specific topics




Related protocols
Abstract
Protein–protein interactions (PPIs) govern nearly all aspects of cellular physiology, yet identifying these interactions under native conditions remains challenging. Here, we present TIE-UP-SIN (targeted interactome experiment for unknown proteins by stable isotope normalization), a robust method for in vivo identification and quantification of PPIs in bacterial systems. The protocol combines metabolic labeling with 15N isotopes, reversible formaldehyde crosslinking, affinity purification, and quantitative mass spectrometry. TIE-UP-SIN preserves transient or weak interactions during purification and quantifies interaction partners using internal light/heavy peptide ratios, reducing experimental variability. The method employs a triple-sample design to distinguish specific from nonspecific interactors and can be adapted to various bacterial species and affinity tags. Data analysis is streamlined through a user-friendly web application (https://shiny-fungene.biologie.uni-greifswald.de/TIE_UP_SIN_app) that automates statistical analysis, normalization, and visualization, requiring no programming expertise. The entire workflow from cell culture to mass spectrometry data acquisition takes approximately 4–5 days, with data analysis completed in 1–2 days using the web application.
Key features
• Captures transient protein interactions in vivo through reversible formaldehyde crosslinking under native expression conditions.
• Internal 15N metabolic labeling enables robust quantification and reduces experimental variability across biological replicates.
• Triple-sample design (WT/WT, bait/WT, bait/bait) distinguishes specific from nonspecific interactors with high confidence.
• Applicable to diverse bacterial systems with simple adaptation to any affinity-tagged bait protein.
Keywords: Protein–protein interactions Heavy nitrogen metabolic labeling
Formaldehyde crosslinking
In vivo crosslinking
Mass spectrometry
Affinity purification–mass spectrometry
Quantitative proteomics
Heavy nitrogen metabolic labeling
Formaldehyde crosslinking
In vivo crosslinking
Mass spectrometry
Affinity purification–mass spectrometry
Quantitative proteomics
Background
Identifying protein–protein interactions (PPIs) under physiologically relevant conditions is essential for understanding cellular function. Traditional methods such as affinity purification–mass spectrometry (AP–MS) primarily capture stable interactions, while transient or weak binding partners may be lost during purification. Proximity labeling techniques like BioID and APEX require heterologous expression and provide limited quantitative information. Cross-linking mass spectrometry (XL-MS) can identify interaction sites but typically requires specialized analysis pipelines.
TIE-UP-SIN (targeted interactome experiment for unknown proteins by stable isotope normalization) addresses these limitations by combining reversible formaldehyde crosslinking to stabilize PPIs in vivo, uniform 15N metabolic labeling for accurate quantification, and a stringent triple-control design to distinguish specific from nonspecific interactors. The method builds upon the SPINE approach [1], extending it with isotopic labeling for robust, ratio-based quantification. Unlike classical SILAC, which is challenging in prototrophic bacteria, TIE-UP-SIN uses global 15N labeling that is compatible with minimal media and does not require auxotrophic strains.
The protocol is particularly suited for bacterial systems where genetic manipulation is feasible and can be applied to any protein that can be tagged with an affinity purification tag. While demonstrated here with the Twin-Strep-tag system in Bacillus subtilis, the approach can be adapted to other tags and organisms.
Materials and reagents
Biological materials
1. Wildtype strain of the organism of choice, e.g., Bacillus subtilis BSB1 wildtype strain [2] (BaSysBio-Consortium)
2. Bait strain (wildtype strain with C-terminal Twin-Strep-tag fusion to the bait gene), e.g., Bacillus subtilis bait strain with chromosomally integrated C-terminal Twin-Strep-tag fusion [3]
Reagents
1. BioExpress® bacterial cell media (unlabeled) (10× concentrate) (Cambridge Isotope Laboratories, catalog number: CGM-1000-U)
2. BioExpress® bacterial cell media (U-15N, 98%) (10× concentrate) (Cambridge Isotope Laboratories, catalog number: CGM-1000-N)
3. Paraformaldehyde extra pure (Carl Roth, catalog number: 0335.1)
4. N-2-Hydroxyethylpiperazine-N′-2-ethane sulphonic acid (HEPES) (Carl Roth, catalog number: 9105.3)
5. Water, Baker HPLC analyzed, J.T. BakerTM (Fisher Scientific, catalog number: 10546602)
6. Sodium hydroxide (NaOH) (Carl Roth, catalog number: 6771.1)
7. Sodium dodecyl sulfate (SDS) (Sigma-Aldrich, catalog number: L4509)
8. Magnesium chloride hexahydrate (MgCl2) (Supelco, catalog number: 105833025)
9. Sodium chloride (NaCl) (Carl Roth, catalog number: 3957.2)
10. PierceTM universal nuclease for cell lysis (Thermo Fisher Scientific, catalog number: 88700)
11. Micro BCATM Protein Assay kit (Thermo Fisher Scientific, catalog number: 23235)
12. Tween® 20 (Sigma-Aldrich, catalog number: P7949)
13. MagStrep® Strep-Tactin® XT beads (IBA Lifesciences, catalog number: 2-5090-010)
14. Biotin (IBA Lifesciences, catalog number: 2-1016-002)
15. Calcium chloride hexahydrate (CaCl2) (Sigma-Aldrich, catalog number: 12074)
16. Sera-MagTM SpeedBead carboxylate-modified magnetic particles (Cytiva, catalog number: 65152105050250)
17. Acetonitrile hypergrade for LC-MS (Merck, catalog number: 1000291000)
18. Lys-C, mass spec grade (Promega, catalog number: VA1170)
19. Sequencing-grade modified trypsin (Promega, catalog number: V5111)
20. 2xiRT kit (Biognosys, catalog number: 1900615)
21. Trifluoroacetic acid, LC-MS grade (TFA) (Thermo Fisher Scientific, catalog number: 85183)
22. Glycerol (Sigma-Aldrich, catalog number: 49767)
Solutions
1. BioExpress bacterial cell media unlabeled (see Recipes)
2. BioExpress bacterial cell media 15N-labeled (see Recipes)
3. Formaldehyde crosslinking buffer (see Recipes)
4. Disruption buffer (see Recipes)
5. Benzonase dilution buffer (see Recipes)
6. Buffer W (see Recipes)
7. 20 mM HEPES pH 8.0 + 2% Tween-20 (see Recipes)
8. Elution buffer XT (see Recipes)
9. 200 mM HEPES pH 8.0 + 4 mM CaCl2 (see Recipes)
10. 100 mM HEPES pH 8.0 + 2 mM CaCl2 (see Recipes)
11. Digestion buffer (see Recipes)
Recipes
1. BioExpress bacterial cell media unlabeled
| Reagent | Final concentration | Volume |
|---|---|---|
| BioExpress® bacterial cell media (unlabeled) (10× concentrate) | 1× | 60 mL |
| Water, Baker HPLC analyzed | n/a | 540 mL |
| Total | n/a | 600 mL |
Prepare fresh BioExpress® bacterial cell media (unlabeled) for each experiment by diluting it 1:10 with Baker HPLC water to the required cultivation volume. Filter-sterilize (0.2 μM pore size) the diluted media and add antibiotics as needed for plasmid-containing strains. Maintain sterile conditions throughout all preparation steps.
2. BioExpress bacterial cell media 15N-labeled
| Reagent | Final concentration | Volume |
|---|---|---|
| BioExpress® bacterial cell media (U-15N, 98%) (10× concentrate) | 1× | 60 mL |
| Water, Baker HPLC analyzed | n/a | 540 mL |
| Total | n/a | 600 mL |
Prepare fresh BioExpress® bacterial cell media (U-15N, 98%) for each experiment by diluting it 1:10 with Baker HPLC water to the required cultivation volume. Filter-sterilize (0.2 μM pore size) the diluted media and add antibiotics as needed for plasmid-containing strains. Maintain sterile conditions throughout all preparation steps.
3. Formaldehyde crosslinking buffer
| Reagent | Final concentration | Quantity or volume |
|---|---|---|
| Paraformaldehyde extra pure | 4% | 2.4 g |
| 50 mM HEPES pH 8.0 | n/a | 60 mL |
| Total | n/a | 60 mL |
Dissolve 2.4 g of paraformaldehyde in 50 mL of 50 mM HEPES, pH 8.0. Gently warm the buffer on a heated magnetic stir plate and stir using a magnetic stir bar. For safety, work under a fume hood and ensure the buffer does not boil during heating. Dissolution of paraformaldehyde takes some time. Adjust the pH to 8.0 with 1 M NaOH. While adding NaOH, the paraformaldehyde will fully dissolve. Afterward, bring the volume up to 60 mL with 50 mM HEPES pH 8.0 for a 4% (w/v) formaldehyde solution. Optionally, filter sterilize. Prepare the amount of formaldehyde crosslinking buffer required for the experiment. This buffer should always be prepared fresh before use.
4. Disruption buffer
| Reagent | Final concentration | Volume |
|---|---|---|
| 100 mM HEPES pH 8.0 | 20 mM | 10 mL |
| Baker HPLC water | n/a | 40 mL |
| Total | n/a | 50 mL |
The volume of the disruption buffer to prepare depends on the number of samples. This buffer can be stored protected from light for up to one year.
5. Benzonase dilution buffer
| Reagent | Final concentration | Volume |
|---|---|---|
| 1 M HEPES pH 8.0 | 20 mM | 5 mL |
| 1 M NaCl | 20 mM | 5 mL |
| 1 M MgCl2 | 2 mM | 0.5 mL |
| Water, Baker HPLC analyzed | n/a | 239.5 mL |
| Total | n/a | 250 mL |
6. Buffer W
| Reagent | Final concentration | Volume |
|---|---|---|
| 100 mM HEPES pH 8.0 | 20 mM | 30 mL |
| 100% Tween-20 | 1% | 1.5 mL |
| Water, Baker HPLC analyzed | n/a | 117 mL |
| Total | n/a | 150 mL |
This buffer can be stored protected from light for up to one year.
7. 20 mM HEPES pH 8.0 + 2% Tween-20
| Reagent | Final concentration | Volume |
|---|---|---|
| 100 mM HEPES pH 8.0 | 20 mM | 2 mL |
| 100% Tween-20 | 2% | 0.2 mL |
| Water, Baker HPLC analyzed | n/a | 7.6 mL |
| Total | n/a | 10 mL |
This buffer can be stored protected from light for up to one year.
8. Elution buffer XT
| Reagent | Final concentration | Quantity or volume |
|---|---|---|
| Biotin | 100 mM | 1.22 g |
| 20 mM HEPES pH 8.0 | n/a | 50 mL |
| Total | n/a | 50 mL |
Adjust the pH to 8.0. This buffer can be stored protected from light at 4 °C.
9. 200 mM HEPES pH 8.0 + 4 mM CaCl2
| Reagent | Final concentration | Volume |
|---|---|---|
| 1 M HEPES pH 8.0 | 200 mM | 1 mL |
| 1 M CaCl2 | 4 mM | 0.02 mL |
| Water, Baker HPLC analyzed | n/a | 3.98 mL |
| Total | n/a | 5 mL |
10. 100 mM HEPES pH 8.0 + 2 mM CaCl2
| Reagent | Final concentration | Volume |
|---|---|---|
| 200 mM HEPES pH 8.0 + 4 mM CaCl2 | 100 mM + 2 mM CaCl2 | 2 mL |
| Water, Baker HPLC analyzed | n/a | 2 mL |
| Total | n/a | 4 mL |
11. Digestion buffer
| Reagent | Final concentration | Volume |
|---|---|---|
| 100 mM HEPES pH 8.0 + 2 mM CaCl2 | 50 mM HEPES + 1 mM CaCl2 | 2 mL |
| Water, Baker HPLC analyzed | n/a | 2 mL |
| Total | n/a | 4 mL |
Laboratory supplies
1. Cell culture flask, 100 mL (DWK Life Sciences, catalog number: 217712401)
2. Cell culture flask, 300 mL (DWK Life Sciences, catalog number: 217713903)
3. Filter tip, 20 μL (Sarstedt, catalog number: 70.3030.265)
4. Laboratory bottles, Duran®, 100 mL (DWK Life Sciences, catalog number: 215-1514)
5. Laboratory bottles, Duran®, 500 mL (DWK Life Sciences, catalog number: 215-1516)
6. Laboratory bottles, Duran®, 1,000 mL (DWK Life Sciences, catalog number: 215-1517)
7. SafeSeal microcentrifuge tubes, 1.7 mL (Sorenson BioScience, catalog number: 11720)
8. SafeSeal SurPhob tips, 10 μL, sterile (Biozym, catalog number: VT0200)
9. SafeSeal SurPhob tips, 100 μL, sterile (Biozym, catalog number: VT0230)
10. SafeSeal SurPhob tips, 200 μL, sterile (Biozym, catalog number: VT0240)
11. SafeSeal SurPhob tips, 1,250 μL, sterile (Biozym, catalog number: VT0270)
12. Screw cap tube, 15 mL (Sarstedt, catalog number: 62.554.502)
13. Screw cap tube, 50 mL (Sarstedt, catalog number: 62.547.254)
14. Serological pipette, 5 mL (Sarstedt, catalog number: 86.1253.001)
15. Serological pipette, 10 mL (Sarstedt, catalog number: 86.1254.001)
16. Serological pipette, 25 mL (Sarstedt, catalog number: 86.1685.001)
17. Serological pipette, 50 mL (Sarstedt, catalog number: 86.1256.001)
18. Steritop® 45 mm neck size, 0.22 μm pore size, PES (Millipore, catalog number: S2GPT05RE)
19. Tube, 13 mL (Sarstedt, catalog number: 62.515.006)
20. MS-vials (VWR, catalog number: 548-3018)
21. 0.1 mL micro-insert for vials with small opening, 31 × 5 mm, clear glass, first hydrolytic class, 15 mm top (VWR, catalog number: 548-00-20A)
22. AcclaimTM PepMapTM 100 C18 HPLC columns (Thermo Fisher Scientific, catalog number: 164946)
Equipment
1. AdventurerTM Precision (Ohaus, catalog number: 30805891)
2. Centrifuge 5804 R (Eppendorf, catalog number: 5805000010)
3. Eppendorf Thermo Mixer® C (Eppendorf, catalog number: 5382000015)
4. FisherbrandTM Mini-Centrifuge (Fisher Scientific, catalog number: 16617645)
5. Galaxi Mini Centrifuge (VWR, catalog number: 019511)
6. GFL-3005 Shaker (GFL Gesellschaft Fuer LabortecTM 3005, catalog number: 10186650)
7. Heraeus B12 Function Line (Thermo Scientific, catalog number: 50042307)
8. Loopster digital (IKA, catalog number: 0004016000)
9. Micro Star 17 (VWR, catalog number: 521-1646)
10. Mini Laboratory Pump, VP86 (VWR, catalog number: 181-0067)
11. Mixer Mill MM400 (Retsch, catalog number: 20.715.0001)
12. New Brunswick Innova® 44 Incubator Shaker (Eppendorf, catalog number: M1282-0002)
13. Orbitrap ExplorisTM 480 (Thermo Fisher Scientific, catalog number: BRE725539)
14. Pipet Controller accu-jet® pro (Brand, catalog number: 26300)
15. Rainin Pipet-LiteTM LTS (Mettler Toledo, catalog numbers: 17014393, 17014392, 17014391)
16. Rocking platform shaker (VWR, catalog number: 444-0145)
17. Safety Cabinets Safe 2020 (Thermo Fisher Scientific, catalog number: 51026637)
18. Sonorex Super RK 31 ultrasonic bath (Bandelin, catalog number: 329)
19. Thermo Top® (Eppendorf, catalog number: 5308000003)
20. Transferpette® S, Typ variable (Brand, catalog numbers: 705869, 705870, 705872, 705874, 705878, 705880)
21. UltiMateTM 3000 RSLC (Thermo Fisher Scientific, catalog number: 6041.0001)
22. V-1200, Vis-Spectrophotometer (VWR, catalog number: 634-6000)
23. VMS-A, magnetic hotplate stirrer (VWR, catalog number: 442-0185)
24. Retsch grinding jar (Retsch, catalog number: 01.462.0231)
Software and datasets
1. Spectronaut® version 17 or higher (Biognosys AG) (requires license)
2. DIA-NN version 2.2.0 or higher (requires no license) [4]
3. Chosen organisms protein database (e.g., from UniProt; https://www.uniprot.org)
Procedure
General overview
The TIE-UP-SIN protocol requires two bacterial strains: a wildtype (WT) strain and a bait strain expressing an affinity-tagged protein of interest. Both strains are cultivated separately in unlabeled (14N) and labeled (15N) media, resulting in four culture types, a 14N and 15N WT culture, as well as a 14N and 14N bait strain culture. After formaldehyde crosslinking at defined physiological states and similar optical densities, identical OD units of cells are harvested. Then, cell pellets are mixed directly in a 1:1 ratio prior to cell disruption to generate three distinct sample types: 14N WT/15N WT control pellets (identifies nonspecific binders), 14N bait/15N WT experiment (identifies bait protein interactors), and 14N bait/15N bait control pellets (controls for isotope-specific and tag-specific effects). Each sample type is prepared in quadruplicates (four biological replicates) to enable robust statistical analysis and assessment of biological variability. This triple-sample design with quadruplicate replicates enables robust discrimination between true interactors and background proteins.
The method employs ratio-based quantification by mixing differentially labeled (14N/15N) cell pellets before cell lysis and affinity purification. This mix-before-purification strategy ensures that light and heavy peptides experience identical downstream processing. Light-to-heavy (L/H) peptide ratios are measured within the same LC–MS/MS run, providing an internal reference that minimizes experimental variability across biological replicates. Significantly enriched proteins are identified through statistical analysis of normalized L/H ratios, which is the key reason why the TIE-UP-SIN approach works so reliably and in a highly targeted manner.
For data analysis, we provide a user-friendly web application that automates all statistical analysis steps, from raw search engine output to final volcano plots and interactor lists. Users simply upload their Spectronaut® or DIA-NN results, and the app performs normalization, filtering, and statistical testing. For researchers who prefer manual analysis or require customized statistical workflows, detailed R scripts and analysis pipelines are provided in the original TIE-UP-SIN manuscript [3]. The general workflow, as an overview scheme, is shown in Figure 1.
Notes:
1. The complete protocol from cell culture to MS data acquisition takes approximately 4–5 days. Data analysis requires an additional 1–2 days, depending on the number of samples and computational resources.
2. While one formaldehyde concentration is completely enough for results, we recommend performing at least a small setup experiment with the two different formaldehyde concentrations (e.g., 0.2% and 0.4%).
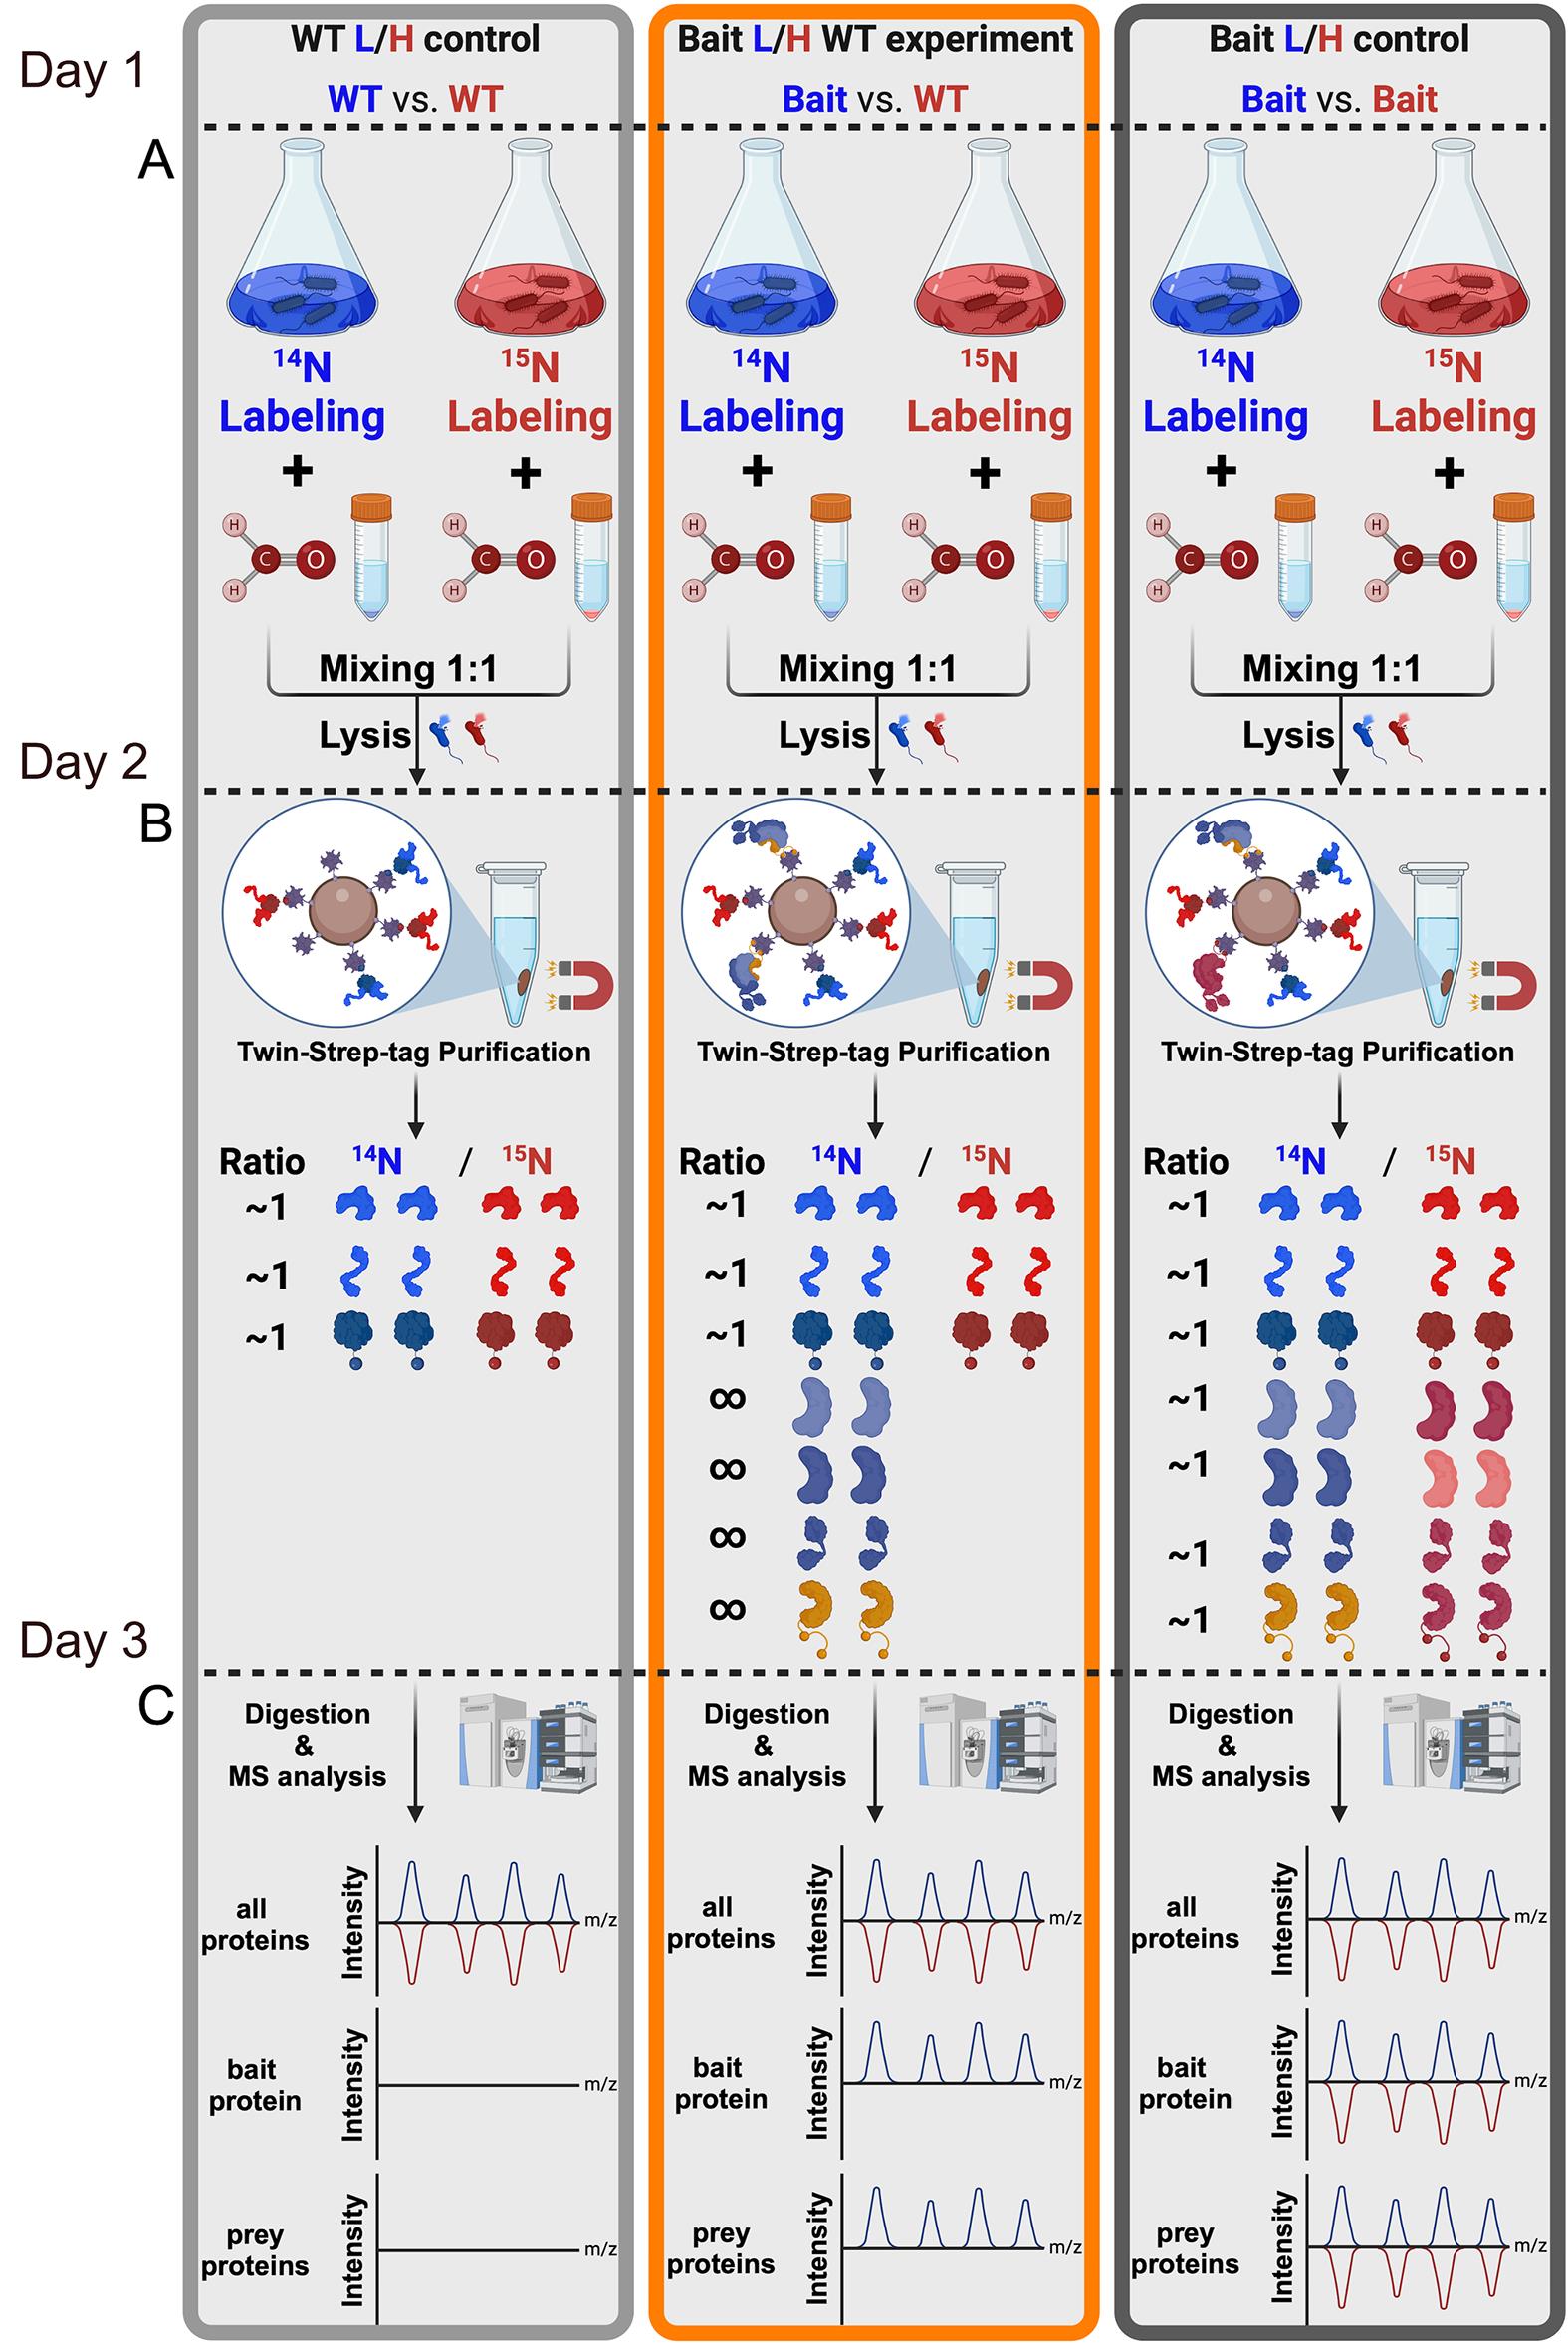
Figure 1. TIE-UP-SIN (targeted interactome experiment for unknown proteins by stable isotope normalization) general workflow. Schematic presentation of the TIE-UP-SIN workflow split into three sections (A–C). Differential isotope labeling (14N/15N), cross linking, mixing of equal cell numbers of the control and bait strain according to the scheme WT/WT (light gray), bait/WT (orange) and bait/bait (dark gray) and cell lysis in Section A, followed by affinity purification of the bait protein via the Twin-Strep-tag and reversal of formaldehyde crosslinks in Section B, as well as sample digestion, MS analysis, and theoretical results of the mass spectrometric analysis in Section C.
A. Preparation of wildtype and bait strain
1. Generate a bait strain by chromosomal integration of a Twin-Strep-tag at the C-terminus of the gene of interest.
a. Design a tagging construct consisting of (i) an ~800 bp homology region upstream of the stop codon of the gene of interest, (ii) the Twin-Strep-tag coding sequence fused in-frame to replace the native stop codon, (iii) an antibiotic resistance cassette (e.g., cat for chloramphenicol) for selection, and (iv) an ~800 bp homology region downstream of the stop codon.
b. Assemble the construct by Gibson assembly, overlap-extension PCR, or restriction-based cloning into a suitable vector backbone.
c. Transform the linearized construct into naturally competent Bacillus subtilis cells and select for positive clones on the appropriate antibiotic.
Note: For B. subtilis, we recommend exploiting natural competence for transformation. Use ~800 bp flanking homology regions to ensure efficient double-crossover recombination at the native locus.
2. Verify the correct integration by colony PCR using primers flanking the integration site, followed by Sanger sequencing of the junction regions.
3. Confirm protein expression and test functionality by western blot analysis using anti-Strep-tag antibody (e.g., Strep-Tactin conjugates).
4. Prepare glycerol stocks of exponentially growing cultures of both strains (WT + bait) and store at -80 °C. When cultures reach OD540 nm = 0.8 (exponential phase), proceed immediately to harvest two 8 OD units (calculated as ODunits/ODmeasured = Vharvest) from each replicate.
Critical: Measure the OD540 nm accurately and harvest exactly 8 OD units from each culture. Precise harvesting is essential to achieve a 1:1 ratio of light to heavy labeled cells when mixing pellets in Section D. Small deviations from the 1:1 ratio will be corrected during normalization, but large deviations (>1:1.5) can reduce statistical power.
5. Transfer the volume needed for 8 OD units directly into a 50 mL reaction tube containing the appropriate amount of the 4% (w/v) FA solution (Recipe 3), with one tube for the 0.2% FA crosslinking and one tube for the 0.4% FA crosslinking.
Note: It is recommended to perform the experiment with both FA concentrations.
B. Metabolic labeling and cell culture
Day 1: Overnight serial dilution culture
1. Prepare the number of cultures according to your experimental design. For a complete TIE-UP-SIN experiment with four biological replicates, you need to cultivate the wildtype and the bait strains in the unlabeled and labeled Bioexpress medium four times each. For this, prepare 600 mL of 14N-BioExpress medium (Recipe 1) and 15N-BioExpress medium (Recipe 2).
Note: Do not try to cultivate all cultures on a single day. Cultivate both strains in the unlabeled medium on day 1 and continue with both strains in the labeled medium on day 2. Below, cultivation is described only once, as it is the same for both media.
2. For each strain, prepare 10 cultivation tubes with 3 mL of medium for a serial dilution series. Transfer 350 μL of a glycerol working stock (WT strain or bait strain from step A4) into the first culture tube containing 3 mL of BioExpress medium. Mix thoroughly and transfer 500 μL into the second culture tube containing 3 mL medium. Mix the second tube and transfer 500 μL into the third culture tube. For the remaining tubes, mix and transfer 700 μL from the previous tube into the next tube using a serological pipette. Repeat for the second strain.
Note: This serial dilution ensures that at least one culture will be in the exponential growth phase the next morning, regardless of the exact growth rate. By combining the serial dilution series with another pre-culture, labeling efficiency reaches more than 98% the next day.
3. Incubate all culture tubes overnight at 37 °C with shaking at 220 rpm for approximately 8 h or until the next morning.
Day 2: Main culture
4. Measure the OD540 nm of the serial dilutions and select the overnight culture tube with an OD540 nm between 0.65 and 0.9 to inoculate the pre-culture (20 mL) to a starting OD540 nm of 0.05 and let it incubate at 37 °C at 220 rpm.
Note: Cells at this OD range are in the exponential growth phase, which is critical for maintaining consistent growth kinetics and ensuring complete 15N incorporation.
5. Upon reaching an OD540 nm higher than 0.5, use the pre-culture to inoculate the four main cultures with 50 mL each to an OD540 nm of 0.05.
6. Incubate the main cultures at 37 °C and 220 rpm until they reach a (desired) OD540 nm of 0.8.
C. Formaldehyde crosslinking and cell harvesting
1. When cultures reach OD540 nm = 0.8 (exponential phase), proceed immediately to harvest two 8 OD units (calculated as ODunits/ODmeasured = Vharvest) from each replicate.
Critical: Measure the OD540 nm accurately and harvest exactly 8 OD units from each culture. Precise harvesting is essential to achieve a 1:1 ratio of light to heavy labeled cells when mixing pellets in Section D. Small deviations from the 1:1 ratio will be corrected during normalization, but large deviations (>1:2) will strongly reduce the statistical power.
2. Transfer the volume needed for 8 OD units directly into a 50 mL reaction tube containing the appropriate amount of the 4% (w/v) FA solution (Recipe 3), with one tube for the 0.2% FA crosslinking and one tube for the 0.4% FA crosslinking.
Note: It is recommended to perform the experiment with both FA concentrations in parallel.
3. Incubate the 50 mL reaction tube for 15 min at 37 °C. The 15-min duration is important because otherwise the cross-linking can be quantitative. No quenching is required.
4. After incubation, centrifuge at maximum speed, discard the supernatant, and freeze the cell pellet in LN2. Store until further use at -80 °C.
D. Cell pellet mixing and lysis
Critical: The mixing scheme determines which samples are generated. For a complete TIE-UP-SIN experiment, you need three sample types as outlined in Table 1.
Table 1. Cell pellet mixing scheme for TIE-UP-SIN
| Sample type | Light pellet (14N) | Heavy pellet (15N) | Purpose |
|---|---|---|---|
| WT/WT control | WT14N | WT15N | Identifies nonspecific interactors |
| Bait/WT experiment | Bait14N | WT15N | Identifies bait interactors |
| Bait/bait control | Bait14N | Bait15N | Identifies nonspecific interactors |
1. Thaw one frozen 14N-labeled pellet (8 OD units) by adding 100 μL of disruption buffer (Recipe 4) directly to the frozen pellet in the tube.
2. Use this resuspended pellet to resuspend the corresponding frozen 15N-labeled pellet (8 OD units) according to Table 1.
Example: For a bait/WT experiment sample, resuspend the bait 14N pellet with 100 μL of disruption buffer and then use this suspension to resuspend the WT 15N pellet.
3. Transfer the combined cell suspension into a pre-cooled 5 mL Retsch grinding jar containing an 8 mm steel ball and liquid nitrogen.
Caution: Handle liquid nitrogen with appropriate protective equipment (cryo-gloves, face shield).
4. Immediately freeze the suspension by adding it to the liquid nitrogen in the vessel.
5. Disrupt the cells using a Dismembrator MM400 at 2,600 rpm for 3 min.
Critical: The sample must remain frozen during disruption. If needed, repeat cooling with liquid nitrogen between grinding cycles.
6. After grinding, the sample appears as a fine frozen powder. Allow the frozen powder to thaw for 5 min and resuspend the cell powder in 400 μL of disruption buffer.
7. Transfer the suspension to a pre-lubricated 1.7 mL SurPhob tube.
8. Add MgCl2 to a final concentration of 6 mM (add 3 μL of 1 M MgCl2 stock).
9. Add 12.5 U of PierceTM universal nuclease for cell lysis. 1 μL of a 1:100 dilution in benzonase dilution buffer (Recipe 5) is sufficient.
Note: Nuclease treatment digests DNA and RNA, which reduces sample viscosity and prevents nucleic acid interference in downstream steps.
10. Incubate at 37 °C for 15 min with shaking at 1,400 rpm in a ThermoMixer.
11. Transfer the tube to an ultrasonic bath and sonicate for 5 min at room temperature.
Note: Sonication helps further disrupt cell debris and improves protein extraction.
12. Store lysates at -80 °C until protein concentration determination.
Pause point: Lysates can be stored at -80 °C for several weeks.
Critical: Do not centrifuge the raw lysate, as you might lose some potential interactors.
E. Affinity purification
1. Measure protein concentration of all raw lysates.
Note: We used the Micro BCATM Protein Assay kit according to the manufacturer’s instructions. Other methods or assays are also viable.
2. After protein concentration determination is done, aliquot 750 μg of total protein lysate in the smallest possible volume for each sample.
3. Adjust the lysate to 1% (v/v) Tween-20 final concentration by adding an appropriate volume of Buffer W (Recipe 6) and 20 mM HEPES pH8, 2% Tween-20 (Recipe 7).
Example: If your lysate is 375 μL, add 375 μL of 20 mM HEPES pH 8, 2% Tween-20 (Recipe 7) to reach 1% Tween-20 final.
Critical: The purification works best if the protein concentration is as high as possible.
4. Resuspend MagStrep® Strep-Tactin® XT beads by vortexing the stock bottle.
5. Transfer 150 μL of the 5% bead suspension (equivalent to 7.5 μL settled beads) to a 1.7 mL tube for each sample.
Note: The bead suspension is 5% (v/v), so 150 μL contains 7.5 μL of actual beads.
6. Place the tube on a magnetic separator and remove the storage buffer.
7. Wash beads three times with 500 μL of Buffer W. Remove buffer using the magnetic separator.
8. Add the adjusted lysate (750 μg of protein in 20 mM HEPES pH 8, 1% Tween-20) to the washed beads.
9. Incubate at room temperature (20–25 °C) for 30 min on a rotational mixer (end-over-end rotation).
Critical: Use gentle rotation to keep beads in suspension.
10. Place the tube on the magnetic separator and carefully remove the flowthrough. Save the flowthrough for later analysis if desired.
11. Wash beads three times with 300 μL of Buffer W:
a. Add Buffer W.
b. Resuspend via vortexing.
c. Shortly centrifuge with the benchtop centrifuge.
d. Place on a magnetic separator.
e. Remove wash buffer.
12. After the final wash, remove as much Buffer W as possible without disturbing the beads.
13. Add 50 μL of Elution buffer XT (Recipe 8) to the beads.
14. Incubate at 37 °C for 10 min with gentle shaking (e.g., 300 rpm in a ThermoMixer).
Note: The elevated temperature helps complete biotin binding and improves elution efficiency.
15. Place on a magnetic separator and transfer the eluate (containing purified proteins) to a fresh 1.7 mL SurPhob tube.
16. Immediately add 12.5 μL of 20 mM HEPES pH 8.0 + 5% SDS to the eluate for a final volume of 62.5 μL and final SDS concentration of 1%.
17. Perform another protein concentration determination with the purified samples.
Note: Typical concentrations after purification are between 20 and 150 ng/μL, depending on bait protein abundance.
18. Store purified protein samples at -80 °C until crosslink reversal.
Pause point: Purified proteins can be stored at -80 °C for several weeks.
F. Crosslink reversal
Critical: This step reverses formaldehyde crosslinks by heating, releasing individual proteins for subsequent digestion and MS analysis.
1. Thaw purified protein samples.
2. Incubate samples at 95 °C for 2 h in a ThermoMixer C with ThermoTop (heated lid to prevent evaporation).
Critical: The heated lid is essential to prevent sample evaporation and concentration changes during the 2 h incubation.
3. After incubation, briefly centrifuge samples to collect condensation.
4. (Optional) Validate affinity purification and cross-link reversal via western blot and silver staining: Analyze small aliquots (2 μL) by western blot and silver staining to confirm crosslink reversal.
Note: Expected result: Before reversal, crosslinked proteins appear as high molecular weight smears at the top of the gel. In Figure 2, the validation of the affinity purification and the cross-link reversal can be seen on a western blot analysis (Figure 2A) and a silver staining (Figure 2B) of all purification fractions. After reversal, the bait protein should appear as a single band at its expected molecular weight (e.g., SigA-TS at ~46 kDa).
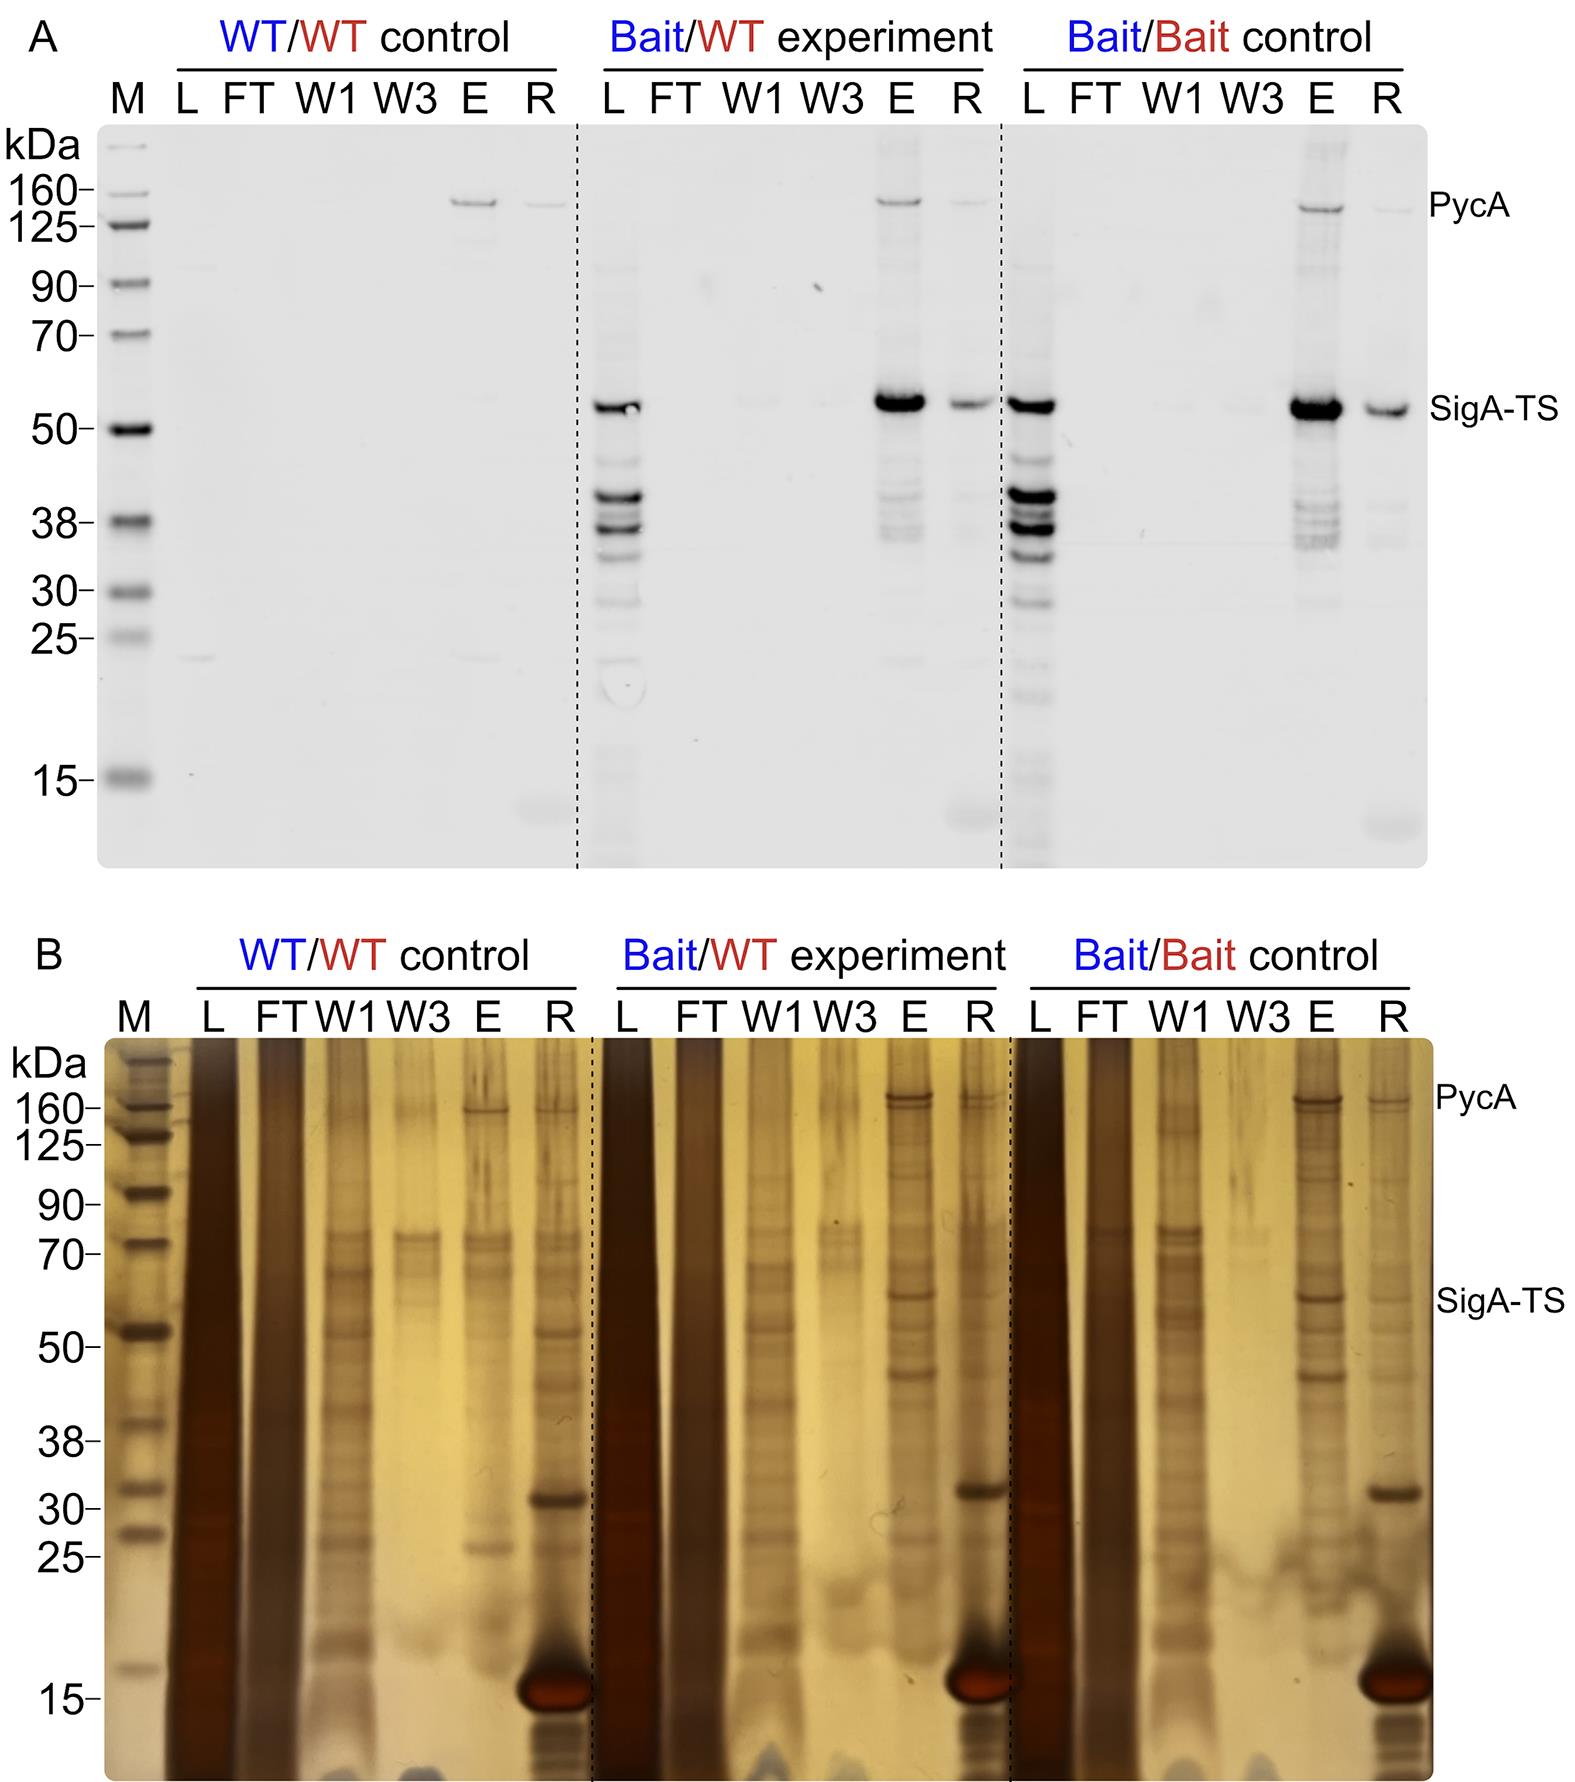
Figure 2. Purification validation by western blot and silver gel analysis. Western blot (A) and silver-stained gel (B) show the purification fractions of the WT control (WT/WT), bait/WT experiment (bait/WT), and bait control (bait/bait), all crosslinked with 0.2% (w/v) FA. The fractions loaded are lysate (L) (1 μL), flowthrough (FT) (1 μL), wash steps 1 (W1) and 3 (W3) (8 μL), eluate (E) (4 μL), and residue (R) (4 μL). The Chameleon® Due Pre-Stained protein marker was used for molecular weight reference. The position of the signals for PycA (127.72 kDa) and SigA-TS (45.9 kDa) is marked on the right side. PycA is a biotinylated protein and thus is purified unspecifically by the MagStrep beads.
G. Protein digestion (SP3 protocol)
Note: We use the SP3 (single-pot solid-phase-enhanced sample preparation) method with magnetic beads for efficient protein cleanup and digestion [5].
1. Transfer an aliquot containing 500 ng of protein from each sample into a fresh 1.7 mL Protein LoBind® tube.
2. Prepare SP3 beads working solution (20 μg/μL) as described in [5].
Note: The SP3 bead stock can be prepared in advance and stored at 4 °C for several months.
3. Adjust each sample to the smallest possible volume with 20 mM HEPES pH 8.0 + 1% SDS and combine each sample with 1 μL of the SP3 bead working solution.
4. Bind, wash, and air-dry proteins as described in [5].
Caution: Do not over-dry the beads (>5 min), as this makes protein resolubilization difficult.
5. After air drying, resuspend beads in 8 μL of digestion buffer (Recipe 9).
6. Add Lys-C at a protease/protein ratio of 1:25. For this, prepare a 20 ng/μL working stock in digestion buffer (Recipe 9).
Example: For 500 ng of protein, add 20 ng of Lys-C (typically 1 μL of a 20 ng/μL stock).
7. Incubate at 37 °C for 3 h with shaking (shake for 15 s every 1 min 45 s in a ThermoMixer).
Note: The intermittent shaking keeps beads in suspension and ensures efficient digestion.
8. After 3 h, add trypsin at a protease/protein ratio of 1:25.
Example: For 500 ng of protein, add 20 ng of trypsin (typically 0.4 μL of a 50 ng/μL stock).
9. Incubate overnight (12–16 h) at 48 °C with intermittent shaking as in step G7. For this, prepare a 20 ng/μL working stock in digestion buffer (Recipe 9).
Note: The elevated temperature (48 °C) improves trypsin activity and digestion efficiency. Using Lys-C before trypsin (sequential digestion) improves peptide coverage.
10. The next morning, stop the digestion by adding TFA to a final concentration of 0.5%.
Example: For a 10 μL digest, add 1 μL of 5% TFA.
11. Add 0.3 μL of 10× iRT peptide stock (from the 2xiRT Kit) to each sample.
Note: iRT (indexed retention time) peptides serve as internal standards for retention time alignment during MS analysis.
12. Add HPLC-grade water to bring the final volume to exactly 15 μL.
Note: It is recommended to prepare a mastermix containing 5% TFA, Baker HPLC water, and iRTs to prevent pipetting volumes under 1 μL.
13. Vortex samples briefly and centrifuge at maximum speed (>16,000× g) for 5 min to pellet any remaining beads or particulates.
14. Transfer the supernatant (containing digested peptides) to MS vials.
Caution: Avoid transferring any beads into the MS vials, as they can clog the LC column.
15. Store samples at -20 °C until LC–MS/MS analysis.
Pause point: Digested peptide samples can be stored at -20 °C for several weeks or at -80 °C for longer storage.
H. LC–MS/MS analysis
Note: The following protocol is optimized for a Thermo Fisher Orbitrap Exploris 480 coupled to a Dionex UltiMate 3000 RSLC. Adjust parameters according to your specific MS instrument and software.
1. Load 5 µL of each digested sample onto an AcclaimTM PepMapTM 100 C18 pre-column (75 μm ID, 5 μm particle size, 100 Å pore size) using a flow rate of 7 μL/min with 0.1% acetic acid in HPLC-water as loading buffer.
2. Separate peptides on an AccucoreTM 150-C18 analytical column (25 cm length, 75 μm ID, 2.6 μm particle size, 150 Å pore size) at 40 °C.
3. Use the following binary gradient system:
a. Solvent A: 0.1% acetic acid in HPLC-water.
b. Solvent B: 100% acetonitrile in 0.1% acetic acid.
c. Flow rate: 300 nL/min.
4. Apply the following LC gradient:
a. 0–2 min: 3% B (loading and equilibration).
b. 2–32 min: 3% to 35% B (linear gradient, peptide separation).
c. 32–37 min: 35% to 90% B (column wash).
d. 37–45 min: 90% B (continued wash).
e. 45–50 min: 90% to 3% B (re-equilibration).
f. 50–65 min: 3% B (equilibration for next sample).
Note: Total run time is 65 min per sample.
5. Ionize peptides by electrospray ionization (ESI) using a Nanospray FlexTM ion source.
6. Acquire MS data in data-independent acquisition (DIA) mode with the following parameters:
a. Full MS settings:
i. m/z range: 350–1,200
ii. Resolution: 120,000 (at m/z 200)
iii. AGC target: Standard
iv. Maximum injection time: 60 ms
b. DIA MS/MS settings:
i. 34 isolation windows of 25 m/z width with 2 m/z overlap
ii. Resolution: 30,000 (at m/z 200)
iii. AGC target: Standard
iv. Normalized collision energy (NCE): 30% (HCD)
v. Maximum injection time: Auto
7. Save raw MS files for data analysis.
I. Data analysis
Note: TIE-UP-SIN data can be analyzed using two alternative search engines (Spectronaut® or DIA-NN) followed by statistical analysis. We provide a user-friendly web application that automates the statistical analysis and filtering steps.
Option 1: Data analysis using Spectronaut® (commercial, requires license)
1. Open Spectronaut® (version 17 or higher).
2. Create a new DirectDIA+ (Deep) analysis:
a. Select "DirectDIA+ (Deep)" workflow.
b. Import and search raw MS files sample-wise (analyze each sample type of bioreplicates together as one block, leading to three independent searches: WT/WT, bait/WT, bait/bait).
3. Load the TIE-UP-SIN Spectronaut search settings from the web application (https://shiny-fungene.biologie.uni-greifswald.de/TIE_UP_SIN_app).
4. Load the four replicates of one sample type, add the fasta file(s), and add the corresponding sample type as the condition.
5. Run the search. This typically takes 30–60 min per sample type.
6. Export the results using the TIE-UP-SIN spectronaut export scheme, which is also available on the web application.
7. Repeat for the other two sample types.
Critical: Only search the four replicates of one sample type (WT/WT, bait/WT, bait/bait) together.
Option 2: Data analysis using DIA-NN (free, open-source alternative)
1. Generation of a spectral library
a. When using DIA-NN, we first need to generate a spectral library from our protein databases. This is done in a separate step, but only once. The spectral library will be saved and used for the subsequent searches.
b. Open DIA-NN (version 2.2 or higher) and create a new analysis.
c. Name the experiment appropriately.
d. Load in the TIE-UP-SIN Step 1 pipeline file (available on the web app) to create the spectral library from your fasta files.
e. Once the pipeline is loaded, click on it to take over its settings.
f. Click the Add FASTA button (red box 1 in Figure 3) and load the paths to the protein database fasta files.
g. Set a main output directory by clicking on the Main output button (red box 2 in Figure 3).
h. Make sure that Generate spectral library is on and set a directory in which the generated spectral library will be saved (red box 3 in Figure 3).
i. Click on the Run button (red box 4 in Figure 3). The spectral library will be generated and saved to the directory of choice.
j. Once this is done, close the DIA-NN session.
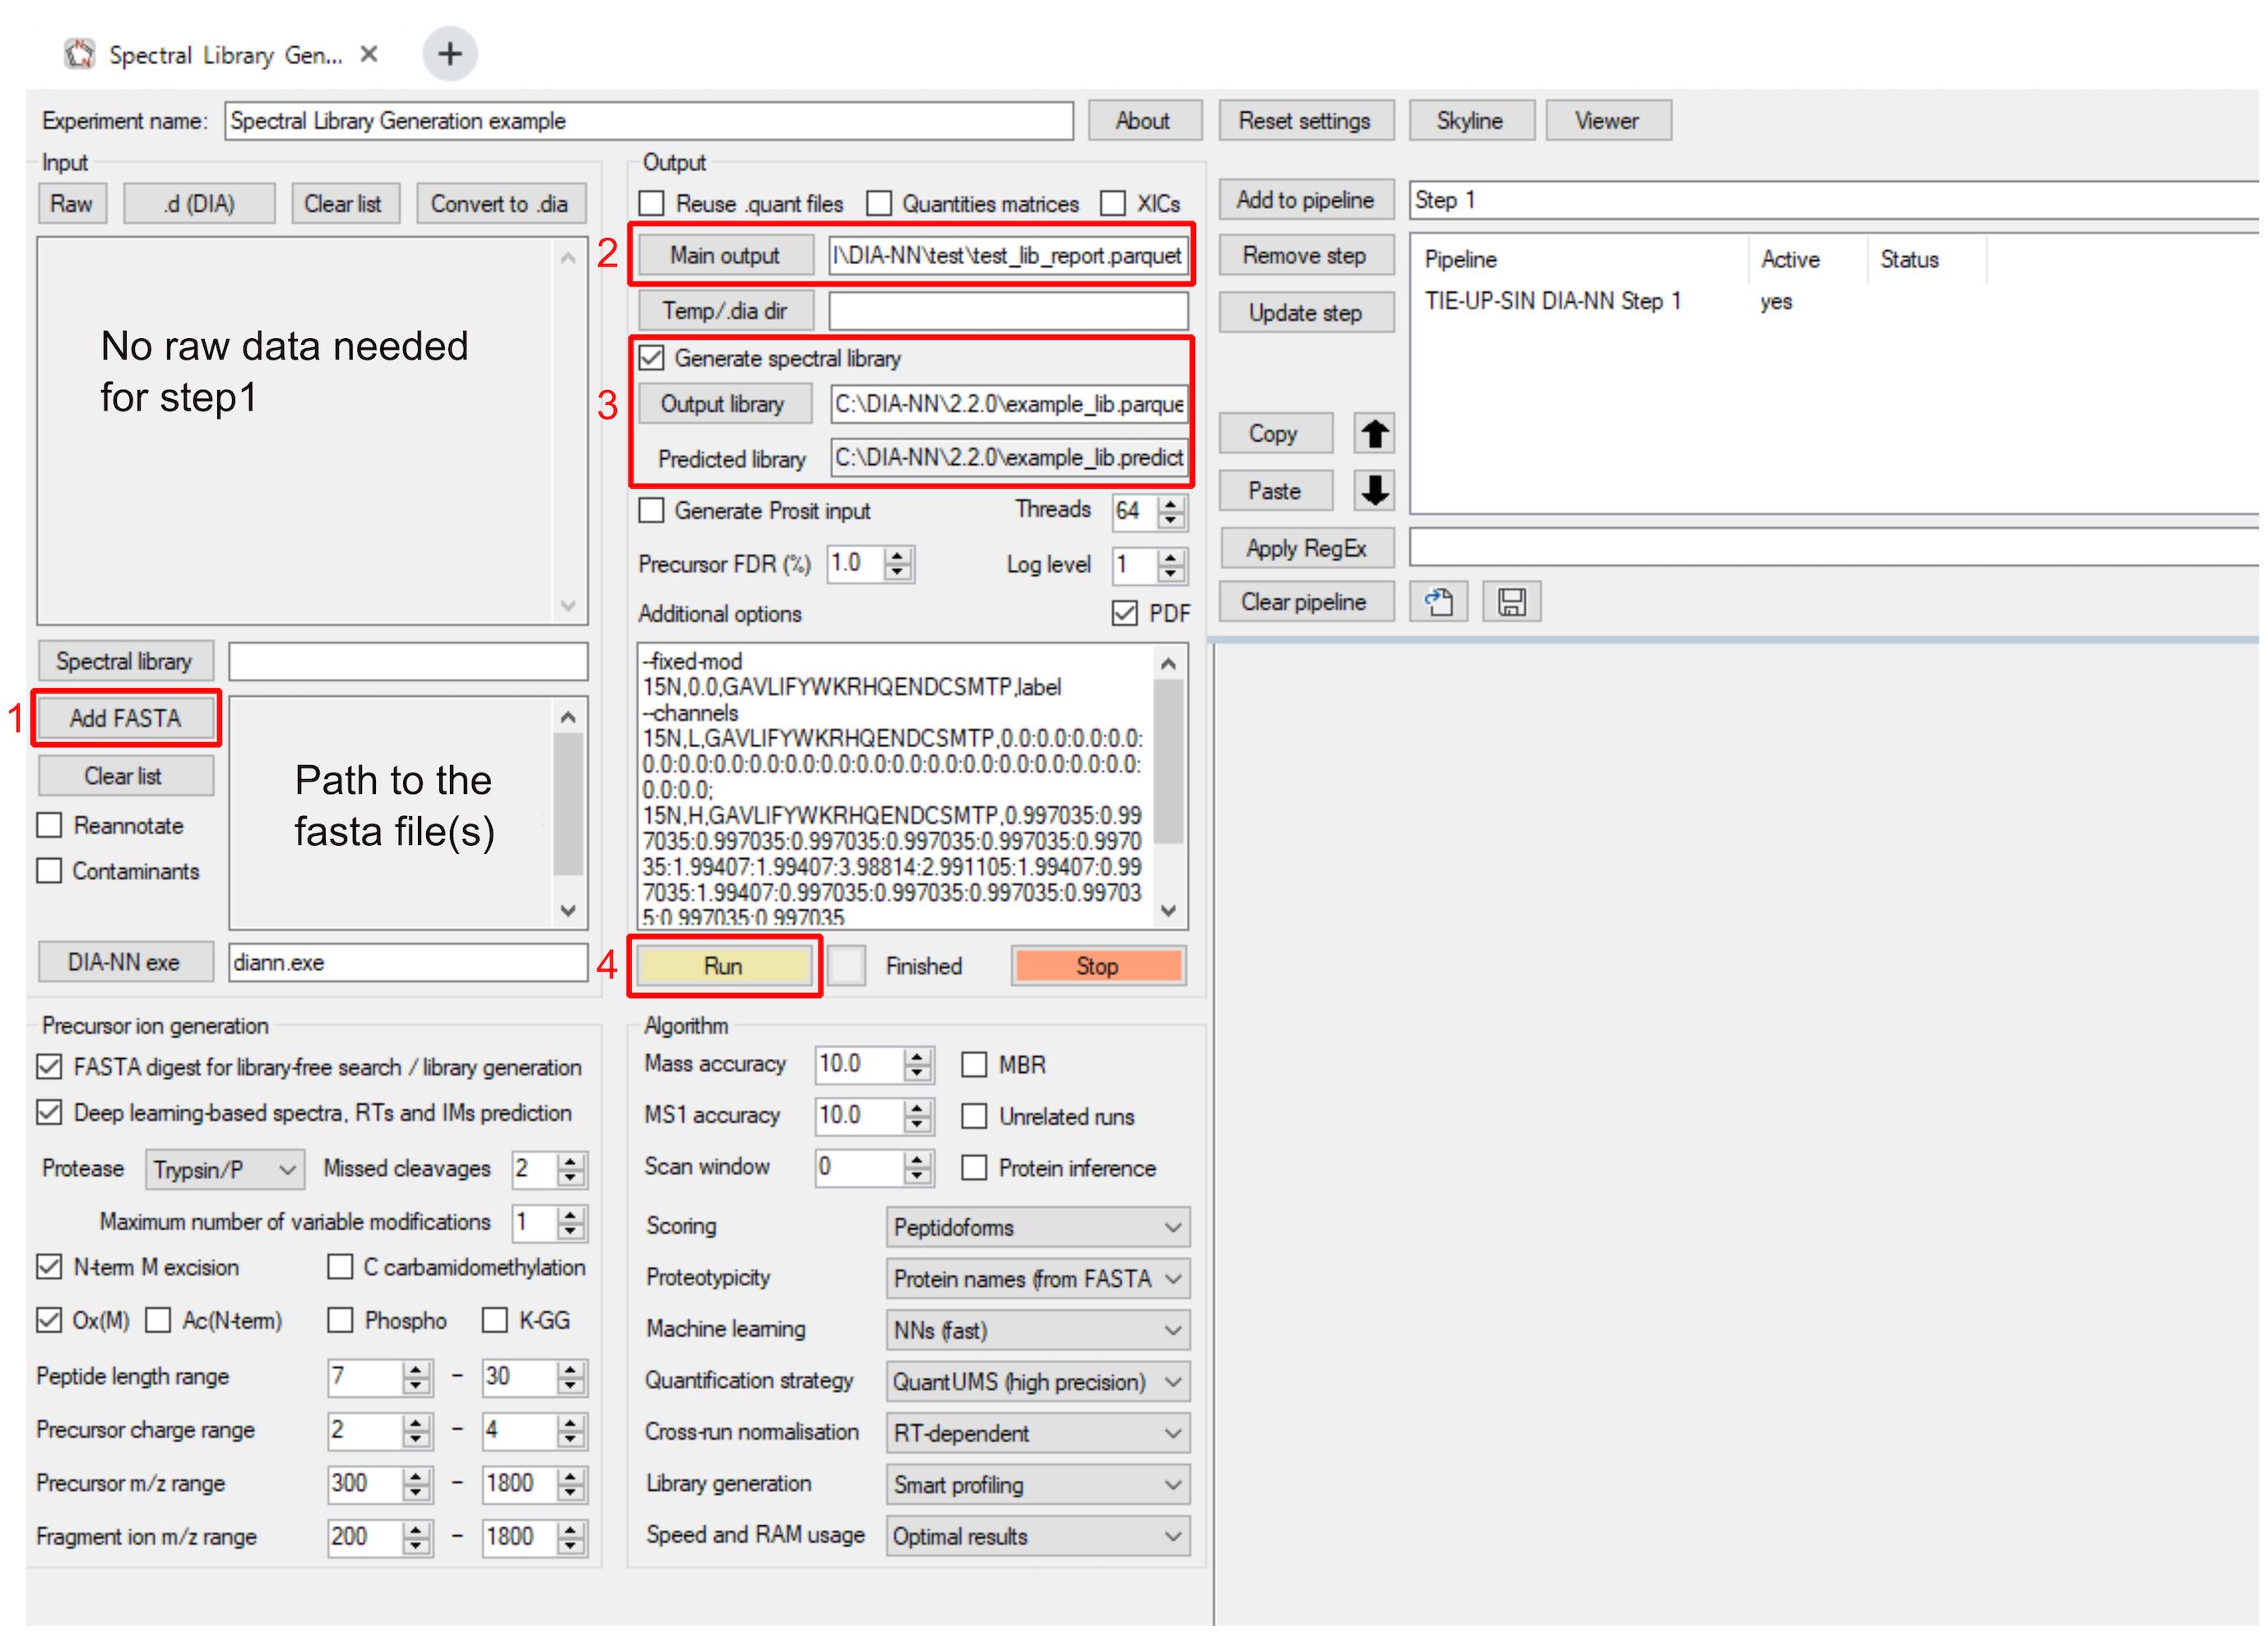
Figure 3. Setup of DIA-NN step 1 to generate a spectral library
Note: Recommended system requirements can be viewed on the Biognosys website: https://biognosys.com/software/spectronaut/
2. Searching the MS-raw data
a. Open a new DIA-NN session and import the TIE-UP-SIN DIA-NN step 2 pipeline, which is available in the web app.
b. After importing the pipeline, click on it to take over the settings.
c. Click the Raw button (red box 1 in Figure 4) and load the four raw files of the replicates of the same sample type.
d. Next, click the Spectral Library button (red box 2 in Figure 4) and load the spectral library generated and saved in the DIA-NN step 1.
e. Set a main output (red box 3 in Figure 4).
f. Finally, click the Run button (red box 4 in Figure 4).
g. After DIA-NN is finished and the report is saved, change the raw files to the next sample type, change the main output to a new directory, and search the second sample type block.
h. Repeat for all three sample types.
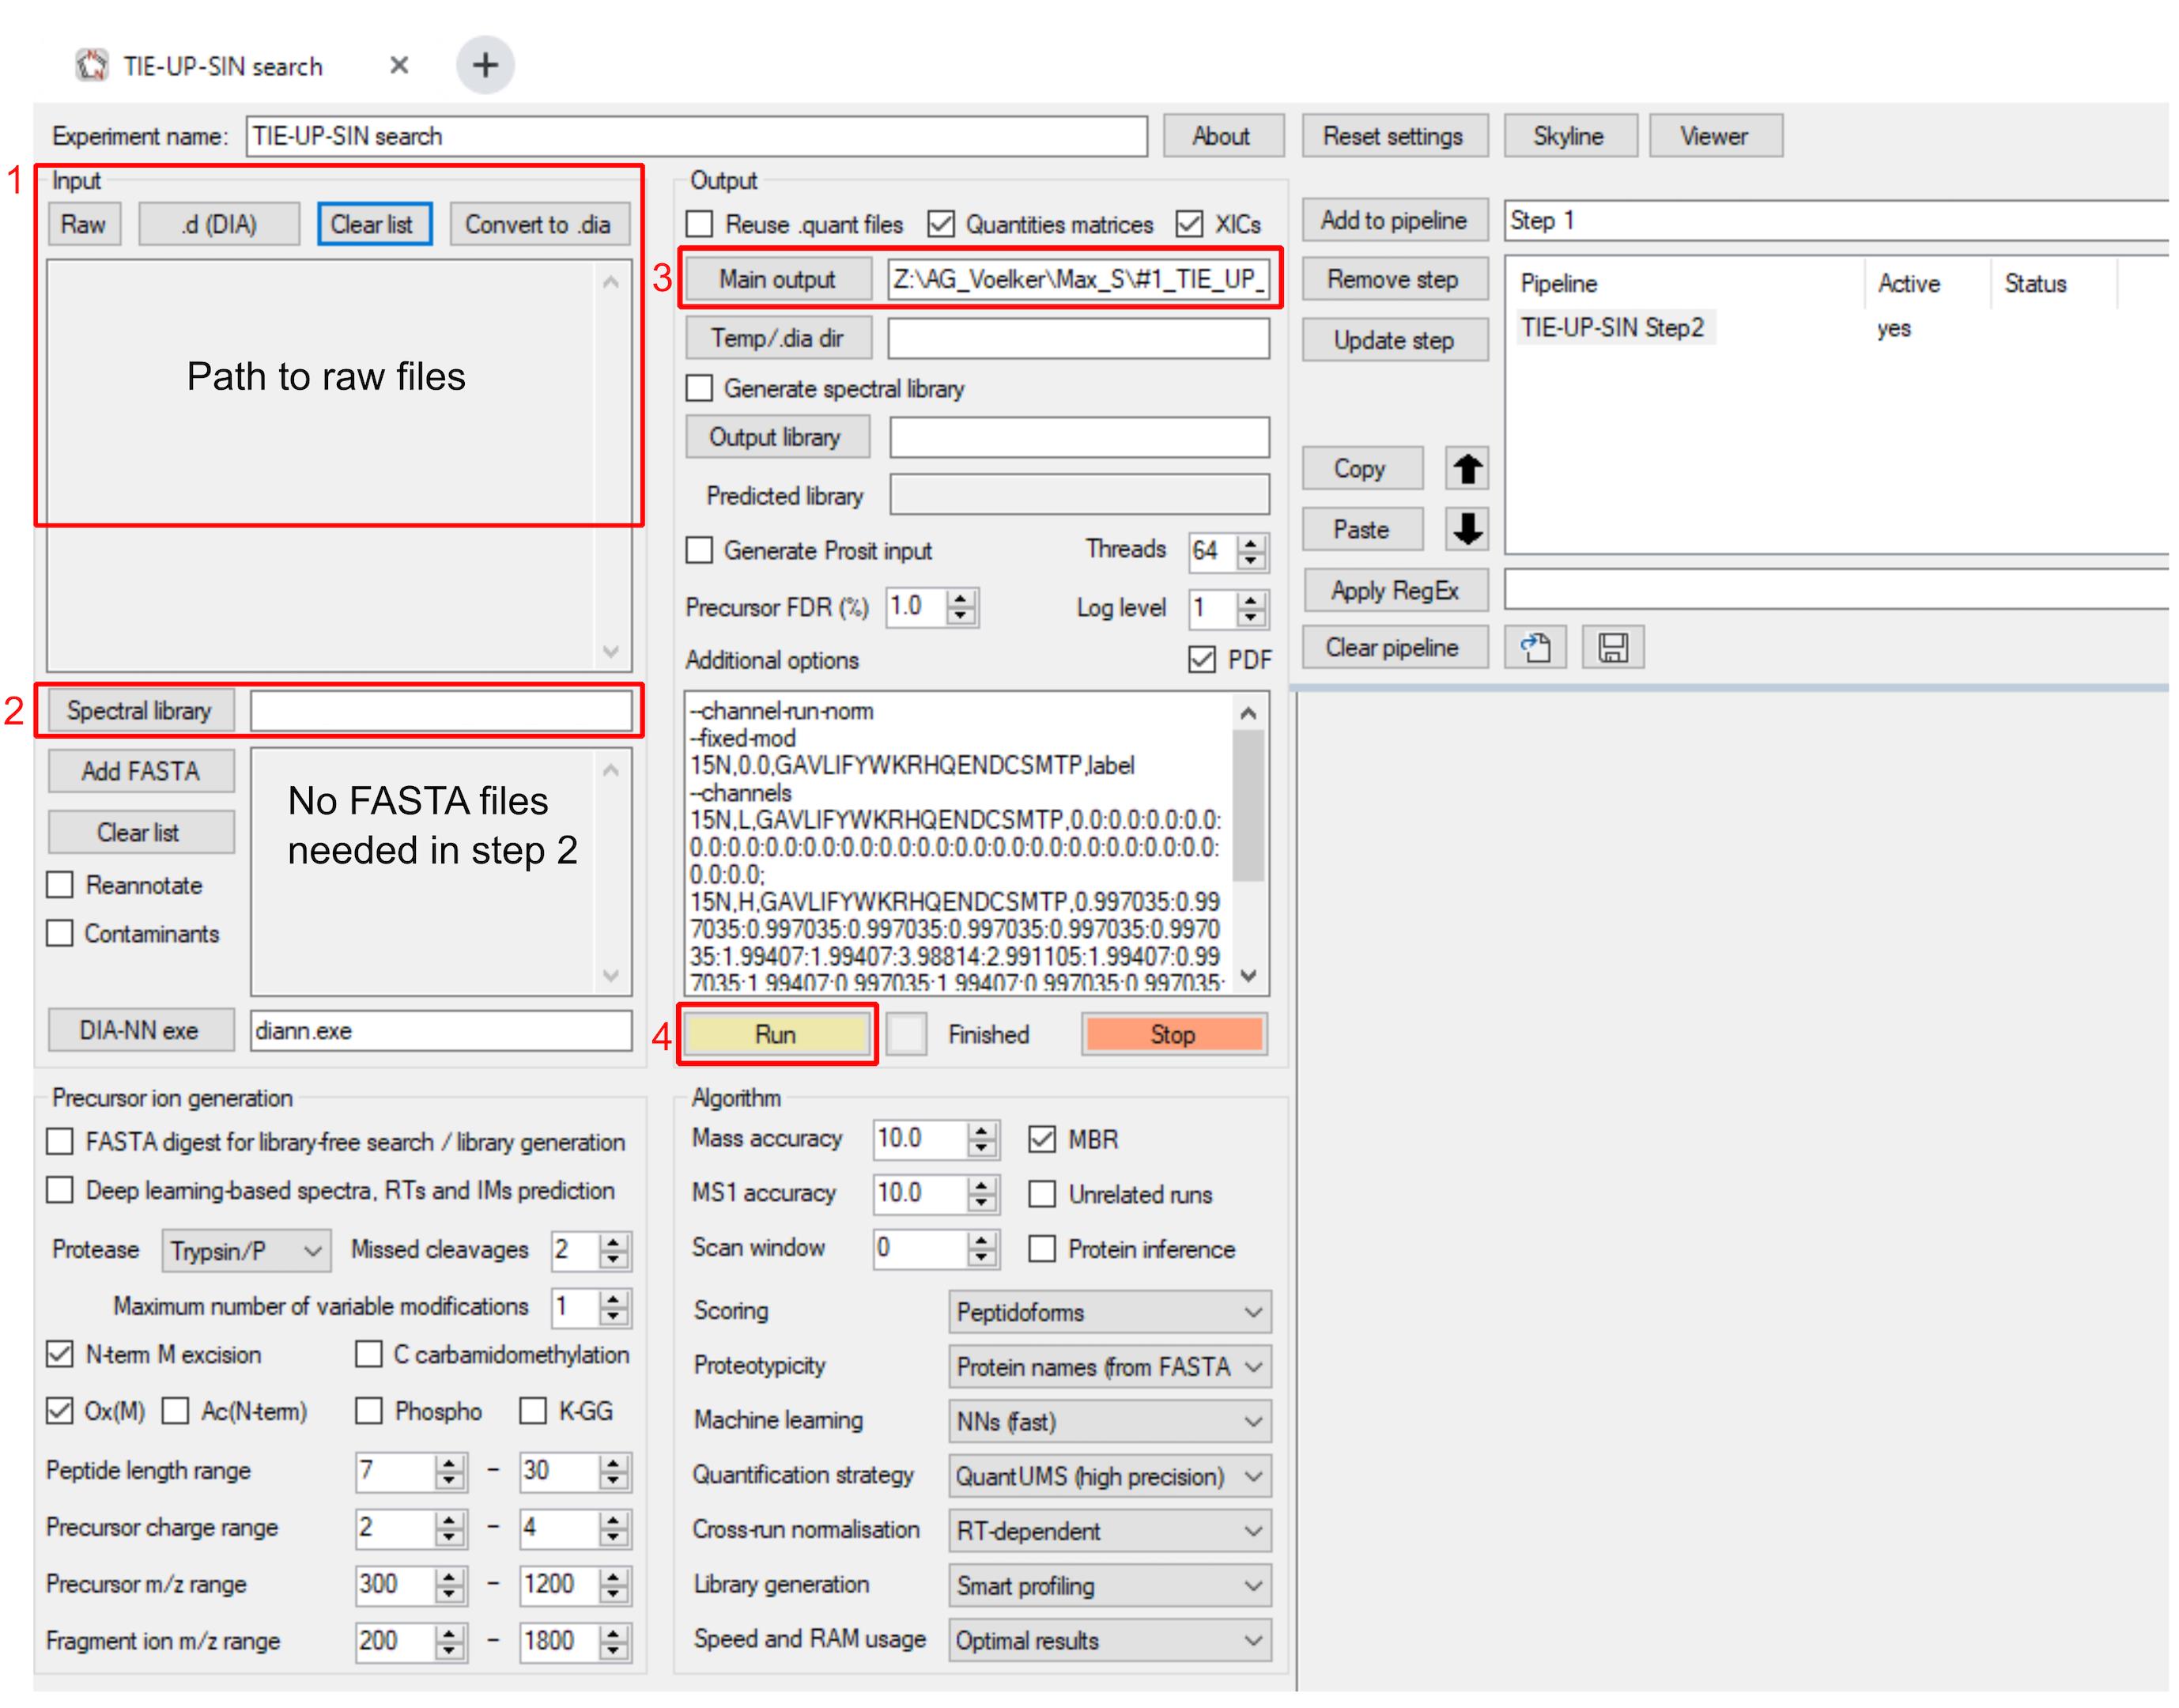
Figure 4. Setup of DIA-NN step 2 to generate a spectral library
Data analysis
A. Statistical analysis using the TIE-UP-SIN web application
Note: Regardless of which search engine you used (Spectronaut or DIA-NN), the subsequent statistical analysis is identical and performed using our web application. For this, no specific skills are required.
1. Navigate to the TIE-UP-SIN analysis web application: https://shiny-fungene.biologie.uni-greifswald.de/TIE_UP_SIN_app
2. Upload your data files: Upload the exported Report_TIE_UP_SIN_Spectronaut (Normal).tsv files from Spectronaut or the report.parquet files from DIA-NN to the corresponding upload fields.
3. When using DIA-NN data, it is also necessary to upload the fasta file(s) of the protein databases used to create the spectral library in DIA-NN step 1.
4. For the first time, we recommend leaving the filters at the standard setting.
5. Click on the process button.
6. The web app performs statistical analyses and gives three result files. The first one is a .png file of the volcano enrichment plots of each sample type. The bait protein should be the most enriched protein in the bait/WT samples. In Figure 5, which shows the volcano plots on the web app for the example data, the bait protein is SigA-TS. RpoC, RpoB, and RpoA are direct interaction partners of SigA. These show fold changes between 20 and 40.
Note: The statistical analysis and reasons behind it are thoroughly discussed in [3].
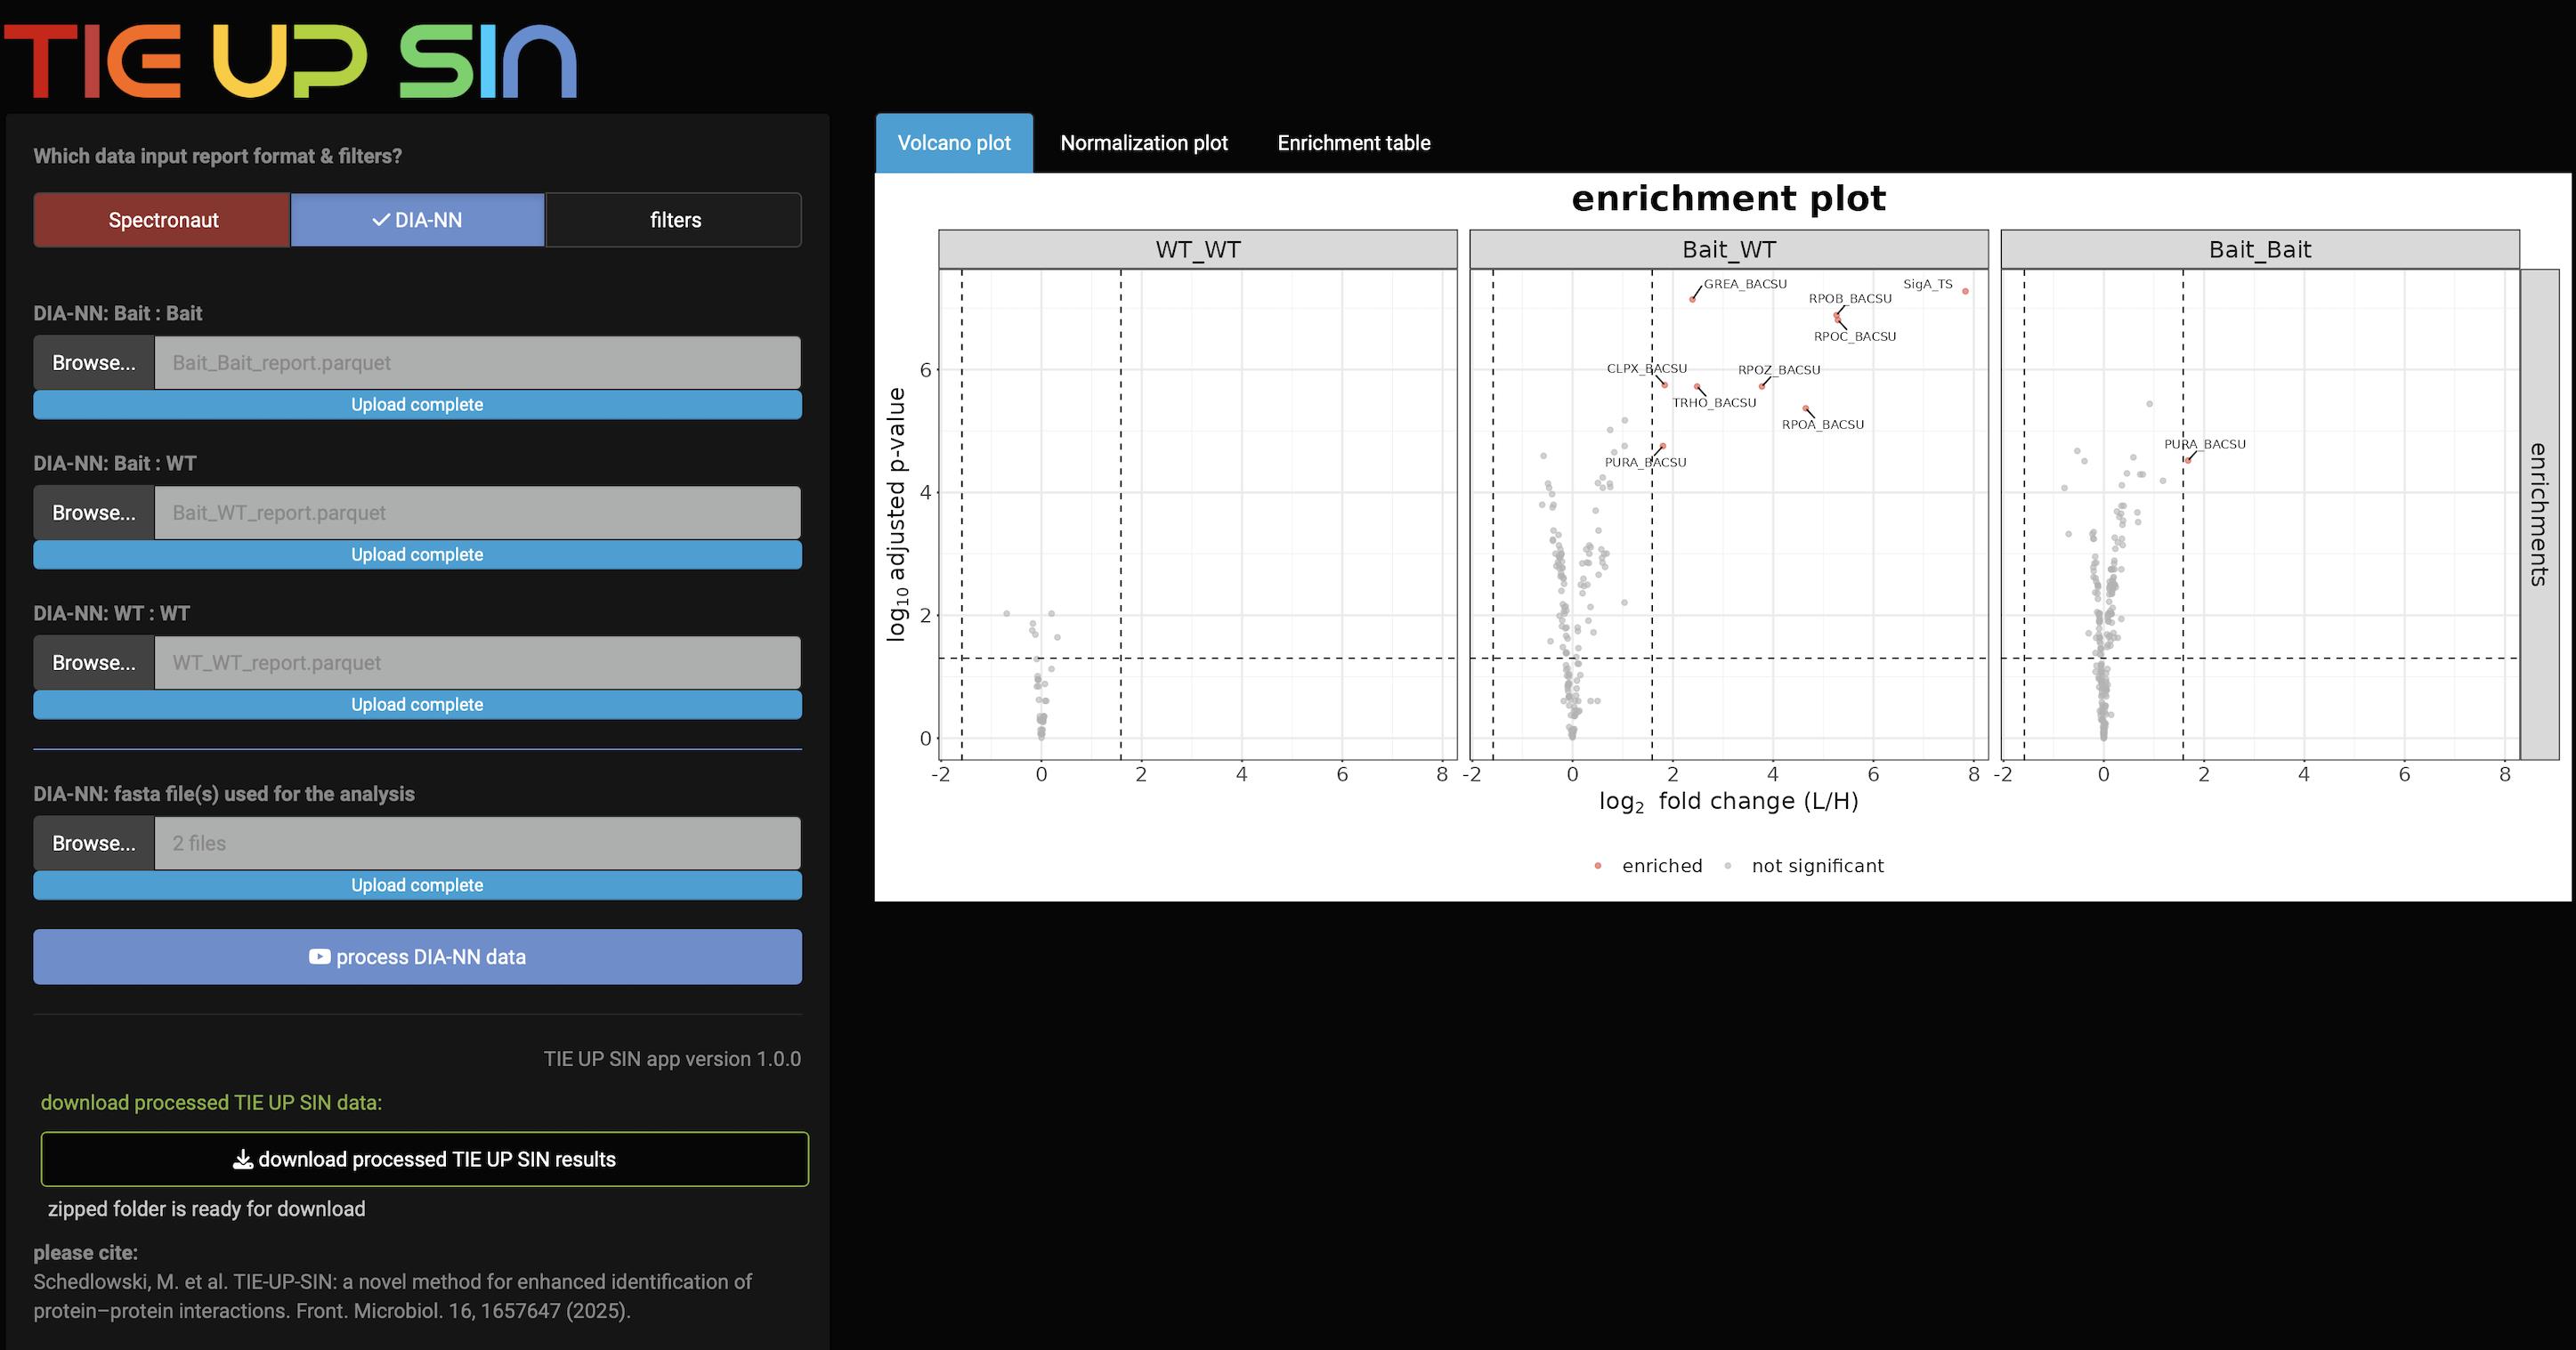
Figure 5. TIE-UP-SIN web app enrichment plots for the example data using DIA-NN reports
7. The second result file is another .png file (Figure 6) showing the L/H ratios of all proteins over all samples before and after normalization.
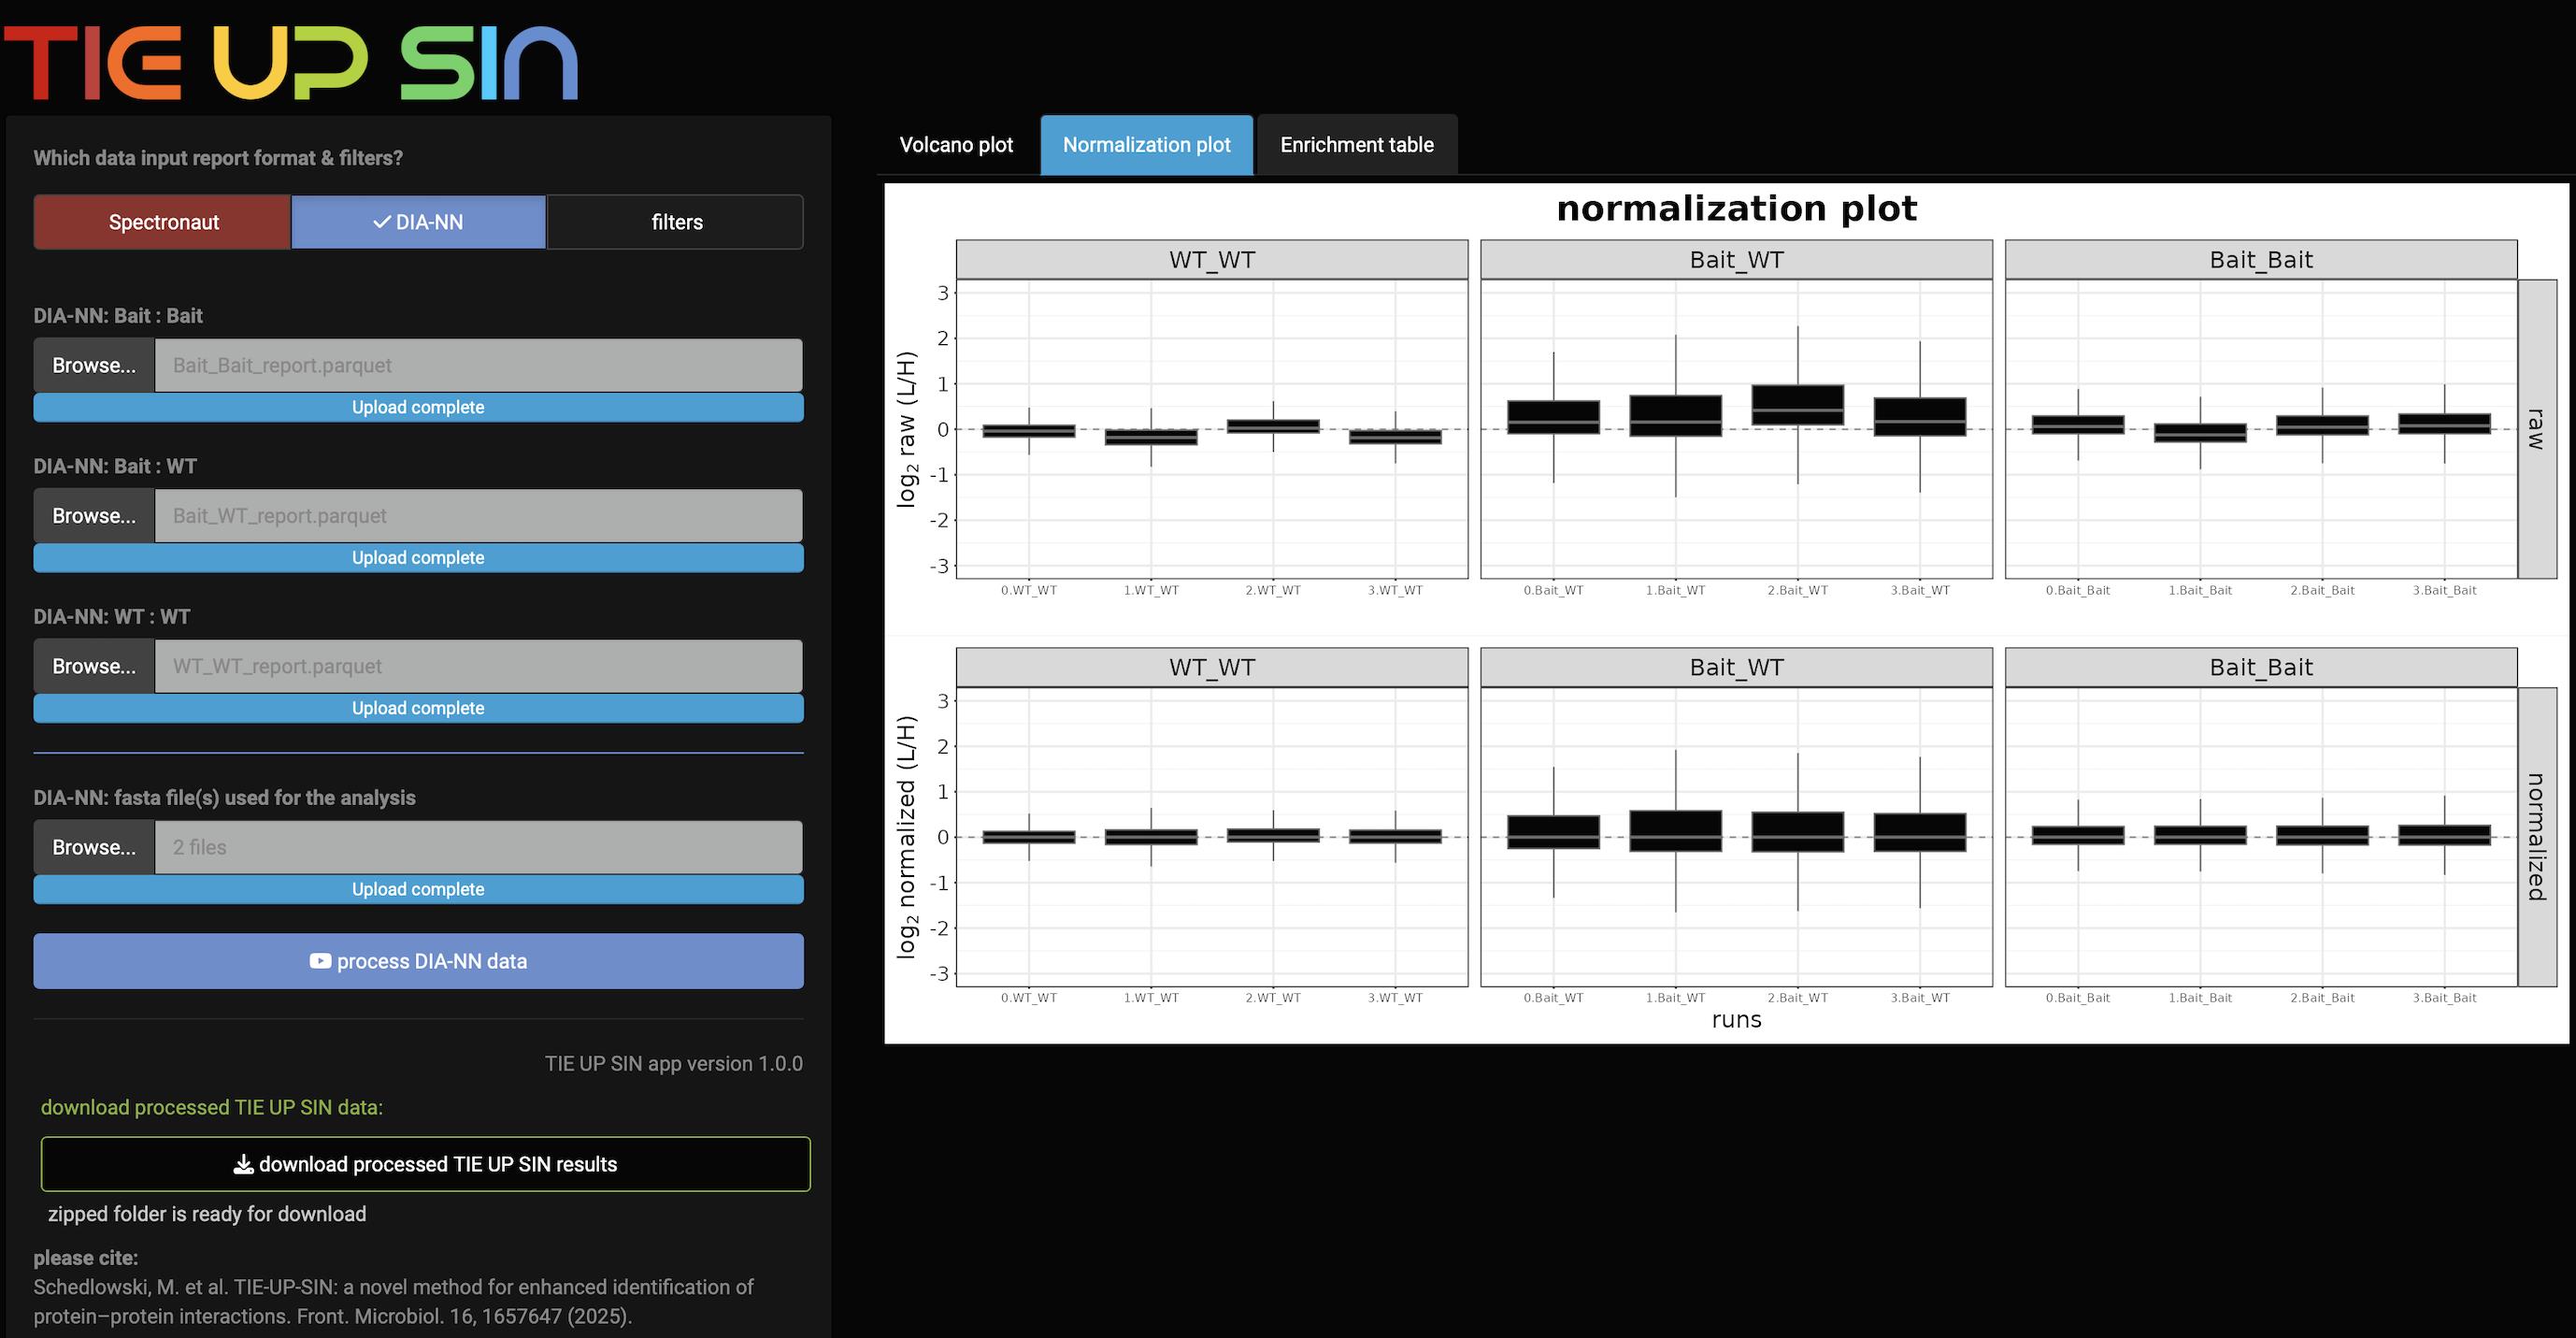
Figure 6. TIE-UP-SIN web app normalization plots for the example data using DIA-NN reports
8. The third and last result file is the enrichment table (Figure 7) of all significant enriched proteins in the Bait_WT samples.
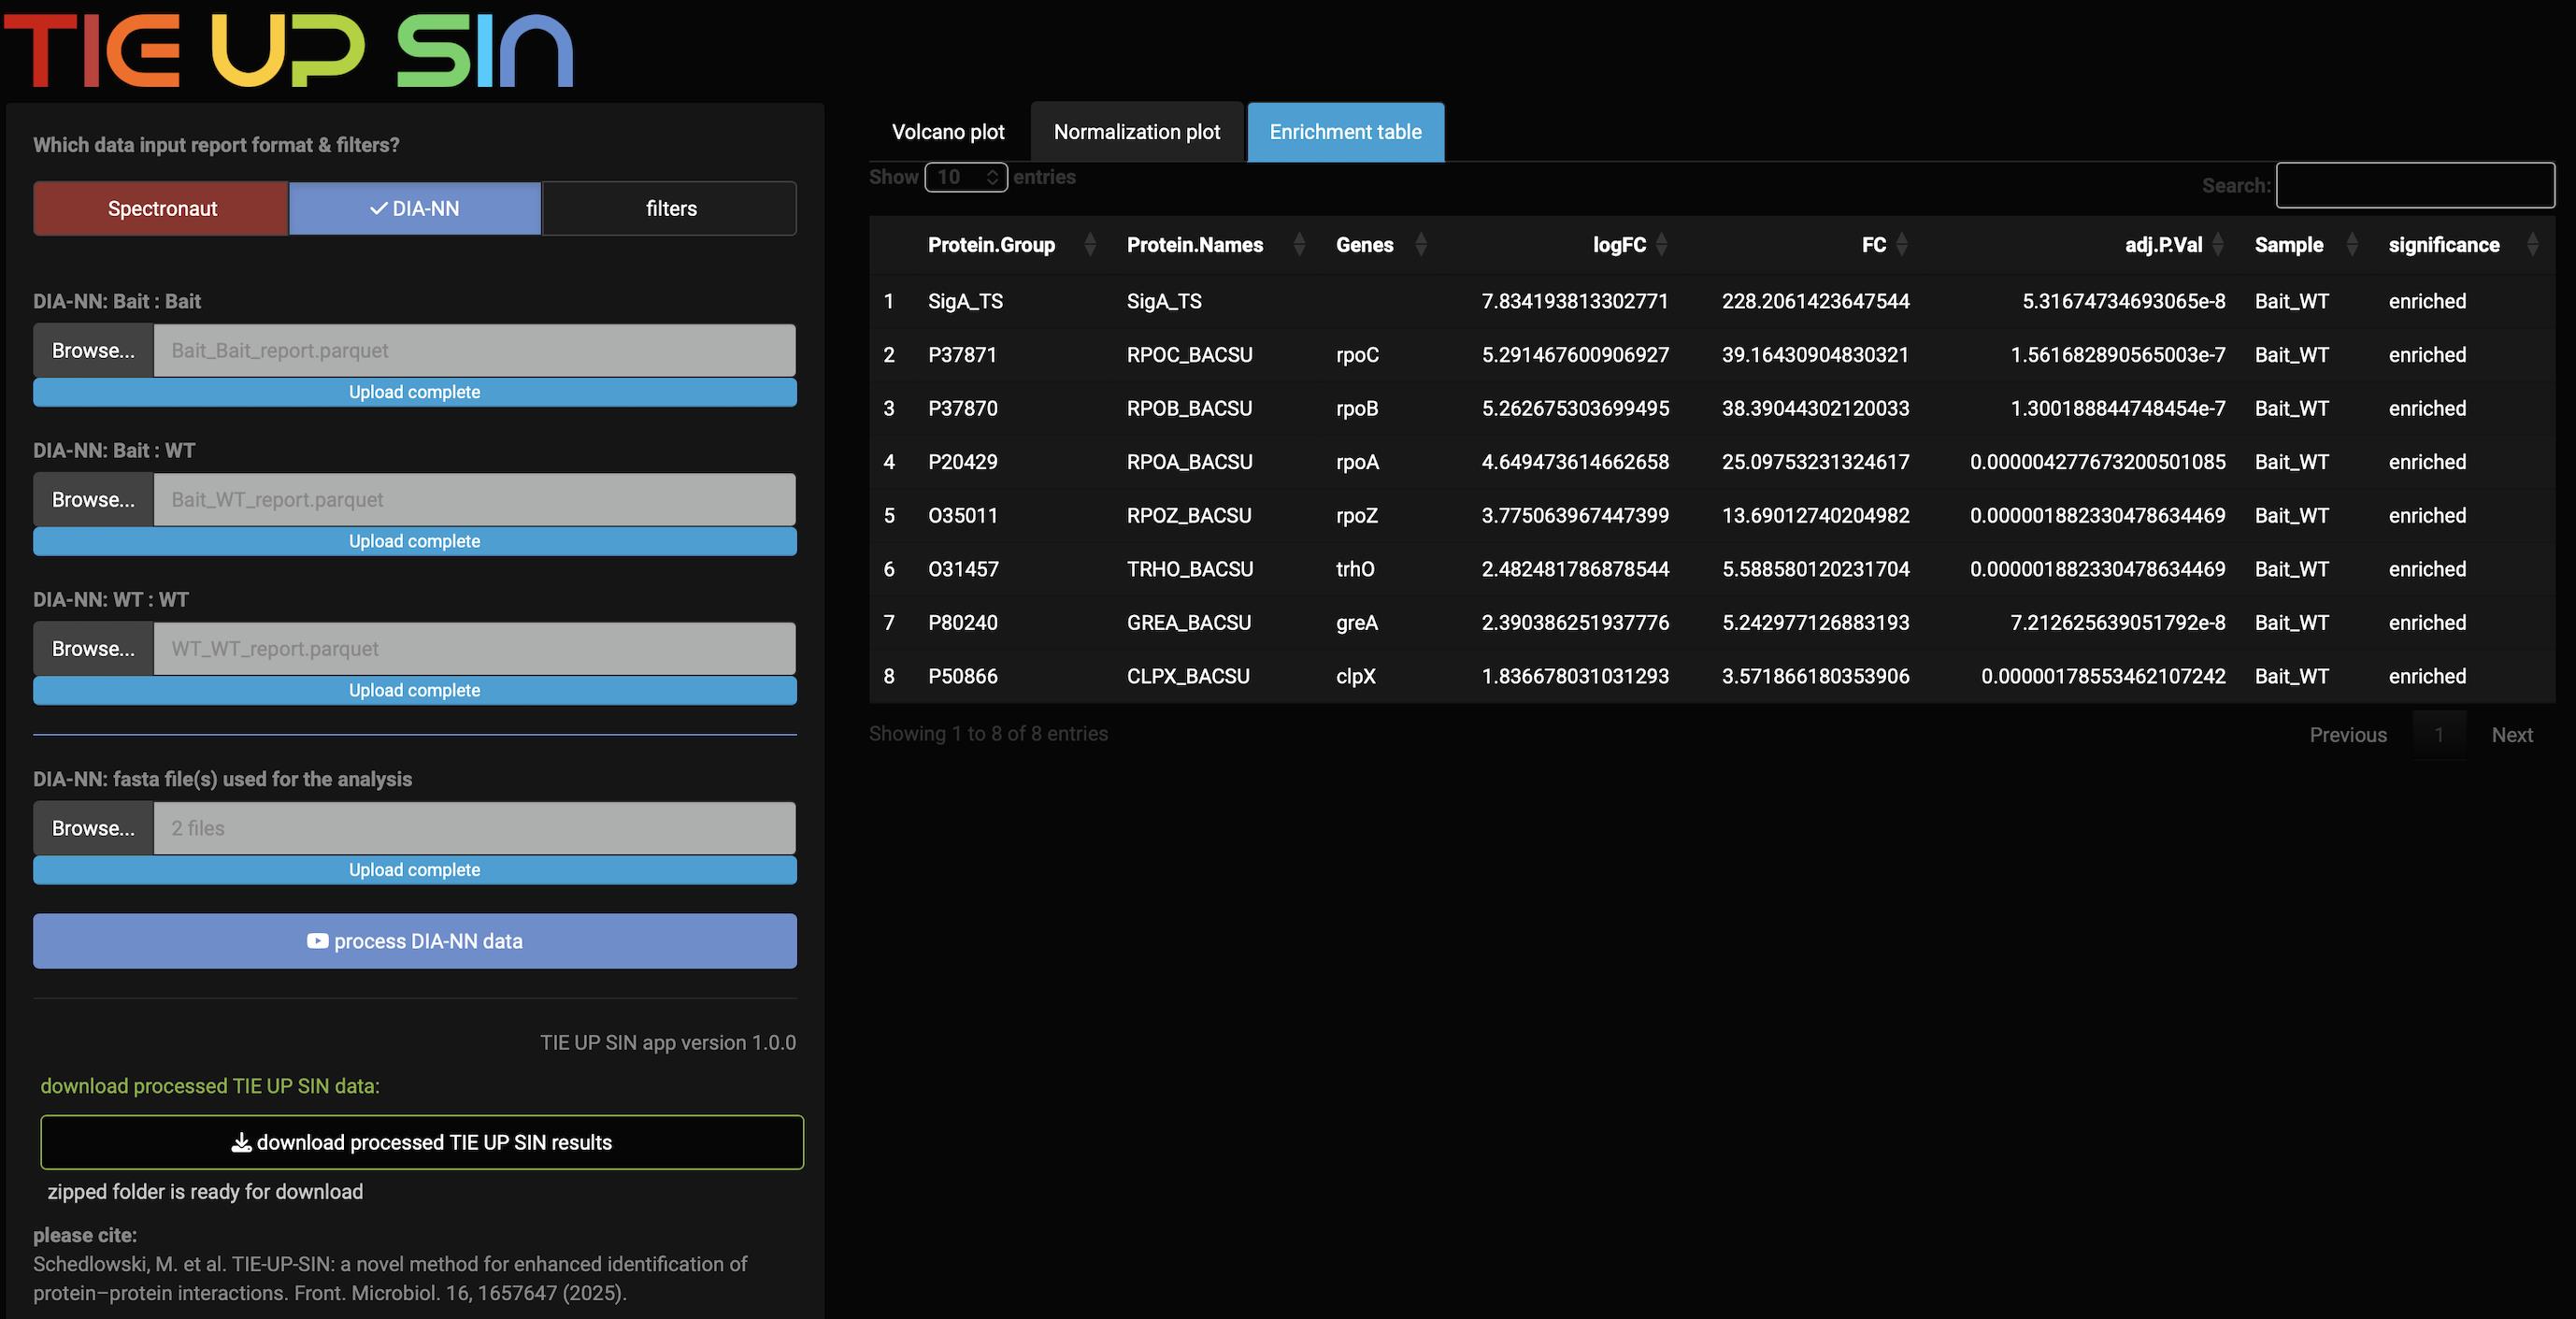
Figure 7. TIE-UP-SIN web app enrichment table for the example data using DIA-NN reports
9. After processing the data, the results can be downloaded.
10. Additionally, it is recommended to adapt the filter parameter in the filters tab to best suit the experimental data. These filter parameters (Figure 8) can be changed, and the app will immediately analyze the data again using these newly set parameters.
Note: Start with the standard filter settings. Generally, it is recommended to adjust the filter parameters as stringently as possible and then decrease stringency stepwise. When using less stringent parameters, the number of identified proteins will increase. Only proteins with high enough p-values and fold changes should be considered as true interaction partners.
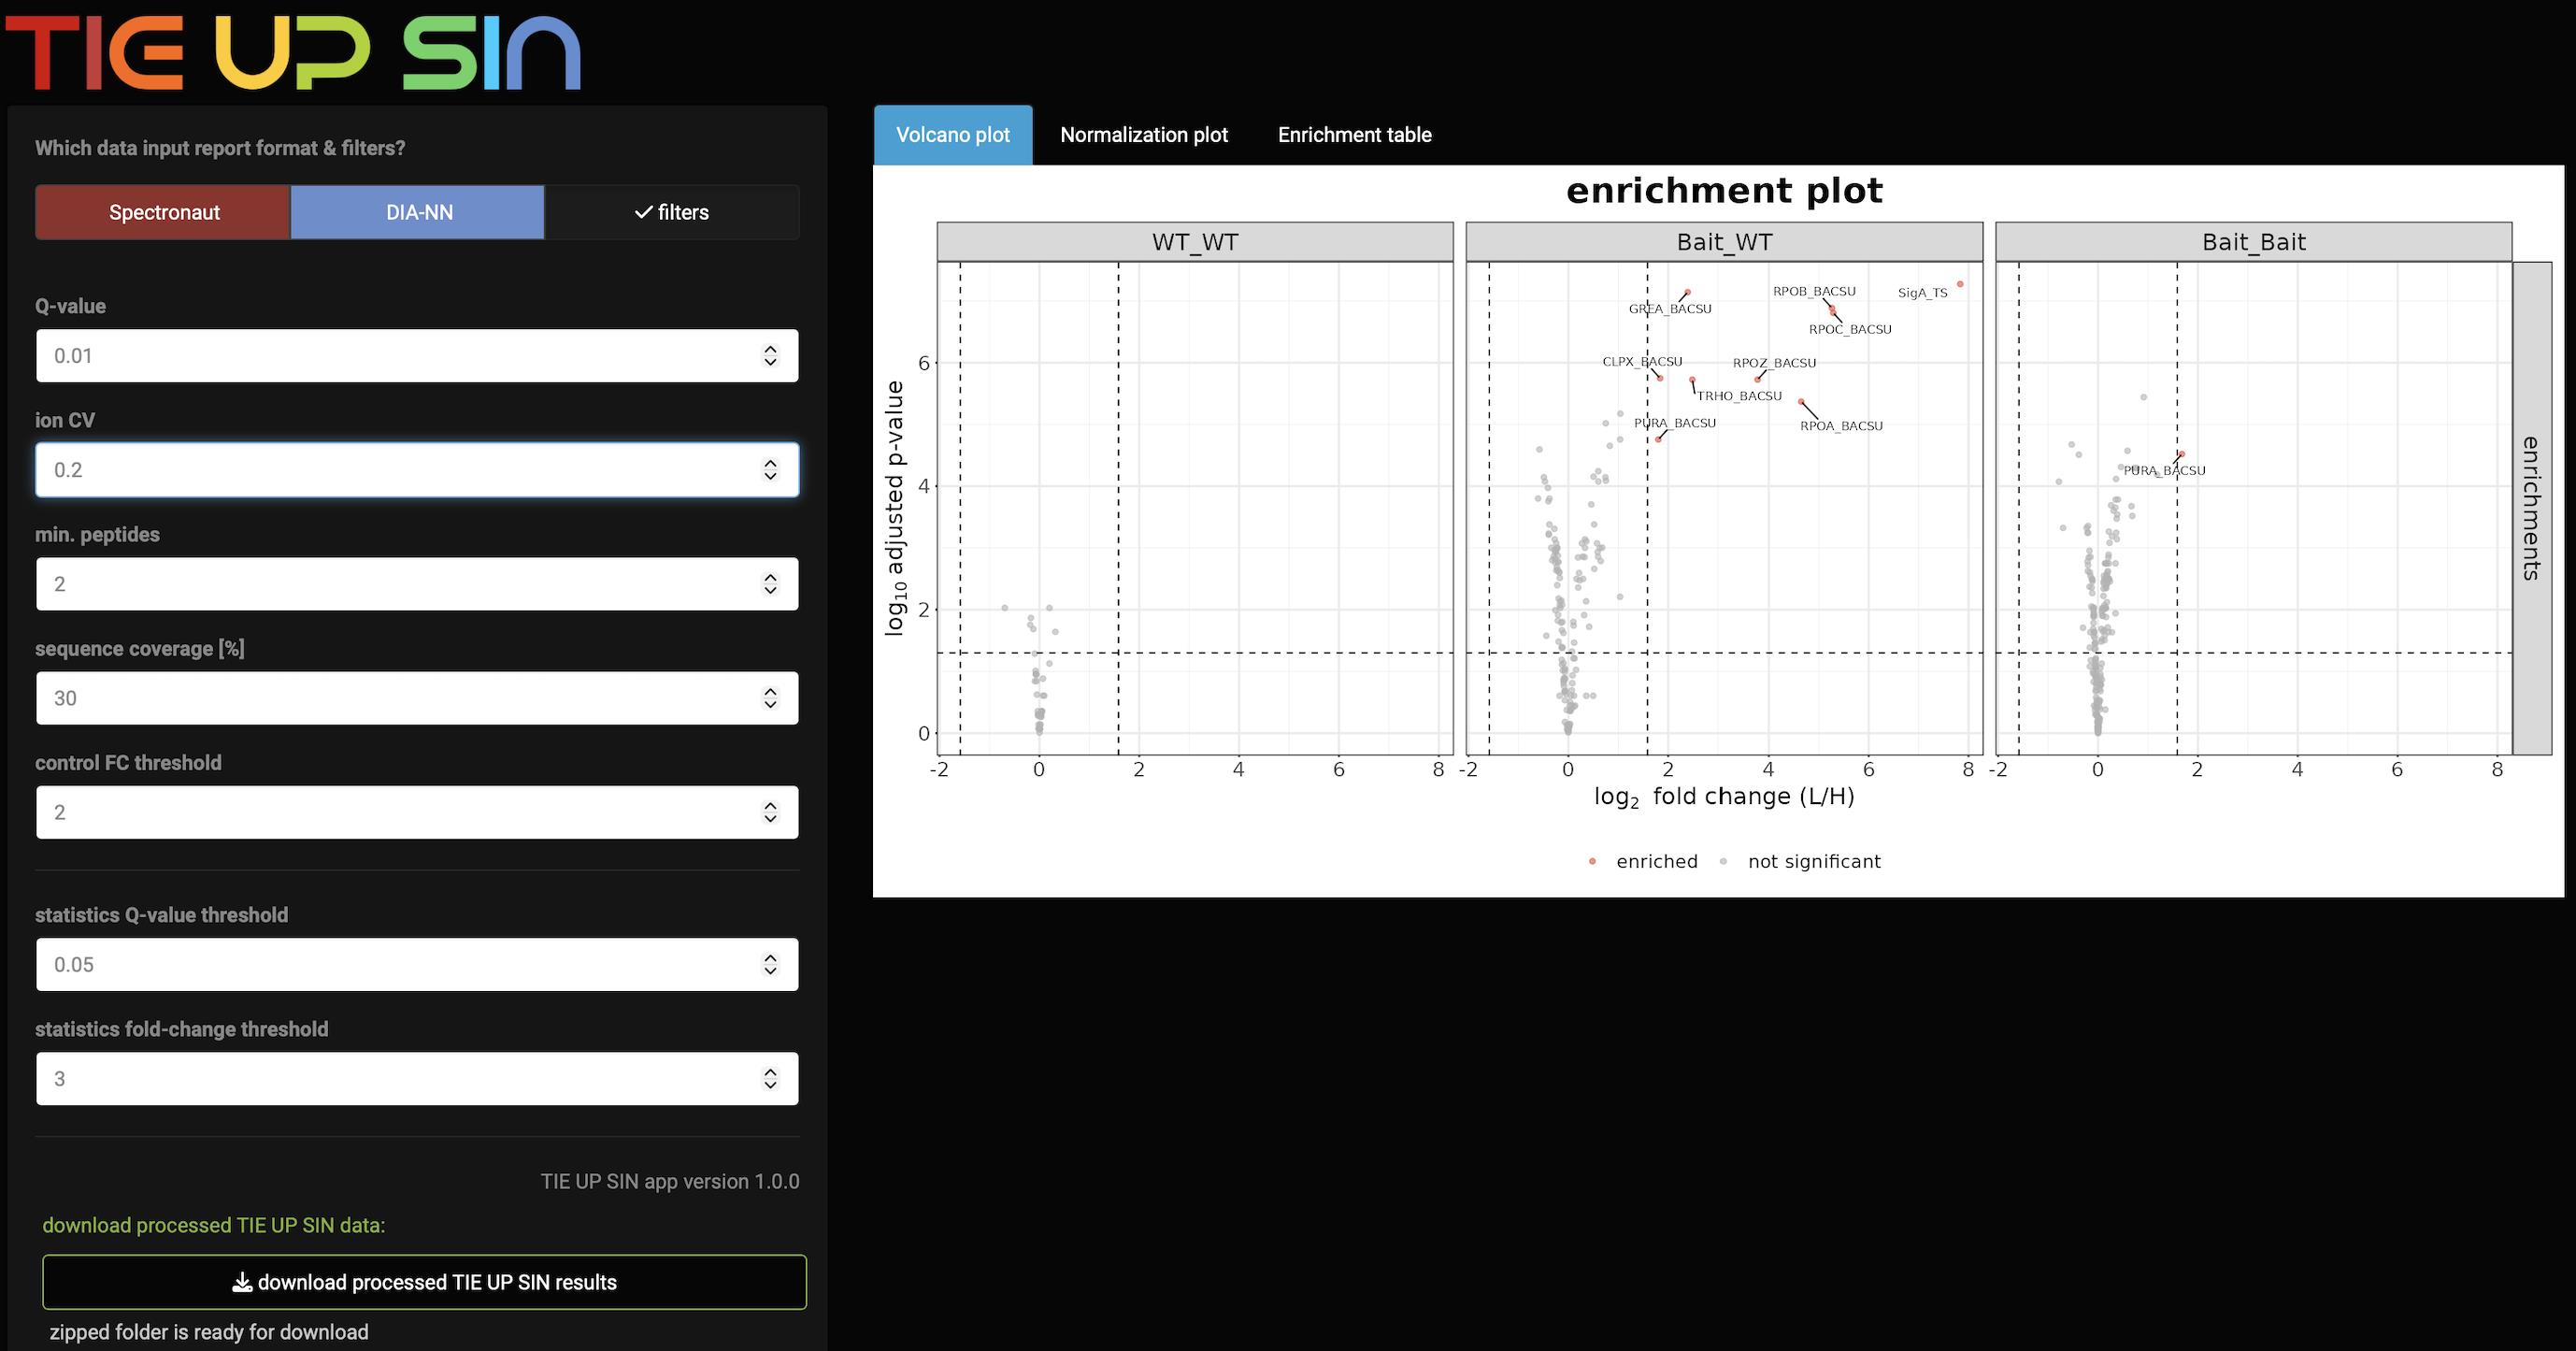
Figure 8. Filters tab of the TIE-UP-SIN web app. Adapt any of the filter parameters, and the web app will immediately recalculate the results.
B. (Alternative) Manual R-based analysis (for advanced users)
For users familiar with R programming, we provide the complete analysis pipeline as R scripts in the supplemental materials of the original TIE-UP-SIN manuscript [3]. Follow the documented R scripts to perform normalization, filtering, and statistical analysis manually.
Validation of protocol
This protocol has been used and validated in the following research article:
• Schedlowski et al. [3]. TIE-UP-SIN: a novel method for enhanced identification of protein–protein interactions. Front Microbiol. 16: e1657647. https://doi.org/10.3389/fmicb.2025.1657647
General notes and troubleshooting
General notes
1. Mixing as near as possible two 8 OD units together is really important. Being accurate here leads to good ratios and smaller normalization factors.
2. The TIE-UP-SIN workflow is, in principle, compatible with other affinity tags (e.g., His6, FLAG, HA), provided the purification allows efficient capture and elution of bait complexes. However, we recommend the Twin-Strep-tag for several reasons: smaller tags such as His6 are prone to co-purifying metal-binding proteins, increasing nonspecific background. The Twin-Strep-tag offers higher specificity via the Strep-TactinXT interaction and permits mild competitive elution with biotin. Its higher affinity (low nanomolar Kd) also improves reproducibility across the metabolic labeling–based quantification central to TIE-UP-SIN. If alternative tags are used, additional controls and more stringent filtering of background interactors are advisable.
3. Adaptations for low-abundance, unstable, or transiently expressed proteins:
a. For proteins that are expressed at very low levels, we recommend placing the tagged gene under the control of a stronger or inducible promoter to increase bait abundance. However, overexpression should be carefully titrated to avoid non-physiological interactions, and comparison with a native-promoter construct is advisable where feasible. Scaling up the culture volume (e.g., to 1–2 L) can further compensate for low expression levels.
b. For unstable proteins or transient protein complexes, in vivo crosslinking with formaldehyde at the point of harvest can stabilize interactions that would otherwise be lost during purification. Formaldehyde rapidly forms reversible methylene bridges between proteins in close spatial proximity, effectively capturing the interaction state at the moment of harvest. The crosslinker concentration and incubation time (5–15 min) must be carefully optimized, as over-crosslinking increases background and can impair bait solubility.
c. For transiently expressed proteins (e.g., those restricted to specific growth phases or stress conditions), the harvesting time point must be matched precisely to the window of peak expression, ideally validated by a prior time-course western blot experiment.
d. In all cases, we recommend verifying bait enrichment by western blot before proceeding to mass spectrometry, and including a non-tagged control processed under identical conditions.
4. If the protein concentration seems too low in the elution of the TactinXT purification, do not hesitate to measure the samples via MS. There is only a very low amount of protein needed. It should be only your bait and a few targets.
Troubleshooting
Problem 1: Not enough material after the purification.
Possible causes: Crosslinking FA concentration too high or incubation time too long. Tag is crosslinked as well.
Solutions: Reduce FA crosslinking concentration and incubation time.
Problem 2: Normalization factors are too high.
Possible cause: Not close enough to a 1:1 ratio while mixing light and heavy pellets.
Solution: Try to mix nearly identical cell amounts.
Problem 3: Not enough protein concentration in the elution after purification.
Possible cause: Too much volume during binding. The purification works best if the ratio of magnetic beads to volume is rather high.
Solution: Increase the protein concentration or use less volume if possible.
Acknowledgments
M.S.: Visualization, Formal analysis, Software, Writing—original draft, Writing—review & editing, Conceptualization, Validation, Resources, Investigation, Methodology. S.M.: Software, Formal analysis, Writing—original draft, Writing—review & editing, Validation. T.H.: Writing—original draft, Investigation, Writing—review & editing. M.H.: Methodology, Writing—original draft, Investigation, Writing—review & editing. L.S.: Methodology, Writing—review & editing, Formal analysis, Writing—original draft. K.S.: Writing—original draft, Investigation, Writing—review & editing. C.H.: Writing—review & editing, Investigation, Writing—original draft. M.G.S.: Writing—original draft, Investigation, Writing—review & editing. U.V.: Supervision, Writing—original draft, Funding acquisition, Writing—review & editing, Project administration. A.R.: Conceptualization, Validation, Supervision, Writing—original draft, Writing—review & editing.
The author(s) declare that financial support was received for the research and/or publication of this article. This work was partially supported by the EU Horizon 2020 Rafts4Biotech grant 720776–2 (to AR and UV).
Schematic figures were designed using BioRender and InkScape. We also warmly thank the dedicated team at ProTec Diagnostics GmbH (Germany, Greifswald) for their excellent technical assistance and continued support throughout this project. This protocol was used in [3].
Competing interests
The authors declare that they have no competing interests.
References
- Herzberg, C., Weidinger, L. A. F., Dörrbecker, B., Hübner, S., Stülke, J. and Commichau, F. M. (2007). SPINE: a method for the rapid detection and analysis of protein-protein interactions in vivo. Proteomics. 7(22): 4032–4035. https://doi.org/10.1002/pmic.200700491
- Nicolas, P., Mäder, U., Dervyn, E., Rochat, T., Leduc, A., Pigeonneau, N., Bidnenko, E., Marchadier, E., Hoebeke, M., Aymerich, S., et al. (2012). Condition-dependent transcriptome reveals high-level regulatory architecture in Bacillus subtilis. Science. 335(6072): 1103–1106. https://doi.org/10.1126/science.1206848
- Schedlowski, M., Michalik, S., Hoffmüller, T., Harms, M., Steil, L., Surmann, K., Hentschker, C., Salazar, M. G., Völker, U., Reder, A., et al. (2025). TIE-UP-SIN: a novel method for enhanced identification of protein–protein interactions. Front Microbiol. 16: e1657647. https://doi.org/10.3389/fmicb.2025.1657647
- Demichev, V., Messner, C. B., Vernardis, S. I., Lilley, K. S. and Ralser, M. (2020). DIA-NN: neural networks and interference correction enable deep proteome coverage in high throughput. Nat Methods. 17(1): 41–44. https://doi.org/10.1038/s41592-019-0638-x
- Reder, A., Hentschker, C., Steil, L., Gesell Salazar, M., Hammer, E., Dhople, V. M., Sura, T., Lissner, U., Wolfgramm, H., Dittmar, D., et al. (2024). MassSpecPreppy—An end-to-end solution for automated protein concentration determination and flexible sample digestion for proteomics applications. Proteomics. 24(9): 2300294. https://doi.org/10.1002/pmic.202300294
Article Information
Publication history
Received: Jan 21, 2026
Accepted: Mar 13, 2026
Available online: Mar 30, 2026
Published: Apr 20, 2026
Copyright
© 2026 The Author(s); This is an open access article under the CC BY-NC license (https://creativecommons.org/licenses/by-nc/4.0/).
How to cite
Schedlowski, M., Michalik, S., Hoffmüller, T., Harms, M., Steil, L., Surmann, K., Hentschker, C., Salazar, M. G., Völker, U. and Reder, A. (2026). TIE-UP-SIN: A Method for Enhanced Identification of Protein–Protein Interactions. Bio-protocol 16(8): e5663. DOI: 10.21769/BioProtoc.5663.

 Download Citation in RIS Format
Category
Microbiology > Microbial proteomics > Whole organism
Molecular Biology > Protein > Protein-protein interaction
Bioinformatics and Computational Biology
Do you have any questions about this protocol?
Post your question to gather feedback from the community. We will also invite the authors of this article to respond.
 Post a Question


