- Protocols

- Articles and Issues
- For Authors
- About
- Become a Reviewer

Optimized Mechanical Isolation of Mitochondria From Saccharomyces cerevisiae Preserving Atg32 for Quantitative Analysis
(§Technical contact: amendoza@ifc.unam.mx) Published: Vol 16, Iss 4, Feb 20, 2026 DOI: 10.21769/BioProtoc.5610 Views: 304
Reviewed by: Hemant Kumar PrajapatiPriyanka MittalAnonymous reviewer(s)
Advertisement


Protocol Collections
Comprehensive collections of detailed, peer-reviewed protocols focusing on specific topics


Related protocols
Abstract
Mitophagy is a highly conserved process among eukaryotic cells, playing a primordial role in mitochondrial quality control and overall cellular homeostasis. In Saccharomyces cerevisiae, Atg32 is the only identified mitophagy receptor localized to the mitochondrial outer membrane, making this yeast a particularly powerful model for molecular studies of mitophagy that require the isolation of intact mitochondria. However, traditional methods for isolating mitochondria from yeast often rely on enzymatic cell wall digestion and homogenization, which can compromise the stability of mitochondrial surface proteins such as Atg32. In this protocol, we describe an optimized mechanical approach for yeast cell disruption using glass beads in a cold, protease-inhibited buffer to preserve mitochondrial integrity and facilitate the detection of Atg32. Subsequent differential centrifugation and washing steps yield mitochondrial fractions suitable for downstream biochemical analyses. This workflow eliminates enzymatic digestion steps, reduces sample variability, and allows parallel processing of multiple strains or experimental conditions. Overall, this method offers a rapid, low-cost, and reproducible alternative for crude mitochondrial isolation, ensuring excellent preservation of Atg32 and broad compatibility with quantitative and comparative studies.
Key features
• Mechanical cell disruption using glass beads preserves mitochondrial integrity and enables reliable immunodetection of Atg32 without requiring enzymatic spheroplasting.
• Rapid, low-cost, and highly reproducible workflow suitable for processing multiple yeast strains or experimental conditions in parallel.
• Optimized cold, protease-inhibited lysis conditions minimize Atg32 degradation and improve detection sensitivity in mitochondrial fractions.
Keywords: MitophagyGraphical overview
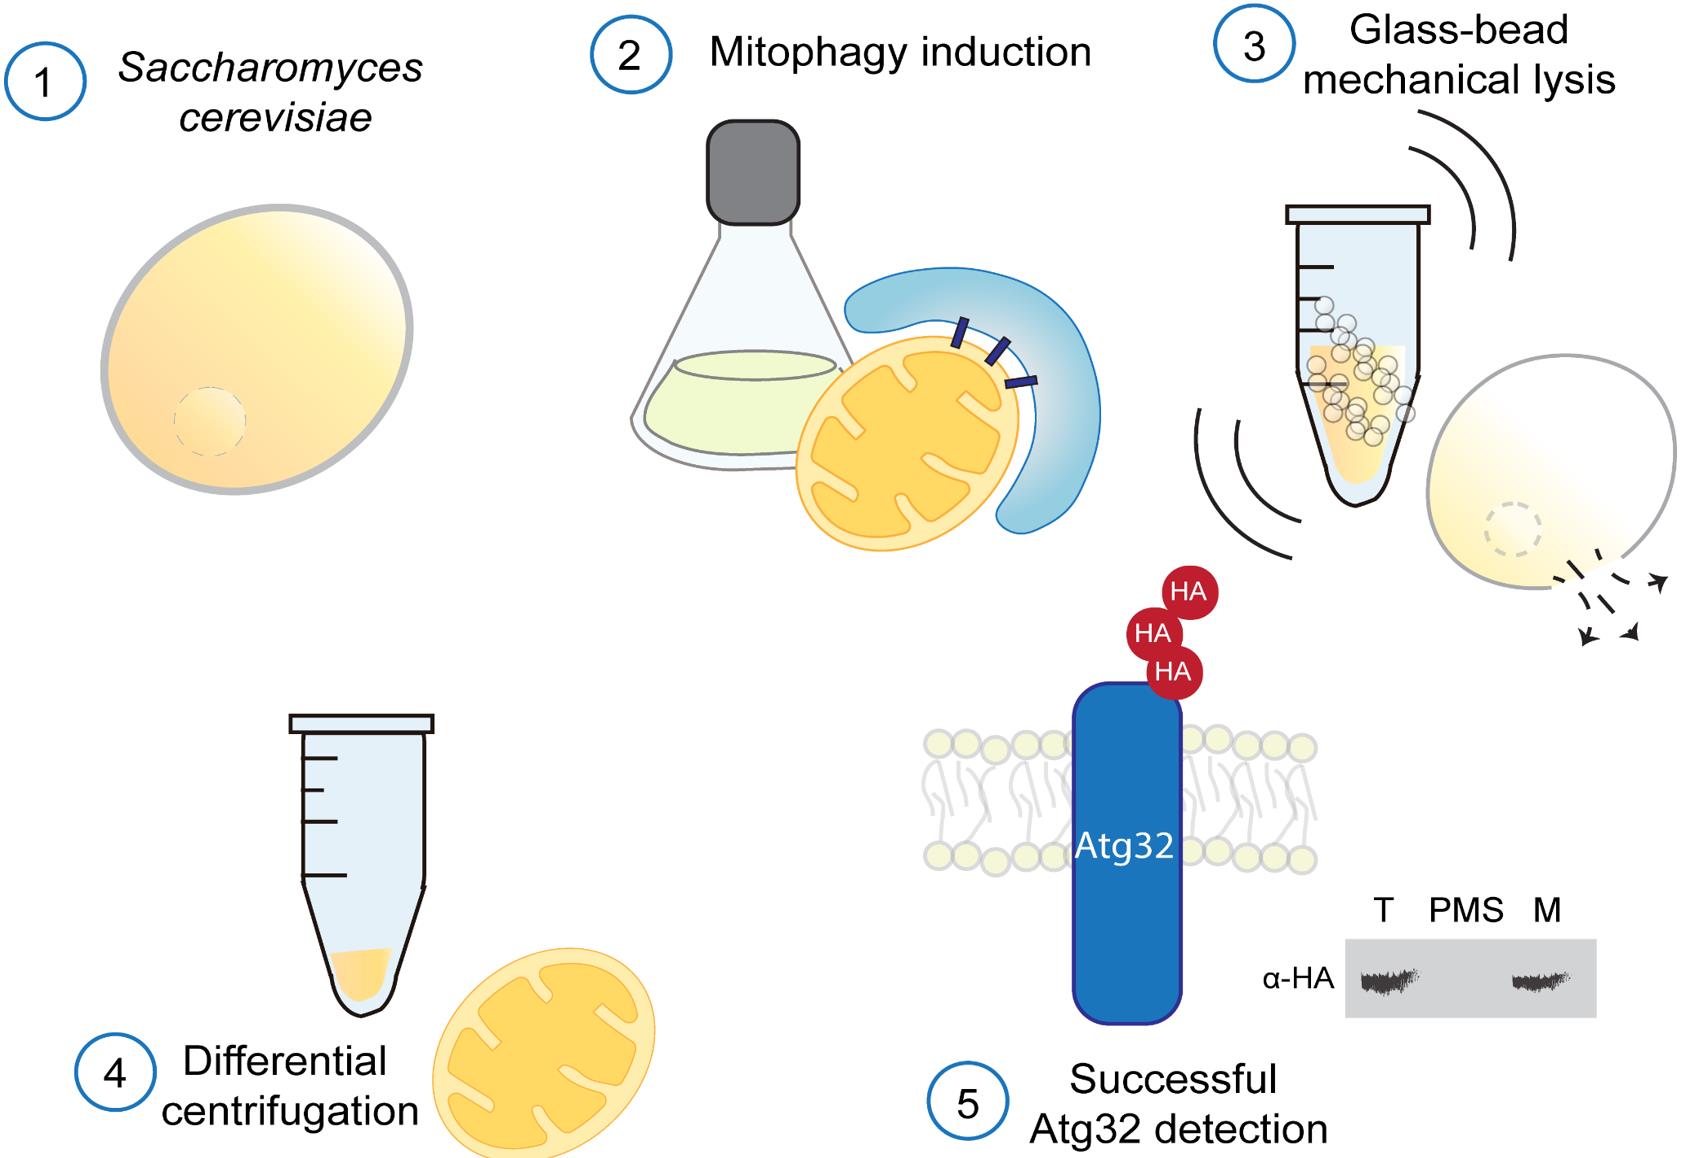
Saccharomyces cerevisiae cells subjected to mitophagy-inducing conditions are lysed by glass-bead vortexing under strictly cold conditions, with the addition of protease inhibitors to preserve mitochondrial integrity and Atg32 stability. Crude extracts are fractionated by differential centrifugation to obtain total (T), post-mitochondrial supernatant (PMS), and mitochondrial (M) fractions. 3HA-Atg32 is detected by immunoblotting.
Background
Mitochondrial quality control is essential for cellular homeostasis and is maintained through dynamic processes, including mitochondrial degradation (mitophagy) and mitochondrial biogenesis. Mitophagy is a degradation process of mitochondrial portions that depends on the autophagic machinery [1]. For mitochondria selective recognition, several receptor proteins have been identified at the outer mitochondrial membrane in metazoans [2–8]. However, the yeast Saccharomyces cerevisiae utilizes a single well-characterized receptor, Atg32, which plays a central role in initiating and regulating this process [9,10].
Atg32 is an outer mitochondrial membrane protein with cytosolic and intermembrane space–exposed domains, which acts as a molecular bridge between mitochondria and the autophagic machinery [10,11].
Given the importance of mitophagy as a conserved eukaryotic mechanism for mitochondrial turnover, it is crucial to understand the regulation of this protein under both non-induced and induced mitophagy conditions. However, reproducible biochemical approaches for in situ immunodetection of Atg32 within mitochondrial fractions are limited in the current literature [9,10,12,13]. Existing mitochondria isolation protocols typically rely on enzymatic cell wall digestion with zymolyase, followed by Dounce homogenization [14], which is labor-intensive, costly, and often leads to proteolytic degradation of Atg32. As shown in Figure 1A, the traditional zymolyase-based method results in a complete loss of detectable Atg32 in mitochondrial fractions under both non-mitophagy and mitophagy-induced conditions, severely limiting its utility for studying its regulation. Such proteolytic susceptibility renders this approach unreliable and introduces variability that compromises experimental reproducibility (Figure 1C). In contrast, using our glass bead–based mechanical lysis method, the Atg32 band is clearly detectable in mitochondrial fractions under both non-induced and mitophagy-induced conditions (Figure 1B). Although Atg32 levels are reduced in total fractions upon mitophagy induction, consistent with mitochondrial degradation [10,13,15–17], the protein remains readily detectable, enabling reliable comparative analyses (Figure 1D). Our method eliminates the need for enzymatic digestion and homogenization, resulting in a faster, more cost-effective, and highly reproducible protocol that preserves mitochondrial integrity and allows detection of Atg32.
Materials and reagents
Biological materials
For Atg32 detection, a triple haemagglutinin epitope was added to the N-terminus of Atg32 (3HA-Atg32) by fusion PCR. This version was expressed from a centromeric plasmid (pRS316) [18] under the regulation of endogenous ATG32 promoter and terminator (pRS316-3HA-ATG32 plasmid) [16]. The resulting plasmid was used to transform a Δatg32 strain.
Table 1. Yeast strains
| Strain | Genotype | Reference |
|---|---|---|
| EY0986 (IDH1-GFP) Δatg32[pRS316-3HA-ATG32] | EY0986 (IDH1-GFP) atg32::KanMX4 [pRS316-3HA-ATG32] | [16,17] |
Reagents
1. Acrylamide (Bio-Rad, catalog number: 1610140)
2. Adenine (Sigma, catalog number: A2786)
3. Ammonium persulfate (APS) (Sigma, catalog number: A3678)
4. Ammonium sulfate (Merck, catalog number: 8090260)
5. Anti-HA peroxidase high affinity (3F10) (Roche, catalog number: 12013819001)
6. Anti-Oxa1 (N-terminus); kind gift from Johannes M. Hermann’s Lab
7. Anti-Pgk1 (Thermo Fisher Scientific, catalog number: 459250; 1:5000)
8. β-mercaptoethanol (Sigma, catalog number: MG250)
9. Bromophenol blue (Amresco, catalog number: 0449)
10. BSA stock; Quick Start Bovine Gamma Globulin (BGG) Standard (Bio-Rad, catalog number: 5000208)
11. Chemiluminescent substrate (Immobilon Western, catalog number: WBKLS0100)
12. Complete Mini, EDTA-free (Roche, catalog number: 11836170001)
13. Glucose (Sigma, catalog number: G8270)
14. Glycerol (J.T. Baker, catalog number: 2136-02)
15. Glycine (Sigma, catalog number: G7126)
16. HCl (J.T. Baker, catalog number: 9535-02)
17. HEPES (Sigma, catalog number: H3375)
18. Histidine (Sigma, catalog number: H-8000)
19. L-Lysine (Sigma, catalog number: L5501)
20. L-Methionine (Sigma, catalog number: M9625)
21. Leucine (Formedium, catalog number: DOC0156)
22. Low-fat milk (Nestlé-Svelty, commercial mark)
23. N,N,N′,N′-Tetrametiletilendiamina (TEMED) (Sigma, catalog number: T9281)
24. N,N′-Methylenebisacrylamide solution (Bis-acrylamide) (Sigma, catalog number: M1533)
25. Phenylmethylsulfonyl fluoride (PMSF) (Sigma, catalog number: P-7626)
26. Protein marker ladder (NIPPON Genetics, catalog number: MWP06)
27. Quick Start Bradford 1× dye reagent (Bio-Rad, catalog number: 5000205)
28. Sodium chloride (NaCl) (J.T. Baker, catalog number: 3624-01)
29. Sodium dodecyl sulfate (SDS) (Sigma, catalog number: L3771)
30. Sorbitol (Sigma, catalog number: S1876)
31. Tris-HCl (Roche, catalog number: 1185-53-1)
32. Trizma base (Sigma, catalog number: T1503)
33. Tryptophan (Formedium, catalog number: DOC0188)
34. Tween 20 (Sigma, catalog number: P6585)
35. Yeast nitrogen base w/o amino acids and ammonium sulfate (Difco, catalog number: 233520)
Solutions
1. Synthetic minimal glucose (SMG) (see Recipes)
2. Synthetic minimal glycerol (SMGly) (see Recipes)
3. Buffer SHP (see Recipes)
4. TBS 10× (see Recipes)
5. TBS-Tween 10× (see Recipes)
6. LAE 2× (see Recipes)
7. SDS-PAGE: running gel 14% (see Recipes)
8. SDS-PAGE: stacking gel 4.85% (see Recipes)
9. Running buffer 10× (see Recipes)
Recipes
Note: All percentages are w/v unless otherwise indicated.
1. Synthetic minimal glucose (SMG)
| Reagent | Final concentration | Quantity or volume |
|---|---|---|
| Yeast nitrogen base | 1.7 g/L | 1.7 g |
| Ammonium sulfate | 5 g/L | 5 g |
| Glucose 40% (v/v) | 2% (v/v) | 50 mL |
| Leucine 1% | 0.01% | 10 mL |
| Adenine 0.2% | 0.002% | 10 mL |
| Histidine 1% | 0.002% | 2 mL |
| Tryptophan 1% | 0.002% | 2 mL |
| Methionine 1% | 0.002% | 2 mL |
| Lysine 1% | 0.003% | 3 mL |
| Water | n/a | Up to 1,000 mL |
Sterilize by autoclaving. The amino acid composition may vary depending on the yeast strain used. Store at room temperature (RT).
2. Synthetic minimal glycerol (SMGly)
| Reagent | Final concentration | Quantity or volume |
|---|---|---|
| Yeast nitrogen base | 1.7 g/L | 1.7 g |
| Ammonium sulfate | 5 g/L | 5 g |
| Glycerol 30% (v/v) | 3% (v/v) | 100 mL |
| Leucine 1% | 0.01% | 10 mL |
| Adenine 0.2% | 0.002% | 10 mL |
| Histidine 1% | 0.002% | 2 mL |
| Tryptophan 1% | 0.002% | 2 mL |
| Methionine 1% | 0.002% | 2 mL |
| Lysine 1% | 0.003% | 3 mL |
| Water | n/a | Up to 1,000 mL |
Sterilize by autoclaving. The amino acid composition may vary depending on the yeast strain used. Store at RT.
3. Buffer SHP
| Reagent | Final concentration | Quantity or volume |
|---|---|---|
| Sorbitol 1.2 M | 0.6 M | 5 mL |
| HEPES 100 mM | 20 mM | 2 mL |
| PMSF 200 mM | 1 mM | 50 μL |
| Complete Mini, EDTA-free | 1 tablet | 1 tablet |
| Total | n/a | 10 mL |
Prepare PMSF fresh with absolute ethanol. Complete Mini, EDTA-free is stored at 4 °C. Buffer SHP should be prepared freshly before use.
4. TBS 10×
| Reagent | Final concentration | Quantity or volume |
|---|---|---|
| Trizma base | 500 mM | 121.14 g |
| NaCl | 1.5 M | 175.32 g |
| Adjust pH to 7.6 with HCl | … | … |
| Total | n/a | 2,000 mL |
Measure pH using a calibrated pH meter. Store at RT.
5. TBS-Tween 10×
| Reagent | Final concentration | Quantity or volume |
|---|---|---|
| Trizma base | 500 mM | 121.14 g |
| NaCl | 1.5 M | 175.32 g |
| Tween | 0.1% (v/v) | 2 mL |
| Adjust pH to 7.6 with HCl | … | … |
| Total | n/a | 2,000 mL |
Measure pH using a calibrated pH meter. Store at RT.
6. LAE 2×
| Reagent | Final concentration | Quantity or volume |
|---|---|---|
| SDS | 4% | 0.4 g |
| Glycerol | 20% (v/v) | 2 mL |
| β-mercaptoethanol | 10% (v/v) | 1 mL |
| Bromophenol blue | 0.04% | 4 mg |
| Tris-HCl pH 6.8 1 M | 0.120 M | 1.2 mL |
| Total | n/a | 10 mL |
β-mercaptoethanol is stored at 4 °C. Measure pH using a calibrated pH meter. Store LAE 2× at -20 °C.
7. SDS-PAGE: running gel 14% (1 mm thickness)
| Reagent | Final concentration | Quantity or volume |
|---|---|---|
| Acrylamide 30%, Bis-acrylamide 0.2% | 14% (w/v) | 2.55 mL |
| Tris 8.75 M, pH 8.8 | 375 mM | 1.17 mL |
| Distilled water (H2O) | n/a | 1.69 mL |
| SDS 10% | 0.1% (w/v) | 55 μL |
| APS 10% | 0.05% (w/v) | 33 μL |
| TEMED | 0.05% (v/v) | 3.30 μL |
| Total | n/a | 5.5 mL |
Acrylamide 30%, Bis-acrylamide 0.2% is stored at 4 °C. Measure pH of Tris using a calibrated pH meter.
8. SDS-PAGE: stacking gel 4.85% (1 mm thickness)
| Reagent | Final concentration | Quantity or volume |
|---|---|---|
| Acrylamide 30%, Bis-acrylamide 0.2% | 4.85% (w/v) | 0.32 mL |
| Tris 0.6 M, pH 6.8 | 60 mM | 0.2 mL |
| Distilled water (H2O) | n/a | 1.45 mL |
| SDS 10% | 0.1% (w/v) | 20 μL |
| APS 10% | 0.05% (w/v) | 10 μL |
| TEMED | 0.1% (v/v) | 2 μL |
| Total | n/a | 2.0 mL |
Acrylamide 30%, Bis-acrylamide 0.2% is stored at 4 °C. Measure pH of Tris using a calibrated pH meter.
9. Running buffer 10×
| Reagent | Final concentration | Quantity or volume |
|---|---|---|
| Trizma base | 0.25 M | 60.8 g |
| Glycine | 1.92 M | 288 g |
| SDS | 1% (w/v) | 20 g |
| Total | n/a | 2,000 mL |
Store at RT.
Laboratory supplies
1. Glass beads (Sigma, catalog number: G9268)
2. Microtubes 2 mL (Axygen, catalog number: MCT-200-C)
3. Microtubes 1.5 mL (CRM Globe, catalog number: PD1010)
4. Cuvettes (Sarstedt, catalog number: 67.742)
5. Nitrocellulose membrane 0.2 μm (Amersham Protran, Cytiva, catalog number: 10600015)
6. 10 μL pipette tips (Sarstedt, catalog number: 70.3030.020)
7. 200 μL pipette tips (Sarstedt, catalog number: 70.3030.020)
8. 1,000 μL pipette tips (Sarstedt, catalog number: 70.3050.020)
9. Culture flasks 250 mL (Duran, catalog number: 090961)
10. Conical tubes 50 mL (Sarstedt, catalog number: 62.547.254)
Equipment
1. Refrigerated centrifuge (Haier, model: LX-165T2R)
2. Refrigerated centrifuge (Beckman Coulter, model: Alegra AL2086003)
3. Rotary incubator shaker (New Brunswick SC, model: INNOVA44)
4. Vortex (Scientific industries, Inc., model: G560)
5. Spectrophotometer (Eppendorf BioPhotometer Plus, model: 6132)
6. Electrophoresis chamber (Bio-Rad, model: Mini PROTEAN Tetra Cell, catalog number: 552BR019843)
7. Semi-dry chamber (Bio-Rad, model: Trans-Blot SD Cell, catalog number: 221BR56787)
8. pH meter (Nanbei, model: PH200)
Procedure
A. Mitophagy assays in Saccharomyces cerevisiae
Note: Atg32 levels decrease in total fractions under mitophagy-inducing conditions as a consequence of mitochondrial turnover. Accordingly, this protocol allows reliable detection of Atg32 even when its abundance is reduced, enabling analysis of mitophagy-dependent changes.
1. Inoculate S. cerevisiae strains (Table 1) from a single isolated colony into 20 mL of SMG medium in a 100-mL Erlenmeyer flask and incubate at 30 °C with shaking at 230 rpm overnight (OD600 ~ 4.0).
2. Dilute the saturated cultures to an optical density at 600 nm (OD600) of 0.3 in 150 mL of respiratory medium SMGly, using two 500-mL Erlenmeyer flasks, ensuring that two flasks are inoculated under identical conditions to allow parallel analysis of basal (non-mitophagy) and mitophagy-induced conditions under identical growth parameters.
Note: Mitophagy is induced upon prolonged respiratory growth to the stationary phase in glycerol-containing medium. Under these conditions, mitophagy initiation is typically observed after approximately 48 h.
3. Incubate cultures at 30 °C and 230 rpm to allow adaptation to respiratory growth. For a standard mitophagy kinetic assay, 24 and 48 h are recommended to compare protein levels without and with mitophagy, respectively.
B. Preparation of a crude mitochondrial fraction
1. After growing the cells in mitophagy induction conditions, collect the cells by centrifugation at 3,000× g for 5 min at 4 °C. The sample can be distributed into multiple 50 mL conical tubes before centrifugation.
2. Wash the pellet once with distilled water and resuspend it in 1 mL of ice-cold SHP buffer.
3. Transfer 1 mL of the cell suspension to a 2 mL microtube containing around 500 μL of glass beads.
Critical: The tubes should be prepared in advance and kept on ice before use.
4. Disrupt cells by vortexing at maximum speed (3,200 rpm) for 30 s, followed by 30 s on ice. Repeat this cycle three times to ensure efficient lysis.
Critical: Always maintain the sample on ice.
Note: As shown in Supplementary Figure S1, three vortexing cycles of 30 s (total time of 90 s) are sufficient to obtain mitochondria of adequate yield and quality.
Caution: We have observed that three vortexing cycles up to 60 each (total time of 180 s) showed mitochondrial portions in cytosolic fractions that may indicate mitochondrial disruption.
5. Centrifuge the lysate at 3,000× g for 5 min at 4 °C to remove unbroken cells and cell debris.
Note: After centrifugation, transfer 100 μL of the clarified extract to a prechilled 1.5 mL microcentrifuge tube and reserve it as the total (T) fraction for subsequent analysis.
6. Transfer the supernatant to a new ice-cold 1.5 mL microtube. At this stage, 100 μL of the sample may be collected and designated as the total fraction.
7. Centrifuge the supernatant at 12,000× g for 10 min at 4 °C. The resulting pellet contains crude mitochondria (M), while the supernatant corresponds to the cytosolic fraction (post-mitochondrial supernatant, PMS).
8. Recover the supernatant in a new ice-cold 1.5 mL microtube.
9. Using a pipette tip with the end cut off, resuspend the pellet gently in 500 μL of ice-cold SHP buffer.
10. Centrifuge the mitochondrial and cytosolic fraction at 12,000× g for 10 min at 4 °C.
11. Transfer the cytosolic fraction to a new ice-cold 1.5-mL microtube.
Caution: Avoid taking the formed pellet, as this contains the mitochondrial remnants that were still in the cytosolic fraction.
12. Discard the supernatant from the mitochondrial fraction and resuspend the pellet with a cut pipette tip in 30–50 μL of ice-cold SHP buffer.
13. The samples can be stored at -72 °C for up to 6 months.
14. Determine protein concentration.
C. Protein quantification
1. Using a 2 mg/mL BSA stock, prepare the following BSA standard curve (Table 2):
Table 2. Standard BSA curve volumes
| Final concentration (μg/mL) | BSA stock (μL) | SHP buffer (μL) |
|---|---|---|
| 2,000 | 22 | — |
| 1,500 | 16.5 | 5.5 |
| 1,000 | 11 | 11 |
| 750 | 8.25 | 13.75 |
| 500 | 5.5 | 16.5 |
| 250 | 2.75 | 19.25 |
| 125 | 2 | 30 |
| 0 | — | 30 |
2. Dilute 3 μL of each sample in 27 μL of SHP buffer (1:10 dilution).
3. Pipette 980 μL of Quick Start Bradford 1× dye reagent into the cuvettes to be used (eight for the curve and one for each sample).
4. Add 20 μL of each standard curve point or sample into the corresponding cuvette containing the Bradford reagent and mix thoroughly.
5. Incubate the cuvettes for 10 min at room temperature.
6. Measure the absorbance at 595 nm using a spectrophotometer. Based on the readings for the standard curve, estimate the protein content of the experimental samples.
D. 3HA-Atg32 immunodetection by western blot
1. Take 30 μg of sample protein.
2. Resuspend each sample in 2× LAE to a final volume of 20 μL.
3. Heat all samples at 65 °C for 5 min on a dry heating block.
4. Load the samples on a 14% SDS-polyacrylamide gel.
5. Run electrophoresis at 120 V and 35 mA per gel using an electrophoresis chamber until the dye front reaches the bottom of the gel.
6. Transfer proteins onto a 0.2 μm nitrocellulose membrane using a semi-dry transfer system at 25 V and 400 mA for 1 h.
7. Block membranes with 5% (w/v) low-fat milk/TBS for 1 h at room temperature.
8. Incubate membranes with peroxidase-conjugated anti-HA antibody (1:5,000) for 2 h at room temperature.
9. After incubation, wash the membrane once with TBS-Tween for 10 min, followed by two additional washes with TBS 1×.
10. Detect immunoreactive bands using a suitable chemiluminescent substrate. The signals can be visualized using an image acquisition system or by exposing the membrane to photographic film.
11. Repeat the same process using a mitochondrial protein antibody as loading control.
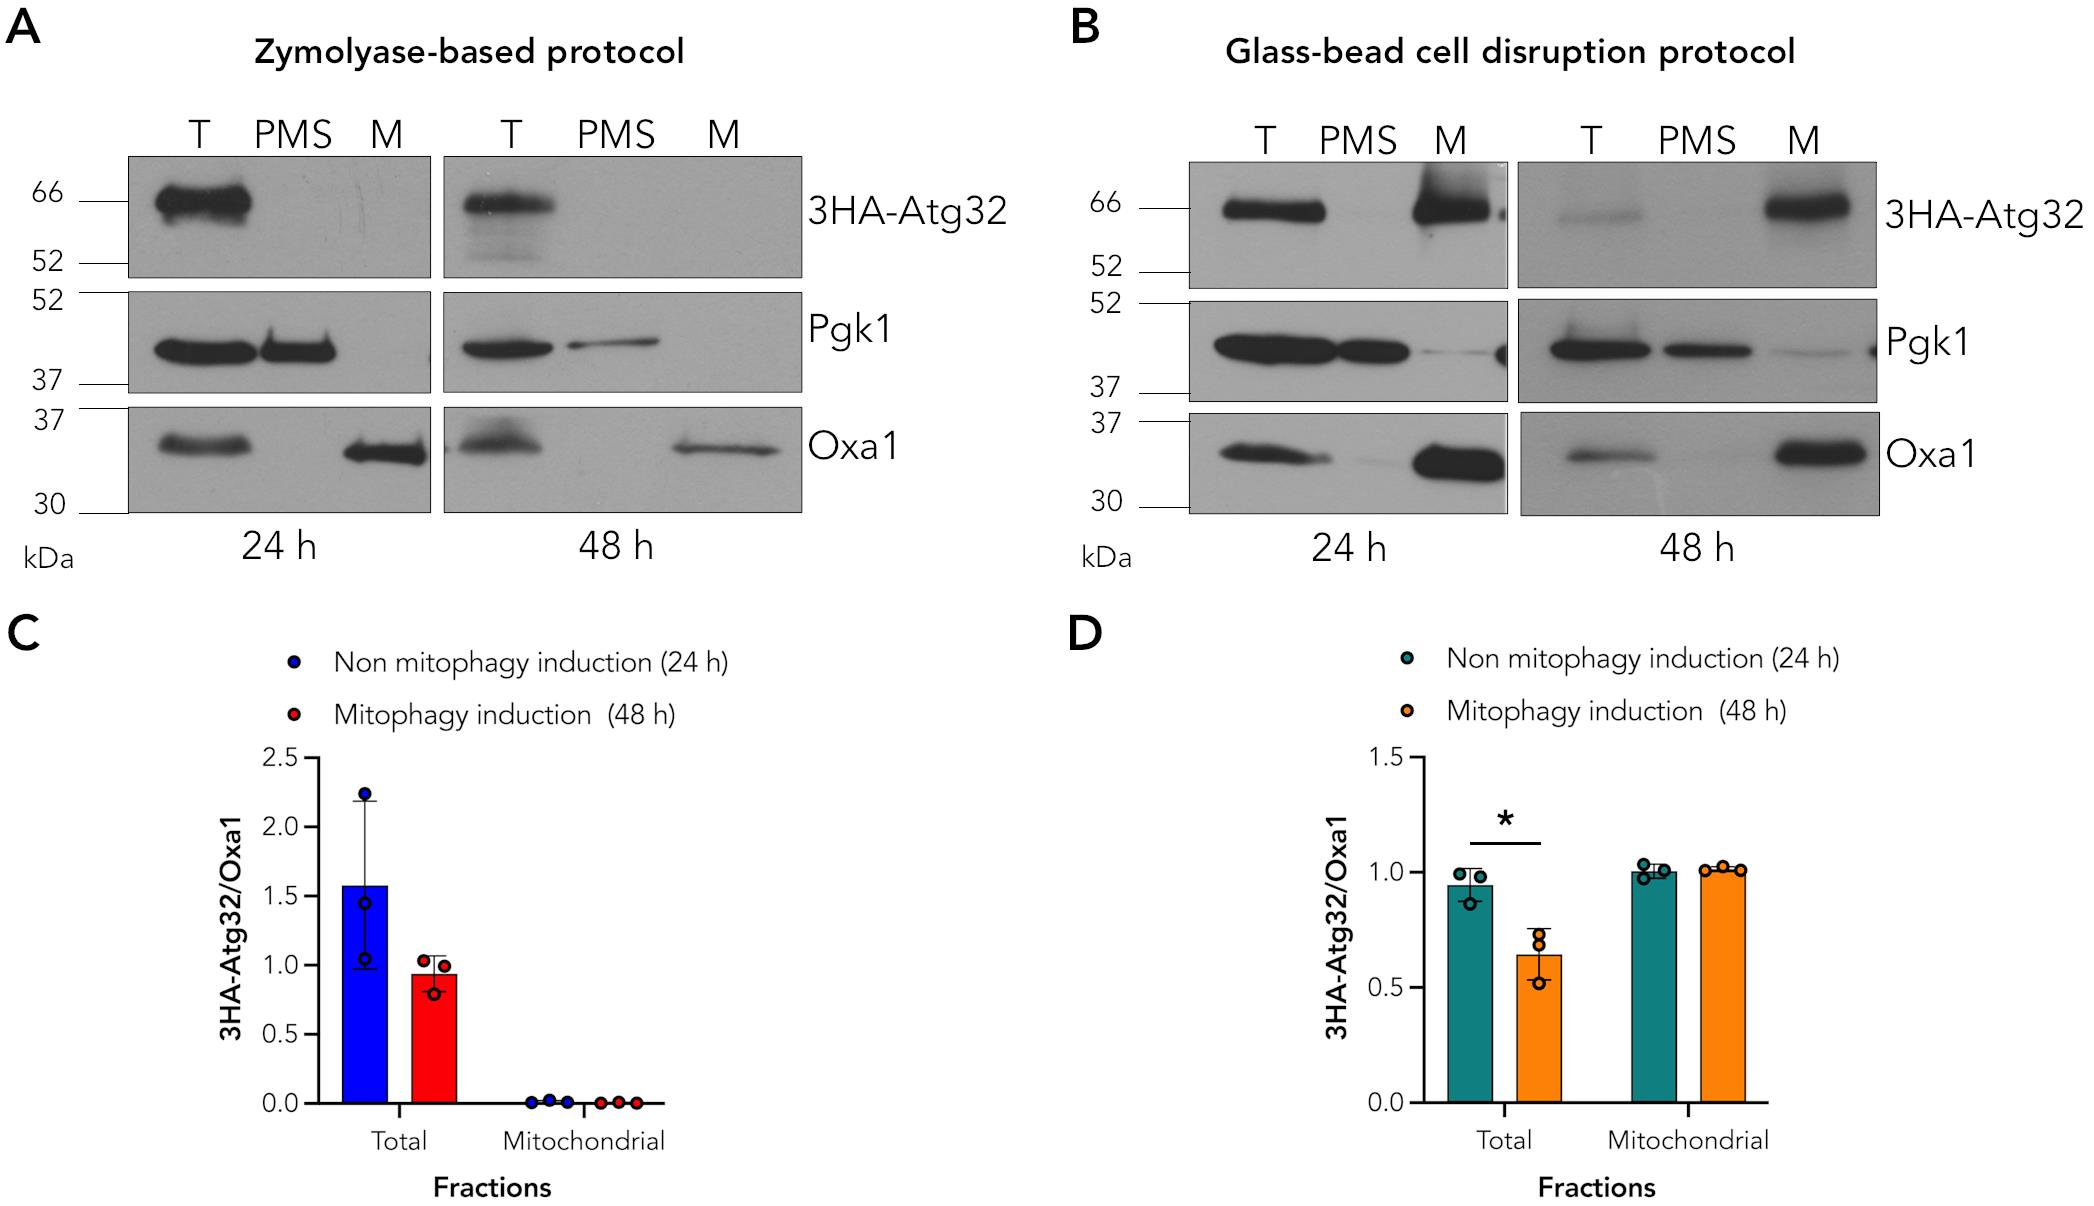
Figure 1. Atg32 detection on mitochondrial fractions. (A) Atg32 is not detected on mitochondrial fractions using the zymolyase-based protocol. Endogenous Pgk1 and Oxa1 were used as the cytosolic and mitochondrial markers in the total (T), post-mitochondrial supernatant (PMS), and mitochondrial (M) fractions. (B) Atg32 was detected in mitochondrial fractions using the glass-bead cell disruption method. 3HA-Atg32 was observed in both total (T) and mitochondrial (M) fractions, similar to the mitochondrial marker Oxa1, under both non-inducing (24 h) and mitophagy-inducing (48 h) conditions. (C, D) Densitometric quantifications. Band intensities were quantified using ImageJ, and Atg32 signals were normalized to the mitochondrial inner membrane protein Oxa1. Data represented as mean ± SD of three independent biological replicates. Statistical analysis was performed using an unpaired two-tailed t-test. *p < 0.05.
Validation of protocol
1. To evaluate the purity of the isolated fractions, endogenous Pgk1 and Oxa1 were used as cytosolic and mitochondrial markers, respectively. These markers allowed us to verify the distribution of proteins within the post-mitochondrial supernatant (PMS) and mitochondrial (M) fractions.
2. Protein band intensities were quantified using ImageJ (NIH) following background subtraction and exclusion of saturated signals. Atg32 levels were normalized to Oxa1 to correct for mitochondrial loading. Data and statistical analyses were performed using GraphPad Prism 10 using an unpaired two-tailed t-test to assess the reproducibility of the extraction method. Experiments were independently repeated three times, and values were reported as mean ± SD. A p-value < 0.05 was considered statistically significant.
General notes and troubleshooting
General notes
1. If the mitochondrial or cytosolic fractions appear contaminated, perform an additional centrifugation step at 12,000× g for 10 min at 4 °C to improve fraction purity. This extra clarification step typically resolves minor carryover between fractions.
2. If monitoring or confirming mitophagy progression is required, experiments may be performed in an Idh1–GFP reporter background. In this system, mitophagy can be evaluated by monitoring the degradation of the mitochondrial reporter protein by western blot analysis. The accumulation of free GFP resulting from vacuolar proteolysis of Idh1–GFP supports the onset of mitophagy under the tested conditions.
Troubleshooting
Problem 1: Low or undetectable Atg32 signal in the mitochondrial fraction.
Possible causes: Proteolytic degradation of Atg32 during cell lysis or sample handling; insufficient temperature control.
Solutions: Ensure that the SHP buffer is thoroughly prechilled and freshly supplemented with PMSF and Complete Mini, EDTA-free protease inhibitors. Maintain all samples on ice throughout the procedure and minimize the time between cell disruption and centrifugation steps. Avoid excessive vortexing, as prolonged mechanical stress can compromise mitochondrial membranes and increase protease accessibility to Atg32. To prevent proteolytic degradation, store only the mitochondrial extract and not the whole cell or crude extract.
Problem 2: Reduced mitochondrial integrity or inconsistent recovery of mitochondrial fractions.
Possible cause: Incorrect osmolarity of the SHP buffer can compromise mitochondrial stability during cell lysis and fractionation.
Solutions: Ensure that the SHP buffer is prepared with the correct sorbitol concentration to maintain appropriate osmotic conditions. Deviations from the recommended osmolarity may result in mitochondrial swelling or rupture, leading to loss of mitochondrial integrity and leakage of mitochondrial proteins into the post-mitochondrial supernatant. Prepare SHP buffer using accurately weighed reagents, verify complete dissolution of sorbitol, and avoid dilution errors. The buffer should be prepared fresh or stored appropriately at 4 °C and equilibrated on ice prior to use.
Supplementary information
The following supporting information can be downloaded here:
1. Figure S1. Optimization of cell disruption.
Acknowledgments
Conceptualization, A. E. M-M., J. E. B-A., U. P-D., and S.F.; Research, A. E. M-M.; Writing—Original Draft, A.E. M-M.; Writing—Review & Editing, J. E. B-A., U. P-D., and S. F.; Design and creation of the graphical abstract, U. P-D; Funding acquisition, S. F.; Supervision, S. F. This work was supported by Secretaría de Ciencia, Humanidades, Tecnología e Innovación (CF-2019-MG-58550 and CF-2023-I-1545) and the Dirección General de Asuntos del Personal Académico (DGAPA-UNAM IN208921 and IN218424). J. E. B-A. (CVU: 1033319) and U. P-D. (CVU: 883299) are graduate students funded through a SECIHTI doctoral fellowships. We are grateful to Hilario Ramirez-Ruelas for his critical review and valuable comments on this manuscript.
This work was partially based on the original glass bead–based protocol depicted in Diekert K, de Kroon AI, Kispal G, Lill R. Isolation and subfractionation of mitochondria from the yeast Saccharomyces cerevisiae. Methods Cell Biol. 2001;65:37-51. doi: 10.1016/s0091-679x(01)65003-9. PMID: 11381604.
All figures, schemes, and images in this work were created in Adobe Illustrator.
Competing interests
The authors declare no conflicts of interest.
References
- Lemasters, J. J. (2005). Selective Mitochondrial Autophagy, or Mitophagy, as a Targeted Defense Against Oxidative Stress, Mitochondrial Dysfunction, and Aging. Rejuvenation Res. 8(1): 3–5. https://doi.org/10.1089/rej.2005.8.3
- Geisler, S., Holmström, K. M., Skujat, D., Fiesel, F. C., Rothfuss, O. C., Kahle, P. J. and Springer, W. (2010). PINK1/Parkin-mediated mitophagy is dependent on VDAC1 and p62/SQSTM1. Nat Cell Biol. 12(2): 119–131. https://doi.org/10.1038/ncb2012
- Narendra, D. P., Jin, S. M., Tanaka, A., Suen, D. F., Gautier, C. A., Shen, J., Cookson, M. R. and Youle, R. J. (2010). PINK1 Is Selectively Stabilized on Impaired Mitochondria to Activate Parkin. PLoS Biol. 8(1): e1000298. https://doi.org/10.1371/journal.pbio.1000298
- Novak, I., Kirkin, V., McEwan, D. G., Zhang, J., Wild, P., Rozenknop, A., Rogov, V., Löhr, F., Popovic, D., Occhipinti, A., et al. (2009). Nix is a selective autophagy receptor for mitochondrial clearance. EMBO Rep. 11(1): 45–51. https://doi.org/10.1038/embor.2009.256
- Murakawa, T., Yamaguchi, O., Hashimoto, A., Hikoso, S., Takeda, T., Oka, T., Yasui, H., Ueda, H., Akazawa, Y., Nakayama, H., et al. (2015). Bcl-2-like protein 13 is a mammalian Atg32 homologue that mediates mitophagy and mitochondrial fragmentation. Nat Commun. 6(1): e1038/ncomms8527. https://doi.org/10.1038/ncomms8527
- Hanna, R. A., Quinsay, M. N., Orogo, A. M., Giang, K., Rikka, S. and Gustafsson, Ã. B. (2012). Microtubule-associated Protein 1 Light Chain 3 (LC3) Interacts with Bnip3 Protein to Selectively Remove Endoplasmic Reticulum and Mitochondria via Autophagy. J Biol Chem. 287(23): 19094–19104. https://doi.org/10.1074/jbc.m111.322933
- Liu, L., Feng, D., Chen, G., Chen, M., Zheng, Q., Song, P., Ma, Q., Zhu, C., Wang, R., Qi, W., et al. (2012). Mitochondrial outer-membrane protein FUNDC1 mediates hypoxia-induced mitophagy in mammalian cells. Nat Cell Biol. 14(2): 177–185. https://doi.org/10.1038/ncb2422
- Strappazzon, F., Nazio, F., Corrado, M., Cianfanelli, V., Romagnoli, A., Fimia, G. M., Campello, S., Nardacci, R., Piacentini, M., Campanella, M., et al. (2014). AMBRA1 is able to induce mitophagy via LC3 binding, regardless of PARKIN and p62/SQSTM1. Cell Death Differ. 22(3): 419–432. https://doi.org/10.1038/cdd.2014.139
- Kanki, T., Wang, K., Cao, Y., Baba, M. and Klionsky, D. J. (2009). Atg32 Is a Mitochondrial Protein that Confers Selectivity during Mitophagy. Dev Cell. 17(1): 98–109. https://doi.org/10.1016/j.devcel.2009.06.014
- Okamoto, K., Kondo-Okamoto, N. and Ohsumi, Y. (2009). Mitochondria-Anchored Receptor Atg32 Mediates Degradation of Mitochondria via Selective Autophagy. Dev Cell. 17(1): 87–97. https://doi.org/10.1016/j.devcel.2009.06.013
- Kanki, T., Wang, K., Baba, M., Bartholomew, C. R., Lynch-Day, M. A., Du, Z., Geng, J., Mao, K., Yang, Z., Yen, W. L., et al. (2009). A Genomic Screen for Yeast Mutants Defective in Selective Mitochondria Autophagy. Mol Biol Cell. 20(22): 4730–4738. https://doi.org/10.1091/mbc.e09-03-0225
- Kondo-Okamoto, N., Noda, N. N., Suzuki, S. W., Nakatogawa, H., Takahashi, I., Matsunami, M., Hashimoto, A., Inagaki, F., Ohsumi, Y., Okamoto, K., et al. (2012). Autophagy-related Protein 32 Acts as Autophagic Degron and Directly Initiates Mitophagy. J Biol Chem. 287(13): 10631–10638. https://doi.org/10.1074/jbc.m111.299917
- Levchenko, M., Lorenzi, I. and Dudek, J. (2016). The Degradation Pathway of the Mitophagy Receptor Atg32 Is Re-Routed by a Posttranslational Modification. PLoS One. 11(12): e0168518. https://doi.org/10.1371/journal.pone.0168518
- Herrmann, J. M., Fölsch, H., Neupert, W. and Stuart, R. A. (1994): Isolation of yeast mitochondria and study of mitochondrial protein translation. In: Celis, Julio E. (ed.): Cell biology: a laboratory handbook. Vol. 1. London u. a.: Academic Press. pp. 538–544. https://doi.org/10.5282/ubm/epub.7675
- Camougrand, N., Vigié, P., Gonzalez, C., Manon, S. and Bhatia-Kiššová, I. (2020). The yeast mitophagy receptor Atg32 is ubiquitinated and degraded by the proteasome. PLoS One. 15(12): e0241576. https://doi.org/10.1371/journal.pone.0241576
- García-Chávez, D., Domínguez-Martín, E., Kawasaki, L., Ongay-Larios, L., Ruelas-Ramírez, H., Mendoza-Martinez, A. E., Pardo, J. P., Funes, S. and Coria, R. (2024). Prohibitins, Phb1 and Phb2, function as Atg8 receptors to support yeast mitophagy and also play a negative regulatory role in Atg32 processing. Autophagy. 20(11): 2478–2489. https://doi.org/10.1080/15548627.2024.2371717
- Ruelas-Ramírez, H., Mendoza-Martínez, A. E., Medina-Flores, P. A. and Funes, S. (2026). Retrograde signaling is required for Slm35-mediated negative regulation of mitophagy in yeast. Biol Open. 15(1): e062106. https://doi.org/10.1242/bio.062106
- Sikorski, R. S. and Hieter, P. (1989). A system of shuttle vectors and yeast host strains designed for efficient manipulation of DNA in Saccharomyces cerevisiae. Genetics. 122(1): 19–27. https://doi.org/10.1093/genetics/122.1.19
Article Information
Publication history
Received: Dec 5, 2025
Accepted: Jan 18, 2026
Available online: Jan 28, 2026
Published: Feb 20, 2026
Copyright
© 2026 The Author(s); This is an open access article under the CC BY-NC license (https://creativecommons.org/licenses/by-nc/4.0/).
How to cite
Mendoza-Martínez, A. E., Bravo-Arévalo, J. E., Pedroza-Dávila, U. and Funes, S. (2026). Optimized Mechanical Isolation of Mitochondria From Saccharomyces cerevisiae Preserving Atg32 for Quantitative Analysis. Bio-protocol 16(4): e5610. DOI: 10.21769/BioProtoc.5610.
Category
Cell Biology > Organelle isolation > Mitochondria
Cell Biology > Cell signaling > Autophagy
Do you have any questions about this protocol?
Post your question to gather feedback from the community. We will also invite the authors of this article to respond.