- Protocols

- Articles and Issues
- For Authors
- About
- Become a Reviewer

In Vitro Model of Cytokine-Induced Inflammatory 3T3-L1 Adipocytes Mimicking Obesity
Published: Vol 16, Iss 4, Feb 20, 2026 DOI: 10.21769/BioProtoc.5609 Views: 318
Reviewed by: Komuraiah MyakalaShun Yu Jasemine YangAnonymous reviewer(s)
Advertisement


Protocol Collections
Comprehensive collections of detailed, peer-reviewed protocols focusing on specific topics


Abstract
Obesity is a risk factor for many diseases. The 3T3-L1 cell line is often used to obtain mature adipocytes, but these lack the inflammatory phenotype observed in obesity. Using a cocktail of cytokines that mimics the secretome of macrophages found in the inflammatory adipose tissue, we developed a protocol for obtaining mature inflammatory adipocytes. This model was validated at gene (RT-qPCR) and protein levels (multiplex adipokine array) as we found a decrease of adipogenic markers (C/EBPα, PPARУ, adiponectin, and CD36) and an increase of pro-inflammatory cytokines (IL-6, IL-1β, CXCL1, CXCL10, TNF-α, ICAM-1, and lipocalin-2). We provide a relevant in vitro model for studying the impact of low-grade chronic inflammation caused by obesity and its downstream effects on metabolic disorders and tumor microenvironments.
Key features
• Currently available protocols of adipocyte differentiation are not relevant for studying obesity in vitro.
• We developed a simple and reproducible method to generate inflammatory adipocytes in vitro using a cytokine cocktail.
• Gene expression analysis (qPCR) confirms the downregulation of adipogenic and protective markers (e.g., adiponectin, CD36) and the upregulation of pro-inflammatory cytokines (e.g., IL-6, IL-1β, TNF-α).
• Adipokine array reveals decreased secretion of anti-inflammatory molecules (adiponectin, IGFBPs, FGF-21, HGF) and increased release of pro-inflammatory adipokines (serpin E1, IGF-1, lipocalin-2, IL-6, ICAM-1).
• This protocol provides a relevant and versatile method for investigating obesity-related inflammation and its role in disease progression.
Keywords: AdipocyteGraphical overview
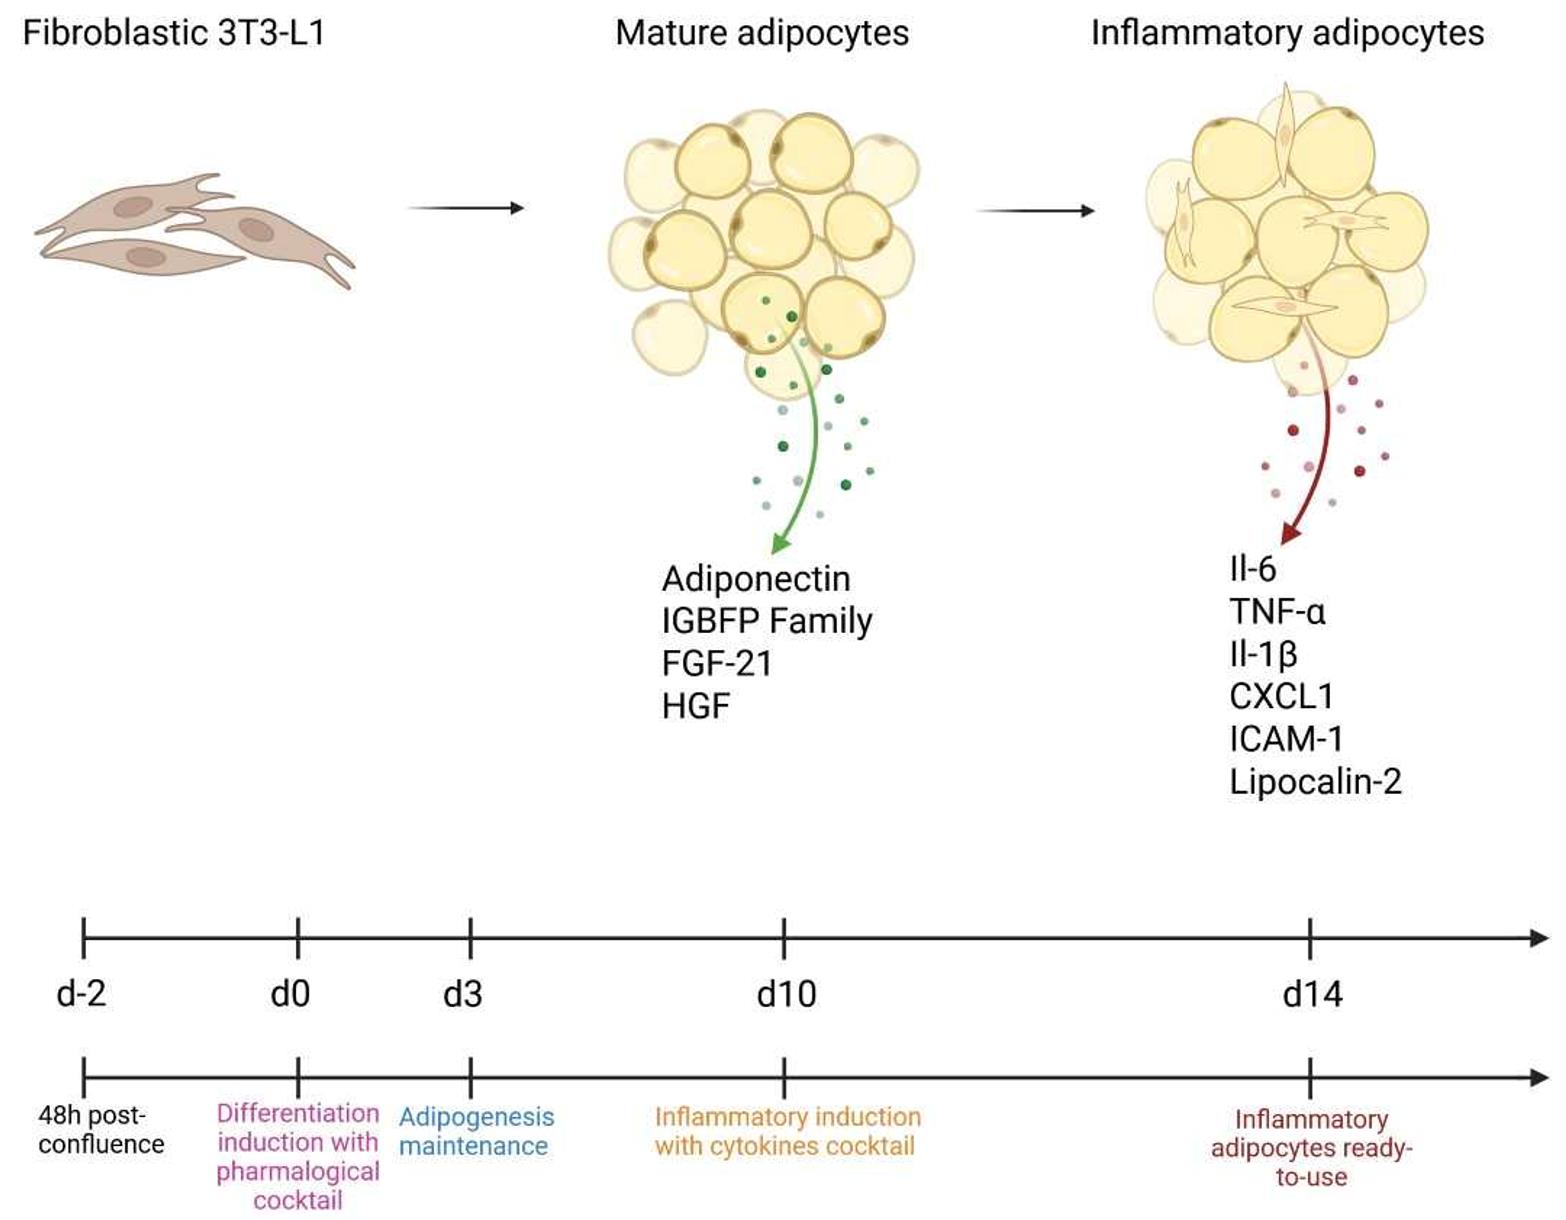
From differentiation to inflammation: Establishment of the inflammatory adipocyte model
Background
Adipose tissue plays key metabolic roles by secreting proteins known as adipokines. Under physiological conditions, adipose tissue secretes protective molecules such as adiponectin [1], the insulin-like growth factor–binding protein family (IGFBPs) [2], and fibroblast growth factor 1(FGF-1) [3], which contribute to insulin sensitivity and adipose tissue homeostasis. In contrast, obese adipose tissue shows decreased secretion of these protective factors and increased release of pro-inflammatory adipokines such as lipocalin-2 [4] and intercellular adhesion molecule-1 (ICAM-1) [5]. This change in phenotype is associated with a dedifferentiation of mature adipocytes by decreasing major adipogenic transcription factors like CCAAT/enhancer-binding protein alpha (C/EBPα) and peroxisome proliferator-activated receptor gamma (PPARУ).
One reason for adipose tissue remodeling during obesity is the development and exacerbation of chronic inflammation. During weight gain, excessive lipid accumulation in adipocytes leads to cell hypertrophy, hypoxia, and eventually necrosis. In addition to adipokines, this environment promotes the secretion of pro-inflammatory molecules such as tumor necrosis factor alpha (TNF-α), interleukin-6 (IL-6), interleukin-8 (IL-8), and interleukin-1 beta (IL-1β), which recruit immune cells, particularly circulating pro-inflammatory monocytes. Accumulating macrophages organize in crown-like structures (CLS) and amplify the inflammatory signaling [6].
This inflamed adipose tissue induces a chronic state of low-grade inflammation, which is crucial to investigate further, as it contributes not only to metabolic dysfunction but also to the development and progression of numerous diseases [7]. Indeed, individuals with obesity (BMI > 30) or individuals with BMI > 25 are well recognized to have an increased risk and worsened outcomes for cancer, cardiovascular diseases, diabetes, or hypertension [8].
Due to their ability to differentiate into adipocytes, 3T3-L1 cells—one of the most used fibroblast cell lines—are widely employed to study adipogenesis and adipocyte biology. This model is also frequently used in obesity research. However, inducing 3T3-L1 cell differentiation remains technically challenging due to the well-documented limited reproducibility of this cell line [9]. There is currently no standardized, fast, and cost-effective method to generate inflammatory adipocytes that accurately mimic obesity-associated adipocytes in vitro. Here, we describe a new in vitro approach to produce inflammatory adipocytes that avoids the need for specialized equipment such as a hypoxic chamber or additional conditioned media from other cells [10,11]. This innovative protocol provides a practical, accessible, and valuable tool for investigating the role of adipocytes in various pathologies, while limiting the use of animals.
Materials and reagents
Biological materials
1. 3T3-L1 cell line from mouse (Merck, catalog number: 86052701-1VL)
Reagents
1. Dulbecco’s modified Eagle medium 4.5 g/L glucose with sodium pyruvate and stabilized L-Glutamine (DMEM) (Grosseron, Biosera, catalog number: 0153043)
2. Fetal bovine serum (FBS) (Dutscher, Hyclone, catalog number: SV30160.03)
3. Dulbecco’s phosphate-tamponed saline 10× without calcium/magnesium (PBS) (Grosseron, Biosera, catalog number: 0153264)
4. Trypsin 1× with EDTA (Grosseron, Biosera, catalog number: 0153112)
5. Rosiglitazone >98% (HPLC), powder, PPARУ agonist (Merck, Sigma-Aldrich, catalog number: R2408-10MG)
6. 3-isobutyl-1-methyxanthine (IBMX) 250 mg (Merck, Sigma-Aldrich, catalog number: 410957-250MG)
7. Dexamethasone 100 mg (MP Biomedicals Germany GMBH, catalog number: 0219004080)
8. Insulin solution human 10 mg/mL (Merck, Sigma-Aldrich, catalog number: I9278-5mL)
9. Oil red O 0.5 L × 4 (DIAPATH France, catalog number: C0512/U)
10. 2-Propanol (isopropanol) >99.5% (Merck, Sigma-Alrich, catalog number: 190764-500ML)
11. Aqueous mounting medium (Abcam, catalog number: ab64230)
12. Dimethyl sulfoxide (DMSO) 250 mL (Corning, catalog number: 25-950-CQC)
13. Recombinant mouse IL-1β 10 μg (BioLegend, catalog number: 575102)
14. Recombinant mouse TNF-α 10 μg (BioLegend, catalog number: 575202)
15. Recombinant mouse IL-6 10 μg (BioLegend, catalog number: 575702)
16. Recombinant mouse CXCL1 (KC) 10 μg (BioLegend, catalog number: 573702)
17. Trypan blue solution 0.4% in PBS 100 mL (Fisher Scientific, catalog number: SV30084.01)
18. Maxwell RSC simplyRNA tissue (Promega, catalog number: AS1340 containing homogenization solution and thioglycerol)
19. Maxima First-Strand cDNA Synthesis kit for RT-qPCR (Thermo Fisher Scientific, catalog number: K1642)
20. PowerUp SYBR Green (Thermo Fisher Scientific, catalog number: A25778)
21. Proteome Profiler Mouse Adipokine Array kit (Bio-techne, catalog number: ARY013)
Solutions
1. Pre-adipocyte expansion medium (PM) (see Recipes)
2. Oil red O solution for lipid staining (see Recipes)
3. Adipocyte differentiation medium (DM) (see Recipes)
4. Adipocyte maintenance medium (MM) (see Recipes)
5. Adipocyte pro-inflammatory medium (see Recipes)
6. RT-PCR (see Recipes)
7. qPCR (see Recipes)
Recipes
1. Pre-adipocyte expansion medium (PM)
| Reagent | Final concentration | Quantity or volume |
|---|---|---|
| DMEM | 90% | 45 mL |
| FBS | 10% | 5 mL |
| Total | 100% | 50 mL |
Heat DMEM and FBS in a water bath at 37 °C. Prepare 50 mL of DMEM 10% FBS solution in a 50 mL Falcon tube by mixing 45 mL of DMEM and 5 mL of FBS. PM can be stored at 2–8 °C for up to four weeks. Bring the PM solution to 37 °C before use.
2. Oil red O solution for lipid staining
| Reagent | Final concentration | Quantity or volume |
|---|---|---|
| Oil red O | 60% | 6 mL |
| Distilled water | 40% | 4 mL |
| Total | 100% | 10 mL |
Prepare a staining solution by mixing 6 mL of Oil red O with 4 mL of distilled water. Pass this solution through a filter into a bottle. Then, let the solution settle for 30 min before use. This solution is stable for 24 h at room temperature.
3. Adipocyte differentiation medium (DM)
| Reagent | Final concentration | Quantity or volume |
|---|---|---|
| PM | 100% | 50 mL |
| Rosiglitazone | 2 μM | 5 μL |
| Dexamethasone | 1 μM | 50 μL |
| Insulin | 10 μg/mL | 50 μL |
| IBMX | 0.5 mM | 50 μL |
a. First, prepare a stock solution for each pharmacological inducer in powder. Thaw rosiglitazone and IBMX on ice before use:
Dexamethasone (1 mM): weigh 7.8 mg of dexamethasone and dissolve in 20 mL of DMSO.
Rosiglitazone (20 mM): weigh 3.57 mg of rosiglitazone and dissolve in 500 μL of DMSO.
IBMX (500 mM): weigh 55.56 mg of IBMX and dissolve in 500 μL of DMSO.
Mix well by vortexing. Each stock solution can be stored at -20 °C for one month and thawed on ice before use.
b. Prepare DM solution by mixing PM, dexamethasone, rosiglitazone, IBMX, and insulin in a 50 mL Falcon tube. DM can be stored at 2–8 °C for 2 weeks. Bring the DM solution to 37 °C before use.
4. Adipocyte maintenance medium (MM)
| Reagent | Final concentration | Quantity or volume |
|---|---|---|
| PM | 100% | 50 mL |
| Insulin | 10 μg/mL | 50 μL |
Prepare MM solution by mixing PM and insulin in a 50 mL Falcon tube. MM can be stored at 2–8 °C for 4 weeks. Bring MM solution to 37 °C before use.
5. Adipocyte pro-inflammatory medium (InfM)
Each cytokine (IL-6, IL-1β, CXCL1, TNF-α) is at 200 μg/mL (10 μg in 50 μL) and should be thawed on ice before use. Prepare InfM by mixing 20 mL of PM with each cytokine in a 50 mL Falcon tube. Final cytokine concentrations vary from 10 to 50 ng/mL according to technical requirements (please refer to the validation section). Below is the recipe for three different concentrations: 10, 25, and 50 ng/mL.
a. For cytokine concentration of 10 ng/mL
| Reagent | Final concentration | Quantity or volume |
|---|---|---|
| PM | n/a | 19.9996 μL |
| IL-6 | 10 ng/mL | 1 μL |
| IL-1β | 10 ng/mL | 1 μL |
| CXCL1 | 10 ng/mL | 1 μL |
| TNF-α | 10 ng/mL | 1 μL |
b. Protocol for cytokine concentration of 25 ng/mL
| Reagent | Final concentration | Quantity or volume |
|---|---|---|
| PM | n/a | 19.990 μL |
| IL-6 | 25 ng/mL | 2.5 μL |
| IL-1β | 25 ng/mL | 2.5 μL |
| CXCL1 | 25 ng/mL | 2.5 μL |
| TNF-α | 25 ng/mL | 2.5 μL |
c. Protocol for cytokine concentration of 50 ng/mL
| Reagent | Final concentration | Quantity or volume |
|---|---|---|
| PM | n/a | 19.980 μL |
| IL-6 | 50 ng/mL | 5 μL |
| IL-1β | 50 ng/mL | 5 μL |
| CXCL1 | 50 ng/mL | 5 μL |
| TNF-α | 50 ng/mL | 5 μL |
InfM is stable for 3 days at 2–8 °C. If adipocytes need to be treated for more than 24 h, InfM must be changed every day. Bring InfM to 37 °C before use.
6. RT-PCR
The reverse transcription-polymerase chain reaction for one sample is as follows:
| Reagent | Final concentration | Quantity or volume |
|---|---|---|
| 5× Reaction mix | n/a | 4 μL |
| Maxima enzyme mix | n/a | 2 μL |
| RNA | 1 μg | Defined by RNA concentration |
| Nuclease-free water | n/a | Up to 20 μL |
7. qPCR
| Reagent | Final concentration | Quantity or volume (for one sample) |
|---|---|---|
| Syber Green mix | n/a | 10 μL |
| Forward primer (see Table 1) | 0.5 pmol/μL | 0.1 μL |
| Reverse primer (see Table 1) | 0.5 pmol/μL | 0.1 μL |
| Nuclease-free water | n/a | 5.8 μL |
Table 1. Primer sequence for adipogenic transcription factors and inflammatory cytokines
| Target name | Forward primer (5′-3′) | Melting temperature (°C) | Reverse primer (3′-5′) | Melting temperature (°C) |
|---|---|---|---|---|
| PPARy | GTACTGTCGGTTTCAGAAGTGCC | 61.65 | ATCTCCGCCAACAGCTTCTCCT | 63.73 |
| Adiponectin | TCCCAATGTACCCATTCGCT | 59.08 | AGAGTCCCGGAATGTTGCAG | 60.04 |
| C/EBPα | GCAAAGCCAAGAAGTCGGTG | 60.04 | TCTCCACGTTGCGTTGTTTG | 59.62 |
| CXCL10 | GATGACGGGCCAGTGAGAAT | 59.82 | CTCAACACGTGGGCAGGATA | 59.75 |
| CD36 | TGGGTTAAAACAGGCACCACT | 60.06 | CTGCTGTTCTTTGCCACGTC | 60.04 |
| CXCL1 | AGACCATGGCTGGGATTCAC | 59.74 | CGCGACCATTCTTGAGTGTG | 59.56 |
| Il-1β | TGGACCTTCCAGGATGAGGACA | 62.52 | GTTCATCTCGGAGCCTGTAGTG | 60.48 |
| Il-6 | TACCACTTCACAAGTCGGAGGC | 62.24 | CTGCAAGTGCATCATCGTTGTTC | 61.21 |
| TNF-α | GTAGCCCACGTCGTAGCAAA | 60.39 | TTGAGATCCATGCCGTTGGC | 61.03 |
| GAPDH | CATCACTGCCACCCAGAAGACTG | 63.28 | ATGCCAGTGAGCTTCCCGTTCAG | 65.15 |
Laboratory supplies
1. Cell culture flask, 75 cm2, for adherent cells with vent cap (with breathable 0.22 μm membrane) (Grosseron, Nest, catalog number: 0999076)
2. Cell culture flask, 175 cm2, for adherent cells with vent cap (with breathable 0.22 μm membrane) (Grosseron, Nest, catalog number: 0999077)
3. 12-well cell culture-treated plate with flat bottom (Grosseron, Nest, catalog number: 0999051)
4. Sterile 15 mL conical Falcon tubes (Dutsher, catalog number: 352095)
5. Sterile 50 mL conical Falcon tubes (Dutsher, catalog number: 352070)
6. 5 mL serological pipettes, individually packaged (Grosseron, iSample, catalog number: GR00501)
7. 10 mL serological pipettes, individually packaged (Grosseron, iSample, catalog number: GR01001)
8. 25 mL serological pipettes, individually packaged (Grosseron, iSample, catalog number: GR02501)
9. 10 μL pipette tips with filter (Grosseron, Brand, catalog number: 9.409724)
10. 100 μL pipette tips with filter (Grosseron, Brand, catalog number: 9.409727)
11. 200 μL pipette tips with filter (Grosseron, Brand, catalog number: 9.409728)
12. 1000 μL pipette tips with filter (Grosseron, Brand, catalog number: 9.409729)
13. Qualitative filter papers (23–40 μm) (VWR, catalog number: 516-0287)
14. Corning counting chamber for Corning cell counter (Grosseron, Corning, catalog number: CG480200)
15. Coverslide diameter 18 mm (Grosseron, catalog number: 9.161062)
Equipment
1. Biological safety cabinet Faster (Labotherm, model: cytosafe 2004)
2. MCO170AIC CO2 incubator (Dutsher, PHCBI, catalog number: 099433)
3. CX43 Olympus microscope (objectives: 4×, 10×, 20×, 40×, and 60×) (Grosseron, Olympus, catalog number: S236200)
4. Corning automatic cell counter (Grosseron, Corning, catalog number: CG6749)
5. Laboratory centrifuge with rotors for 15- and 50-mL conical tubes (Rotofix 32A, Dutsher, Hettich, catalog number: 472112)
6. Water bath VWB2 (Avantor, catalog number: 462-0554)
7. Pipetboy (Grosseron, catalog number: P016500)
8. Liquid nitrogen (N2) tank
9. Freezer (-20 °C and -80 °C)
10. Refrigerator (2–8 °C)
11. Pacific 7 TII (UV) for pure water (Thermo Fisher Scientific, catalog number: 50132123)
12. Chemical safety storage cabinet K-UB 90 (Grosseron, Asecos, catalog number: A005306)
13. Veriti Thermal Cycler, 96-well Fast (Thermo Fisher Scientific, Applied Biosystems, catalog number: 4375305)
14. 7500 Real-Time PCR system (Thermo Fisher Scientific, Applied Biosystems, catalog number: 4351105)
15. iBright CL1500 imaging system (Thermo Fisher Scientific, Invitrogen, catalog number: A44114)
Software and datasets
1. 7500 Software (Applied Biosystems, Version 2.3)
2. iBright Analysis Software (Invitrogen, Version 5.2.1)
3. GraphPad Prism (GraphPad, Version 10)
Procedure
A. 3T3-L1 pre-adipocytes culture
1. Prepare a T75 flask with 10 mL of PM medium at 37 °C.
2. Prepare a 15 mL conical tube with 9 mL of PM medium at 37 °C.
3. Thaw a 3T3-L1 cell line vial in a water bath at 37 °C for 1 min and gently pipette the cell suspension into 9 mL of PM medium in the 15 mL tube.
4. Centrifuge at 300× g for 4 min at room temperature to eliminate freezing medium.
5. Remove supernatant and add 1 mL of PM medium. Carefully pipette up and down to resuspend the cell pellet.
6. Count and seed cells to 1,500–2,000 cells/cm2 (120,000 cells in T75).
7. Incubate at 37 °C with 5% CO2.
8. For passaging:
Critical: Do not let cells reach 90% of confluence to avoid activation of adipogenic factors.
a. Put PM, trypsin/EDTA, and PBS 1× at 37 °C.
b. Aspirate spent PM medium in the T75 and gently wash cells with PBS 1×. Eliminate PBS 1×, add 1 mL of trypsin/EDTA, and incubate for 1 min at 37 °C and 5% CO2 to detach pre-adipocytes 3T3-L1.
c. After incubation, gently tap the side of the flask to help cells detach. Then, add 4 mL of PM to inactivate trypsin and gently flush the flask to recover all cells. Transfer 5 mL of PM medium + detached cells to a 15 mL conical tube.
d. Centrifuge at 300× g for 4 min.
e. Remove supernatant, add 1 mL of PM in cell suspension, and gently pipette up and down to resuspend the cell pellet.
f. Dilute the cell suspension at 1:20 for the same flask size or count the cells for appropriate seeding.
g. Incubate at 37 °C with 5% CO2.
Critical: After 7 passages, 3T3-L1 cells lose their ability to differentiate.
Note: Trypsinization time should be optimized based on cell confluence and monitored under a microscope to ensure adequate cell detachment.
B. Induction of adipocyte differentiation
B1. Stimulation of adipogenic transcription factor
1. Seed 120,000 cells in 12-well plates to approximately 95% confluence in 1 mL of PM per well. It is necessary to achieve 100% confluence for 48 h to obtain contact inhibition and activate adipogenic factors.
2. After 48h of confluence, pre-heat DM medium to 37 °C. Eliminate spent PM medium and add 350 μL of DM medium.
3. Incubate at 37 °C with 5% CO2 for 3 days. It is not necessary to change the medium.
B2. Maintenance of adipocyte differentiation
1. After 3 days of differentiation, eliminate DM medium and add 350 μL of MM pre-heated at 37 °C.
2. Incubate at 37 °C with 5% CO2 for 7–10 days.
3. Final differentiation happens between 7 and 10 days. Figure 1 illustrates adipocyte phenotype over time. Cell rounding and the appearance of de novo lipid droplets can be observed.
Note: The culture medium does not contain any free fatty acid. The differentiation efficacy is not always reproducible.
B3. Oil red O staining
1. Prepare Oil red O solution (see Recipe).
2. Fix cells with 60% (v/v) isopropanol for 1 min.
3. Cover cells with Oil red O solution for 10 min at room temperature.
4. Eliminate Oil red O solution and add 60% (v/v) isopropanol for coloration differentiation for 30 s.
5. Wash with distilled water three times and counter-stain cells with hematoxylin for 1 min at room temperature.
6. Wash with tap water three times.
7. Use an aqueous mounting medium and add a coverslip to the cells. Let the mounting medium dry for 24 h at room temperature before microscope observation. Mounted cells can be stored at 4 °C for up to one month. Figure 1 shows Oil red O staining at several stages of adipocyte differentiation.
Note: It is possible to fix cells with 4% paraformaldehyde or 10% formalin.
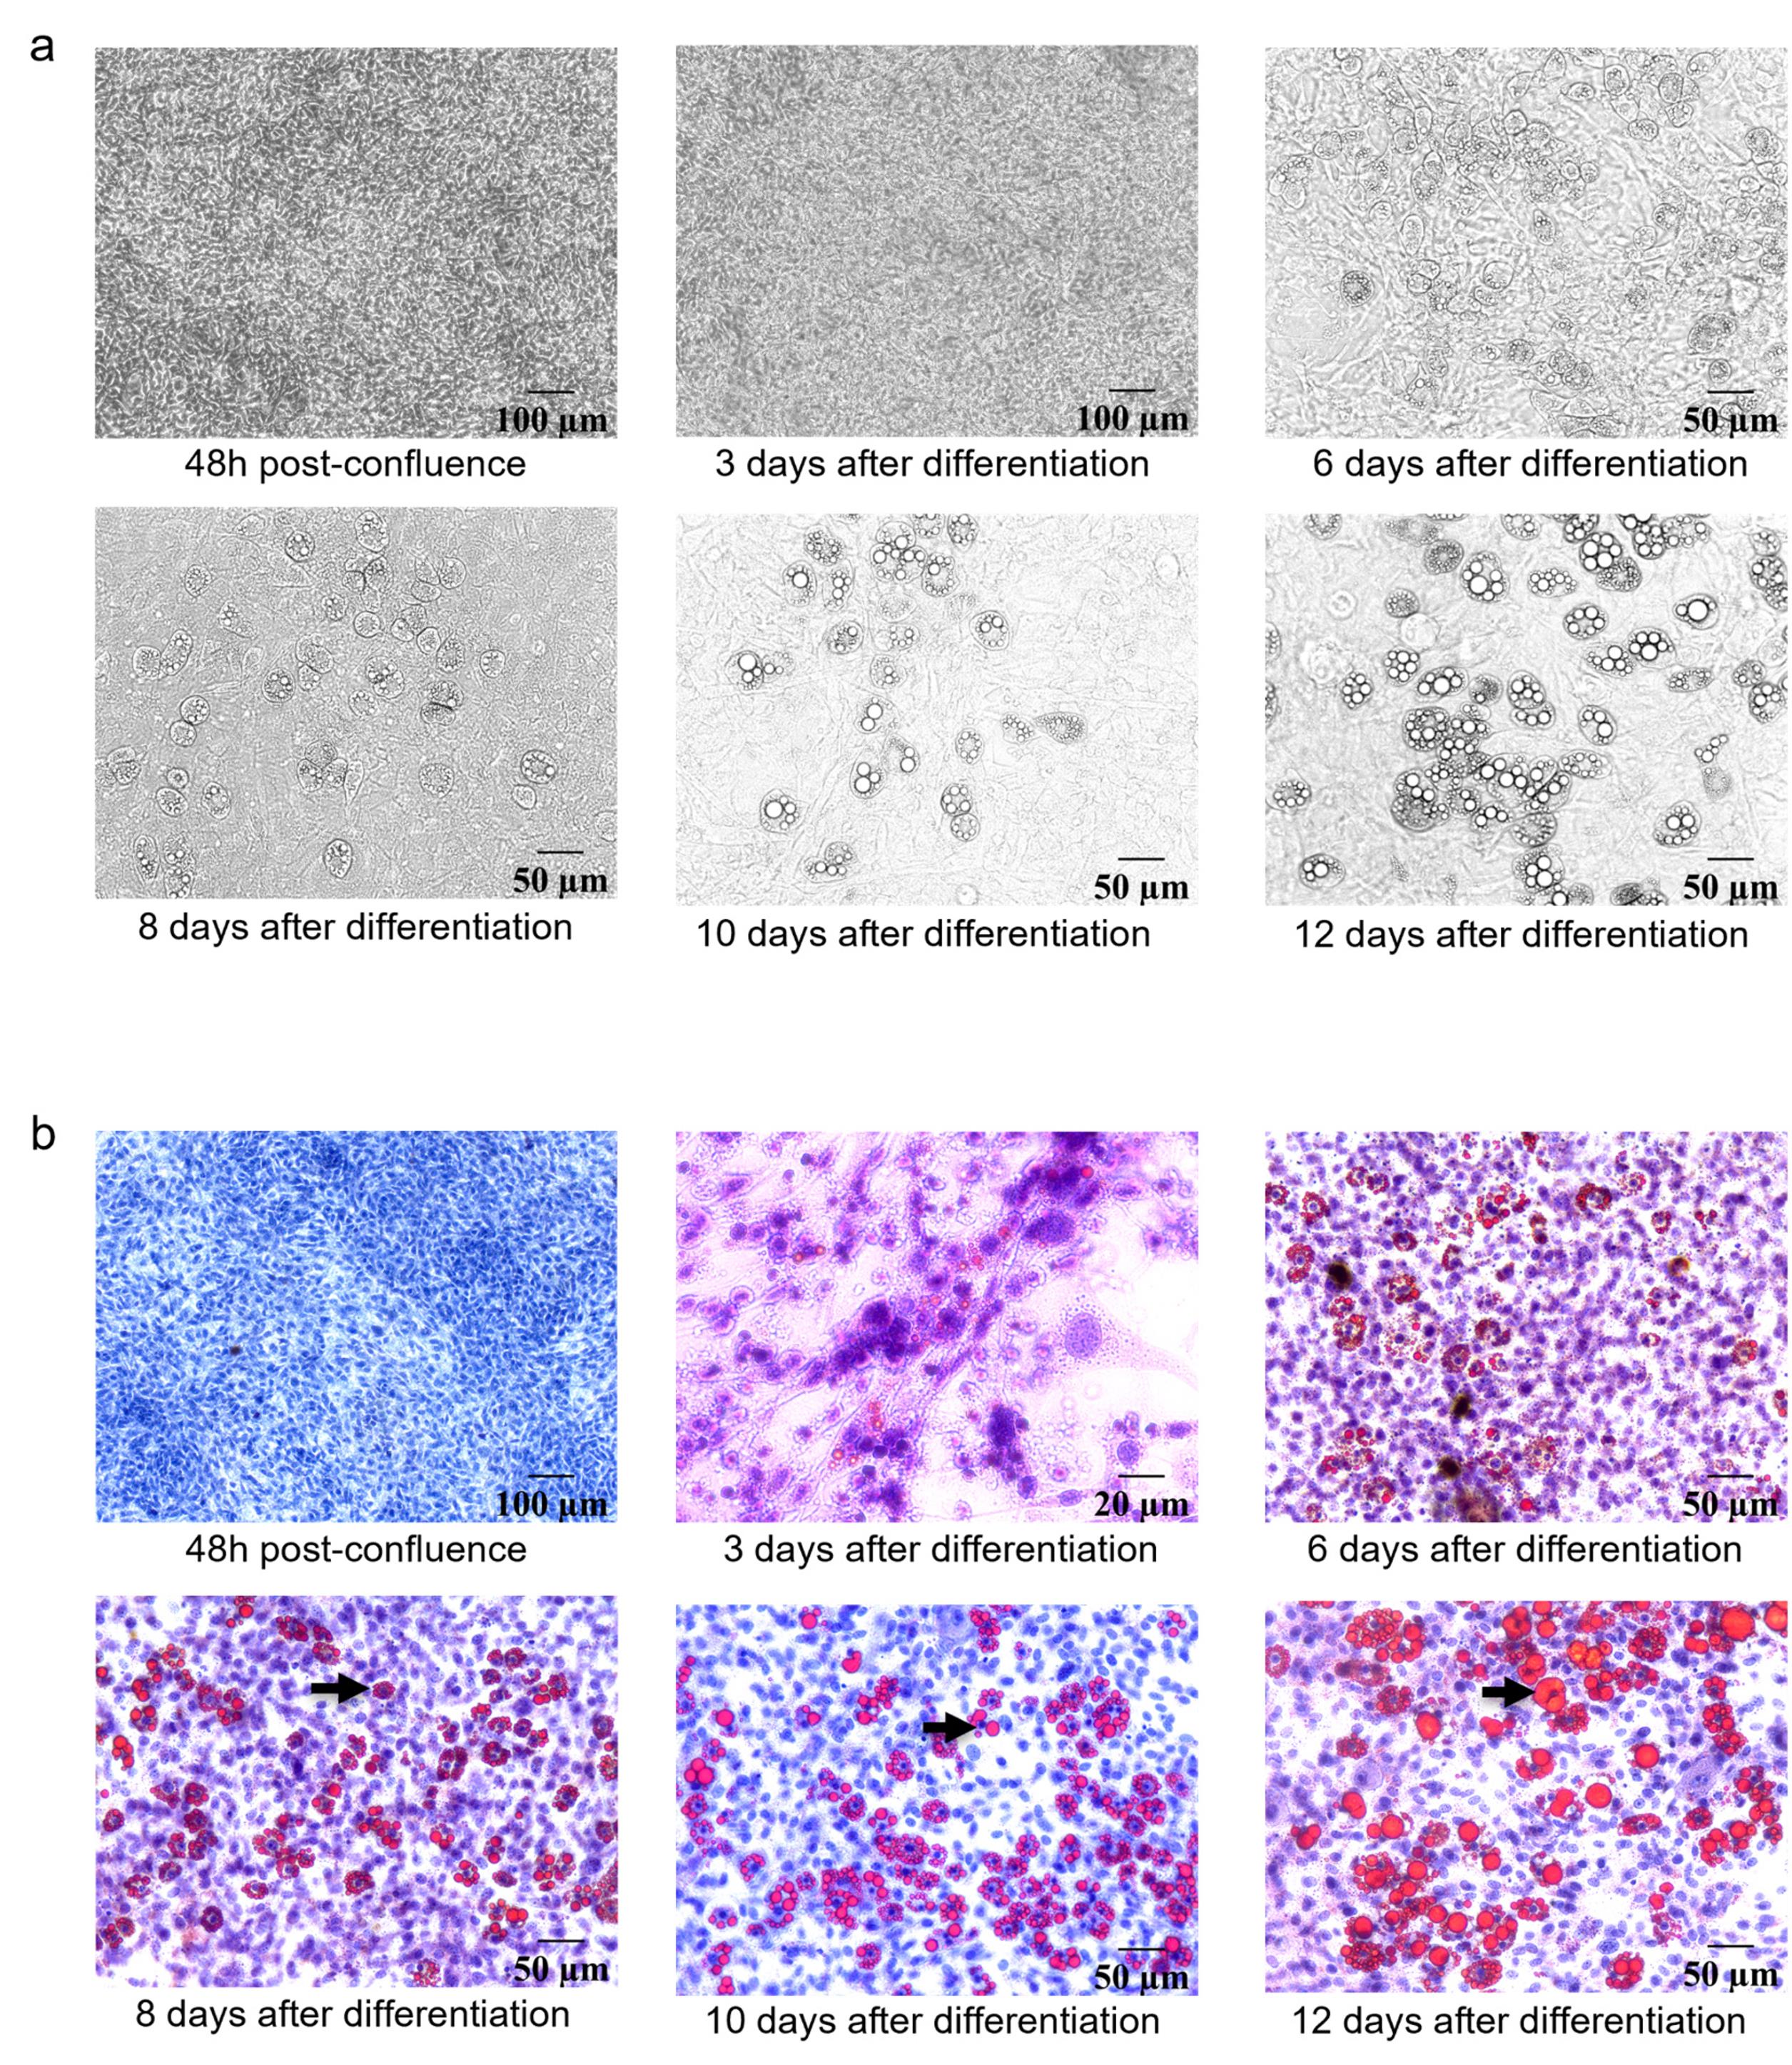
Figure 1. Cell phenotype during adipocyte differentiation and staining of lipid accumulation by Oil Red O staining. (A) Brightfield images of 3T3-L1 differentiation for 12 days showing lipid droplet and rounding phenotype (objectives 20× and 10×). (B) Oil Red O lipid staining during differentiation, confirming the increase of lipid droplets (pointed out by black arrows).
B4. Induction of inflammatory adipocytes
1. Eliminate spent MM.
2. Add 500 μL of InfM per well.
3. Incubate at 37 °C with 5% CO2.
4. If stimulation needs to occur for more than 24 h, change InfM every day.
C. Gene characterization of inflammatory adipocytes
C1. RNA extraction
Note: Automatic RNA extraction is performed by Maxwell RSC according to the manufacturer’s recommendations.
1. For 5 samples, prepare a mix with 1 mL of homogenization solution and 20 μL of thioglycerol (adjust volumes according to the number of samples).
2. Eliminate spent InfM.
3. Add 200 μL of homogenization mix to the well and gently pipette up and down to ensure maximum cell recovery.
4. Add 200 μL of lysis buffer and gently pipette up and down to lyse all cells.
5. Take the 400 μL mix and store it in a 1.5 mL tube on ice.
6. Proceed in the same way with the other wells.
Critical: Proceed sample by sample for the cell lysis step.
7. Vortex tubes for 15 s before extraction.
8. Place the cartridge in the deck tray of Maxwell, prepare an elution tube with 50 μL of nuclease-free water, and add DNase I to the cartridge.
9. Add the processed sample to the cartridge and run the extraction.
10. Determine the concentration of the sample by spectrophotometry or fluorometry.
11. Proceed to reverse transcription PCR immediately.
C2. Reverse transcription
Note: After RNA extraction, proceed to RT-PCR in order to obtain complementary DNA (cDNA).
1. Thaw 5× reaction mix, Maxima enzyme mix, and RNA on ice. Mix them according to the recipe by gently pipetting.
2. Add 1 μg of RNA, 6 μL of the mix, and add water to a quantity sufficient for 20 μL. Prepare enough mix according to the number of reactions required.
3. Use the thermocycler with the following program: 10 min at 25 °C, 15 min at 50 °C, and 5 min at 85 °C.
4. Determine the concentration of the sample by spectrophotometry or fluorometry.
5. Proceed to qPCR or store at 2–8 °C.
C3. Quantitative PCR
1. Dilute cDNA by adding 380 μL of nuclease-free water to the PCR product obtained before (20 μL).
2. Prepare primer mixes (see Recipes and Table 1 for sequence primers).
3. In a 96-well plate, distribute 16 μL of 1 target mix and add 4 μL of diluted cDNA.
4. Provide a housekeeping gene for each sample in addition to the target, such as GAPDH.
5. Place the reaction plate in a real-time PCR device and use the following program: 2 min at 50 °C, 2 min at 95 °C, and 40 cycles with two steps of 3 s at 95 °C and 30 s at 60 °C.
D. Protein profile of inflammatory adipocytes in vitro
1. After 10 days of differentiation, eliminate spent MM.
2. Add 500 μL of InfM per well.
3. Incubate at 37 °C with 5% CO2 for 18 h.
4. Eliminate InfM.
5. Wash each well twice with PBS 1× and add 500 μL of PM.
6. Incubate for 24 h at 37 °C with 5% CO2.
Note: This step eliminates the cytokines introduced during stimulation, ensuring that only those endogenously secreted by the cells into the conditioned medium will be quantified. The incubation time can be adjusted according to experimental requirements.
7. Collect conditioned media, centrifuge at 300× g for 4 min to eliminate cellular debris, and freeze at -80 °C before use.
8. Proteins are measured with the Proteome Profiler Mouse Adipokine Array kit, according to the manufacturer’s instructions. Briefly, the membrane is blocked and then incubated with a mix of conditioned media and antibody cocktail. After several washes, the membrane is incubated with streptavidin-HRP before being revealed with chemiluminescent detection reagent in the iBright system.
Data analysis
All experiments included at least three independent biological replicates, unless otherwise specified, each including technical replicates to ensure measurement reliability. Statistical analyses were carried out on ΔCt values (not on fold changes, which were only used for graphical representation).
Data are presented as mean ± standard error of the mean (SEM) unless otherwise indicated. Statistical analyses were performed using GraphPad Prism version 10.
Normality of the data distribution was assessed using the Shapiro–Wilk test, and comparisons between groups were performed using one-way ANOVA followed by Tukey’s post hoc test for multiple comparisons. Differences were considered significant when p < 0.05.
qPCR results were analyzed with 7500 Software version 2.3 and the proteome profiler array with iBright analysis software 5.2.1.
Validation of protocol
A. Implementation of the adipocyte differentiation protocol
From various data sheets and literature, we tested an adipocyte differentiation protocol in 1 mL of media, but adipocytes never exceeded 20% differentiation. In-depth literature reading revealed many different protocols and troubleshooting. Based on two papers [12,13], we thought to concentrate DM by increasing DM reagent quantities and by decreasing media volume. We tested 350 μL of media with usual reagent concentrations [termed 350 (Low)] and 500 or 350 μL with higher reagent concentrations [termed 500 μL or 350 μL (High)]. The 500 μL condition led to a transitory increase of PPARУ and C/EBPα at day 7, which dramatically dropped after that (Figure 2a), as adipocytes started to show signs of cell dysfunction and massive death (microscopic observations not shown). The 350 μL condition was more suitable for cells, which completed their final differentiation around day 10, as expected (Figure 2a). The 350 μL (High) condition was chosen for the optimization protocol as PPARУ and C/EBPα expression levels were slightly stronger and stable over time in comparison to the 350 μL (Low) condition, and as it supported the effective differentiation of adipocytes as illustrated in Figure 1a, b.
B. Generation of inflammatory adipocytes: transcriptomic analyses
To mimic the inflammatory environment observed in obese adipose tissue, we treated differentiated adipocytes obtained at day 10 with InfM. To confirm that our model reproduces key aspects of adipocyte inflammation, we first monitored adipogenic markers that are expected to decrease. Inflammatory adipocytes showed signs of partial dedifferentiation, characterized by a marked downregulation of adipogenic transcription factors (PPARγ and C/EBPα), adipocyte-specific markers such as CD36, and adiponectin (Figure 2b).
In contrast, we found the induction of pro-inflammatory cytokines mostly in a dose- and time-dependent manner, signaling the acquisition of a pro-inflammatory phenotype as adipocytes dedifferentiate. IL-6 expression was increased up to 300-fold compared to control (Figure 2c). CXCL1 and CXCL10 expressions increased up to 70-fold in comparison to control, so did IL-1β and TNFα expressions, although to a lesser extent (Figure 2c).
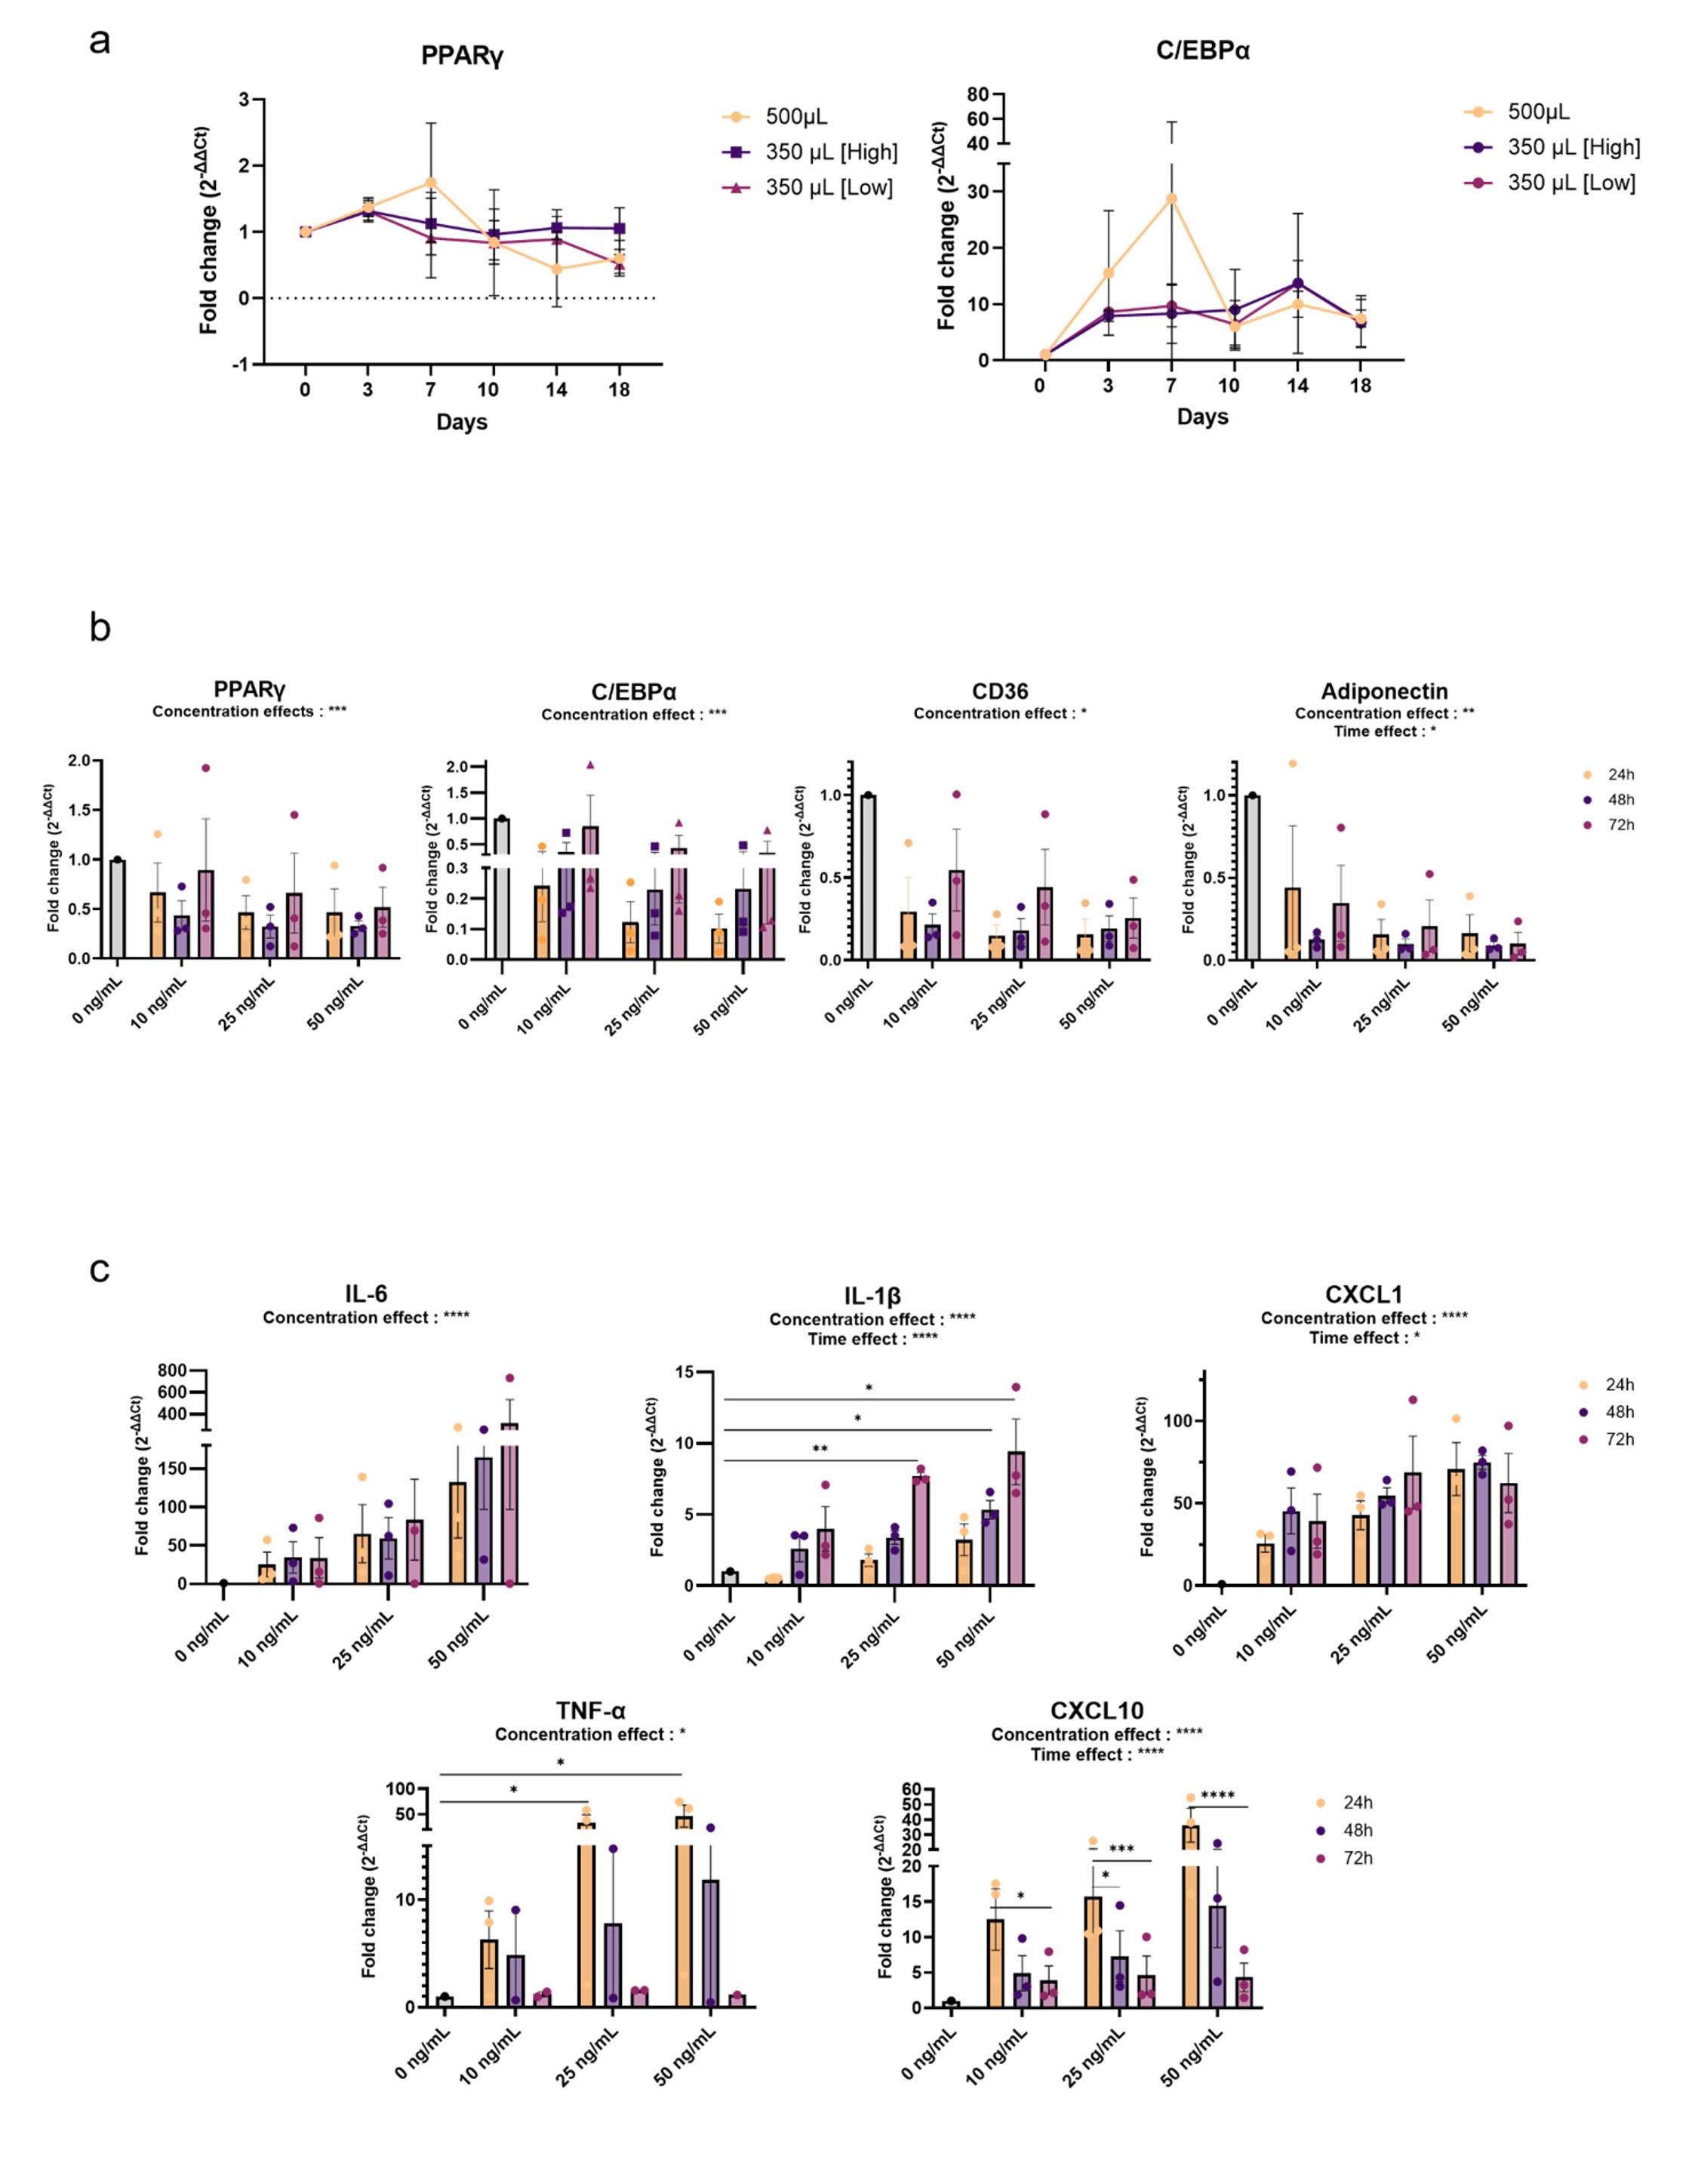
Figure 2. Differentiation and characterization of inflammatory adipocytes. (A) Relative mRNA expression of PPARУ and C/EBPα in the 3T3-L1 cell line over time during differentiation induction. (B) Relative mRNA expression of adipogenic markers PPARУ, C/EBPα, CD36, and AdipoQ (adiponectin gene) during inflammatory stimulation with 10, 25, or 50 ng/mL of cytokine cocktail over time. (C) Relative mRNA expression of inflammatory markers IL-6, IL-1β, CXCL1, TNF-α, and CXCL10 during inflammatory stimulation with 10, 25, or 50 ng/mL of cytokine cocktail over time. Data are expressed as mean ± SEM, n = 3 independent experiments. Analysis of differences within groups was performed with ANOVA and Tukey correction. *p < 0.5; **p < 0.01; ***p < 0.001; ****p < 0.0001.
C. Generation of inflammatory adipocytes: protein analyses
We then analyzed the secretome of inflammatory adipocytes with a multiplex adipokine kit. This kit allows quantification of 38 obesity-related molecules.
We observed a decrease in adiponectin, IGFBP family members, FGF-21, and hepatocyte growth factor (HGF) in comparison to the untreated control group (Figure 3). These anti-inflammatory molecules are known to maintain adipose tissue homeostasis and contribute to insulin sensitivity. Conversely, several pro-inflammatory factors—including serpin-E1, IGF-1, and lipocalin-2—were increased. These molecules are associated with inflammatory signaling: IGF-1 promotes macrophage activation and cytokine release, while lipocalin-2 amplifies inflammatory pathways by enhancing neutrophil recruitment and modulating oxidative stress. We also detected IL-6 and ICAM-1, which were absent in the control (Figure 3).
In conclusion, we established an optimized protocol for adipocyte differentiation and demonstrated that cytokine stimulation turns them into inflammatory adipocytes. Both gene and protein analyses confirmed a decrease in adipogenic and protective factors, consistent with a dedifferentiated adipocyte profile, together with an upregulation of pro-inflammatory molecules. The secretome analysis provides crucial information for further co-culture models. Taken together, these results demonstrate the robustness of our model as a relevant in vitro system to study inflammation-driven changes in adipocytes and effects in the tumor microenvironment.
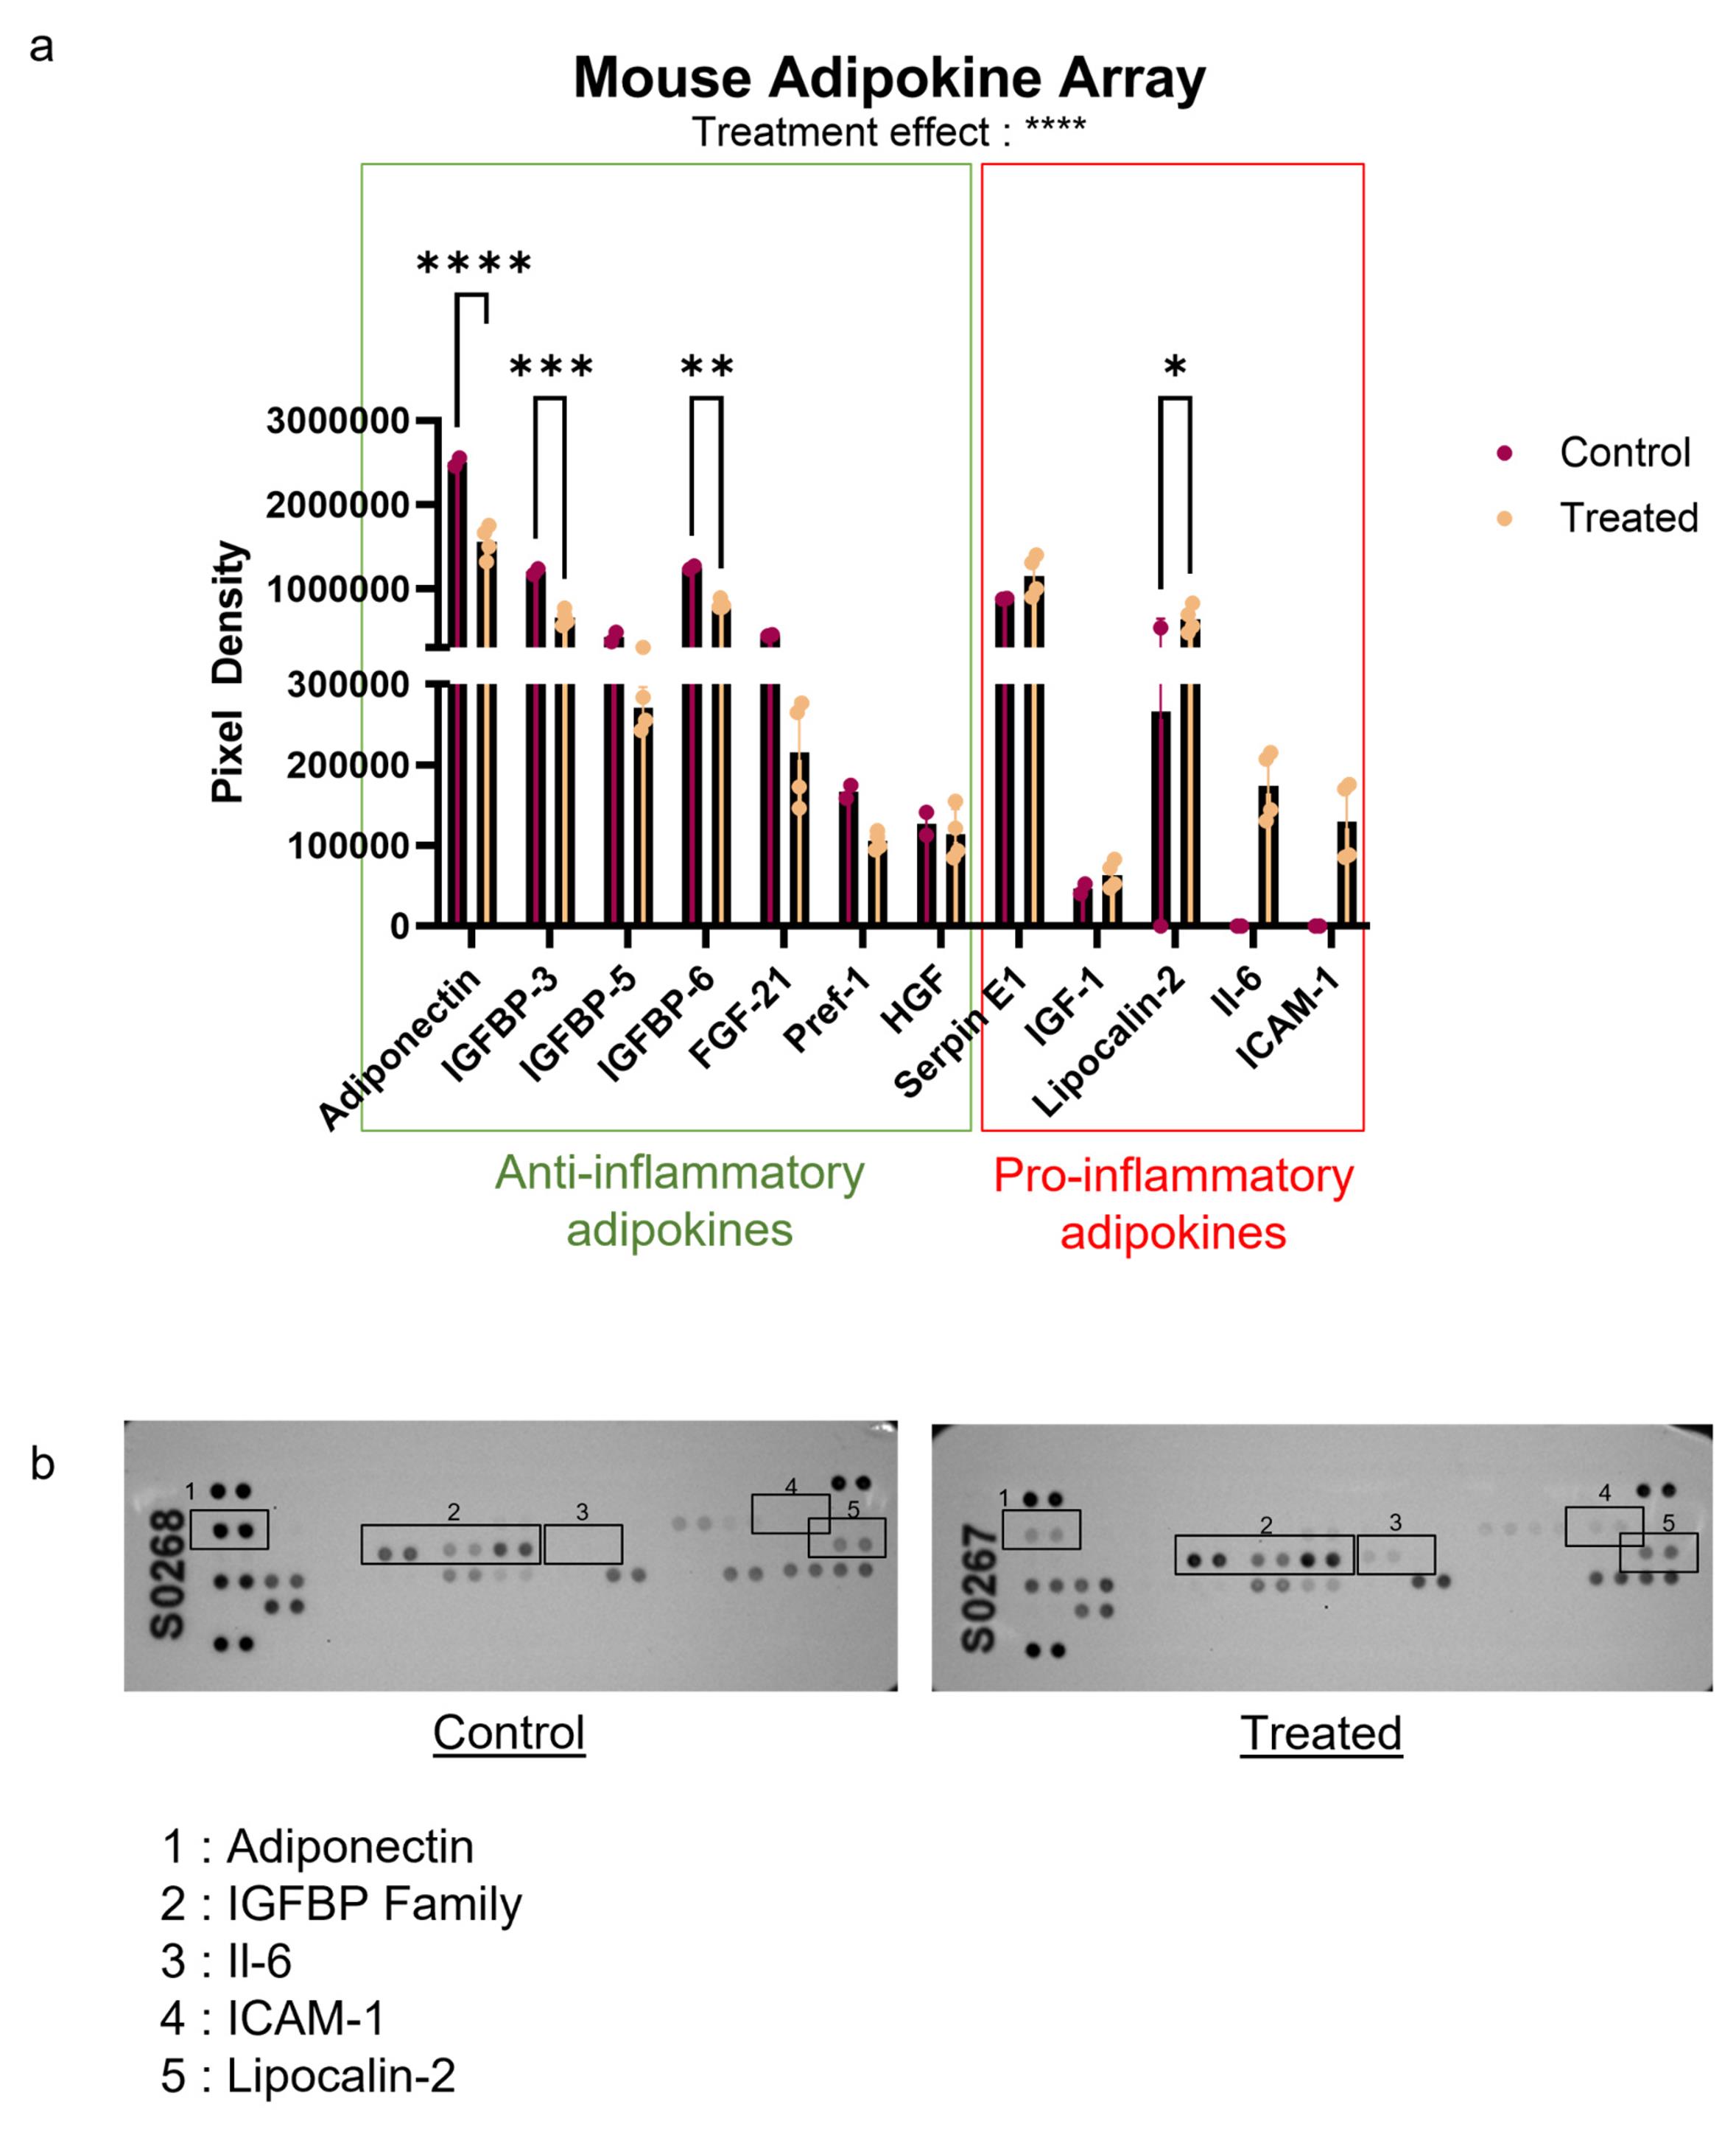
Figure 3. Adipokine expression profile highlighting the inflammatory shift in cytokine-treated adipocytes. (A) The mouse adipokine array was used to quantify the secretion of anti- and pro-inflammatory molecules in the conditioned medium of control and cytokine-treated adipocytes 24 h after removal of InfM Data are expressed as mean ± SEM, n = 2 independent experiments for controls, n = 4 independent experiments for treatments. Analysis of differences within groups was performed with ANOVA and Tukey correction. *p < 0.5; **p < 0.01; ***p < 0.001; ****p < 0.0001. (B) Representative blot images are shown, illustrating the relative signal intensity for each molecule.
General notes and troubleshooting
General notes
This model presents several limitations that should be acknowledged. First, 3T3-L1 cells are a murine cell line, which may limit direct translatability to human systems and complicate co-culture approaches with cell types derived from other species. Second, while the addition of the cocktail of cytokines allows us to mimic macrophage-driven inflammatory signaling typically observed in crow-like structures, this approach does not fully recapitulate the complexity of the in vivo inflammatory environment. Only a limited number of cytokines were used; therefore, the inflammatory stimulus, although effective, remains artificial and does not exhaustively reflect the range of mediators released in obese adipose tissue. Moreover, some molecules known to be upregulated in adipose tissue during obesity were not detected in our model. This likely reflects the fact that adipose tissue is a highly heterogeneous organ composed not only of adipocytes but also of stromal vascular cells, including macrophages, endothelial cells, fibroblasts, pre-adipocytes, and other immune cells. These stromal and immune populations play a critical role in shaping adipose tissue inflammation, which cannot be fully captured in an adipocyte-only in vitro system.
Acknowledgments
The Graphical overview was created in BioRender, under license POTTEAUX, S (2025). We thank CardioVir UR4684 (URCA) for sharing the iBright imaging system.
Competing interests
The authors declare no conflicts of interest.
References
- Ouchi, N., Parker, J. L., Lugus, J. J. and Walsh, K. (2011). Adipokines in inflammation and metabolic disease. Nat Rev Immunol. 11(2): 85–97. https://doi.org/10.1038/nri2921
- Xiao, Z., Chu, Y. and Qin, W. (2020). IGFBP5 modulates lipid metabolism and insulin sensitivity through activating AMPK pathway in non-alcoholic fatty liver disease. Life Sci. 256: 117997. https://doi.org/10.1016/j.lfs.2020.117997
- Wang, J., Zhang, F., Yang, W., Gao, D., Yang, L., Yu, C., Chen, C., Li, X. and Zhang, J. (2023). FGF1 ameliorates obesity‐associated hepatic steatosis by reversing IGFBP2 hypermethylation. FASEB J. 37(4): e202201950r. https://doi.org/10.1096/fj.202201950r
- Yan, Q. W., Yang, Q., Mody, N., Graham, T. E., Hsu, C. H., Xu, Z., Houstis, N. E., Kahn, B. B. and Rosen, E. D. (2007). The Adipokine Lipocalin 2 Is Regulated by Obesity and Promotes Insulin Resistance. Diabetes. 56(10): 2533–2540. https://doi.org/10.2337/db07-0007
- Bošanská, L., Michalský, D., Lacinová, Z., Dostálová, I., Bártlová, M., Haluzíková, D., Matoulek, M., Kasalický, M. and Haluzík, M. (2010). The Influence of Obesity and Different Fat Depots on Adipose Tissue Gene Expression and Protein Levels of Cell Adhesion Molecules. Physiol Res. 59: 79–88. https://doi.org/10.33549/physiolres.931705
- Maliniak, M. L., Miller-Kleinhenz, J., Cronin-Fenton, D. P., Lash, T. L., Gogineni, K., Janssen, E. A. M. and McCullough, L. E. (2021). Crown-Like Structures in Breast Adipose Tissue: Early Evidence and Current Issues in Breast Cancer. Cancers (Basel). 13(9): 2222. https://doi.org/10.3390/cancers13092222
- Tran, T., Lavillegrand, J. R., Lereverend, C., Esposito, B., Cartier, L., Montabord, M., Tran-Rajau, J., Diedisheim, M., Gruel, N., Ouguerram, K., et al. (2022). Mild dyslipidemia accelerates tumorigenesis through expansion of Ly6Chi monocytes and differentiation to pro-angiogenic myeloid cells. Nat Commun. 13(1): e1038/s41467–022–33034–0. https://doi.org/10.1038/s41467-022-33034-0
- Ellulu, M. S., Patimah, I., Khaza’ai, H., Rahmat, A. and Abed, Y. (2017). Obesity and inflammation: the linking mechanism and the complications. Arch Med Sci. 13(4): 851–863. https://doi.org/10.5114/aoms.2016.58928
- Kassotis, C. D., Hoffman, K., Völker, J., Pu, Y., Veiga-Lopez, A., Kim, S. M., Schlezinger, J. J., Bovolin, P., Cottone, E., Saraceni, A., et al. (2021). Reproducibility of adipogenic responses to metabolism disrupting chemicals in the 3T3-L1 pre-adipocyte model system: An interlaboratory study. Toxicology. 461: 152900. https://doi.org/10.1016/j.tox.2021.152900
- Odeniyi, I. A., Ahmed, B., Anbiah, B., Hester, G., Abraham, P. T., Lipke, E. A. and Greene, M. W. (2024). An improved in vitro 3T3-L1 adipocyte model of inflammation and insulin resistance. Adipocyte. 13(1): e2414919. https://doi.org/10.1080/21623945.2024.2414919
- Kaczmarek, I., Schüßler, K., Lindhorst, A., Gericke, M. and Thor, D. (2025). A Pathophysiologically Hypertrophic 3T3-L1 Cell Model—An Alternative to Primary Cells Isolated from DIO Mice. Cells. 14(11): 837. https://doi.org/10.3390/cells14110837
- Sheng, X., Tucci, J., Malvar, J. and Mittelman, S. D. (2013). Adipocyte differentiation is affected by media height above the cell layer. Int J Obes. 38(2): 315–320. https://doi.org/10.1038/ijo.2013.96
- Zebisch, K., Voigt, V., Wabitsch, M. and Brandsch, M. (2012). Protocol for effective differentiation of 3T3-L1 cells to adipocytes. Anal Biochem. 425(1): 88–90. https://doi.org/10.1016/j.ab.2012.03.005
Article Information
Publication history
Received: Oct 23, 2025
Accepted: Jan 16, 2026
Available online: Jan 30, 2026
Published: Feb 20, 2026
Copyright
© 2026 The Author(s); This is an open access article under the CC BY-NC license (https://creativecommons.org/licenses/by-nc/4.0/).
How to cite
Cartier, L., Fournet, R., De Boni, M., Kotaich, N., Laassilii, C., Merrouche, Y. and Potteaux, S. (2026). In Vitro Model of Cytokine-Induced Inflammatory 3T3-L1 Adipocytes Mimicking Obesity. Bio-protocol 16(4): e5609. DOI: 10.21769/BioProtoc.5609.
Category
Immunology > Inflammatory disorder
Cell Biology > Cell-based analysis > Inflammatory response
Immunology > Immune mechanisms > Ex vivo model
Do you have any questions about this protocol?
Post your question to gather feedback from the community. We will also invite the authors of this article to respond.