- Protocols

- Articles and Issues
- For Authors
- About
- Become a Reviewer

Biochemical Reconstitution and FRAP Analysis of Membrane-Associated Condensates on Supported Lipid Bilayers
Published: Vol 16, Iss 3, Feb 5, 2026 DOI: 10.21769/BioProtoc.5592 Views: 188
Reviewed by: Anonymous reviewer(s)
Original research article
The authors used this protocol in:
Sep 2025

Protocol Collections
Comprehensive collections of detailed, peer-reviewed protocols focusing on specific topics


Abstract
Plasma membrane–associated condensates driven by liquid–liquid phase separation represent a novel mechanism of receptor-mediated signaling transduction, serving as mesoscale platforms that concentrate signaling molecules and modulate reaction kinetics. Condensate formation is a highly dynamic process that occurs within seconds to minutes following receptor activation. Here, we present methods for de novo reconstituting liquid-like condensates on supported lipid bilayers and assessing the condensate fluidity using fluorescence recovery after photobleaching (FRAP). This protocol encompasses supported lipid bilayer preparation, condensation imaging, and FRAP analysis using total internal reflection fluorescence (TIRF) microscopy. Supported lipid bilayers provide a membrane-mimicking environment for receptor signaling cascades, offering mechanistic insights into protein–protein and lipid–protein interactions amid micron-scale condensates. The protocol can also be adapted to study condensates associated with the internal membranes of the Golgi apparatus, mitochondria, and other organelles.
Key features
• Real-time imaging of condensate formation and FRAP analysis using TIRF microscopy reveals a spatiotemporal profile of signaling transduction.
• Supported lipid bilayers provide a fluidic membrane environment that is critical for the biochemical reconstitution of condensates at physiological protein concentrations.
• The lipid and protein components within the reconstituted condensate system can be readily manipulated to accommodate specific experimental objectives and assay designs.
Keywords: Receptor signalingGraphical overview
Background
Signal transduction at the plasma membrane requires precise spatial and temporal organization of receptor-associated signaling molecules to elicit appropriate cellular responses upon stimulation. Recent efforts have uncovered that membrane-associated biomolecular condensates driven by liquid–liquid phase separation (LLPS) serve as organizing hubs for dynamic signaling assemblies in pathways including T-cell receptor (TCR), B-cell receptor (BCR), and epidermal growth factor receptor (EGFR) [1–3]. Beyond the plasma membrane, condensates also form on intracellular membranes such as the Golgi apparatus, endosomes, and mitochondria [4]. Elucidating the mechanisms governing biomolecular condensate formation and regulation provides crucial insight into normal cellular processes and pathological states such as tumorigenesis [5] and unveils potential targets for therapeutic intervention [6,7].
In the context of TCR signaling, the transmembrane adaptor protein LAT (Linker for Activation of T cells) is the key to drive membrane-associated condensate formation [1]. Upon receptor engagement, the intracellular intrinsically disorder region (IDR) of LAT is phosphorylated by ZAP-70, generating multiple phosphotyrosine (pY) motifs that recruit SH2 domain–containing proteins such as Grb2 and PLCγ1. We implemented a biochemical reconstruction system and fluorescence recovery after photobleaching (FRAP) analysis to identify two types of multivalent interactions—the pY-SH2 pair between LAT and Grb2 and the SH3-Proline rich motif pair between Grb2 and Sos1—that form LAT condensates with a liquid-like property [8]. We further discovered that PLCγ1 drives LAT cluster formation and nonmonotonically regulates the condensate sizes at physiological TCR signaling [9]. Interestingly, PLCγ1 is frequently mutated in adult T-cell leukemia/lymphoma, cutaneous T-cell lymphoma, and peripheral T-cell lymphoma. We found that leukemia/lymphoma-associated PLCγ1 mutations drive abnormal LAT condensation compared to the wild type [10]. These discoveries illustrated the power of biochemical reconstitution in revealing molecular mechanisms underlying both physiological and pathological states.
Membrane-associated condensates are frequently characterized in a reconstituted system. Their liquidity is assessed by FRAP, fusion, and wetting [1,8,10]. Here, we provide detailed, step-by-step methods for the biochemical reconstitution and quantification of membrane-associated condensates. Because FRAP serves as the most common method to assess condensation, we also provide a protocol for FRAP analysis.
Materials and reagents
Biological materials
1. Recombinant proteins: LAT [1], Grb2 [1], Sos1 [1], and PLCγ1 [11] (generated in-lab)
2. Glucose oxidase (Sigma, catalog number: G7141-50KU)
3. Glucose (Sigma, catalog number: 158968-5KG)
4. Catalase (Sigma, catalog number: C9322-5G)
Reagents
1. 10× PBS buffer (Gibco, catalog number: 70011-044)
2. Milli-Q ultrapure water (generated in-lab)
3. NaOH (Macron, catalog number: 7708-10)
4. 1 M HEPES buffer, pH 7.4 (Gibco, catalog number: 15630-080)
5. 5 M NaCl (Sigma, catalog number: S5150-1L)
6. TCEP (Sigma, catalog number: C4706-10G)
7. BSA (Sigma, catalog number: A9647-100G)
8. Lipids: 10 mg/mL POPC (Avanti, catalog number: 850457C)
9. Lipids: 1 mg/mL PEG5000 PE (Avanti, catalog number: 880230C)
10. Lipids: 1 mg/mL DOGS-NTA (Avanti, catalog number: 790404C)
11. Chloroform (Electron Microscopy Sciences, catalog number: 12550)
12. Immersion oil type F 30cc (Nikon, catalog number: MXA22168)
13. β-mercaptoethanol (Sigma, catalog number: M6250-100ML)
14. Hellmanex III (Sigma, catalog number: Z805939)
Solutions
1. 1× PBS buffer (see Recipes)
2. 5 M NaOH buffer (see Recipes)
3. Basic buffer (see Recipes)
4. Clustering buffer (see Recipes)
5. Lipid mixture (see Recipes)
Recipes
1. 1× PBS buffer
| Reagent | Final concentration | Quantity or volume |
|---|---|---|
| 10× PBS | 10% | 100 mL |
| Ultrapure water | 90% | 900 mL |
| Total | 100% | 1,000 mL |
2. 5 M NaOH buffer
| Reagent | Final concentration | Quantity or volume |
|---|---|---|
| NaOH | 5 M | 4 g |
| Ultrapure water | 20 mL |
3. Basic buffer
| Reagent | Final concentration | Quantity or volume |
|---|---|---|
| 1 M HEPES, pH 7.4 | 50 mM | 2.5 mL |
| 5 M NaCl | 150 mM | 1.5 mL |
| 0.5 M TCEP | 1 mM | 0.1 mL |
| Ultrapure water | 45.9 mL | |
| Total | 50 mL |
4. Clustering buffer
| Reagent | Final concentration | Quantity or volume |
|---|---|---|
| 1 M HEPES, pH 7.4 | 50 mM | 2.5 mL |
| 5 M NaCl | 150 mM | 1.5 mL |
| 0.5 M TCEP | 1 mM | 0.1 mL |
| BSA | 1 mg/mL | 0.5 mg |
| Ultrapure water | 45.9 mL | |
| Total | 50 mL |
5. Lipid mixture
| Reagent | Final concentration | Quantity or volume |
|---|---|---|
| 10 mg/mL POPC | 97.9% | 0.3 mL |
| 1 mg/mL DOGS-NTA | 2% | 0.06 mL |
| 1 mg/mL PEG5000 PE | 0.1% | 0.015 mL |
| Chloroform | 0.2–0.5 mL |
Laboratory supplies
1. 96-well glass-bottom plate (Matrical Inc, catalog number: MGB096-1-2-LG-L)
2. Glass vials (National Scientific, catalog number: B7800-2)
3. Adhesive PCR plate foils (Thermo Fisher, catalog number: AB-0626)
4. 25 μL gastight syringe (Hamilton, catalog number: 80275)
5. 250 μL gastight syringe (Hamilton, catalog number: 81175)
6. 1.7 mL Eppendorf tubes (Posi-click, catalog number: 1149K01)
7. 15 mL tubes (Cell Treat, catalog number: 229411)
8. 50 mL tubes (Cell Treat, catalog number: 229421)
9. 10 μL pipette tips (Thomas Scientific, catalog number: 1158U34)
10. 200 μL pipette tips (Thomas Scientific, catalog number: 1159M40)
11. 1,250 μL pipette tips (Thomas Scientific, catalog number: 1159M42)
12. Razor blade (VWR International, catalog number: 55411-050)
13. Polycarbonate high ultracentrifuge tubes (Beckman Coulter, catalog number: 343775)
Equipment
1. Heater (Thermo Scientific, catalog number: HP88857100)
2. Water bath (Thermo Scientific, catalog number: 51221073)
3. 37 °C incubator (Thermo Scientific, catalog number: 51028121)
4. Optima Max-Xp benchtop ultracentrifuge (Beckman Coulter, catalog number: JAA187324)
5. -80 °C freezer (Thermo Scientific, catalog number: 3282232101)
6. TIRF microscope with FRAP laser (Nikon Ti2-E inverted motorized microscope stand) equipped with Oko Lab temperature control system set at 37 °C and a stage adaptor for 96-well glass-bottom imaging plate (ASI imaging, catalog number: I-3020); the microscope was equipped with a 4-channel monolithic laser combiner (Agilent Technologies, catalog number: MLC 400B)
Software and datasets
1. ImageJ software (NIH, https://imagej.net/Downloads)
2. GraphPad Prism 10 software (GraphPad Software, Inc., https://www.graphpad.com)
3. Excel (Microsoft, https://www.microsoft.com/en-us/microsoft-365/excel)
Procedure
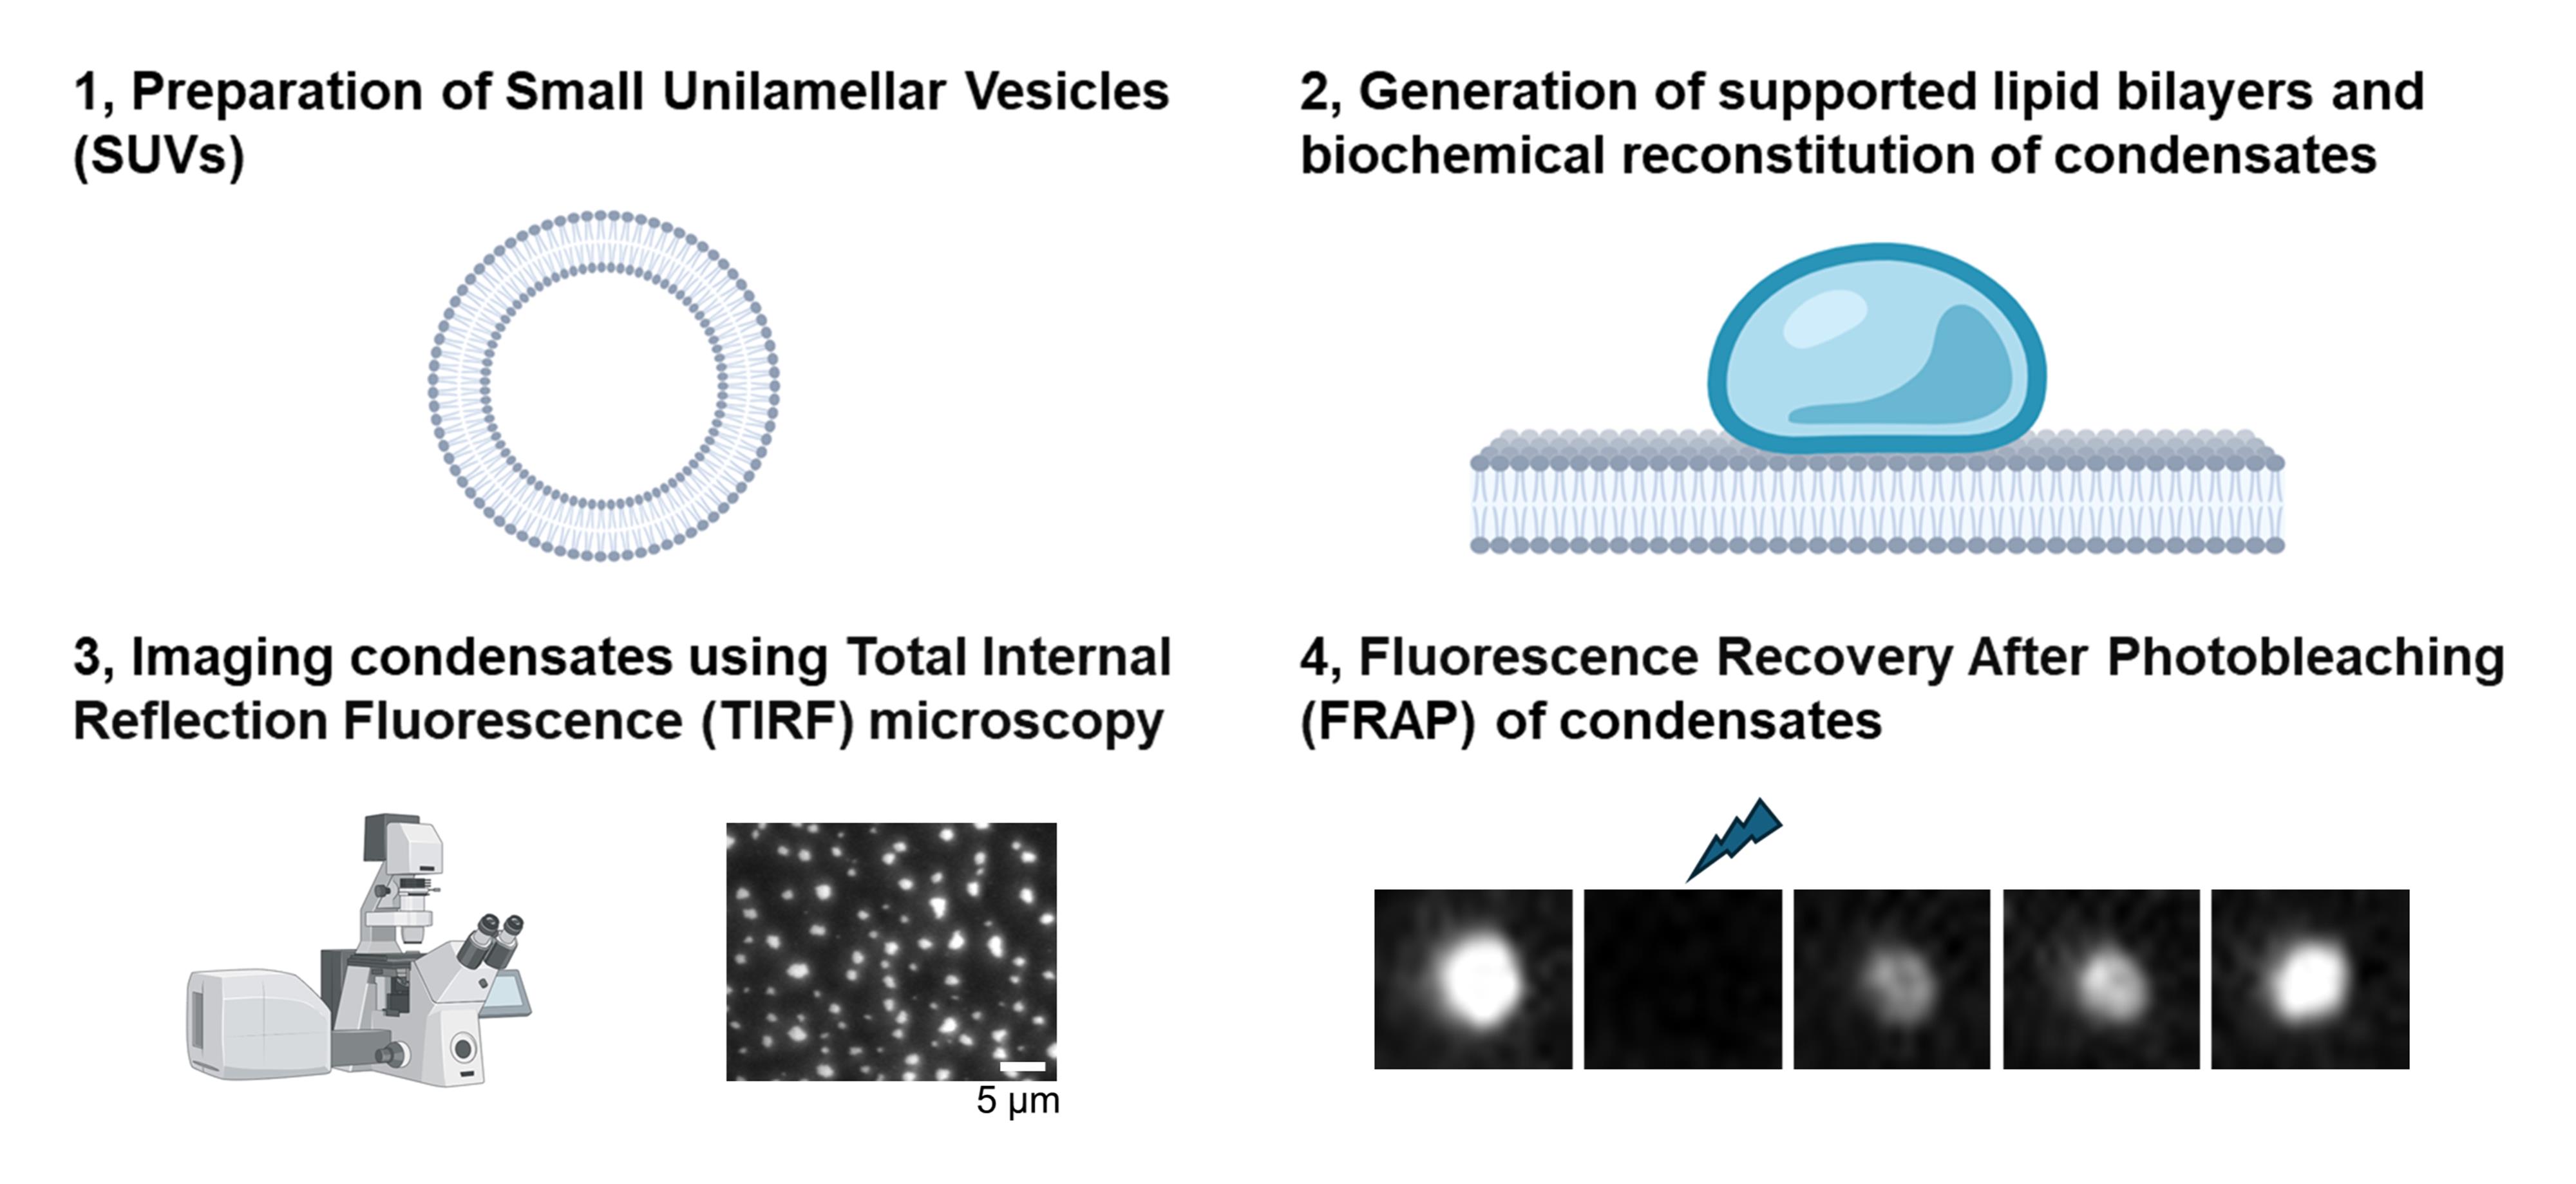
A. Generation of customized small unilamellar vesicles (SUVs) with lipids
Note: The lipid composition of SUVs in this protocol for supported lipid bilayers is 97.9% POPC, 2% DOGS-NTA, and 0.1% PEG5000 PE, which is designed for anchoring His-tagged recombinant proteins. For anchoring biotin-tagged proteins, the lipid mixture can be adjusted to 99.8% POPC, 0.1% DSPE-PEG (2000) biotin, and 0.1% PEG5000 PE. Fluorescently labeled streptavidin is used as a molecular linker to bridge the biotinylated lipid and the biotin-tagged protein [12]. Additionally, other lipids such as cholesterol or PIP2 can be incorporated to address specific experimental objectives.
1. Retrieve POPC, DOGS-NTA, and PEG5000 PE lipid stocks in chloroform from the -20 °C freezer and allow them to equilibrate to room temperature for 15 min.
Note: Use freshly prepared lipids whenever possible. Avoid reusing thawed lipids.
2. Rinse new glass vials with chloroform once in a fume hood, ensuring both the bottom and walls are washed. Add 200–500 μL of chloroform to the cleaned vial for subsequent lipid mixing.
Note: The exact chloroform volume is not critical, as it will be completely evaporated during drying.
3. Rinse a glass gastight syringe with chloroform three times. Sequentially add 300 μL of 10 mg/mL POPC, 60 μL of 1 mg/mL DOGS-NTA, and 15 μL of 1 mg/mL PEG5000 PE into one vial.
Note: Lipids are sticky; wash the syringe three times with chloroform after each use to prevent residue buildup.
4. Evaporate chloroform by gently blowing nitrogen gas over the lipid mixture while maintaining the vial at 45 °C in a water bath in the fume hood. Continue drying for ~5 min until a white, solid lipid film forms.
Note: Adjust nitrogen flow to a moderate rate to prevent lipid splashing.
5. Transfer the vial and its cap into a vacuum desiccator and dry for an additional 3 h to remove residual solvent at room temperature.
6. Add 1.5 mL of sterile 1× PBS to the vial and vortex thoroughly to resuspend the lipid film. Divide the resulting suspension equally into two 1.7 mL microcentrifuge Eppendorf tubes (750 μL each).
7. Subject the lipid suspension to 30 freeze-thaw cycles by alternating between liquid nitrogen freezing and 37 °C water bath thawing. Continue until the suspension turns clear, indicating SUV formation. Store prepared SUVs at -80 °C until use.
B. Generation of supported lipid bilayers on imaging plate
Note: In this step, the imaging plate is first thoroughly cleaned and then used to form supported lipid bilayers using the SUVs.
1. Immerse a 96-well glass-bottom imaging plate in 1 L of 5% Hellmanex III solution in a glass beaker. Cover the beaker with plastic wrap and microwave for 3 min to remove air bubbles trapped in the wells. Place the beaker on a magnetic stirrer and rotate overnight at room temperature.
2. Rinse the imaging plate thoroughly with ultrapure water 10 times. Dry the plate with nitrogen gas and seal it with an adhesive PCR foil sheet.
3. Use a blade to cut openings in the foil, exposing the desired wells. Add 200 μL of 5 M NaOH to each exposed well and place the plate on a 50 °C heater for 15 min. Repeat the NaOH cleaning step twice.
4. Remove NaOH and rinse twice with 500 μL of ultrapure water. Wash once more with 500 μL of 1× PBS. Add 200 μL of PBS to each well to prepare for SUV addition.
5. Retrieve the SUV stock from the -80 °C freezer and perform five additional freeze-thaw cycles to further clarify the solution.
6. Centrifuge the SUV suspension at 60,000× g using Optima Max-Xp Benchtop Ultracentrifuge and TLA-120 rotor for 45 min at 4 °C to remove large or multilamellar vesicles and aggregates, which can interfere with uniform supported lipid bilayer formation. Transfer the supernatant to a new 1.7 mL Eppendorf tube.
Note: If the SUVs will be reused within one week, pre-fill the tube with argon and store at 4 °C.
7. Add 20 μL of the SUV supernatant to each well containing 200 μL of PBS in the imaging plate. Incubate the plate at 37 °C for 1 h to allow SUVs to land, rupture, and form supported lipid bilayers on the rigid glass bottom surface.
8. Carefully remove 100 μL of solution from each well. Wash each well three times with 500 μL of basic buffer to remove unbound SUVs.
Note: After supported lipid bilayer formation, the glass-bottom wells must be kept continuously hydrated (>50 μL buffer), as even brief drying will irreversibly disrupt the supported lipid bilayer.
9. Add 100 μL of clustering buffer to each well and incubate for 30 min to block the surface prior to adding His-tagged proteins.
C. Biochemical reconstitution of condensates on supported lipid bilayers
In this section, His8-pLAT-Cy3B protein is first anchored onto Ni-NTA-containing supported lipid bilayers. Grb2, Sos1, and PLCγ1 are then added to induce multivalent interactions that drive LAT condensate formation (Figure 1A). TIRF microscopy is used to visualize membrane-associated condensates. Recombinant human LAT, Grb2, and Sos1 proteins are expressed and purified as previously described using the BL21 (DE3) bacterial system [1]. Full-length rat PLCγ1 and leukemia-associated mutants are expressed and purified using a baculovirus system in HighFive (T. ni) cells [11]. Purified LAT is phosphorylated and fluorescently labeled with a maleimide-conjugated dye (e.g., Cy3B) via the C-terminal cysteine and retains its His8 tag (His8-pLAT-Cy3B) for Ni-NTA bilayer attachment [1]. Cytosolic proteins (Grb2, Sos1, PLCγ1) are purified, and their N-terminal affinity tags (e.g., GST, His) are cleaved off [1,11].

Figure 1. Biochemical reconstitution of condensates on supported lipid bilayers. (A) Schematic of multivalent interactions underlying LAT condensate formation driven by PLCγ1. (B) Comparison of LAT condensation induced by PLCγ1 wildtype (WT) vs. leukemia-associated PLCγ1 mutants. (C) Quantification of LAT clustering. Data are presented as mean ± SD from three biological replicates. Unpaired two-tailed t-test was used. *p < 0.05, **p < 0.01. The figures are adapted from Zeng et al. [10] with modifications.
1. Remove 50 μL of clustering buffer from each well and replace with 50 μL of clustering buffer containing 6 nM His8-pLAT-Cy3B. Incubate for 3 h at 37 °C to allow saturated binding of LAT to the Ni–NTA-containing membrane.
Note: The density of LAT anchored on the supported lipid bilayer is approximately 300 molecules/μm2 [8].
2. Wash three times with 500 μL of clustering buffer to remove excess His8-pLAT-Cy3B in the solution.
Note: Gently add clustering buffer, then carefully remove it without touching the glass surface or mixing during washing, which may disrupt the bilayers.
3. Prepare fresh oxygen scavenger solution consisting of 0.2 mg/mL glucose oxidase, 0.035 mg/mL catalase, 25 mM glucose, and 70 mM β-mercaptoethanol in clustering buffer.
4. Remove 50 μL of clustering buffer from each well. Add 50 μL of oxygen scavenger solution containing 6,000 nM Grb2, 600 nM Sos1, and 100 nM PLCγ1, and incubate for 30 min at 37 °C.
Note: Physiological Grb2, Sos1, and PLCγ1 concentrations in T cells are ~3,000, 300, and 50 nM, respectively [8]. These proteins can be fluorescently labeled to visualize membrane recruitment and location; a mixture of 10%–20% labeled protein with 80%–90% unlabeled protein provides optimal signal while maintaining function.
5. Use a well containing His8-pLAT-Cy3B only, which presents evenly distributed signals, to decide the TIRF angle. After adding Grb2/Sos/PLCG1, LAT condensates will be imaged using a 100× objective on the supported lipid bilayer at 37 °C without washing (Figure 1B).
Note: Adjust laser power so the fluorescence signal is at least threefold above background (e.g., >300 vs. 100 arbitrary units).
6. Analyze LAT fluorescence intensity using ImageJ. Follow these steps: Analyze → Set measurements → Select Area, Mean gray value, and Standard deviation → Measure. The output results can be transferred into other software for further quantification.
7. Quantify LAT clustering (Figure 1C). Calculate the clustering metric by normalized variance (Std2/Mean). Perform statistical analysis and generate plots using GraphPad Prism 10. Compared to other quantification methods, for example, cluster number and size, this method is objective and does not involve segmentation, which might introduce technical variance. Multiple papers have used this method to quantify clustering [1,13–15].
Note: Ensure the mean LAT fluorescence intensity across experimental groups remains similar (typically <1.5-fold range) after background subtraction.
D. FRAP analysis of condensates on supported lipid bilayers
Note: This protocol describes how to perform FRAP on LAT condensates using TIRF microscopy (Figure 2A). It is useful for comparing the effects of different regulators (e.g., Grb2 vs. PLCγ1) or PLCγ1 wildtype vs. leukemia-associated mutants on condensation dynamics (Figure 2B). FRAP analysis can also be applied to assess the fluidity of membrane-associated condensates on lipid bilayers containing PIP2, cholesterol, or other lipids of interest.

Figure 2. Fluorescence recovery after photobleaching (FRAP) analysis of LAT condensates. (A) Total internal reflection fluorescence (TIRF) microscopy imaging of LAT condensate recovery during FRAP. Representative images are shown. (B) Quantification of recovery kinetics for condensates formed by PLCγ1 wild type (WT) and the D1165H mutant. Half-recovery time (t1/2) and full recovery percentage are indicated. Data represent mean ± SEM from 10 condensates. The figures are adapted from Zeng et al. [10] with modifications.
1. Assemble LAT condensates under the desired protein conditions (e.g., PLCγ1 WT vs. mutant) on supported lipid bilayers at 37 °C, as described above.
2. Warm the microscope to 37 °C and set up the scope for FRAP/TIRF mode.
Note: The TIRF angle for the FRAP channel may differ from the standard imaging channel and must be adjusted accordingly.
3. Select LAT condensates with comparable fluorescence intensity and size across experimental groups to perform FRAP.
Note: Recommended condensate intensity range: 1,500–3,000 arbitrary units (a.u.).
4. Adjust the FRAP laser power and bleaching duration to achieve at least 80% loss of condensate fluorescence intensity.
5. Set the post-bleach imaging interval to ensure that at least six recovery time points are collected before the signal reaches a plateau and ensure that the total acquisition time is sufficient to capture a stable recovery plateau for each group.
6. Each FRAP run includes pre-bleach acquisition, bleaching, and recovery acquisition. Analyze at least 10 condensates per group. The FRAP ROI is circular, with a diameter of 2 μm.
Note: To increase throughput, 2–4 condensates may be bleached simultaneously during a single FRAP run.
7. Quantify LAT condensate fluorescence recovery using ImageJ. Use the circle tool to select the FRAP condensate. Follow the steps: Image → Stacks → Plot Z-axis Profile. Adjust the interval times if they were miscalculated by ImageJ. For FRAP signal normalization, the intensity at the bleaching point was first subtracted, and then data were normalized to the initial pre-bleach intensity.
Note: Time-lapse movies may show occasional x-y drift. Install the StackReg plugin to correct drift. The plugin can be downloaded here: https://bigwww.epfl.ch/thevenaz/stackreg/.
8. Determine half-recovery time (t1/2) and full recovery percentage in GraphPad Prism software. Open GraphPad Prism and create an XY table, then fill in the recovery data. To analyze, go to Analysis interface → Fit a curve with nonlinear regression → Model → Exponential → One-phase association. Under Constrain, set Y0 = 0, then click OK. Record the half-time (t1/2) and plateau values from the Best-fit values output. This fit uses a nonlinear regression with an exponential one-phase association model, Y(t) = Y0 + (Plateau – Y0) (1 – e-kt). In this model, k represents the apparent recovery rate constant, and the Plateau reflects the mobile fraction, which is appropriate for our measurements where recovery is dominated by a single diffusion-controlled process.
Note: Set the bleach frame as time zero (0 s) when fitting the recovery curve.
Validation of protocol
This protocol has been used and validated in the following research articles:
• Su et al. [1]. Phase separation of signaling molecules promotes T cell receptor signal transduction. Science (Figure 1 and Figure S1).
• Zeng et al. [8]. PLCγ1 promotes phase separation of T cell signaling components. Journal of Cell Biology (Figure 1 and Figure S2).
• Zeng et al. [10]. Hyperactive PLCG1 induces cell-autonomous and bystander T cell activation and drug resistance. EMBO Reports (Figure 1 and Figure EV1).
General notes and troubleshooting
General notes
1. Proper cleaning of the imaging plate is essential for generating high-quality supported lipid bilayers.
2. Always aliquot recombinant proteins and avoid repeated freeze-thaw cycles.
3. The condensate assay requires a full day to execute, including preparing supported lipid bilayers and imaging.
4. The quality of the bilayer can be assessed by including a small fraction of fluorescent lipid (e.g., Rhodamine-PE or Texas Red-PE) as a fiduciary marker to visualize bilayer uniformity and fluidity (revealed by FRAP).
Troubleshooting
Problem 1: No supported lipid bilayer was formed, as evidenced by the absence of fluidity in the membrane-bound fluorescent His8-pLAT-Cy3B.
Possible causes: Insufficient cleaning of imaging plate wells or poor-quality SUVs.
Solutions: 1) Replace with a new Hellmanex III if the bottle has been open for more than 6 months. 2) Order fresh lipids and prepare a new batch of SUVs if the current stocks are old. 3) Change a new imaging plate. 4) Clean the imaging plate with 20% H2SO4 as an alternative to 5 M NaOH.
Problem 2: No LAT condensate formation after adding Grb2 and Sos1.
Possible causes: Lipid bilayer mobility is low, or proteins have lost activity due to degradation.
Solutions: First, extend the incubation time to 1–3 h. If no condensates form after longer incubation, purify fresh proteins, particularly Sos1.
Acknowledgments
Conceptualization, L.Z.; Investigation, L.Z.; Writing—Original Draft, L.Z.; Writing—Review & Editing, X.S.; Funding acquisition, X.S. and L.Z.; Supervision, X.S. X.S. was supported by an American Cancer Society Research Scholar Grant 135926, the Rally Foundation A Collaborative Pediatric Cancer Research Awards Program 22YIC53, the NIGMS MIRA program R35 GM138299, the Gabrielle’s Angel Foundation Medical Research Award, the Pershing Square Sohn Prize for Young Investigators in Cancer research, the NCI Exploratory/Developmental Research Grant R21 CA286364, the NIH Exploratory/Developmental Bioengineering Research Grants (EBRG) R21 CA294038, the Human Frontier Science Program Early-Career Research Grant RGY0088/2021, and the NIH Director’s Transformative Research Award EB037112. L.Z. was supported by the CRI-Irvington Postdoctoral Fellowship (CRI3516).
This protocol is derived from the original research paper [10].
Competing interests
The authors declare no conflicts of interest.
Ethical considerations
No human and/or animal subjects require ethical considerations in this protocol.
References
- Su, X., Ditlev, J. A., Hui, E., Xing, W., Banjade, S., Okrut, J., King, D. S., Taunton, J., Rosen, M. K. and Vale, R. D. (2016). Phase separation of signaling molecules promotes T cell receptor signal transduction. Science. 352(6285): 595–599. https://doi.org/10.1126/science.aad9964
- Shelby, S. A., Castello-Serrano, I., Wisser, K. C., Levental, I. and Veatch, S. L. (2023). Membrane phase separation drives responsive assembly of receptor signaling domains. Nat Chem Biol. 19(6): 750–758. https://doi.org/10.1038/s41589-023-01268-8
- Lin, C. W., Nocka, L. M., Stinger, B. L., DeGrandchamp, J. B., Lew, L. J. N., Alvarez, S., Phan, H. T., Kondo, Y., Kuriyan, J. and Groves, J. T. (2022). A two-component protein condensate of the EGFR cytoplasmic tail and Grb2 regulates Ras activation by SOS at the membrane. Proc Natl Acad Sci USA. 119(19): e2122531119. https://doi.org/10.1073/pnas.2122531119
- Xiao, Q., McAtee, C. K. and Su, X. (2021). Phase separation in immune signalling. Nat Rev Immunol. https://doi.org/10.1038/s41577-021-00572-5
- Zheng, L. W., Liu, C. C. and Yu, K. D. (2023). Phase separations in oncogenesis, tumor progressions and metastasis: a glance from hallmarks of cancer. J Hematol Oncol. 16(1): 123. https://doi.org/10.1186/s13045-023-01522-5
- Zhu, G., Xie, J., Kong, W., Xie, J., Li, Y., Du, L., Zheng, Q., Sun, L., Guan, M., Li, H., et al. (2020). Phase Separation of Disease-Associated SHP2 Mutants Underlies MAPK Hyperactivation. Cell. 183(2): 490-502.e418. https://doi.org/10.1016/j.cell.2020.09.002
- Xie, J., He, H., Kong, W., Li, Z., Gao, Z., Xie, D., Sun, L., Fan, X., Jiang, X., Zheng, Q., et al. (2022). Targeting androgen receptor phase separation to overcome antiandrogen resistance. Nat Chem Biol. 18(12): 1341–1350. https://doi.org/10.1038/s41589-022-01151-y
- Zeng, L., Palaia, I., Šarić, A. and Su, X. (2021). PLCγ1 promotes phase separation of T cell signaling components. J Cell Biol. 220(6): e202009154. https://doi.org/10.1083/jcb.202009154
- Zeng, L. and Su, X. (2023). Biomolecular Condensation of SH2 Domain-Containing Proteins on Membranes. Methods Mol Biol. 2705: 371–379. https://doi.org/10.1007/978-1-0716-3393-9_20
- Zeng, L., Zhang, X., Xiong, Y., Sato, K., Hajicek, N., Kogure, Y., Kataoka, K., Ogawa, S., Sondek, J. and Su, X. (2025). Hyperactive PLCG1 induces cell-autonomous and bystander T cell activation and drug resistance. EMBO Rep. 26(18): 4563–4586. https://doi.org/10.1038/s44319-025-00546-x
- Hajicek, N., Keith, N. C., Siraliev-Perez, E., Temple, B. R., Huang, W., Zhang, Q., Harden, T. K. and Sondek, J. (2019). Structural basis for the activation of PLC-γ isozymes by phosphorylation and cancer-associated mutations. eLife. 8: 51700. https://doi.org/10.7554/elife.51700
- Libby, K. A. and Su, X. (2020). Imaging Chimeric Antigen Receptor (CAR) Activation. Methods Mol Biol. 2111: 153–160. https://doi.org/10.1007/978-1-0716-0266-9_13
- Banjade, S. and Rosen, M. K. (2014). Phase transitions of multivalent proteins can promote clustering of membrane receptors. eLife. 3: e04123. https://doi.org/10.7554/elife.04123
- Jain, A. and Vale, R. D. (2017). RNA phase transitions in repeat expansion disorders. Nature. 546(7657): 243–247. https://doi.org/10.1038/nature22386
- Zhang, Y., Yang, M., Duncan, S., Yang, X., Abdelhamid, M. A. S., Huang, L., Zhang, H., Benfey, P. N., Waller, Z. A. E. and Ding, Y. (2019). G-quadruplex structures trigger RNA phase separation. Nucleic Acids Res. 47(22): 11746–11754. https://doi.org/10.1093/nar/gkz978
Article Information
Publication history
Received: Nov 19, 2025
Accepted: Dec 28, 2025
Available online: Jan 13, 2026
Published: Feb 5, 2026
Copyright
© 2026 The Author(s); This is an open access article under the CC BY-NC license (https://creativecommons.org/licenses/by-nc/4.0/).
How to cite
Zeng, L. and Su, X. (2026). Biochemical Reconstitution and FRAP Analysis of Membrane-Associated Condensates on Supported Lipid Bilayers. Bio-protocol 16(3): e5592. DOI: 10.21769/BioProtoc.5592.
Category
Biochemistry > Protein > Self-assembly
Biophysics > Bioengineering > Medical biomaterials
Cell Biology > Cell imaging > Live-cell imaging
Do you have any questions about this protocol?
Post your question to gather feedback from the community. We will also invite the authors of this article to respond.