- Protocols

- Articles and Issues
- For Authors
- About
- Become a Reviewer

Using combined fluorescent in situ hybridization with Immunohistochemistry to co-localize mRNA in diverse neuronal cell types
Published: Vol 16, Iss 9, May 5, 2026 DOI: 10.21769/BioProtoc.5591 Views: 65
Reviewed by: Sanjay Kumar KureelAnonymous reviewer(s)
Original research article
The authors used this protocol in:
Oct 2013

Protocol Collections
Comprehensive collections of detailed, peer-reviewed protocols focusing on specific topics


Abstract
Understanding gene expression within defined neuronal populations is essential for dissecting the cellular and molecular diversity of the brain. mRNA assays provide a direct readout of gene expression, capturing transcriptional changes that may precede or occur independently of protein abundance, whereas protein assays reflect the cumulative effects of translation, modification, and degradation. Moreover, in histological analysis, immunohistochemical protein detection results in visually diffuse labeling, which makes it difficult to quantitatively assess levels and locations of expression at high resolution. Here, we present a protocol that allows for mRNA detection in single neuronal cell types with a high degree of sensitivity and anatomical resolution. This protocol combines fluorescent in situ hybridization (FISH) with immunohistochemistry (IHC) on the same tissue section. Briefly, FISH is carried out by ACDBio RNAscope® fluorescent in situ hybridization technology, which involves processing the tissue sections, followed by signal amplification. This involves target retrieval, probe hybridization, and signal enhancement. Then, the tissue section is processed for IHC, which involves blocking nonspecific sites and incubation with primary antibodies, followed by development of a fluorescent signal with secondary antibodies. Typically, visual mRNA detection with FISH can be seen as individual puncta, whereas targeting the protein with an antibody results in filled cells or processes. The variation in staining pattern allows for the quantification of distinct mRNA transcripts within different neuronal populations, which renders co-localization analyses easy and efficient.
Key features
• This protocol combines ACDBio RNAscopeTM technology with standard immunohistochemistry techniques.
• Visual simultaneous detection of mRNA and protein expression within murine brain tissue to identify mRNA transcripts within specific neuronal subpopulations.
• Using a custom macro code for FIJI/ImageJ for an efficient analysis of total mRNA expression or mRNA co-localization with neuronal subtypes.
• This protocol can be used to detect any mRNA and protein combination given appropriate antigen retrieval and tissue preparation within any tissue type of interest.
Keywords: mRNAGraphical overview
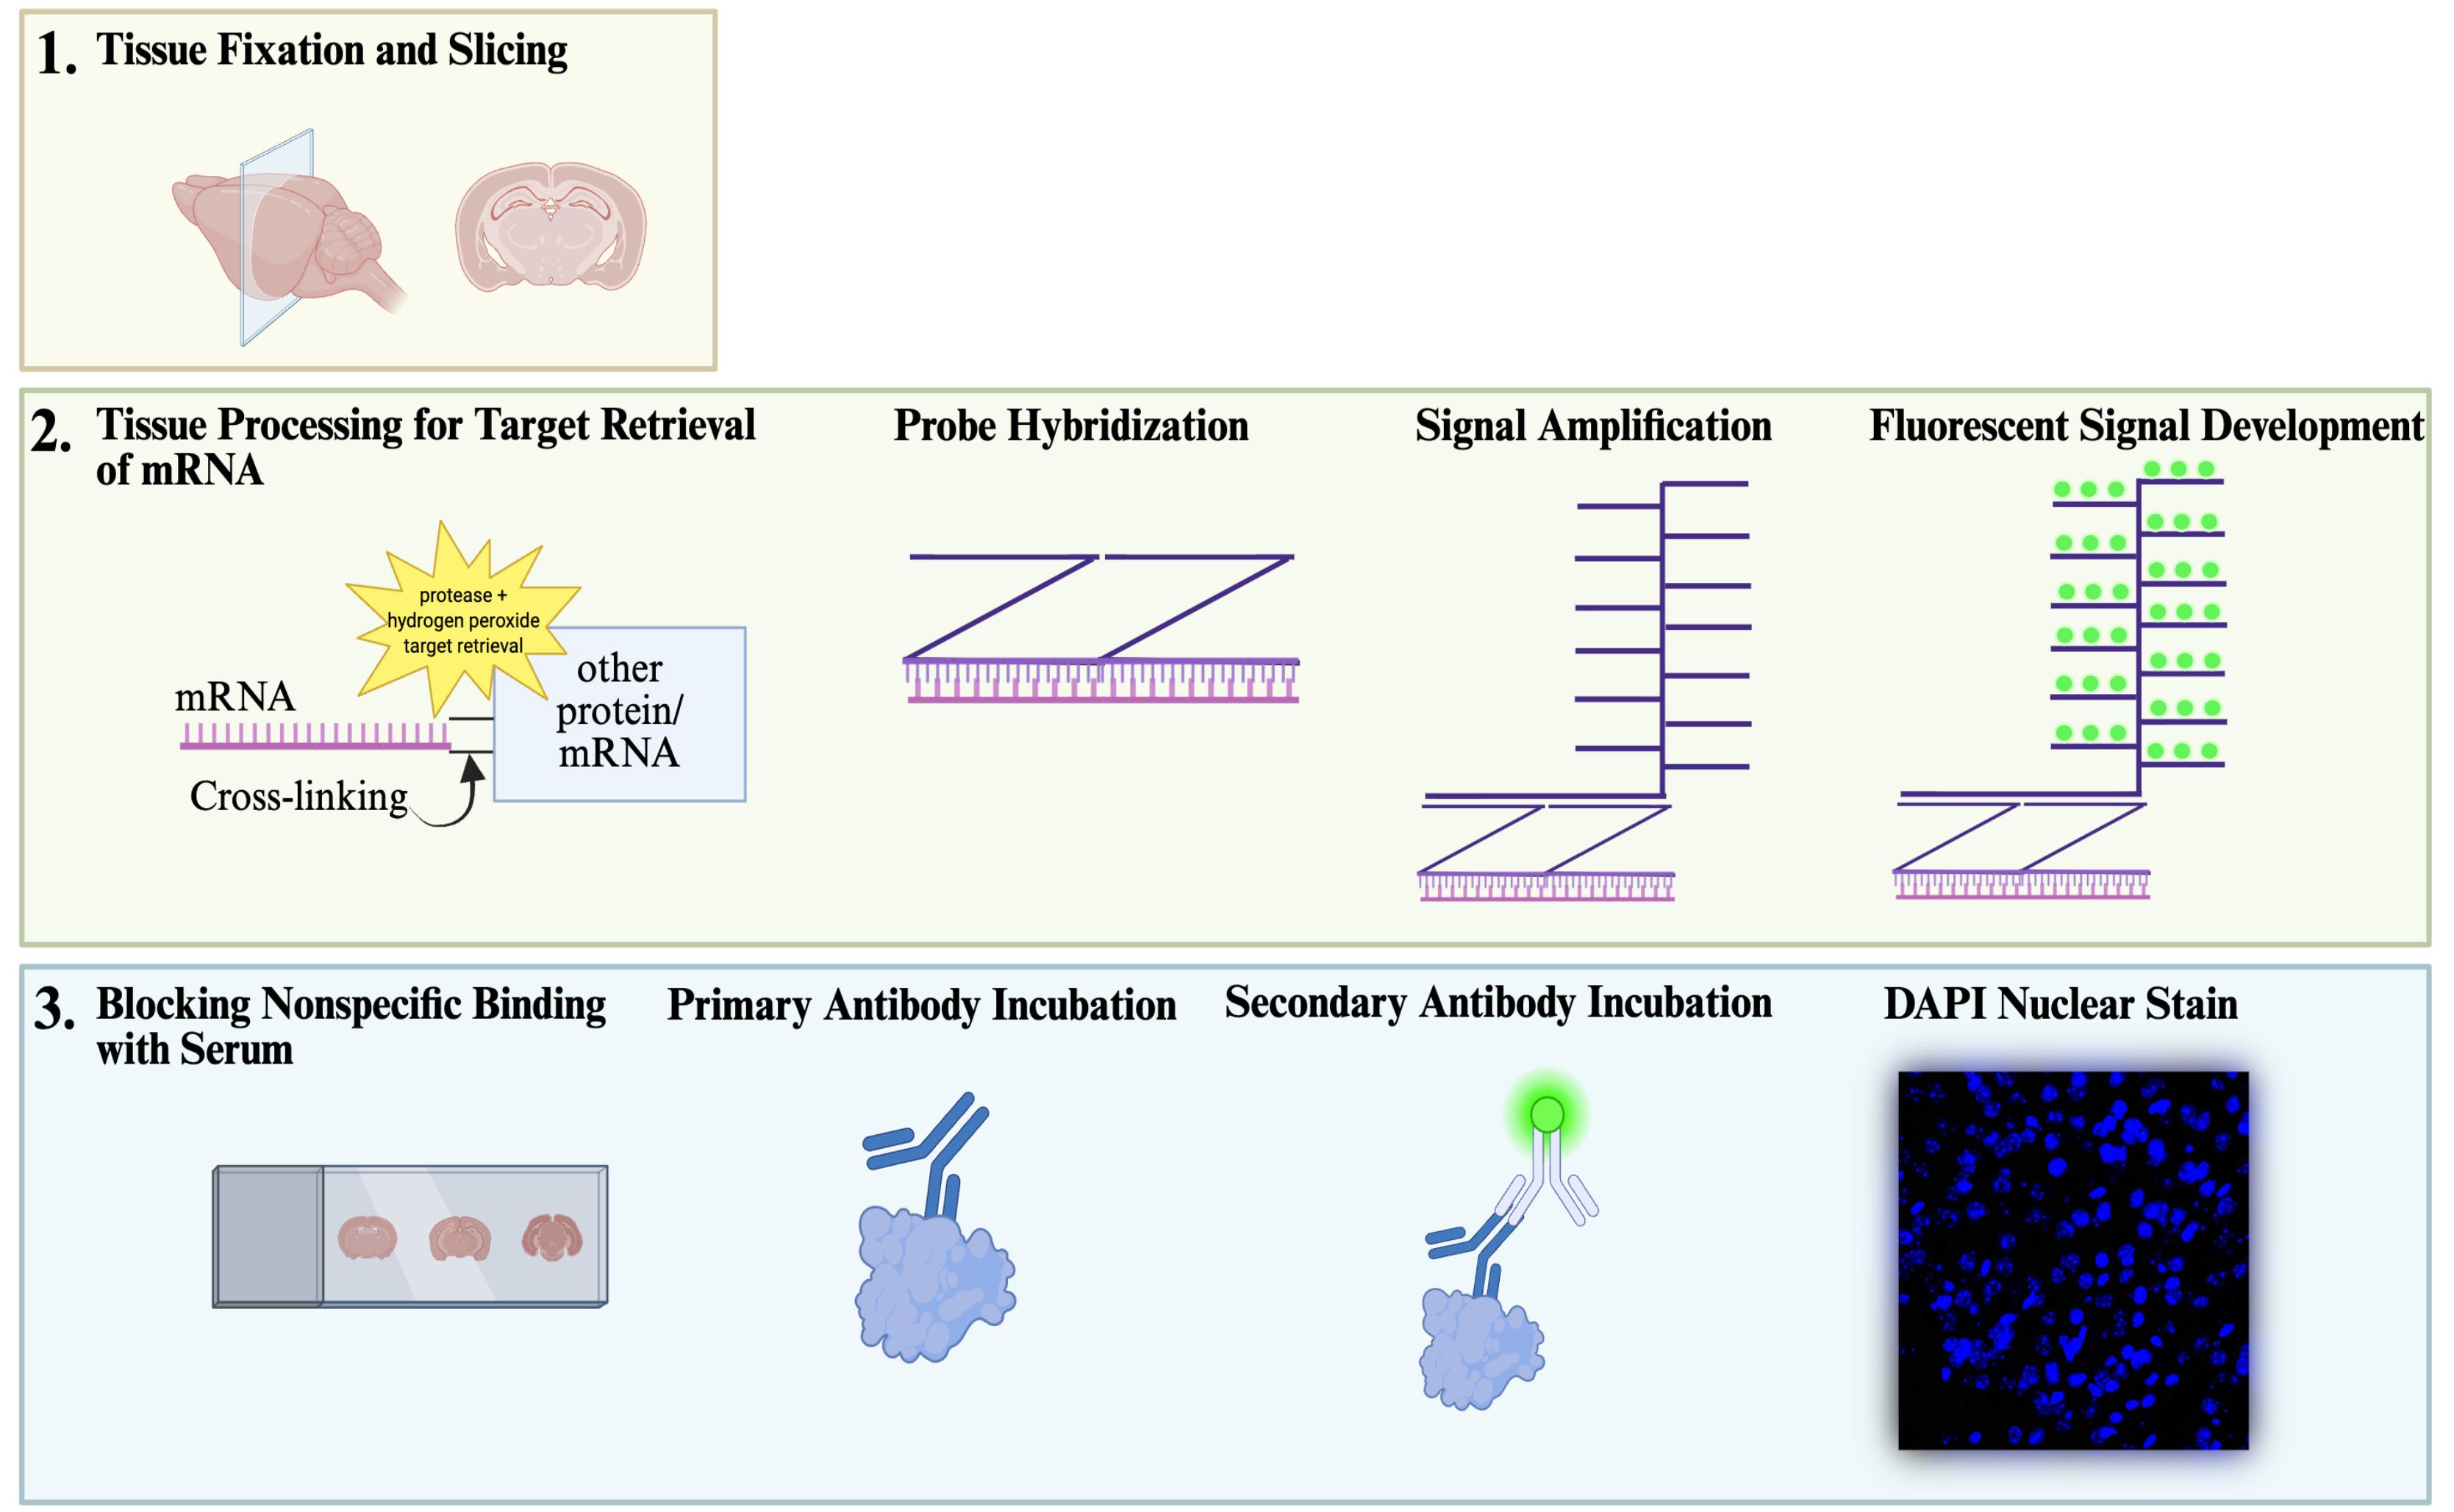
Overview of sequential in situ hybridization and immunohistochemistry (IHC) workflow. The workflow for sequential fluorescent in situ hybridization (FISH) with IHC staining begins with adequate fixation and slicing of tissue (1), followed by a procedure developed with ACD Bio’s RNAscopeTM technology (2), and ends with a standard IHC protocol performed on the same tissue (3). Finally, slides are imaged and quantified for co-localization of mRNA within the cell population of interest (not shown).
Background
In situ hybridization (ISH) is a technique utilized in histological analyses that involves using antisense nucleic acid probes containing complementary bases to the target mRNA for the detection of mRNA transcripts [1]. Historically, ISH has utilized radioactive probes (using sulfur 35 as a radioisotope) to target mRNA molecules within a cell population in tissue sections [2]. Non-radioactive methods were also developed by utilizing digoxigenin RNA probes [3]. However, these methods, while allowing for the detection of a single species of mRNA, are not suited to simultaneously visualize protein and RNA species in individual cells. More recently, fluorescent probes were developed to allow for the analysis of multiple mRNA species using a distinct fluorophore. This technique is similar to immunohistochemistry (IHC), which involves the utilization of antibodies that recognize specific epitopes on proteins, thus allowing for the detection and visualization of these proteins within a certain cell [4]. Both techniques have their limitations and advantages. ISH allows for temporal and spatial analysis of gene transcription within a given cell and can be visualized as individual puncta, although more advanced methods exist that can provide comprehensive information about mRNA translation within a given cell population or tissue (RNA sequencing). IHC is a common, robust method to visualize proteins, reflecting the cumulative results of translation. Although there is no temporal resolution, it is a useful method for analyzing cell quantities, cell morphology, and cell subtype identification within tissues. However, IHC analysis can be subjective and difficult to replicate. When utilizing ISH and IHC together, it allows for simultaneous measurements of transcription and translation, allowing for the identification of the same or different markers. In addition, the visual properties of each method complement each other, such that IHC immunoreactivity results in diffuse labeling throughout the cell or cell processes in the case of a neuron, while ISH labeling results in puncta-like positivity. The combination of ISH and IHC allows for straightforward co-localization of mRNA transcripts within a cell subtype. This is particularly important because neurons can be identified and classified based on their protein expression.
Within the central nervous system (CNS), there is a large diversity of neuronal subtypes, including excitatory and inhibitory interneurons, specialized neurons containing neuropeptides, and non-neuronal cells such as astrocytes, microglia, and oligodendrocytes. While region-level analyses provide valuable information about overall gene expression, deeper insight can be gained by studying changes at the level of specific neuronal subtypes due to diseases or CNS activity. This is particularly important as transcript distribution can differ dramatically between neighboring cells and drive unique physiological roles [5]. Since each subtype contributes in distinct ways to network dynamics, analyzing cell type–specific processes provides a more accurate link between molecular regulation, circuit activity, and, ultimately, behavior, yielding a clearer understanding of the target under study. Neuronal subtypes can be easily identified by proteins that are uniquely expressed in the subpopulation. For example, tyrosine hydroxylase can be used to label neurons that produce catecholamines (i.e., dopamine and norepinephrine) because it is an enzyme involved in the synthesis of these neurotransmitters. Additional neurotransmitters can be detected by other unique proteins. Examples include parvalbumin, which is expressed in GABAergic interneurons, tryptophan hydroxylase, which denotes serotonergic neurons, and vesicular glutamate transporter, which is highly expressed in glutamate neurons.
The protocol detailed below has been optimized to detect and quantify GPR75 mRNA within the mouse brain. GPR75 is an orphan G-protein-coupled receptor (Gαq subtype), highly expressed within the brain as compared to the periphery [6]. Recent works have suggested GPR75 to have a large role in the regulation of metabolism [7]. This protocol was developed to further the understanding of GPR75 expression patterns in an effort to elucidate the function of this orphan receptor. This was achieved by combining ISH and IHC to co-localize GPR75 mRNA within different neuronal subtypes using several key neuronal markers. The examples provided within this protocol are not representative of all neuronal subtypes; see Table 1 for more examples of antibodies that can be used with IHC to detect different neuronal subtypes, as well as other brain cell types, such as microglia and astrocytes.
This method of combining ISH with IHC within the same tissue is not uncommon in the field of neuroscience. Moreover, many researchers may use this system to analyze the localization of mRNA differences with protein expression of the same marker [8]. Research using this method has been published [9–11]. However, there is no clear protocol outlining the steps involved for analysis and preparation. Such a protocol, if similarly utilized by researchers, will provide a better avenue to share discoveries.
Materials and reagents
Biological materials
1. Microtome or cryostat frozen brain sections, slide-mounted (Figure 1A)
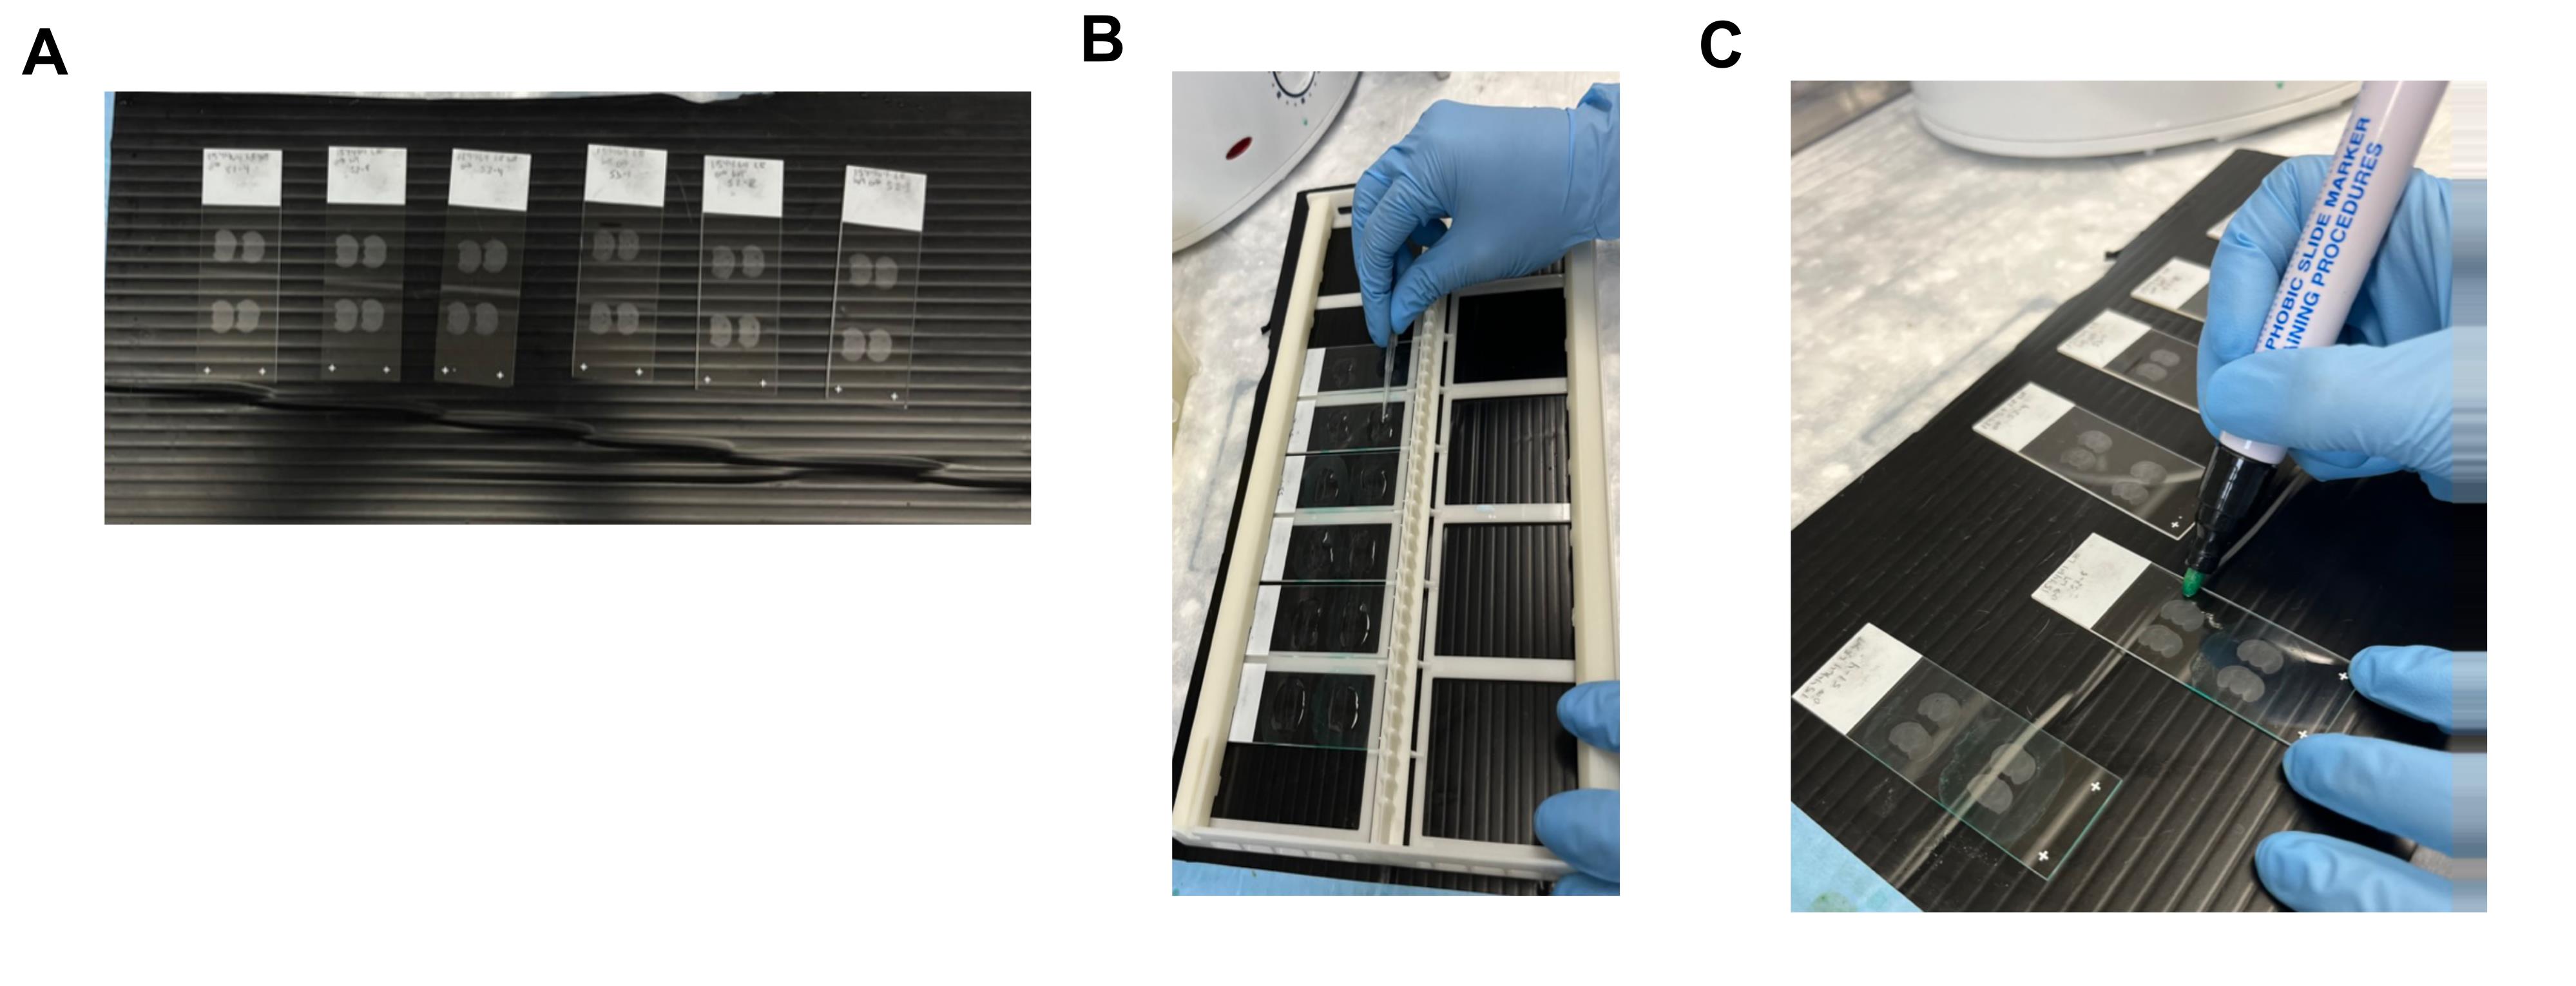
Figure 1. Technical considerations for slide preparation and tissue pretreatment. (A) Example of how the tissue can be organized onto individual slides after slicing on the cryostat or microtome. This is also an example of when the slides need to be laid down flat; it is helpful to have a dark material to contrast the tissue for easier visualization. (B) Visual representation of the technique used to spread the solution over the tissue on the slide with the flat side of a pipette tip. This must be done carefully without touching the tissue under the solution. (C) Visual representation of tissue outlining with the wax pen. The outline must be close enough to the tissue to ensure proper coverage with small volumes, while also maintaining an adequate distance from the tissue to avoid wax contamination, which will weaken the signal.
Reagents
1. 200 proof ethyl alcohol (Warner-Graham Company, catalog number: 64-17-05)
2. RNAscopeTM target probe (Bio-Techne, catalog or made-to-order C1 to C3 probes)
3. RNAscopeTM Multiplex Fluorescent Detection kit v2 (Bio-Techne, catalog number: 323110)
4. RNAscopeTM target retrieval (10×) (Bio-Techne, catalog number: 322001)
5. RNAscopeTM TSA buffer pack (Bio-Techne, catalog number: 322810)
6. RNAscopeTM wash buffer (50×) (Bio-Techne, catalog number: 310058)
7. 20× SSC buffer RNase-free (Invitrogen, catalog number: AM9763)
8. RNAscopeTM H2O2 and protease reagents (Bio-Techne, catalog number: 322381)
9. Opal 520 reagent pack (Akoya Biosciences, catalog number: FP1487001KT)
10. Opal 570 reagent pack (Akoya Biosciences, catalog number: FP1488001KT)
11. Opal 620 reagent pack (Akoya Biosciences, catalog number: FP1495001KT)
12. Bovine serum albumin, heat shock-treated (Fisher Scientific, catalog number: BP1600-100)
13. Triton-X 100 (Sigma-Aldrich, catalog number: 9036-19-5)
14. Primary antibody (depends on the target)
15. Fluorescent secondary Antibody (depends on primary antibody species and fluorescence of choice)
16. Fluoro-Gel (with tris buffer) (Electron Microscopy Services, catalog number: 17985-10)
17. Hydrophobic slide marker (Newcomer Supply, catalog number: NC9827128)
18. Phosphate-buffered saline (PBS), 10× solution (Fisher Scientific, catalog number: BP39920)
19. Paraformaldehyde (PFA), 20% w/v aqueous solution, methanol-free (Thermo Fisher, catalog number: 047340.9M)
Solutions
1. 1× target retrieval solution (see Recipes)
2. 5× SSC buffer (see Recipes)
3. 1× wash buffer (see Recipes)
4. 1× PBS (see Recipes)
5. Blocking/permeabilizing solution (see Recipes)
6. EtOH 50%, 70%, 100% (see Recipes)
7. 4% PFA (see recipes)
Recipes
1. Target retrieval solution
| Reagent | Final concentration | Volume (for 250 mL) |
|---|---|---|
| RNAscopeTM Target retrieval (10×) | 1× | 25 mL |
| Deionized water (diH2O) | n/a | 225 mL |
2. 5× SSC buffer
| Reagent | Final concentration | Volume (for 250 mL) |
|---|---|---|
| 20× SSC buffer | 5× | 62.5 mL |
| diH2O | n/a | 187.5 mL |
3. Wash buffer
| Reagent | Final concentration | Volume (for 1 L) |
|---|---|---|
| RNAscopeTM wash buffer (50×) | 1× | 20 mL |
| diH2O | n/a | 0.98 L |
4. 1× PBS
| Reagent | Final concentration | Volume (for 1 L) |
|---|---|---|
| 10× PBS | 1× | 100 mL |
| diH2O | n/a | 900 mL |
5. Blocking/permeabilizing solution
| Reagent | Final concentration | Volume (for 50 mL) |
|---|---|---|
| Bovine serum albumin | 5% of total volume | 2.50 g |
| Triton-X | 0.1% of total volume | 50 μL |
| 1× PBS | n/a | 50 mL |
6. EtOH 50%, 70%, 100%
| Reagent | Final concentration | Volume (for 250 mL) |
|---|---|---|
| 200 proof ethanol | 50% EtOH | 125 mL EtOH +125 mL diH2O |
| 70% EtOH | 175 mL EtOH + 75 mL diH2O | |
| 100% EtOH | 250 mL EtOH |
7. 4% PFA
| Reagent | Final concentration | Volume (for 50 mL) |
|---|---|---|
| PFA 20% w/v aqueous solution | 4% PFA | 10 mL |
| 1× PBS | 40 mL |
Laboratory supplies
1. Slide staining station dish with lid (Mediscus Health, catalog number: 2935M14)
2. Slide staining plastic dipper with handle (Mediscus Health, catalog number: 2935M6)
3. Slide moisture chamber (Newcomer Supply, catalog number: NC9062083)
4. Superfrost PlusTM microscope slides white tab (Fisherbrand, catalog number: 1255015)
5. Rectangle cover glass No. 1 1/2 (Corning, catalog number: 2940-245)
Equipment
1. Slide warmer (C&A Scientific Company, catalog number: NC14-008)
2. ACD HybEZTM II hybridization system (Bio-Techne, catalog number: 321711)
3. ACD EZ-batch slide system (Bio-techne, catalog number: 310007)
4. Rice cooker/steamer (any)
5. Easy-Read® thermometer (Sigma-Aldrich, catalog number: Z423459)
Software and datasets
1. FIJI/ImageJ (ImageJ2, Version: 2.16.0/1.54p)
2. ImageJ source (https://imagej.net/ij/macros/download.html)
3. All code has been deposited to GitHub: https://github.com/mkb142-art/Image-J-Macro-code-for-analyzing-mRNA-and-IHC-co-localization (accessed 10/06/2025)
Procedure
A. Tissue pretreatment and target retrieval
1. Before starting:
a. Preheat the slide warmer to 60 °C.
b. Turn on the HybEZ oven and set the temperature to 40 °C.
c. Place RNAscopeTM H2O2 and protease reagents (H2O2 and protease plus) at room temperature.
d. Add 25–50 mL of diH2O into the humidity control, place it in the oven, and warm for at least 30 min.
e. Turn on the rice cooker/steamer and fill with diH2O.
2. Remove slides from -20 °C storage and place them in a slide staining dish filled with 1× PBS using the plastic dipper. Rinse by slowly moving the rack up and down 5 times.
3. Dry the slides on the slide warmer at 60 °C for 10 min.
4. Post-fix the tissue on the slides by dropping 200 μL of 4% PFA on each tissue section. Place slides at 4 °C for 15 min. After incubation, place slides back into the slide rack and rinse with 1× PBS as described in step A2.
Caution: PFA is a toxic chemical and requires careful handling. Any handling of PFA should be performed in a fume hood.
5. Heat up the target retrieval solution by filling the staining dish with 250 mL of target retrieval solution, covering with the lid, and placing it into the rice cooker.
Caution: The rice cooker/steamer can be very hot. Use heat protection gloves to avoid burning when placing and removing containers from the pot.
6. Dehydrate the tissue with EtOH by transferring the slide rack into 250 mL of 50% EtOH, 70% EtOH, and 100% EtOH for 5 min each (15 min total). After the last incubation, remove the rack from the slide staining dish and air dry for 5 min.
7. Place the slides flat on the bench and add RNAscopeTM hydrogen peroxide dropwise to each tissue section. Each section should require between 1 and 2 drops. If necessary, use the long edge of a pipette tip to carefully spread the solution over the tissue to ensure full coverage (refer to Figure 1B for visual reference). Incubate for 10 min at room temperature.
8. Place the slides in the plastic dipper and rinse in room-temperature diH2O in the slide staining dish by slowly moving the rack up and down 5 times.
9. Ensure that the target retrieval solution has heated to 100 °C by measuring the temperature of the solution within the rice cooker with a thermometer.
10. Once the target retrieval solution is at 100 °C, transfer the slides from the diH2O to the target retrieval within the rice cooker and incubate for 10 min.
11. Keep slides in the plastic dipper and dip slides in room-temperature diH2O. Rinse by moving the rack up and down 5 times.
12. Transfer the plastic dipper with the slides to fresh 100% EtOH and wash by moving the rack up and down 5 times.
13. Remove the slides from the plastic dipper and place them on a slide warmer to dry at 45 °C for up to 5 min.
14. Outline the tissue with a small square or circle using a hydrophobic slide marker such that the wax does not touch the tissue but maintains a small enough area for solutions to fill the circle or square (refer to Figure 1C for visual reference). Let the wax dry at room temperature for 1 min before continuing.
15. Place slides into the EZ-Batch slide holder and apply RNAscopeTM protease plus dropwise onto each section. If necessary, use the long edge of a pipette tip to carefully spread the solution over the tissue to ensure full coverage. Once the wax pen has been applied to the slide, some light shaking of the EZ batch slide holder can help in spreading solutions over the tissue. Place the slide holder into the EZ batch tray, close with a lid, and place it into the HybEZ oven. Incubate at 40 °C for 30 min. During incubation, refer to Section B for important probe dilution and heating steps. For video instructions on how to use the ACD EZ-BatchTM slide processing system, please visit https://acdbio.com/ez-batch-system.
16. After incubation, wash slides by filling up the EZ washing tray with diH2O and rinse by slowly tilting the tray back and forth 10 times.
B. Probe hybridization
1. Place probes in the HybEZ oven for 15–20 min before use and dilution (if necessary).
Note: C1 probes can be applied as is; C2/C3 probes must be diluted 1:50 in the appropriate dilution buffer.
2. Add probe dropwise to each section.
3. Incubate slides in HybEZ oven at 40 °C for 2 h.
4. Rinse slides with 1× wash buffer in EZ wash tray, slowly tilting back and forth 10 times.
5. Remove slides from the ACD EZ-BatchTM slide holder, place in plastic dipper, and leave in slide staining dish with 5× SSC buffer overnight at room temperature.
C. Amplification
1. Remove AMP1, AMP2, AMP3, HRP-C1, and HRP blocker from the RNAscopeTM Multiplex Fluorescent Detection kit v2 and place them at room temperature.
Note: If the probe is with the C2 or C3 channel, use the appropriate HRP.
2. Remove slides from the plastic dipper and place in the ACD EZ-BatchTM slide holder. Wash slides with 1× wash buffer in the EZ wash tray by slowly tilting back and forth 10 times.
3. All subsequent incubations occur at 40 °C in the HybEZ oven, and washes are done in the same manner as in step C2. Use fresh 1× wash buffer for each wash step.
4. Incubate slides with AMP1 for 30 min; use one drop per section.
5. Wash with 1× wash buffer.
6. Incubate slides with AMP2 for 30 min; use one drop per section.
7. Wash with 1× wash buffer.
8. Incubate slides with AMP3 for 30 min; use one drop per section.
9. Wash with 1× wash buffer.
10. Incubate slides with HRP-C1/C2/C3 (depending on which channel the probe is in) for 15 min.
11. Wash with 1× wash buffer.
12. Incubate slides with opal dye for 30 min.
Note: Dilute opal dyes 1:750 in TSA buffer.
13. Wash with 1× wash buffer.
14. Incubate slides with HRP blocker for 15 min.
15. Wash with 1× wash buffer.
16. Remove slides and place in the plastic slide dipper within the slide staining dish with 1× PBS for immunohistochemistry.
D. Immunohistochemistry
1. Once slides are rinsed with 1× PBS, fill the slide moisture chamber with water in the appropriate location and place slides inside the chamber.
2. Drop 200 μL (or enough to fill the space within the wax pen boundaries) of blocking and permeabilization solution (see Recipe 5) onto the tissue, and incubate with slow shaking at room temperature for 1 h.
3. Dilute the primary antibody in
and permeabilization solution.
4. Invert the slides to remove blocking and permeabilization solution and add 200 μL (or enough to fill the space within the wax pen boundaries) of the primary antibody. Incubate slides within the slide moisture chamber with slow shaking at 4 °C overnight.
5. Rinse slides with 1× PBS by placing slides in the plastic dipper and dipping the slides 10 times in the slide staining dish.
6. Dilute the secondary antibody in low light conditions in the blocking and permeabilization solution. Ensure that slides are kept in low light conditions from this point forward.
7. Add the secondary antibody to the slides and incubate with slow shaking at room temperature for 1 h.
8. Rinse slides with fresh 1× PBS by placing the slides in the plastic dipper and dipping the slides 10 times in the slide staining dish.
9. Add DAPI (from the RNAscopeTM Multiplex Fluorescent Detection kit v2) dropwise to tissue sections, incubate for 30 s, and then invert the slides to remove excess liquid.
10. Coverslip the slides by adding two drops of Fluoro-Gel mounting media, one to the top of the slide and one on the bottom, and cover with the rectangle cover glass.
11. Place stained and covered slides horizontally in a slide folder and store at 4 °C.
12. Image the slides at least 12 h after staining to allow for mounting media to dry.
E. Imaging guidelines
1. Use a high-magnification laser-scanning confocal microscope (e.g., Leica SP8 or equivalent).
2. Prefer oil- or water-immersion objectives with high numerical aperture (e.g., 40×–63×) for best resolution of punctate mRNA. For targets where mRNA appears as discrete puncta rather than diffuse labeling, high magnification is particularly important for accurate visualization.
3. Minimize background fluorescence during acquisition.
4. Collect images as a z-stack. Step size and total number of optical sections will vary depending on tissue thickness and cell size. Define the z-stack start and end to encompass the full thickness of the labeled cells/tissue.
5. Select appropriate excitation and emission filter settings based on the fluorophores used in each experiment.
6. Save image files with all channels retained within a single file format to ensure compatibility with the downstream analysis macro.
7. To provide adequate sampling, obtain 3–5 representative fields of view per section, depending on the size and distribution of the region of interest.
8. Save raw data as a single multi-channel file that preserves metadata (e.g., .tiff).
F. Code
A custom macro was written in the ImageJ Macro language (.ijm) to quantify mRNA puncta from FISH as well as measure the area covered by IHC immunofluorescence in the same image and file. This macro was written to be compatible with raw z-stack images that have three total channels combined: IHC stain, FISH, and DAPI. The code can be adjusted to account for any deviations from this format.
Note: Open Threshold window before running the macro and set to Otsu Threshold → Image → Adjust → Threshold…
An example of what this window looks like can be found in Figure 2.

Figure 2. ImageJ/FIJI threshold suggestions, ensuring full coverage of positivity. One key step during the analysis with the macro code is to manually set a threshold for areas of positivity. This allows the program to binarize the image to include only areas of true positivity for downstream particle analysis. (A) An example of incompletely setting the Otsu Threshold on the immunohistochemistry (IHC) image. (B) An example of incompletely setting the Otsu Threshold on the puncta/mRNA image. (C) An example of sufficient coverage for Otsu Threshold setting on an IHC image. (D) An example of sufficient coverage for Otsu Threshold setting on a puncta/mRNA image.
Note: Ensure all ROIs are deleted in the ROI manager before continuing to the next image. A guided explanation of how to process the data generated by this code will be in the Data analysis section below.
waitForUser(“Click image, then press OK”);rename(“unstacked”)run(“Z Project…”, “projection=[Max Intensity]”);rename(“Z stack”)close(“unstacked”)selectImage(“Z stack”);run(“Split Channels”);waitForUser(“Click image with puncta”);rename(“puncta”)waitForUser(“click IHC image”);rename(“IHC image”);close(“Z stack (blue)”)selectImage(“IHC image”);run(“Gaussian Blur…”, “sigma=2”);setAutoThreshold(“Default dark no-reset”);//run(“Threshold…”);waitForUser(“set the threshold and make sure all areas of true positivity are are highlighted red”)setOption(“BlackBackground”, true);run(“Convert to Mask”);run(“Analyze Particles…”, “summarize add”);run(“ROI Manager…”);run(“Merge Channels…”, “c1=[IHC image] c2=[puncta] create”);close(“Results”)roiManager(“Show All”);waitForUser(“select all ROI’s and press OK”);roiManager(“Measure”);roiManager(“Combine”);run(“Clear Outside”);run(“Split Channels”);selectImage(“C1-Composite”);rename(“processed IHC image”)close(“processed IHC image”);selectImage(“C2-Composite”);rename(“puncta”)run(“8-bit”);setAutoThreshold(“Otsu dark no-reset”);//run(“Threshold…”);waitForUser(“set the threshold and make sure all puncta are highlighted red”);setOption(“BlackBackground”, true);run(“Convert to Mask”);run(“Analyze Particles…”, “display summarize”);Data analysis
A. Analysis of total puncta and co-localized puncta
1. Total puncta analysis in ImageJ/Fiji within one image: Image → Adjust → Threshold… → Analyze → Analyze Particles…, check box: summarize.
After the last step of Analyze Particles, a Summary window will appear with a summary of measured features from the image. The two important results for this analysis are count and total area. To report the total number of puncta in an image, count should be the reported value if the mRNA appears purely punctate from the FISH (Figure 3 serves as an example). However, if the mRNA appears more diffuse, or a mix of punctate and diffuse, report total area. It is important to be consistent with reporting these values. All results from each image in an experiment must be reported by count or total area, and not a mix of both.
Note: Threshold must be set manually. Ensure full coverage of positive puncta (Figure 2D).
Caution: Images must be in grayscale for the Threshold function: Image → type → 8-bit.

Figure 3. Dual fluorescent in situ hybridization (FISH)–immunohistochemistry (IHC) to identify GPR75 mRNA expression within different neuronal populations in the brain. (A) GPR75 mRNA detection with FISH is co-localized with tyrosine hydroxylase (TH) expressing neurons in the locus coeruleus. Images were obtained with an SP8 confocal microscope at 40× oil immersion. GPR75 mRNA is visualized with the Opal 570 fluorescent dye (green); IHC for TH protein is visualized with AF594 secondary antibody (red); DAPI staining detects nuclei (blue); merged image of FISH-IHC and DAPI shows the localization of GPR75 mRNA in reference to TH protein expression within the LC. (B) GPR75 mRNA detection with FISH is co-localized with glutamine synthetase (GS) expressing neurons in the cerebellum. The panels correspond to the same as in A; however, IHC was used to detect GS within the cerebellum. In the “Merge” panel, dense GPR75 mRNA expression can be seen within this area of the CB, but is not localized strictly to GS-expressing neurons in the CB. Scale bar for 40× images = 75 μm. Scale bar for cropped images = 20 μm.
2. Co-localized puncta (puncta count within IHC positive area): Use the macro code above. This macro code contains two rounds of particle analysis, one for the IHC stain and one for the FISH puncta within the IHC stain. After the macro finishes running, the Summary window will contain results for the Analyze Particles function for IHC image and Puncta. Results of co-localized puncta should be reported as a ratio of count from puncta and total area from IHC image. Similar to the instructions above, if the puncta do not appear punctate and more diffuse, use total area instead of count for the puncta line.
B. Considerations for experimental design
1. Minimum number of animals (biological replicates) should be 3 per condition.
2. Three to five images should be acquired per brain region of interest per animal.
Validation of protocol
Detection of GPR75 within different neuronal populations
This protocol was developed and optimized to analyze the expression of GPR75, a G-protein-coupled receptor, in the CNS, and most importantly, its expression pattern within different brain regions as well as different neuronal subtypes. Figure 3 depicts two examples in which GPR75 mRNA expression can be visualized as diffuse puncta in the pons and cerebellum (Figures 3A and B, green panels, respectively). In the pons, GPR75 puncta were detected within tyrosine hydroxylase (TH) positive neurons, denoting noradrenergic producing neurons of the locus coeruleus (Figure 3A, red and “merge” panels). In the cerebellum, GPR75 puncta are seen in neurons expressing glutamine synthetase (GS), denoting glutamatergic neurons (Figure 3B, red and “merge” panels). Dense GPR75 puncta in the cerebellum (Figure 3B, green panel) do not correlate with the glutamatergic neurons in this area, suggesting that only a subset of these neurons express GPR75mRNA.
mRNA visualization with FISH can look diffuse, punctuated, or a mixture of both
The physical spread of mRNA expression can vary depending on the amount of expression and cell type. Figure 4 shows two other examples of mRNA detection. For example, mRNA for neuropeptide Y (NPY) looks both punctate and diffuse within a singular cell (Figure 4A). This can make analysis a little more challenging; however, when paired with an IHC antibody that results in the cell being filled, co-localization can persist by comparing the area covered as opposed to the puncta count. Conversely, some mRNAs are highly expressed within unique cell populations, such as with proopiomelanocortin (POMC) neurons within the hypothalamus (Figure 4B). Here, the POMC mRNA is expressed in high amounts within the bounds of the cell body, indicating high amounts of transcription, resulting in a fluorescent signal that fills the cell. This will not allow for the quantification of individual transcripts; however, analysis can proceed by measuring the area covered instead. Refer to the Data analysis section above for further clarification.

Figure 4. Example of diffuse mRNA staining but no immunohistochemistry (IHC), for analysis purposes. (A) Image taken on the SP8 confocal microscope at 40× showing neuropeptide Y (NPY) (opal 620 dye, red), showing dispersed mRNA expression within cells of the hypothalamus. (B) Fluorescent image at 40× of proopiomelanocortin (POMC) (opal 520 dye, green) mRNA expression within a specific cell population of the arcuate nucleus of the hypothalamus. Scale bar = 7 μm.
This protocol (or parts of it) has been used and validated in the following research articles:
• Agbey et al. [11]. Expression of HIV Envelope protein in the human central nervous system. AIDS
This protocol was performed on human brain tissue to detect the HIV envelope protein, gp120, using FISH, combined with IHC for Iba-1 (microglia marker) and GFAP (astrocytic marker) to confirm expression of gp120 within astrocytes in the post-mortem HIV+ human brain. Refer to Figures 2 and 3.
• Speidell et al. [10]. Mice Deficient for G-protein-coupled receptor 75 display altered presynaptic structural protein expression and disrupted fear conditioning recall. Journal of Neurochemistry
General notes and troubleshooting
General notes
1. This protocol has been optimized for rodent brain tissue. It can be generalized to other tissues; however, fixation and target retrieval times may differ.
2. Tissue pretreatment is specific for fixed frozen tissue. If the sample is sectioned and mounted from paraffin-embedded tissue, please visit this website and contact ACD Bio for alternatives: https://www.bio-techne.com/resources/protocols-troubleshooting/rnascope-ish-troubleshooting#key-guidelines.
3. This protocol involves immersing the slides in solutions using the slide holder. Other steps will involve dropping the solution onto the slide itself using smaller volumes. Please take note of when each should be used to minimize the misuse of solution quantities.
4. It is recommended to use tissue sectioned between 5 and 18 μm.
5. Brain tissue can be sectioned based upon the scope of the analysis (e.g., coronal, sagittal).
6. For a comprehensive analysis of a brain area, serial sections are recommended because the brain is a heterogeneous structure.
7. This protocol is not compatible with free-floating sections.
8. To control for false positives, it is recommended to use a knockout sample of the mRNA of choice or make sure there are areas or other tissues that do not contain the mRNA of choice.
9. Refer to Table 1 for options of common antibodies used for each type of neuronal subtype to co-localize mRNA with various neuronal subtypes or cell types of the brain.
Table 1. Common antibodies used to identify CNS cells. This table provides common antibodies that are used to detect various cell types within the CNS. These are protein markers that are generally unique to a specific cell population; immunostaining for such markers is a useful method for differentiating neuron subtypes/CNS subtypes from each other for comprehensive neuroanatomical analyses. Each option for a suggested marker is accompanied by information for a commercially available antibody that is compatible with rodent tissue and suitable for IHC.
| Cell type | Antibody | ||
|---|---|---|---|
| Astrocytes | Glial fibrillary acidic protein (GFAP) (Invitrogen, catalog number: 14-9892-82) | Excitatory amino acid transporter 1 (EAAT1) (Abcam, catalog number: ab181036) | Excitatory amino acid transporter 2 (EAAT2) (Thermofisher, catalog number: BS-1751R) |
| Oligodendrocytes | Oligodendrocyte transcription factor 2 (Olig2) (Millipore Sigma, catalog number: AB9610) | Platelet derived growth factor receptor alpha (PDGRFa) (R&D Systems, catalog number: AF1062) | Myelin basic protein (MBP) (Millipore Sigma, catalog number: 3034096517) |
| Microglia | Ionized calcium binding adaptor 1 (IBA1) (Thermofisher, catalog number: PA5-27436) | Cluster of differentiation 68 (CD68) (Thermofisher, catalog number: 14-0681-82) | Cluster of differentiation 40 (CD40) (Thermofisher, catalog number: 14-0401-81) |
| Neuronal markers | Neuronal nuclear protein (NeuN) (Thermofisher, catalog number: PA5-78499) | Microtubule associated protein 2 (MAP2) (Thermofisher, catalog number: PA1-10005) | Synaptophysin (SYP) (Thermofisher, catalog number: MA5-14532) |
| Neuron subtype | |||
| Dopamine | Tyrosine hydroxylase (TH) (Invitrogen, catalog number: MA1-24654) | Dopamine transporter (DAT) (Invitrogen, catalog number: MA5-2479) | LIM homeobox transcription factor 1 beta (LMX1B) (Proteintech, catalog number: 18278-1-AP) |
| Serotonin | Tryptophan hydroxylase (TPH) (Bioss, catalog number: BS-1215R) | Solute carrier family 6, member 4 (Invitrogen, catalog number: 702076) | Serotonin transporter (SERT) (Alomone Labs, catalog number: AMT-004-200UL) |
| Glutamate | Vesicular glucose transporter type 1 (VGLUT1) (Thermofisher, catalog number: 48-2400) | N-methyl-D-aspartate receptor 1 (NMDAR1) (Thermofisher, catalog number: PA3-102) | Glutamine synthetase (GS) (Invitrogen, catalog number: MA5-27749) |
| GABA | GABA transporter 1 (GAT1) (Proteintech, catalog number: 28488-1-AP) | Glutamic acid decarboxylase 65-Kilodalton (GAD65) (Invitrogen, catalog number: PA5-22260) | Parvalbumin (PV) (Invitrogen, catalog number: MA5-35259) |
| Acetylcholine | Choline O-acetyltransferase (ChAT) (Invitrogen, catalog number: PA5-29653) | Acetylcholinesterase (AChE) (Invitrogen, catalog number: MA3-042) | Vesicular acetylcholine transporter (VAChT) (Invitrogen, catalog number: PA5-85782) |
10. Use the correct coverslip thickness (typically #1.5) and an immersion medium that matches the objective (refer to the Laboratory supplies section).
11. Mount slides in an anti-fade medium appropriate for your fluorophores and let slides equilibrate before imaging.
12. RNAscopeTM Multiplex Fluorescent Detection kit v2 is optimized for multiplex detection of mRNA on a single sample. However, it is not optimized for multiplex FISH + IHC. Due to multiple heating steps for multiplex FISH, this runs the risk of tissue overdigestion and issues with epitope availability for IHC. Caution needs to be taken to not overdigest the tissue before the IHC step. Possible solutions include a protease-free workflow (see Problem 2, solution 1 below).
Troubleshooting
Common issues and solutions can be found in this link, but will be summarized below and in [12]: https://www.bio-techne.com/resources/protocols-troubleshooting/rnascope-ish-troubleshooting
Problem 1: Tissue overdigestion or tissue coming off the slide.
Possible causes: Target retrieval incubation is too long, or the tissue is underfixed.
Solutions:
1) Decrease target retrieval and protease incubation times.
a. Protease types, protease incubation, and target retrieval incubation times can be altered to increase or decrease epitope digestion. Available RNAscopeTM protease options include Protease Plus (mild), Protease III (moderate), and Protease IV (strong), which vary in their intensity and are selected based on the sample type and assay.
b. Refer to the following link for more information on protease and target retrieval times for different tissue types, Appendix A: https://www.bio-techne.com/resources/protocols-troubleshooting/ffpe-sample-preparation-pretreatment-rnascope-2.5-assay.
2) Increase post-fix time in 4% PFA to 30 min.
Problem 2: Weak IHC signal.
Possible causes: Low primary antibody concentration or overdigestion of proteins within the tissue.
Solutions:
1) Increase primary antibody concentration.
2) RNAscopeTM protease-free workflow: New ACD Bio technology that allows for mRNA detection without the use of proteases that may digest proteins, leading to an inability for subsequent IHC analysis. More information on the protease-free workflow can be found at https://acdbio.com/PretreatmentOptions and https://acdbio.com/science/applications/research-solutions/sequential-rna-protein-detection.
Problem 3: Signal bleed-through during image acquisition.
Possible cause: Fluorophores might overlap in emission spectra.
Solution: Switch to sequential scanning or use spectrally distinct fluorophores.
Problem 4: Weak or nonspecific FISH signal.
Possible causes: Low opal dye concentration, tissue overdigestion, mRNA probe sequence incompatibilities, or sensitive brain areas.
Solutions:
1) The suggested opal dye concentration is 1:750; however, this can be decreased to 1:1,000 if high background occurs. Alternatively, if the signal is too low, opal dye concentration can be increased to 1:500.
2) More commonly, tissue overdigestion or mRNA degradation are expected to result in a weak or nonspecific signal; refer to Problem 1, solution 1a and b.
3) Some areas of the mouse brain, such as the hypothalamus, are more sensitive to degradation and nonspecific signals, specifically with the POMC and NPY probes. Altering tissue pretreatment conditions can improve this issue.
Acknowledgments
This protocol was adapted from previously published manuscripts [10,11]. The original workflow and protocol for FISH was developed by Advanced Cell Diagnostics (ACD) Bio using RNAscopeTM technology. The protocol was further optimized and adjusted with useful suggestions from technical support scientists at Advanced Cell Diagnostics, a Bio-Techne brand. M.K.B. conducted experiments included in the validation of the protocol, developed the macro code for this analysis and wrote the manuscript. K.W. assisted in manuscript edits and review and contributed charts and materials sections. I.M. supervised experiments and contributed to reviews and edits of this manuscript. This work was funded by R21 NS131097 to I.M. The Graphical abstract was created in BioRender: Lab, M. (2025) https://biorender.com/95ysjgp.
Competing interests
The authors declare no conflicts of interest.
References
- Shittu, M., Steenwinkel, T., Dion, W., Ostlund, N., Raja, K. and Werner, T. (2021). RNA In Situ Hybridization for Detecting Gene Expression Patterns in the Abdomens and Wings of Drosophila Species. Methods Protoc. 4(1): 20. https://doi.org/10.3390/mps4010020
- Chen, C. C., Wada, K. and Jarvis, E. D. (2012). Radioactive in situ Hybridization for Detecting Diverse Gene Expression Patterns in Tissue. J Visualized Exp.: e3791/3764–v. https://doi.org/10.3791/3764-v
- Meltzer, J., Sanders, V., Grimm, P., Stern, E., Rivier, C., Lee, S., Rennie, S., Gietz, R., Hole, A., Watson, P., et al. (1998). Production of digoxigenin-labelled RNA probes and the detection of cytokine mRNA in rat spleen and brain by in situ hybridization. Brain Res Protoc. 2(4): 339–351. https://doi.org/10.1016/s1385-299x(98)00010-5
- Magaki, S., Hojat, S. A., Wei, B., So, A. and Yong, W. H. (2018). An Introduction to the Performance of Immunohistochemistry. Methods Mol Biol. 1897: 289–298. https://doi.org/10.1007/978-1-4939-8935-5_25
- Johnson, M. B., Wang, P. P., Atabay, K. D., Murphy, E. A., Doan, R. N., Hecht, J. L. and Walsh, C. A. (2015). Single-cell analysis reveals transcriptional heterogeneity of neural progenitors in human cortex. Nat Neurosci. 18(5): 637–646. https://doi.org/10.1038/nn.3980
- Jiang, Y., Xun, Y. and Zhang, Z. (2024). Central regulation of feeding and body weight by ciliary GPR75. J Clin Invest. 134(19): e1172/jci182121. https://doi.org/10.1172/jci182121
- Akbari, P., Gilani, A., Sosina, O., Kosmicki, J. A., Khrimian, L., Fang, Y. Y., Persaud, T., Garcia, V., Sun, D., Li, A., et al. (2021). Sequencing of 640,000 exomes identifies GPR75 variants associated with protection from obesity. Science. 373(6550): eabf8683. https://doi.org/10.1126/science.abf8683
- Jiang, H., Bai, X., Meng, F. and Zhang, X. (2015). Comparison of immunohistochemistry and mRNA in situ hybridization in detecting thyroid transcription factor-1 expression in non-small cell lung carcinomas tissue. Oncol Lett. 10(6): 3581–3584. https://doi.org/10.3892/ol.2015.3757
- Sonomura, T., Nakamura, K., Furuta, T., Hioki, H., Nishi, A., Yamanaka, A., Uemura, M. and Kaneko, T. (2007). Expression of D1 but not D2 dopamine receptors in striatal neurons producing neurokinin B in rats. Eur J Neurosci. 26(11): 3093–3103. https://doi.org/10.1111/j.1460-9568.2007.05923.x
- Speidell, A., Walton, S., Campbell, L. A., Tomassoni‐Ardori, F., Tessarollo, L., Corbo, C., Taraballi, F. and Mocchetti, I. (2023). Mice deficient for G‐protein‐coupled receptor 75 display altered presynaptic structural protein expression and disrupted fear conditioning recall. J Neurochem. 165(6): 827–841. https://doi.org/10.1111/jnc.15818
- Agbey, C., Walton, S., Campbell, L. A., Nath, A., Smith, B., Snow, J., Wiebold, A., Hou, C., Ma, J., Mocchetti, I., et al. (2025). Expression of HIV envelope protein in the human central nervous system. AIDS. 39(7): 788–797. https://doi.org/10.1097/qad.0000000000004150
- Advanced Cell Diagnostics. RNAscope multiplex fluorescent v2 assay [Internet]. Newark (CA): Advanced Cell Diagnostics; [cited 2025 Oct 2]. Available from: https://acdbio.com/rnascope-multiplex-fluorescent-v2-assay
Article Information
Publication history
Received: Oct 6, 2025
Accepted: Dec 23, 2025
Available online: Jan 8, 2026
Published: May 5, 2026
Copyright
© 2026 The Author(s); This is an open access article under the CC BY-NC license (https://creativecommons.org/licenses/by-nc/4.0/).
How to cite
Becher, M. K., Wilson, K. and Mocchetti, I. (2026). Using combined fluorescent in situ hybridization with Immunohistochemistry to co-localize mRNA in diverse neuronal cell types. Bio-protocol 16(9): e5591. DOI: 10.21769/BioProtoc.5591.
Do you have any questions about this protocol?
Post your question to gather feedback from the community. We will also invite the authors of this article to respond.