- Protocols

- Articles and Issues
- For Authors
- About
- Become a Reviewer

Quantifying Mechanical Strain–Induced Membrane Damage in Early Neuronal Cells Using an In Vitro Traumatic Brain Injury Model
Published: Vol 16, Iss 3, Feb 5, 2026 DOI: 10.21769/BioProtoc.5580 Views: 447
Reviewed by: Sébastien GillotinAnonymous reviewer(s)
Original research article
The authors used this protocol in:
Dec 2025
Advertisement


Protocol Collections
Comprehensive collections of detailed, peer-reviewed protocols focusing on specific topics


Related protocols
Abstract
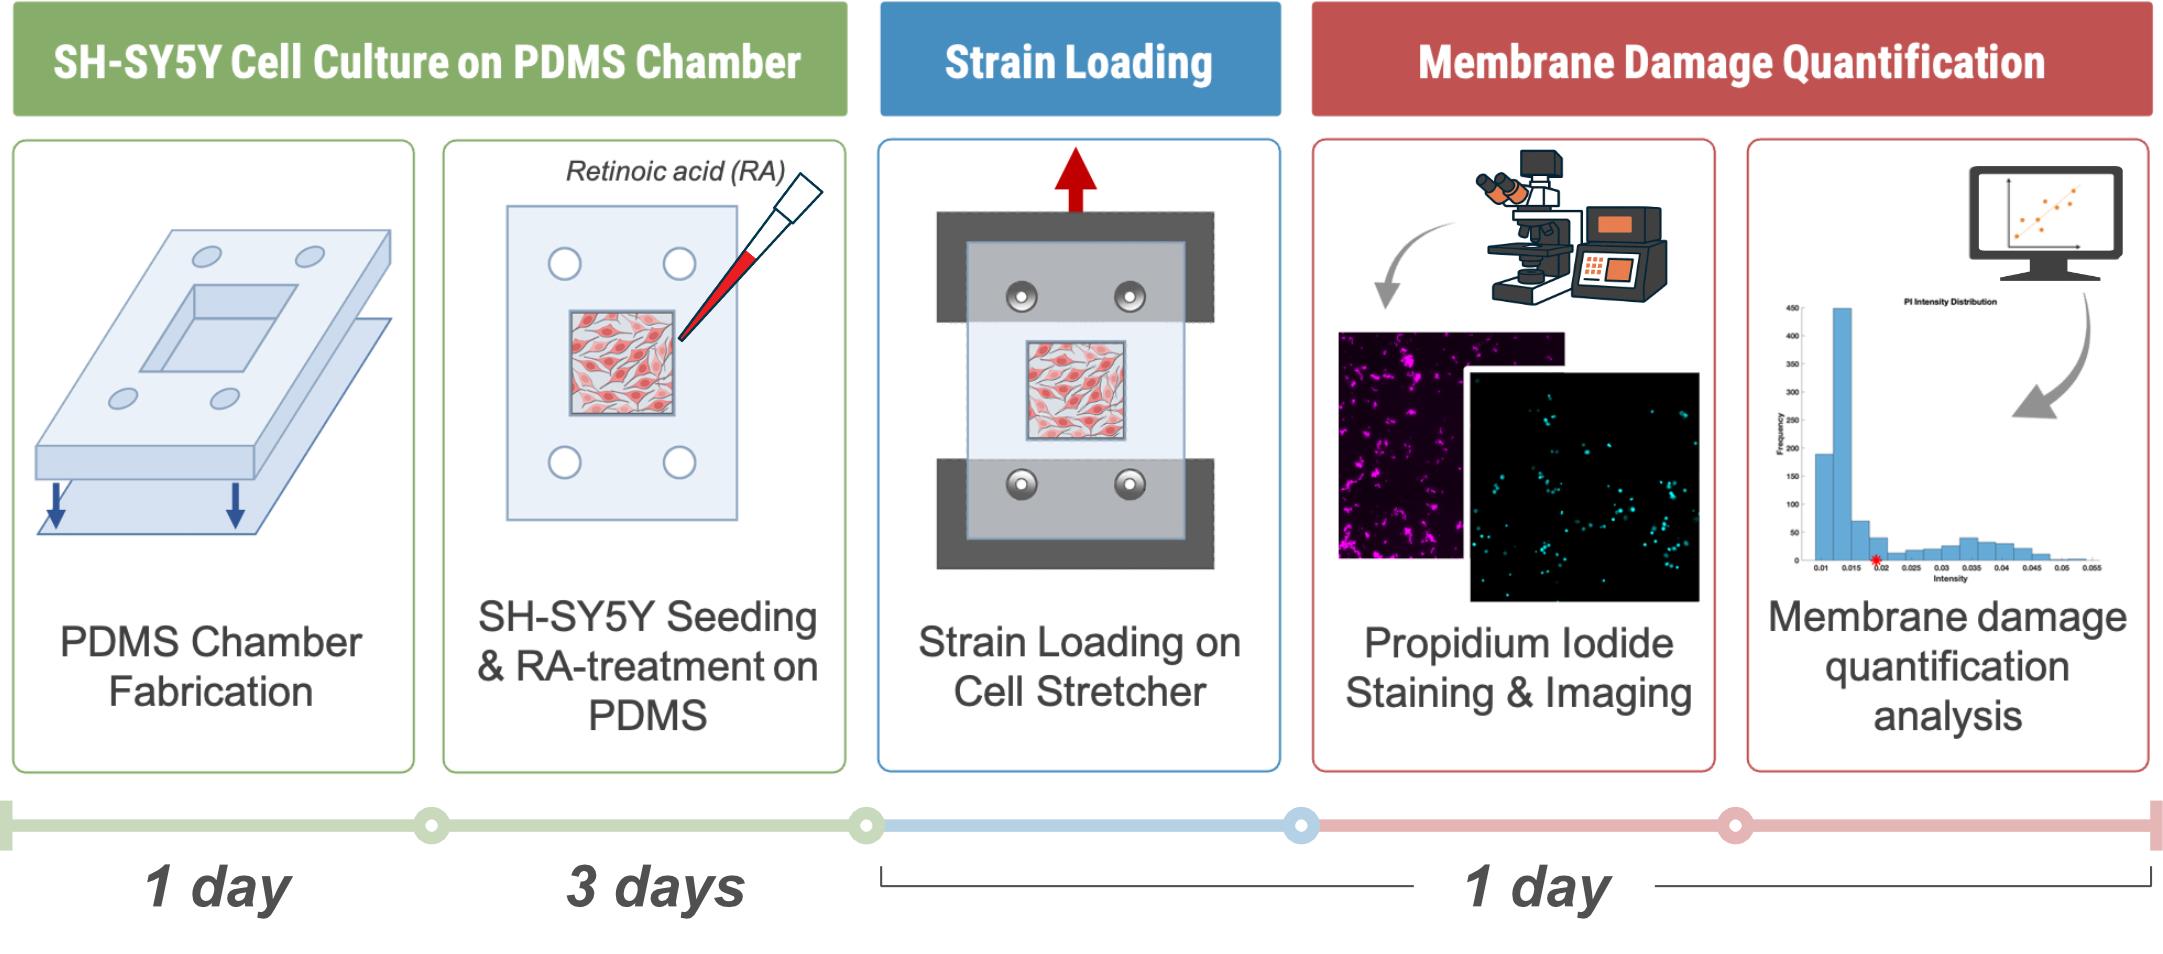
This protocol describes a reproducible workflow for modeling in vitro impact-induced traumatic brain injury (TBI) using a mechanical stretch system applied to differentiated SH-SY5Y human neuroblastoma cells cultured on polydimethylsiloxane (PDMS) substrates. The protocol integrates three primary components: (1) fabrication and surface modification of deformable PDMS chambers to support cellular adhesion, (2) partial differentiation of SH-SY5Y cells using retinoic acid, and (3) induction of controlled mechanical strain to simulate mild to moderate TBI. The stretch-induced injury model enables quantitative assessment of cellular viability and recovery following mechanical insult. This approach provides a versatile platform for studying cellular and molecular mechanisms of TBI, screening neuroprotective compounds, and exploring mechanobiological responses in neural cells under controlled strain magnitudes and rates.
Key features
• Provides reproducible in vitro modeling of traumatic brain injury in differentiated SH-SY5Y neurons via controlled mechanical stretch.
• Combines PDMS chamber fabrication and polydopamine coating to generate deformable, biocompatible, neuron-adhesive substrates for mechanobiology assays.
• Flexible platform for testing neuroprotective compounds and investigating mechanotransduction pathways under physiologically relevant stretch conditions.
Keywords: MechanobiologyGraphical overview
Background
Traumatic brain injury (TBI) is a leading cause of long-term neurological disability and mortality worldwide [1]. Conventional in vivo models of TBI provide valuable physiological insights but are often limited by biological complexity, ethical constraints, and difficulty in isolating specific injury parameters. In contrast, in vitro cell stretching systems offer a controlled, reproducible, and cost-effective platform to study neuronal response to mechanical injury at the cellular level. The human SH-SY5Y neuroblastoma cell line offers a human-derived in vitro model for studying neuronal cytoskeletal responses [2–5]. While they are not fully representative of mature neurons, SH-SY5Y cells may be treated to induce differentiation into neuron-like cells that exhibit neurite outgrowth and express neuronal markers. These cells can be cultured on deformable substrates, such as wells made from polydimethylsiloxane (PDMS), which allow for controlled mechanical deformation. PDMS is biocompatible, transparent, and elastomeric, making it well-suited for modeling brain tissue deformation [6]. However, native PDMS surfaces are hydrophobic [7], necessitating surface functionalization to support neuronal growth. Polydopamine (PDA) coatings, inspired by mussel adhesion chemistry [8,9], provide a simple and effective means of improving PDMS surface hydrophilicity and cell adhesion. In this protocol, PDMS chambers are fabricated and coated with PDA to create a biocompatible substrate for SH-SY5Y culture and differentiation. Differentiation is induced using retinoic acid (RA), yielding cells with extended neurites. Once differentiation is complete, the PDMS substrates are subjected to controlled mechanical stretching to simulate TBI conditions. By adjusting strain magnitude and strain rate, this system allows precise modulation of injury severity and can be combined with a high-resolution optical microscope to examine cellular responses to mechanical injury.
Materials and reagents
Biological materials
1. SH-SY5Y human neuroblastoma cells (ATCC CRL-2266)
Reagents
1. Tris-HCl (MilliporeSigma, catalog number: 648317100GM)
2. Dopamine hydrochloride, powder ≥98% (Sigma-Aldrich, catalog number: H8502-5G)
3. Retinoic acid (RA), all-trans (Sigma-Aldrich, catalog number: R2625)
4. 95% ethanol (Commercial Alcohols, catalog number: P016EA95)
5. Fetal bovine serum (FBS), heat-inactivated (Thermo Fisher Scientific, catalog number: 10270106)
6. Dulbecco’s modified Eagle’s medium (DMEM) with 4.5 g/L D-Glucose and phenol red (Gibco, catalog number: 11965118)
7. Penicillin-streptomycin 100× solution (Cytiva, catalog number: SV30010)
8. Phosphate-buffered saline (PBS), 1× with calcium and magnesium (Corning, catalog number: 21-030-CV)
9. Trypsin-EDTA solution, 0.25% (Gibco, catalog number: 25200056)
10. SYLGARDTM 184 Silicone Elastomer kit (Dow Corning, catalog number: 184 SIL ELAST KIT)
11. Gel-Pak PDMS sheets (PF-60x60-0065-X4)
12. Hydrochloric acid (HCl), 12 N (Ricca Chemical Company, catalog number: R37800001A)
13. Hoechst (Abcam, catalog number: ab228551)
14. Propidium iodide (PI) (BioShop Canada, catalog number: PPI888.5)
Solutions
1. Tris-HCl buffer (see Recipes)
2. Polydopamine (PDA) solution (see Recipes)
3. Retinoic acid (RA) stock solution (see Recipes)
4. Complete DMEM (see Recipes)
5. Reduced DMEM (see Recipes)
6. Differentiation medium with retinoic acid (see Recipes)
Recipes
1. Tris-HCl buffer (pH 8.5, 0.63 M)
| Reagent | Final concentration | Quantity or volume |
|---|---|---|
| Tris-HCl | 100 mg/mL (0.63 M) | 25.0 g |
| HCl | pH adjustment | ~4 mL (titrate to pH 8.5) |
| Deionized water | — | To 250 mL final volume |
Weigh 25.0 g of Tris-HCl (MW 157.6 g/mol) and transfer it to a clean 300 mL beaker containing ~200 mL of deionized water. Stir using a magnetic stirrer until completely dissolved. Slowly add concentrated HCl (~12 N) while monitoring the pH with a calibrated meter, adjusting to pH 8.5. As pH is temperature-dependent, record at the intended use temperature. Transfer the solution to a 250 mL volumetric flask and bring to volume with deionized water. Mix thoroughly. Filter-sterilize before final storage. Store at room temperature for up to 4 weeks or at 4 °C for up to 1 year.
2. PDA solution (0.15 mg/mL)
| Reagent | Final concentration | Quantity or volume |
|---|---|---|
| Dopamine hydrochloride | 0.15 mg/mL | 1.5 mg |
| Tris-HCl buffer (Recipe 1) | — | 10 mL |
Weigh 1.5 mg of dopamine hydrochloride and transfer it to a sterile Falcon tube containing 10 mL of Tris-HCl buffer to generate polydopamine (PDA) solution (Recipe 1). Stir the solution gently until all solids are completely dissolved. Prepare the PDA solution fresh before each experiment to avoid oxidation. Short-term storage at 4 °C is possible for up to 24 h. Handle under minimal light exposure to maintain stability. The recipe can be scaled up to facilitate more accurate weighing of dopamine hydrochloride.
3. RA stock solution (5 mM)
| Reagent | Final concentration | Quantity or volume |
|---|---|---|
| All-trans retinoic acid | 5 mM | 50 mg |
| 95% ethanol | — | 33.3 mL |
Weigh 50 mg of RA powder and transfer it to a clean, amber bottle. Add 33.3 mL of 95% ethanol and gently swirl or invert until fully dissolved. RA is sensitive to light, heat, and air; handle under minimal light exposure and use a tightly sealed dark bottle to prevent degradation. Aliquot to prevent freeze-thaw cycles. Store at -20 °C for long-term storage. Prepare working dilutions freshly before experiments (see Recipe 6).
4. Complete DMEM
| Reagent | Final concentration | Quantity or volume |
|---|---|---|
| DMEM (+ 4.5 g/L D-Glucose) | 89% | 450 mL |
| FBS | 10% | 50 mL |
| Penicillin-streptomycin | 1% | 5 mL |
| Total | 100% | 505 mL |
Supplement 450 mL of DMEM with 50 mL of heat-inactivated FBS and 5 mL of penicillin-streptomycin. Mix gently to avoid foaming. Store at 2–8 °C for 2–4 weeks. Use sterile technique.
5. Reduced DMEM
| Reagent | Final concentration | Quantity or volume |
|---|---|---|
| DMEM (+ 4.5 g/L D-Glucose) | 98% | 450 mL |
| FBS | 1% | 5 mL |
| Penicillin-streptomycin | 1% | 5 mL |
| Total | 100% | 460 mL |
Supplement 450 mL of DMEM with 5 mL of heat-inactivated FBS and 5 mL of penicillin-streptomycin. Mix gently to avoid foaming. Store at 2–8 °C for 2–4 weeks. Use sterile technique.
6. Differentiation medium with retinoic acid
| Reagent | Final concentration | Quantity or volume |
|---|---|---|
| Reduced DMEM medium (Recipe 5) | — | 5 mL |
| RA stock solution (Recipe 4) | 10 μM (500×) | 10 μL |
Add 10 μL of RA stock (5 mM in 95% ethanol) to 5 mL of prewarmed reduced DMEM (Recipe 5). Mix gently to ensure uniform distribution. Use immediately and protect from light. Prepare fresh before experiments and filter through a 0.22 μm membrane (optional) to ensure sterility.
Laboratory supplies
1. Falcon® 25 cm2 polystyrene tissue culture flasks, sterile, vent cap, canted neck (Corning, catalog number: 353108)
2. NuncTM 15 mL polypropylene centrifuge tubes, sterile, bulk bag (Thermo Scientific, catalog number: 339650)
3. Corning® 500 mL vacuum filter/storage bottle system, 0.22 μm pore, 33.2 cm2 CA membrane, sterile (Corning, catalog number: 430769)
4. Disposable syringe without needle, 10 mL (Air-Tite)
5. Sterile PES syringe filters, 0.22 μm (Fisher Scientific, catalog number: 09-720-511)
6. 55 mm glass-bottom dish with 30 mm micro-well, #1.5 cover glass (Cellvis, catalog number: D60-30-1.5-N)
7. Petri dishes, 90 mm × 15 mm (SPL)
Equipment
1. Class II biological safety cabinet (ESCO)
2. CO2 incubator (Thermo Scientific, model: 3110)
3. Vacuum oven (Thermo Scientific, model: 3608-5, 0.7 cu. ft.)
4. Voice coil actuator stage (Zaber, model: X-DMQ12L-AE55D12)
5. UV sterilizer or UV crosslinker
6. Analytical balance (METTLER TOLEDO, catalog number: 30823718)
7. Vortex mixer (Fisher Scientific, catalog number: 02215365)
8. Sterile forceps and scalpel
9. Biopsy punch (Ø 3 mm) (Qiagen, catalog number: WB100039)
10. Square punch (10 mm × 10 mm) (Walfront, catalog number: B0BRYB3BJK)
11. Water bath, 37 °C
12. Freezer, -20 °C
13. Refrigerator, 2–8 °C
14. Microscope capable of fluorescence microscopy (e.g., Nikon Ti2)
Software and datasets
1. ImageJ (National Institutes of Health, Version 1.54f); free, open-source image analysis software; no license required
2. MATLAB (MathWorks, Version R2023b); requires a paid license (academic, individual, or institutional). Free alternatives include GNU Octave (open-source)
3. All data and code have been deposited to GitHub: https://github.com/Carleton-CTE-Lab/Carleton-Cell-Stretcher (11/8/2025)
Procedure
A. PDMS cell culture chamber fabrication (Figure 1)
1. Mix SylgardTM 184 (Dow Corning) at a 10:1 ratio of Part A (base) to Part B (curing agent) by weight.
Caution: Ensure thorough mixing of both components, as incomplete blending will result in uneven curing and non-uniform PDMS properties.
2. Pour the mixture to form a 5-mm-thick slab in a clean Petri dish (Ø 90 mm) and degas inside the vacuum oven at ambient temperature until the solution becomes clear (>10 min).
3. Cure in a vacuum oven at 60 °C under atmospheric pressure for up to 12 h.
4. Cut the cured PDMS into rectangular sections (20 mm × 30 mm).
5. Using a square punch (10 mm × 10 mm), cut a hole at the center of each rectangular piece to form the cell culture well.
6. Manually create alignment holes with a biopsy punch (Ø 3 mm), lined up with the position of the cell stretcher mounting pins (refer to Figure 1 for visual clarification).
7. Cut Gel-Pak PDMS sheets (PF-60x60-0065-X4, ~200 μm-thick as per manufacturer specifications) into the same dimensions as the pieces in step A4.
8. Apply a thin layer of liquid SylgardTM 184 as an adhesive to the bottom of the “base” PDMS chamber from steps A4–6.
9. On a flat surface, press down to attach the base chamber to the PDMS sheet.
10. Cure the assembled chambers again at 60 °C for ~4 h to permanently bond the base chamber and the sheet.
Pause point: Once cured, the fully bonded PDMS chambers may be stored at room temperature for up to 2 weeks.
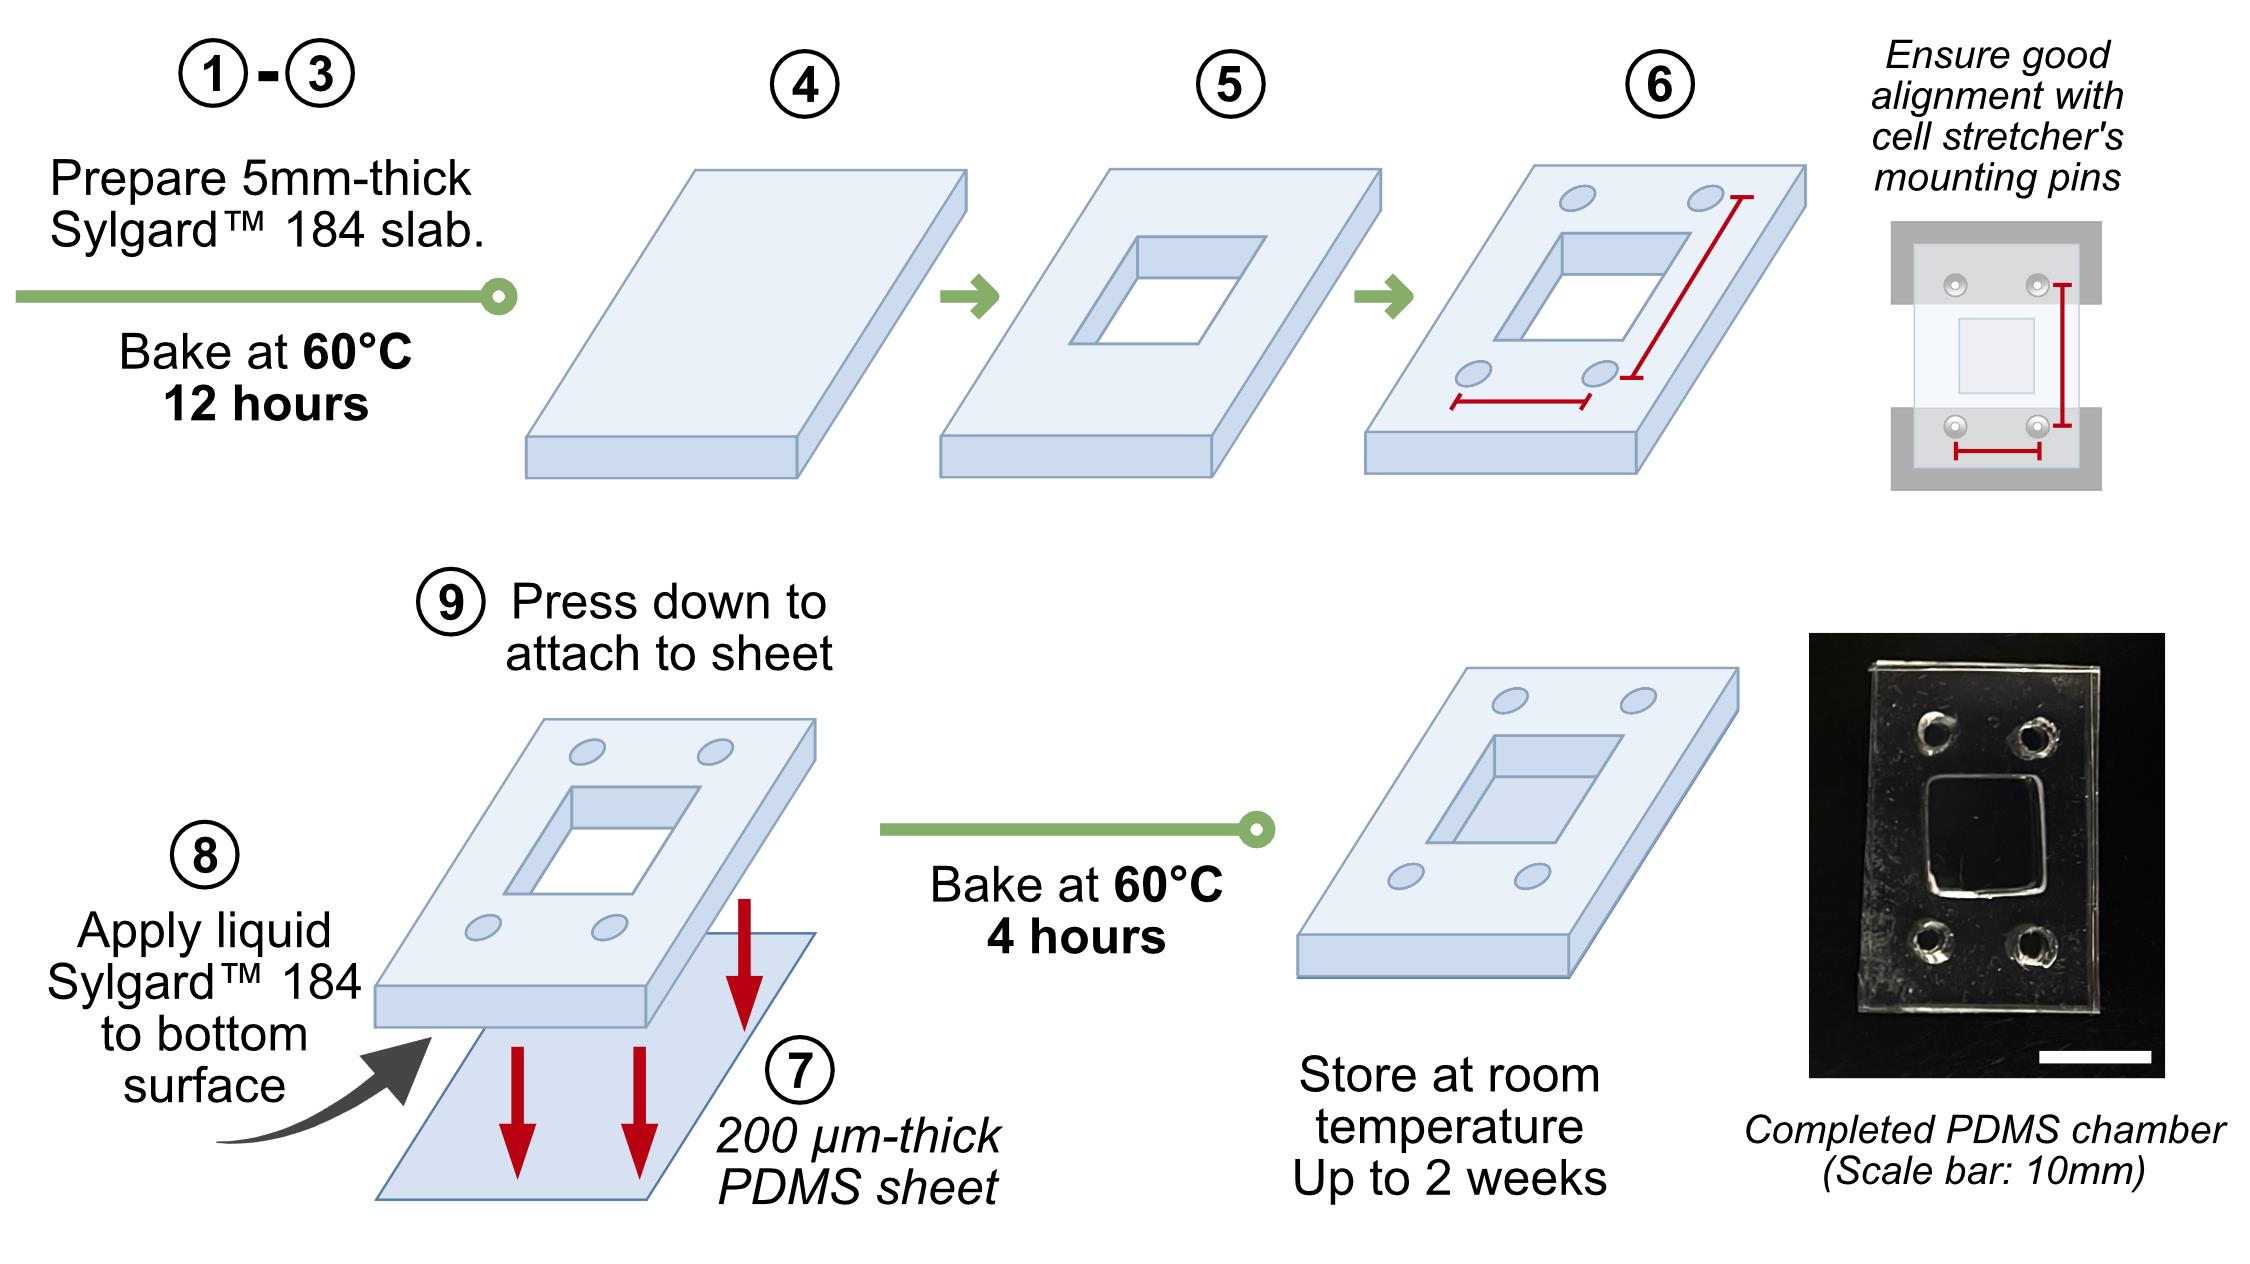
Figure 1. Workflow schematic for the fabrication of polydimethylsiloxane (PDMS) cell culture wells. PDMS base and curing agent (SylgardTM 184, 10:1 ratio by weight) are mixed, degassed, and cured to form elastomer slabs. Rectangular sections are cut, and central wells and alignment holes are punched to create the chamber geometry. A thin PDMS film is bonded to the base using uncured PDMS adhesive and re-cured to form sealed wells.
B. Seeding and RA-treating SH-SY5Y cells in PDMS chambers (Figure 2A)
B1. Polydopamine treatment of the PDMS surface
1. Place PDMS chambers on clean Petri dishes and sterilize using UV treatment for 15 min. Transfer sterilized chambers to new Petri dishes in a biosafety cabinet (BSC).
2. Prepare polydopamine (PDA) solution in Tris-HCl buffer (see Recipe 2).
3. Add ~350 μL of PDA solution to each PDMS chamber and incubate at room temperature for at least 1 h in the BSC.
4. Remove the PDA solution and wash PDMS chambers three times with PBS under sterile conditions.
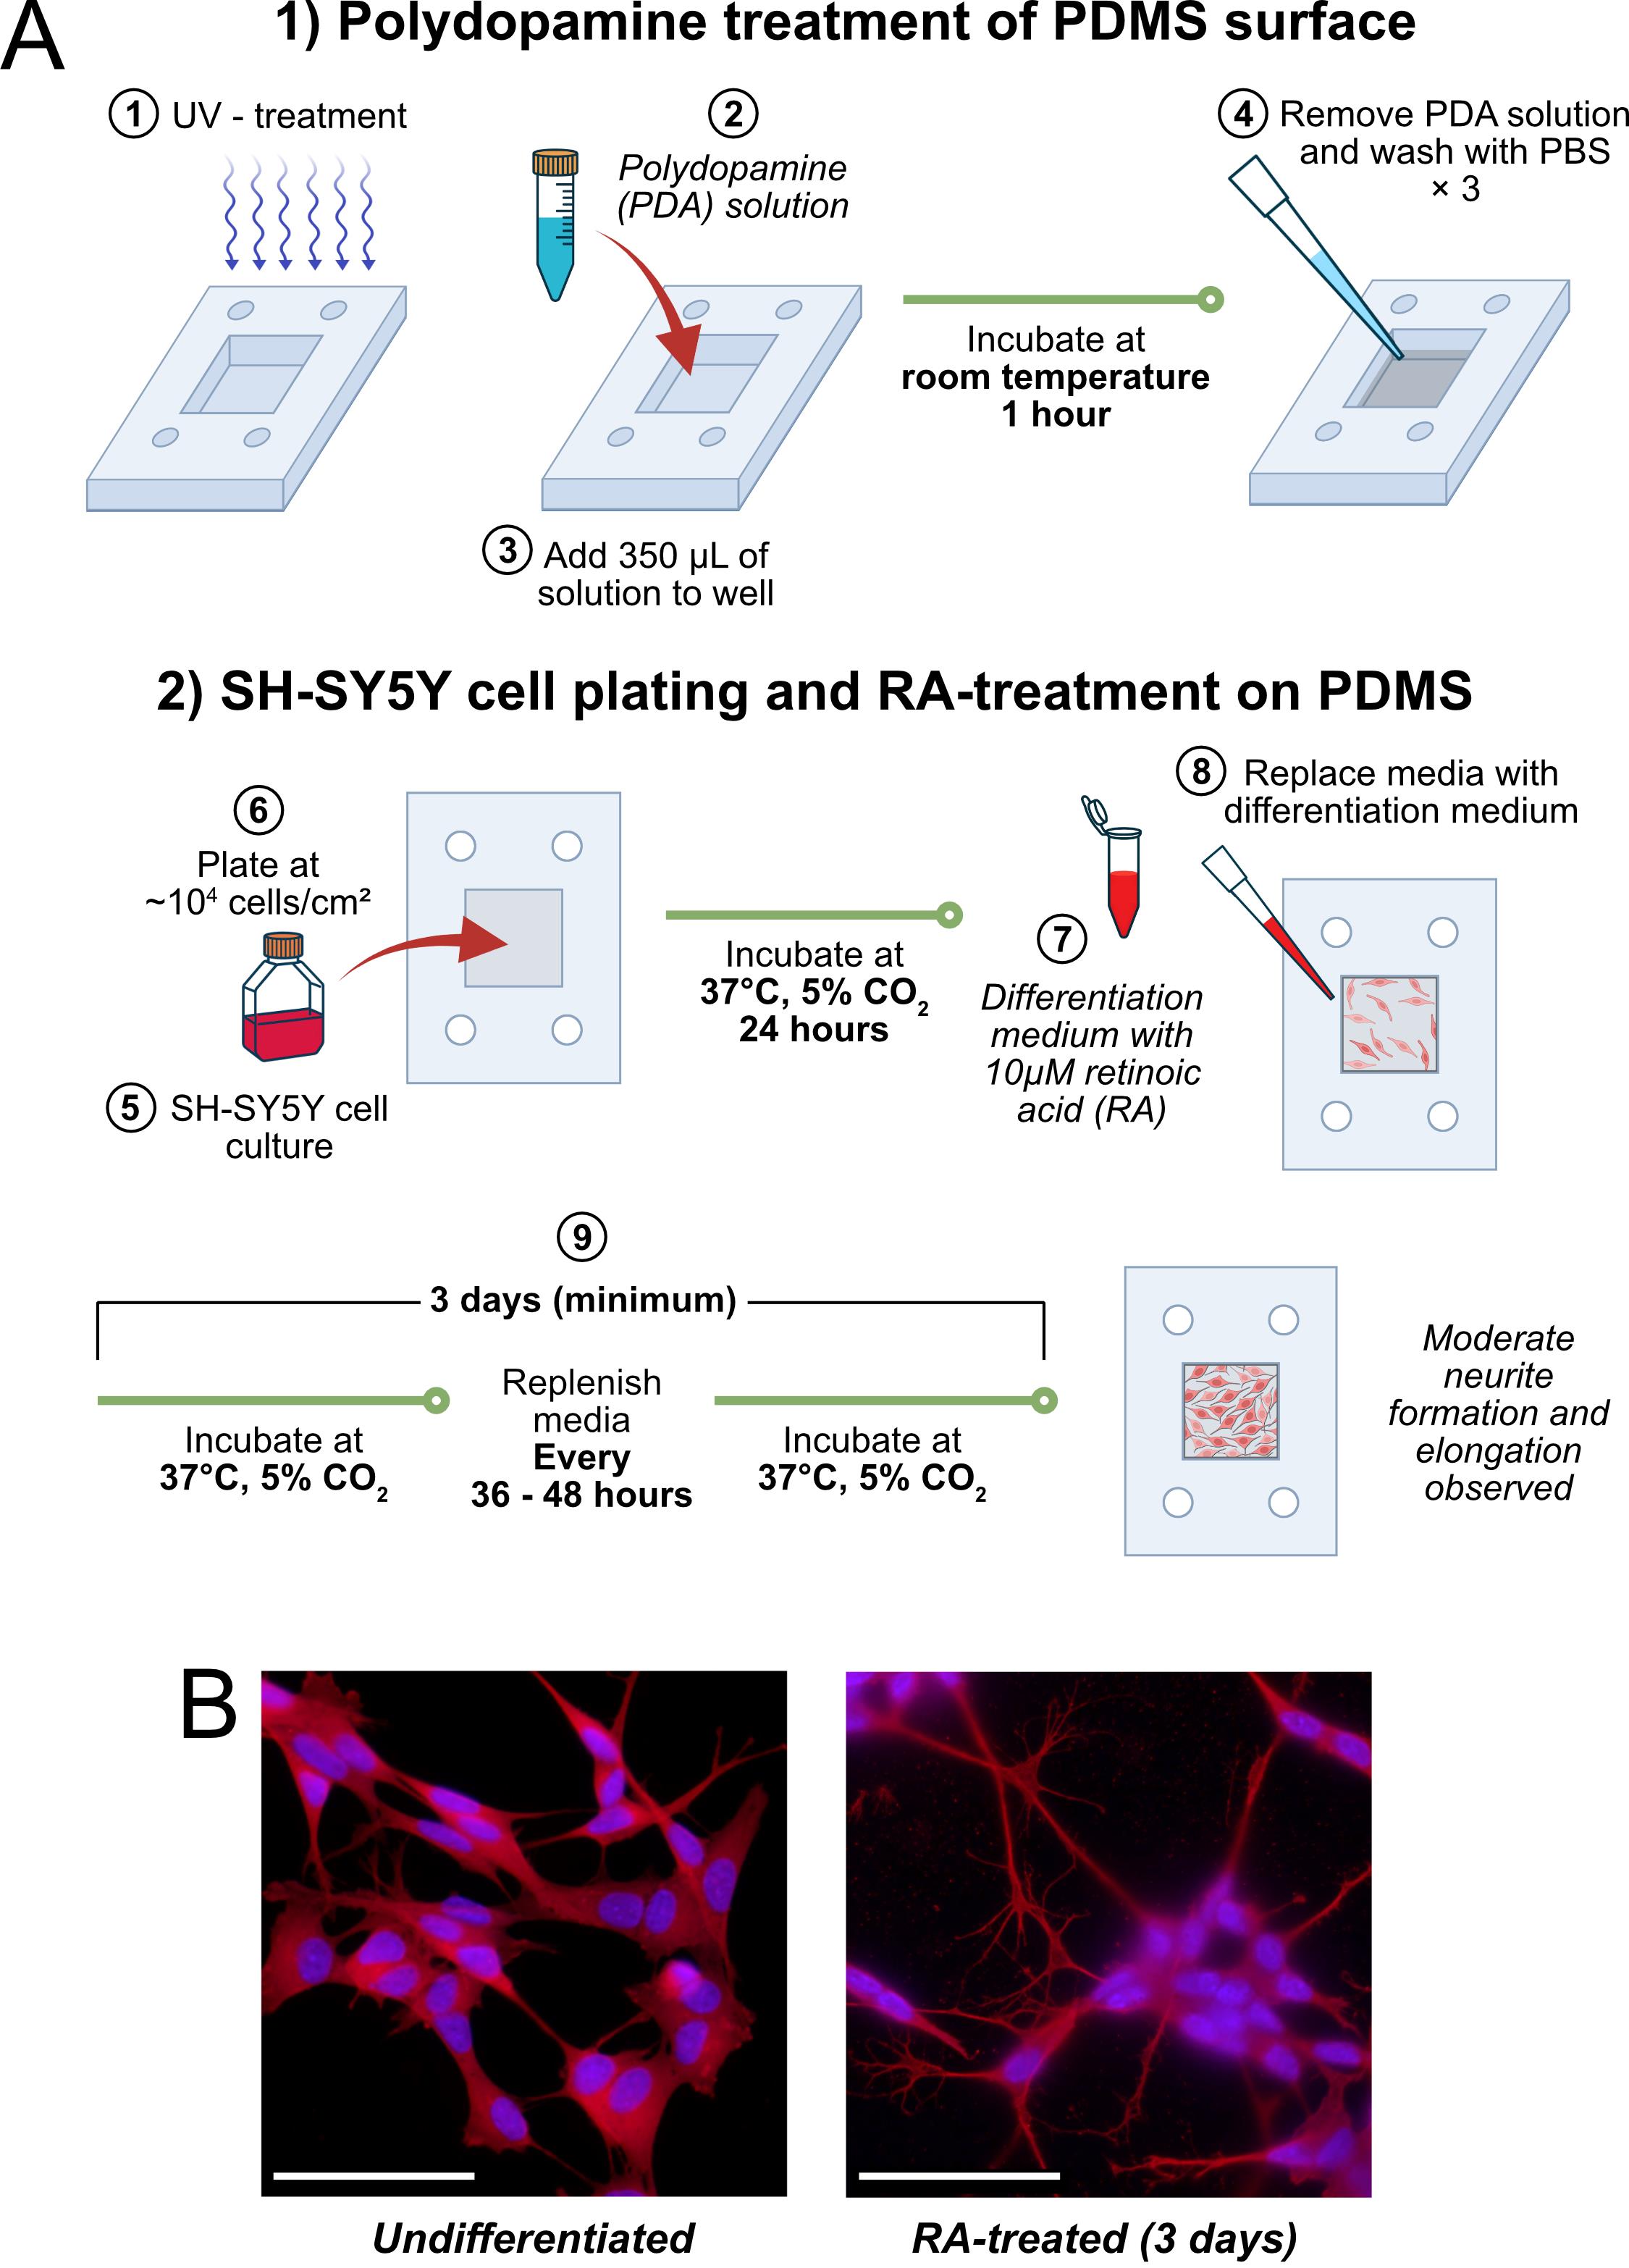
Figure 2. Workflow and morphological changes of SH-SY5Y cells following retinoic acid (RA) treatment. (A) Schematic overview of SH-SY5Y cell plating and RA treatment workflow. Undifferentiated SH-SY5Y cells are seeded onto polydopamine (PDA)-coated polydimethylsiloxane (PDMS) wells in complete DMEM, allowed to attach for 24 h, and subsequently cultured in reduced DMEM supplemented with 10 μM RA for at least 3 days. (B) Representative fluorescence micrographs showing SH-SY5Y cells without RA treatment (undifferentiated) and after RA treatment (scale bar: 100 μm). Cells were stained with α-tubulin [primary Ab: Abcam, ab52866; secondary Ab: goat anti-rabbit IgG H&L (Alexa Fluor® 647), Abcam, ab150079, shown in red] to visualize microtubules and Hoechst (Abcam ab228551, shown in blue) to label nuclei. RA-treated cells exhibit elongated, neurite-like extensions consistent with early neuronal differentiation.
B2. SH-SY5Y cell plating and RA treatment on PDMS
1. Retrieve a flask of undifferentiated SH-SY5Y cells ready for culture. Culture according to a standard subculturing protocol [10].
2. Plate undifferentiated, adherent SH-SY5Y cells onto PDA-coated PDMS chambers at a density of ~10,000 cells/cm2 in prewarmed complete DMEM (see Recipe 4). The total volume of media in each chamber should be ~350 μL. Incubate cells undisturbed for 24 h in a standard incubator (37 °C, 5% CO2).
Note: Ensure that the culture well surface area is ≥1 cm2 to allow optimal growth.
Caution: Differentiation efficiency may vary with passage number; use low-passage cells (<20 passages) for best results.
3. After 24 h, prepare prewarmed differentiation media containing 10 μM retinoic acid in reduced DMEM (see Recipes 5 and 6).
Note: Filter the differentiation medium through a 0.22 μm membrane if sterility is a concern.
Caution: RA is light-sensitive and unstable; always prepare fresh solutions for each experiment and discard leftovers.
4. Remove the existing media from the chambers. Immediately add 350 μL of differentiation medium to each chamber.
5. Incubate cells under standard culture conditions for a minimum of 3 days. Replenish the media (same medium as in step B2.1) every 36–48 h.
6. Use RA-treated cells for downstream experiments as a model of early differentiating neuronal cells, such as neurite formation and cell body elongation (Figure 2B).
C. Voice-coil actuator (VCA) stage operation
1. Set up the voice-coil actuator (VCA) with a cell stretcher system. The VCA and cell stretcher setup used in this protocol is shown in Figure 3A–B. This system is also compatible with multiple configurations, such as on a microscope stage for imaging in ambient conditions, or inside a cell culture incubator for controlled temperature, CO2, and humidity. See Figure S1 for detailed examples of possible configurations, Figure S2 for calibration, and Figure S3 for schematics.
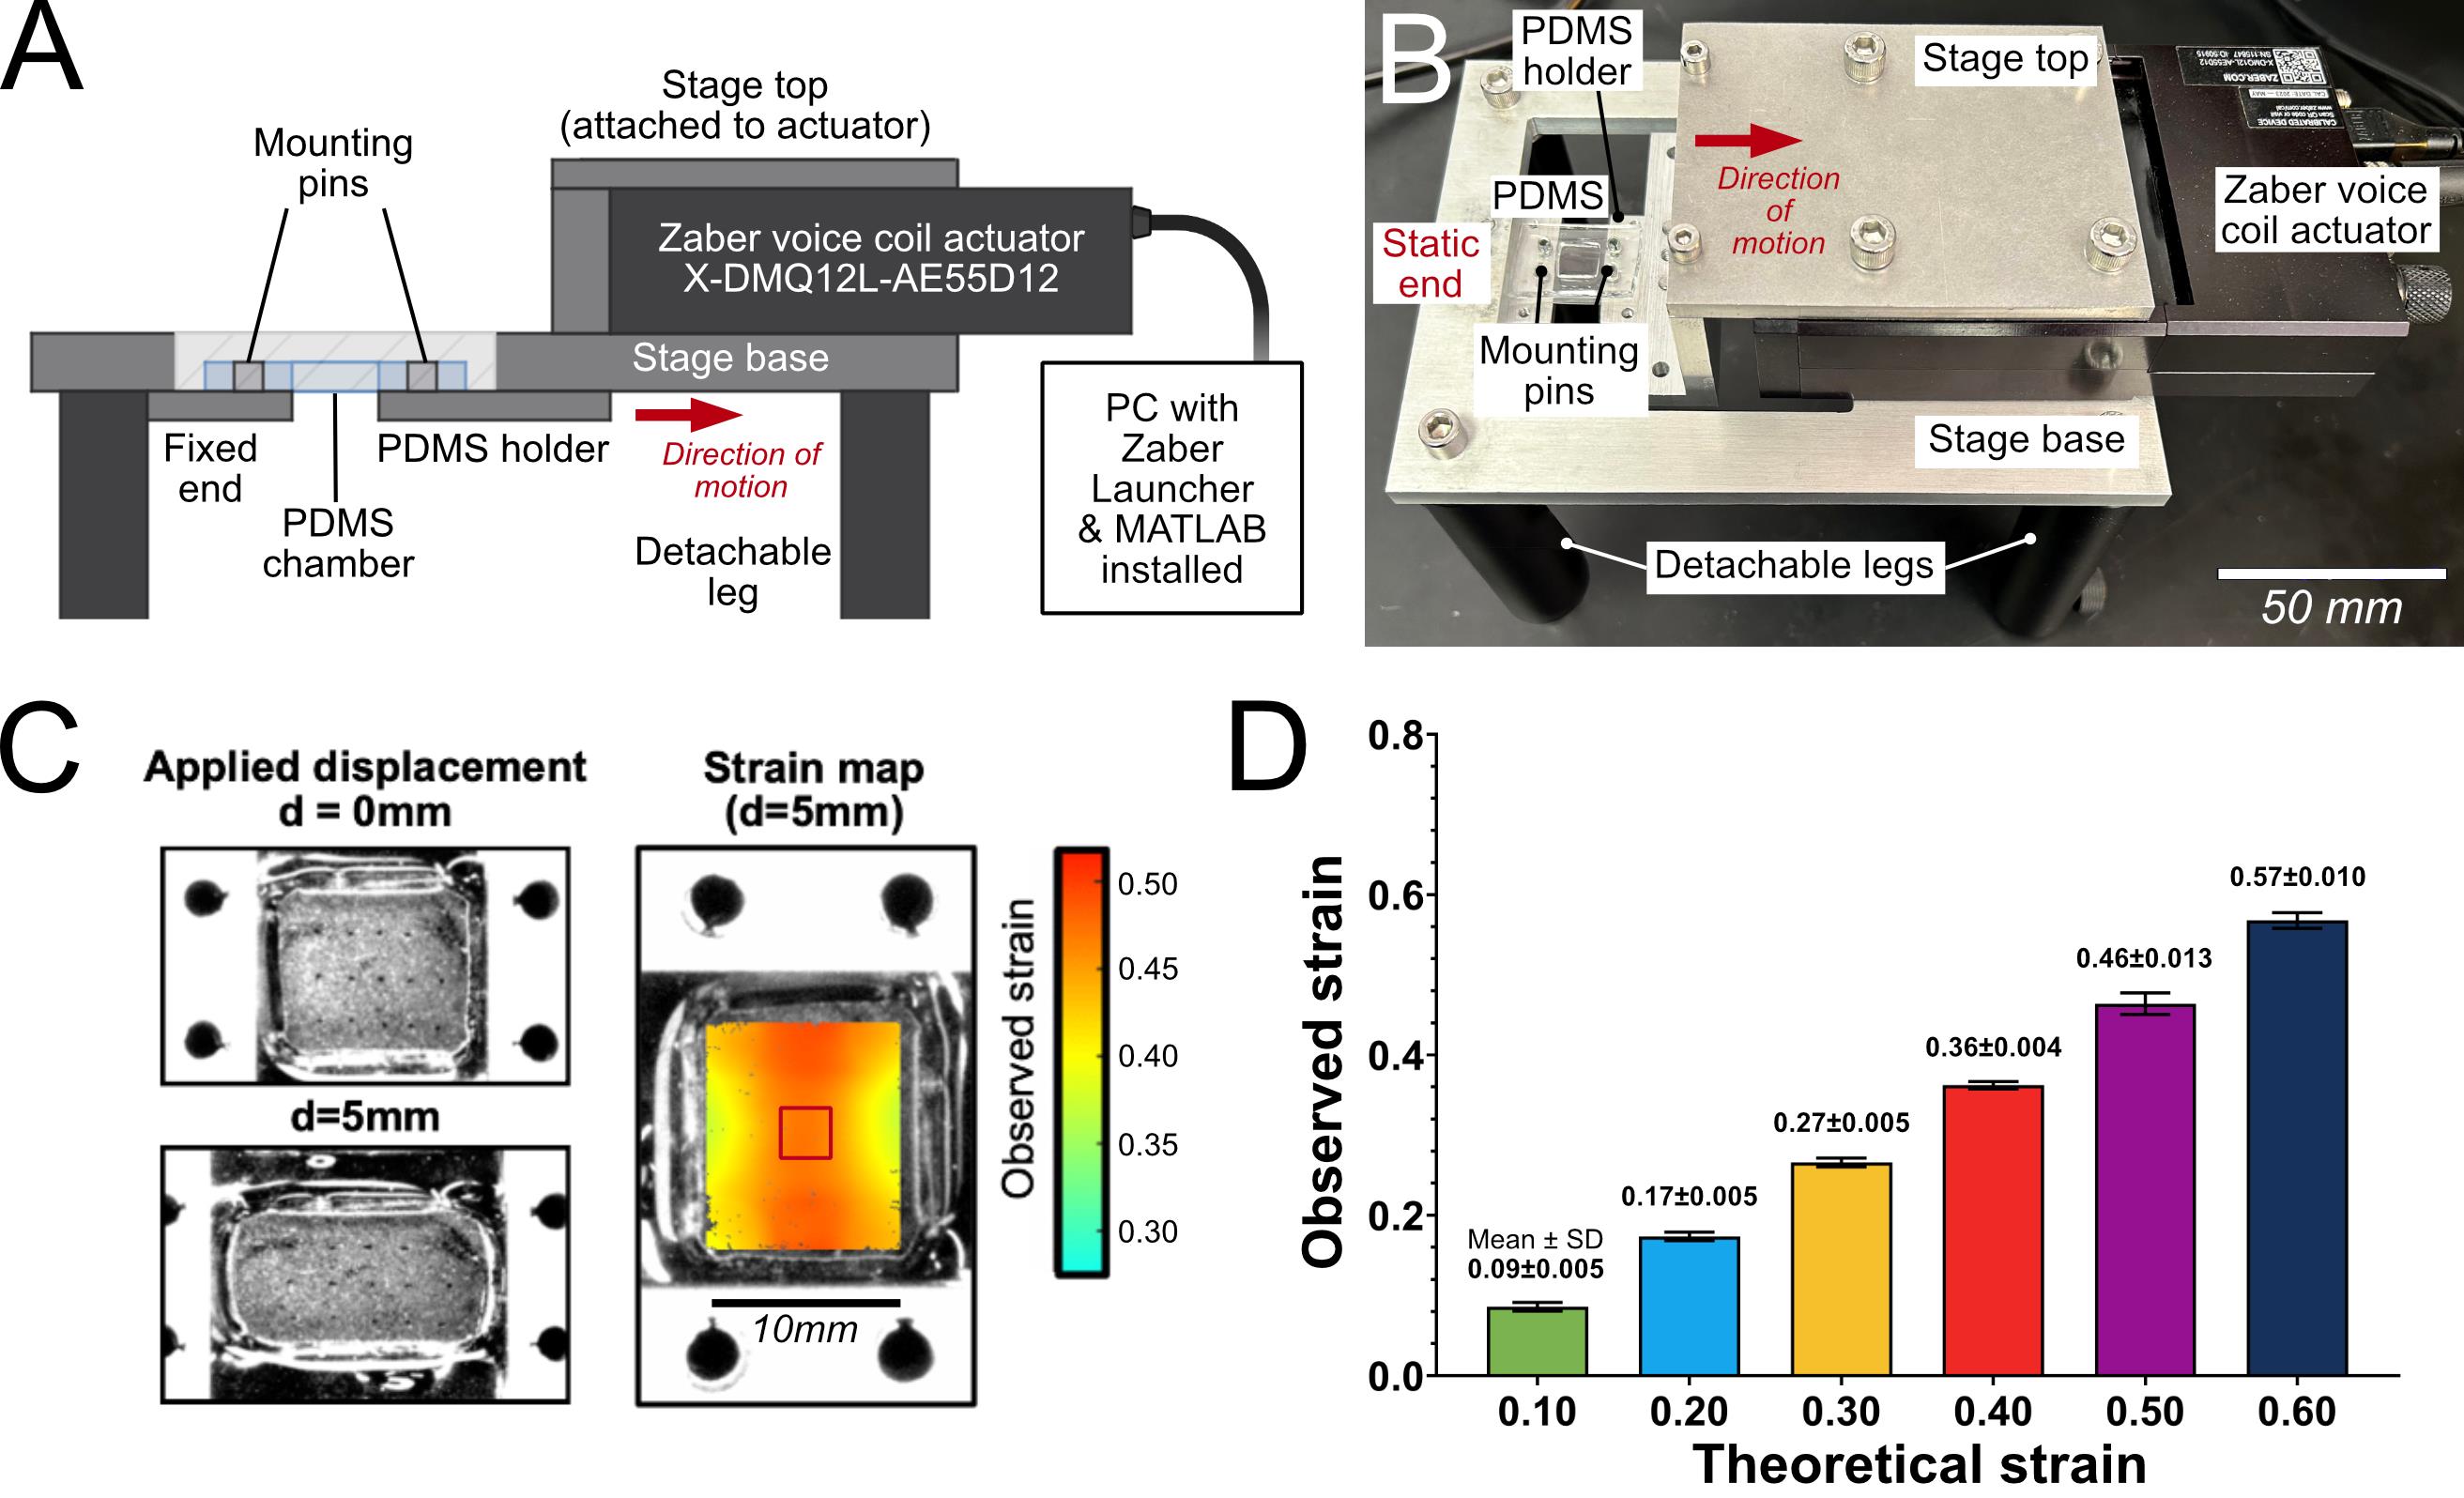
Figure 3. Voice-coil actuator (VCA) cell stretcher system and strain characterization of polydimethylsiloxane (PDMS) wells. (A) Schematic diagram of the VCA-based cell stretcher system. Key components, including the actuator, PDMS well adapter mounts, and stage controls, are labeled to illustrate the experimental setup. (B) Photograph of the VCA system corresponding to the schematic in (A), with the same components labeled for reference. (C, left) Representative PDMS chamber used for digital image correlation (DIC) strain measurements at rest (d = 0 mm) and stretched to d = 5 mm. (C, right) Heatmap of the observed εyy strain calculated using NCORR [11] for d = 5 mm. (D) Mean observed strain in the central region of the PDMS well (denoted by the red square in C, right) plotted against the theoretical strain calculated from the known well length and applied actuator displacement. Data are presented as mean ± SD from n = 5 independent replicates. Numerical values of mean ± SD are shown above each bar.
2. Connect the VCA to a PC via USB and open the Zaber Launcher software (available on https://www.zaber.com/zaber-launcher).
3. “Home” the VCA to the zero-strain position (where the PDMS chamber experiences no strain).
Note: This position must be calculated beforehand using the distance between the cell stretcher mounting pins (see Figure 3A).
Caution: Perform this step before mounting the PDMS chamber on the stretcher, as the stage will move to its maximum displacement position and will most likely tear the PDMS chamber in the process should it be mounted.
4. Verify that MATLAB is properly connected to the Zaber Launcher software and that communication between the two programs is established.
Note: This requires the Zaber Motion Library MATLAB toolbox to be installed (instructions available at https://software.zaber.com/motion-library/docs/tutorials/install/matlab).
5. Calculate the displacement required to produce the desired strain magnitude based on the size and geometry of the PDMS cell culture chamber.
Note: See Figure 3C for a strain calibration example for a 10 mm × 10 mm square well. A uniaxial stretch of 5 mm along a 10 mm-long axis corresponds to a theoretical strain of 0.50; however, the observed strain in the central region of the well is 0.46 (Figure 3D). Therefore, an actuator displacement of 5 mm corresponds to 0.46 strain.
For other well geometries, perform digital image correlation (DIC) on a blank PDMS chamber to calibrate displacement against the actual strain distribution as necessary [11].
6. Determine the acceleration needed to achieve the target strain rate for the calculated displacement. Refer to Table 1 for the calibration chart correlating acceleration values with specific displacement and strain rate combinations for Zaber VCA model X-DMQ12L-AE55D12. The calibration curves can be found in Figure S2.
Note: For example, to achieve a strain rate of 10 s-1 when a displacement of 3 mm is applied to the chamber, the acceleration value should be set to 4.5 m/s2.
Table 1. Acceleration values (m/s2) required to achieve desired strain rates at specified voice-coil actuator (VCA) stage displacements, calibrated to the Zaber VCA model X-DMQ12L-AE55D12
| Displacement (mm) | |||||||||||
| 0.1 | 0.2 | 0.5 | 0.75 | 1 | 2 | 3 | 4 | 5 | 6 | ||
| Strain rate (1/s) | 0.01 | 0.0001 | 0.00007 | 0.00004 | 0.00001 | 0.00001 | 0.00001 | 0.00001 | 0.00001 | 0.00001 | 0.00001 |
| 0.1 | 0.01 | 0.005 | 0.005 | 0.002 | 0.001 | 0.0005 | 0.00035 | 0.00025 | 0.0002 | 0.00018 | |
| 0.5 | 0.25 | 0.13 | 0.05 | 0.035 | 0.025 | 0.013 | 0.008 | 0.006 | 0.005 | 0.004 | |
| 0.75 | 0.56 | 0.28 | 0.115 | 0.075 | 0.056 | 0.028 | 0.019 | 0.014 | 0.011 | 0.0095 | |
| 1 | 1.5 | 0.5 | 0.2 | 0.14 | 0.1 | 0.05 | 0.034 | 0.025 | 0.02 | 0.017 | |
| 2 | - | 4 | 1.1 | 0.54 | 0.4 | 0.2 | 0.135 | 0.1 | 0.08 | 0.068 | |
| 5 | - | - | 8 | 4.5 | 3.4 | 1.5 | 1 | 0.6 | 0.29 | 0.2 | |
| 10 | - | - | - | 40 | 17 | 6.7 | 4.5 | 3.2 | 2.4 | 1.95 | |
| 20 | - | - | - | - | - | 32.5 | 17.7 | 13.5 | 10.9 | 8.6 | |
| 30 | - | - | - | - | - | 200 | 45 | 29.4 | 23.4 | 19.1 | |
| 40 | - | - | - | - | - | - | 140 | 60 | 41.7 | 34.8 | |
| 50 | - | - | - | - | - | - | - | 125 | 75.8 | 56.2 | |
7. Go to Device Settings > Motion > Acceleration & Deceleration in Zaber Launcher. Set the acceleration to the value calculated in step C6.
8. Carefully mount the PDMS chamber onto the cell stretcher mounting pins, ensuring alignment along the uniaxial stretch axis.
Note: Confirm that the chamber is securely fastened to prevent slippage during high-strain loading.
9. Open the custom MATLAB control script (Actuator_Control.m) to execute actuator motion.
10. Adjust the script parameters according to experimental requirements. For example, to execute 10 load-unload cycles with a 30-s wait between each cycle on a 10 mm × 10 mm well by stretching it in tension by 3 mm (~0.27 strain) and immediately unloading the stretch (i.e., 0 s hold), the user-defined parameters would be as follows:
%% ----------------------- USER-DEFINED PARAMETERS -------------------------numCycles = 10; % Total number of loading cycles (1 cycle = loading + unloading)intervalTime = 30; % Duration (in seconds) between consecutive cyclesrelMove = -3; % Total relative displacement (in millimeters) per cycleholdTime = 0; % Hold time (in seconds) at maximum stretch before unloading11. Run the script to execute the actuator stage motion.
D. Membrane damage assay (Figure 4)
1. Set up the VCA and cell stretcher inside the cell culture incubator (Figure S1).
2. Prepare a staining solution containing Hoechst and propidium iodide (PI). Add 1.25 μL of Hoechst (final concentration 5 μM) and 100 μL of PI (final concentration 30 μM) to 5 mL of prewarmed media. For undifferentiated cells, use complete DMEM (Recipe 4). For RA-treated cells, use reduced DMEM (Recipe 5).
3. Incubate cells cultured on PDMS chambers in the staining solution for 10–15 min in the incubator.
4. Subject the stained cells to controlled mechanical stretching as described in section C.
5. After stretching, incubate for an additional 30 min.
6. Carefully dismount the PDMS chamber from the mounting pins. Transfer the PDMS chamber to a clean glass surface (e.g., glass-bottomed dish).
7. Image each PDMS chamber using a fluorescence microscope. Acquire images in the DAPI channel to capture all nuclei and in the PI channel to capture membrane-compromised nuclei. Capture a 2 mm × 2 mm region in the central area of the 10 mm × 10 mm well. Save each channel as a separate .tif file using the naming convention: "SampleName_1.tif" for DAPI/Hoechst (nuclei) and "SampleName_2.tif" for PI. Place the paired images in the same folder.
8. Run PI_Cell_Quantification.m in MATLAB.
Note: Ensure the Image Processing Toolbox is installed.
9. When prompted, select any .tif file from the folder containing the paired Hoechst (nuclei) and PI images. The script will automatically detect and pair all images in that folder based on the naming convention.
10. The script normalizes the Hoechst (nuclei) images and generates binary nuclear masks to identify individual nuclei. Large clumps of cells and small debris are automatically removed based on area thresholds. The masks are displayed during processing for visual verification.
11. The cleaned nuclei mask is applied to the corresponding PI images to isolate nuclear regions. The mean PI fluorescence intensity is measured for each nucleus. The background PI intensity is calculated from non-nuclear regions. Nuclei are classified as PI-positive if their fluorescence intensity is greater than or equal to n times the background, where n is 1.25–1.5 and can be adjusted by the user.
12. The total number of nuclei and the number of PI-positive nuclei are recorded. The percentage of membrane-compromised cells is calculated using the formula:
13. The script automatically saves the results and file names into an Excel file in the same folder as the .tif images. Figures generated during processing, including the nuclei mask, PI overlay, and intensity histogram, are saved in a separate AnalysisFigures folder.
14. Higher %PI values indicate a greater degree of membrane damage. Review the saved figures to verify mask quality and correct identification of PI-positive nuclei.
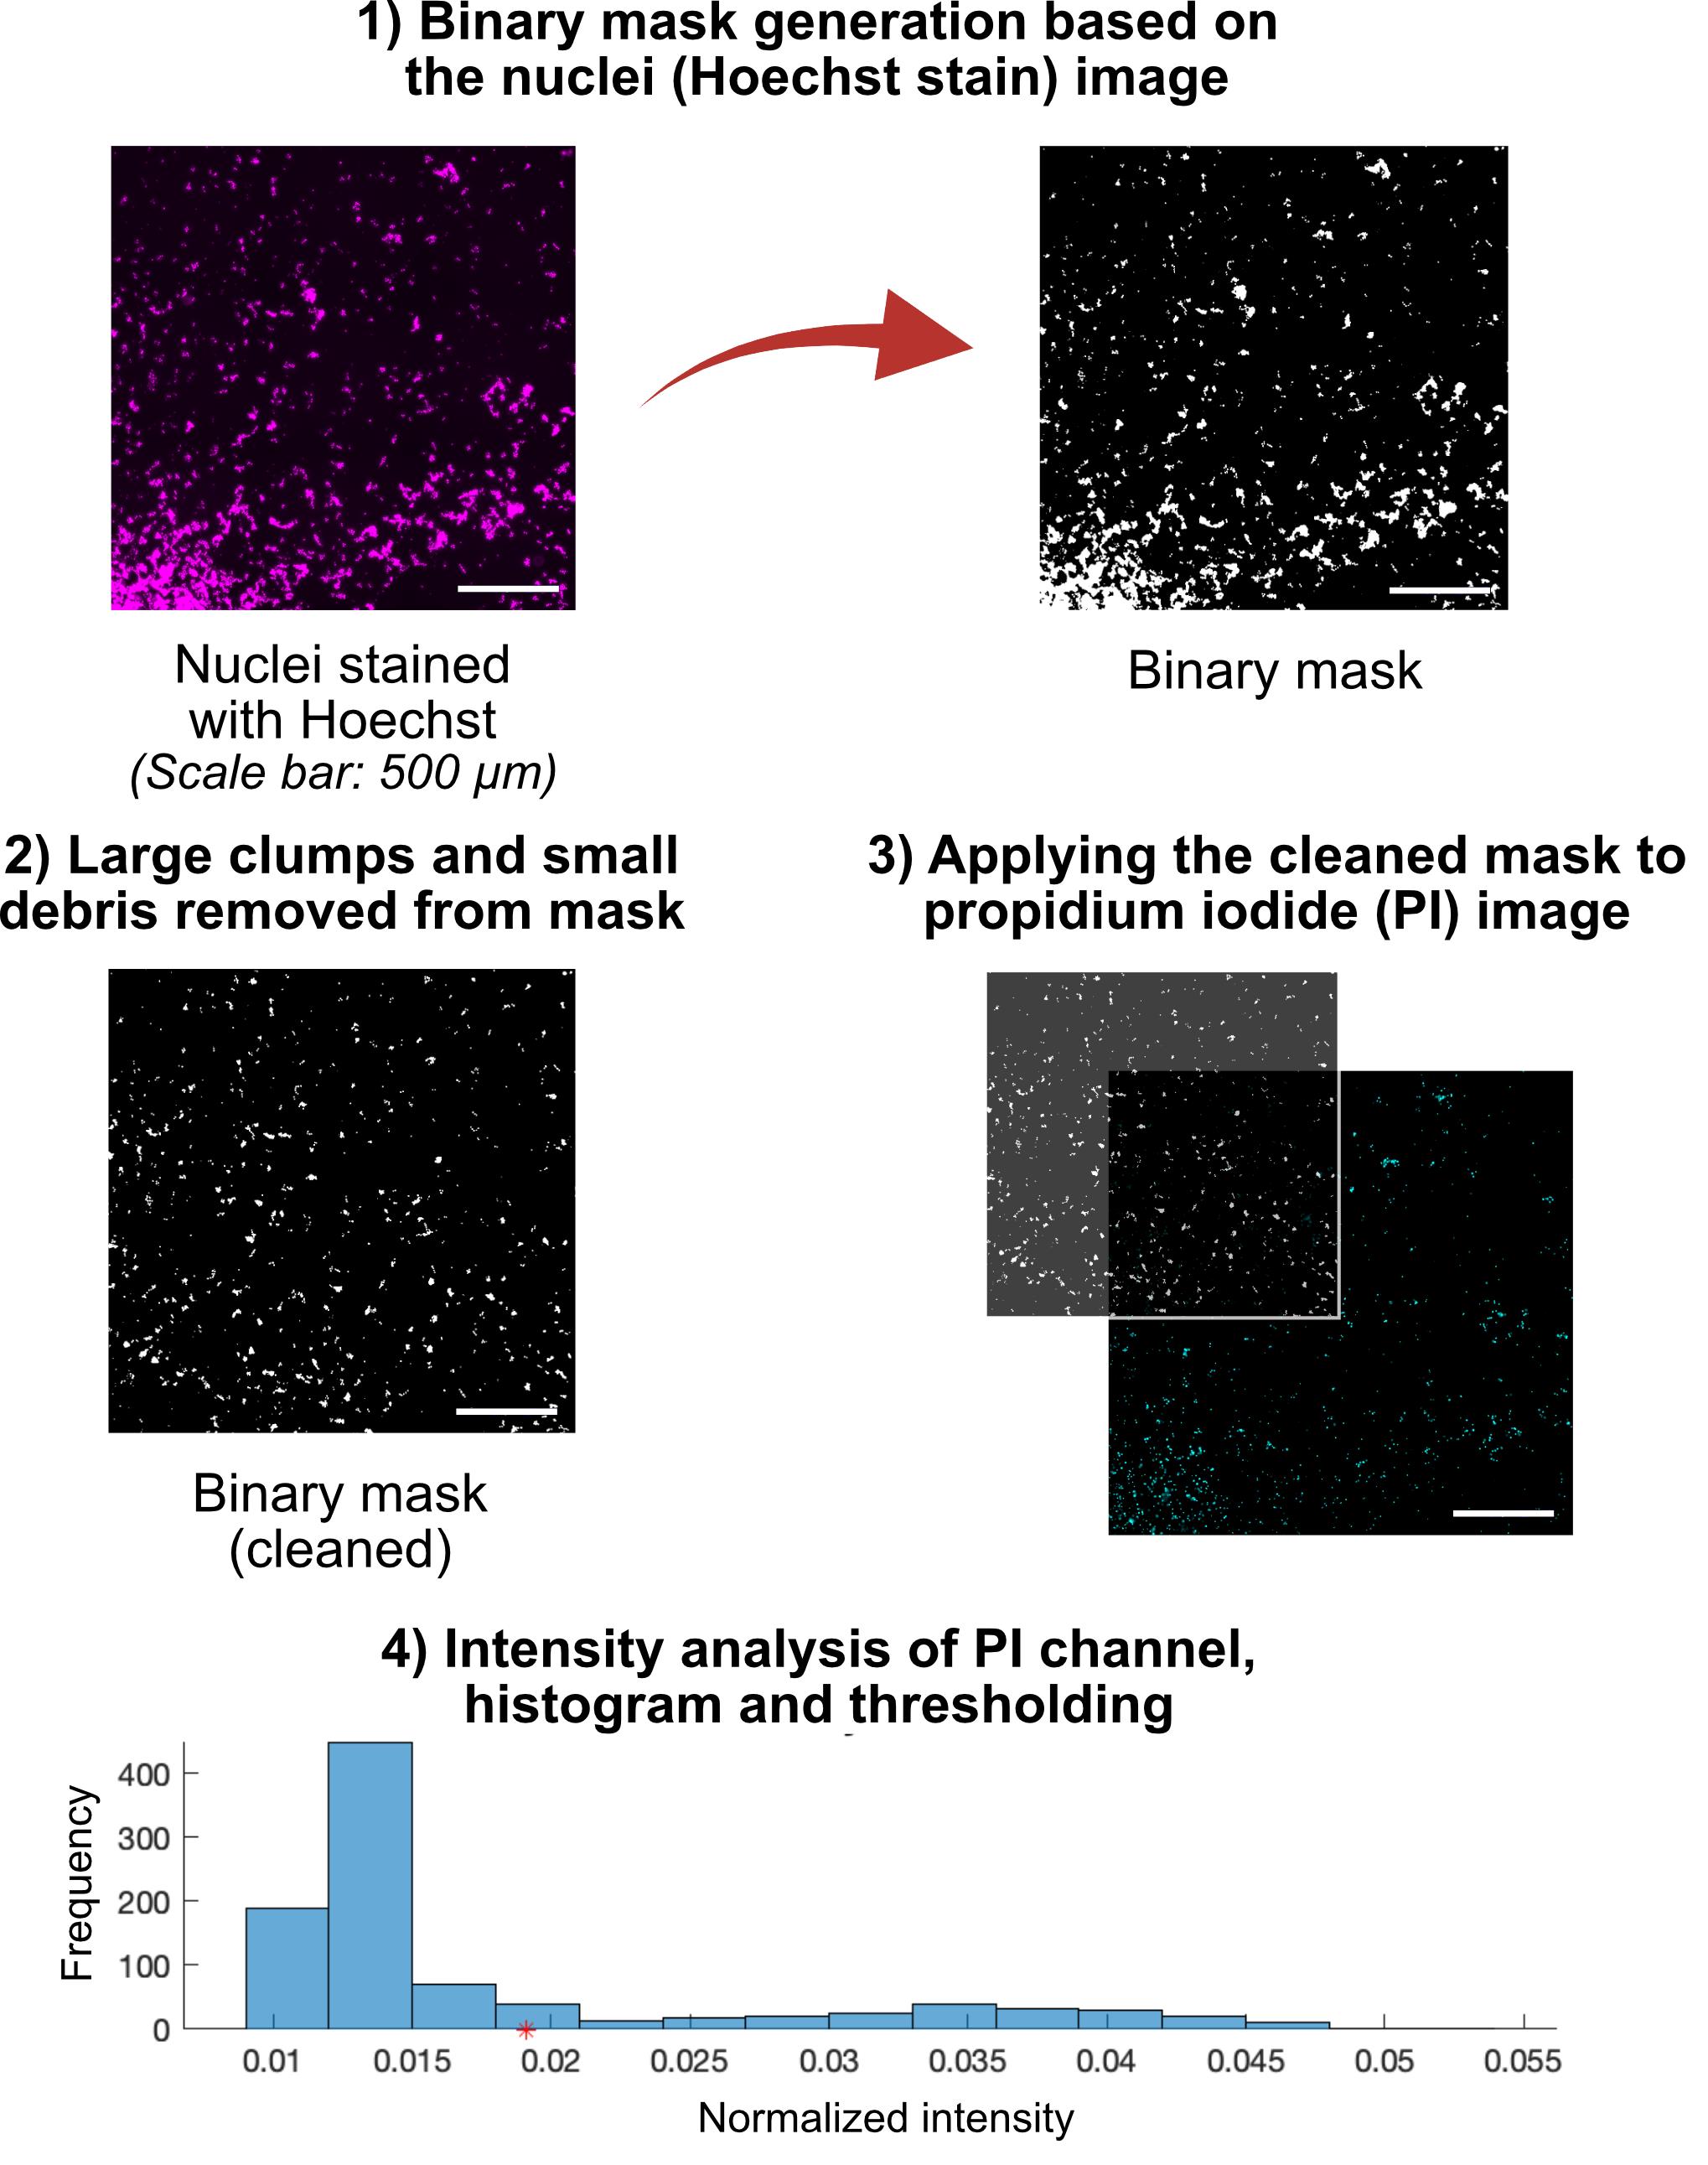
Figure 4. Workflow for quantification of membrane damage [% propidium iodide (PI)] in SH-SY5Y cells. The workflow begins with fluorescence images acquired from PDMS wells, with nuclei stained by Hoechst, and membrane-compromised cells labeled with PI. DAPI images are processed in MATLAB to generate binary nuclear masks, which are then applied to the corresponding PI images to isolate nuclei. Fluorescence intensity of each nucleus object is quantified, and PI-positive cells are defined as those with intensity ≥ threshold (marked by the red star shown on the x-axis of the histogram). The percentage of membrane-compromised cells (%PI) is calculated as the number of PI-positive nuclei divided by the total number of nuclei × 100.
Data analysis
As described in Kang et al. [12], each experiment was performed with a minimum of three biological replicates. %PI was reported as mean ± SEM. Data were plotted using bar graphs with scatter points or box-and-whisker plots, and statistical analysis was performed using GraphPad Prism or MATLAB. Data from damaged or artifact-containing chambers were excluded from analysis.
Validation of protocol
This protocol has been used and validated in the following research article:
Kang et al. [12]. Stabilizing microtubules increases acute cellular injury at high strain rates. Biophysical Journal. (Figures 1B–D, 2, 3D–F, 4D–G, 5D–F, and 6D–F)
Furthermore, to investigate how cyclic mechanical loading and recovery time influence membrane permeability, SH-SY5Y cells—both undifferentiated and RA-treated—were subjected to repeated stretch cycles at 30% strain and 10 s-1 strain rate (Figure 5). Membrane damage was quantified by PI staining immediately following loading. In undifferentiated SH-SY5Y cells, repeated loading without rest (5 consecutive cycles, interval time = 0 s) caused a marked increase in membrane permeability compared to single-cycle loading (p = 0.0106). Allowing short rest intervals between cycles reduced this effect (60 s: p = 0.0019 vs. 0 s interval; 600 s: p = 0.0002 vs. 0 s interval), approaching values comparable to single-cycle loading. In RA-treated (differentiated) cells, baseline membrane permeability was higher and increased substantially under cyclic loading without rest (5 cycles 0 s: p = 0.0053 vs. single-cycle). Similar to undifferentiated cells, resting intervals significantly mitigated the cumulative damage (60 s: p = 0.0016 vs. 0 s interval; 600 s: p = 0.0017 vs. 0 s interval). Overall, across all loading paradigms, RA-treated SH-SY5Y cells exhibited significantly higher membrane permeability compared to undifferentiated cells (significant main effect of p < 0.0001), consistent with their increased neurite outgrowth and associated cytoskeletal complexity. However, both cell populations showed a similar trend of decreasing %PI with longer recovery times, suggesting that transient membrane disruptions induced by mechanical strain can be partially repaired when sufficient time for recovery is provided. The data further support the concept that stretch-induced injury observed when following this protocol primarily reflects transient, reversible membrane damage rather than irreversible cell death (refer to Figure 1C in [12]).
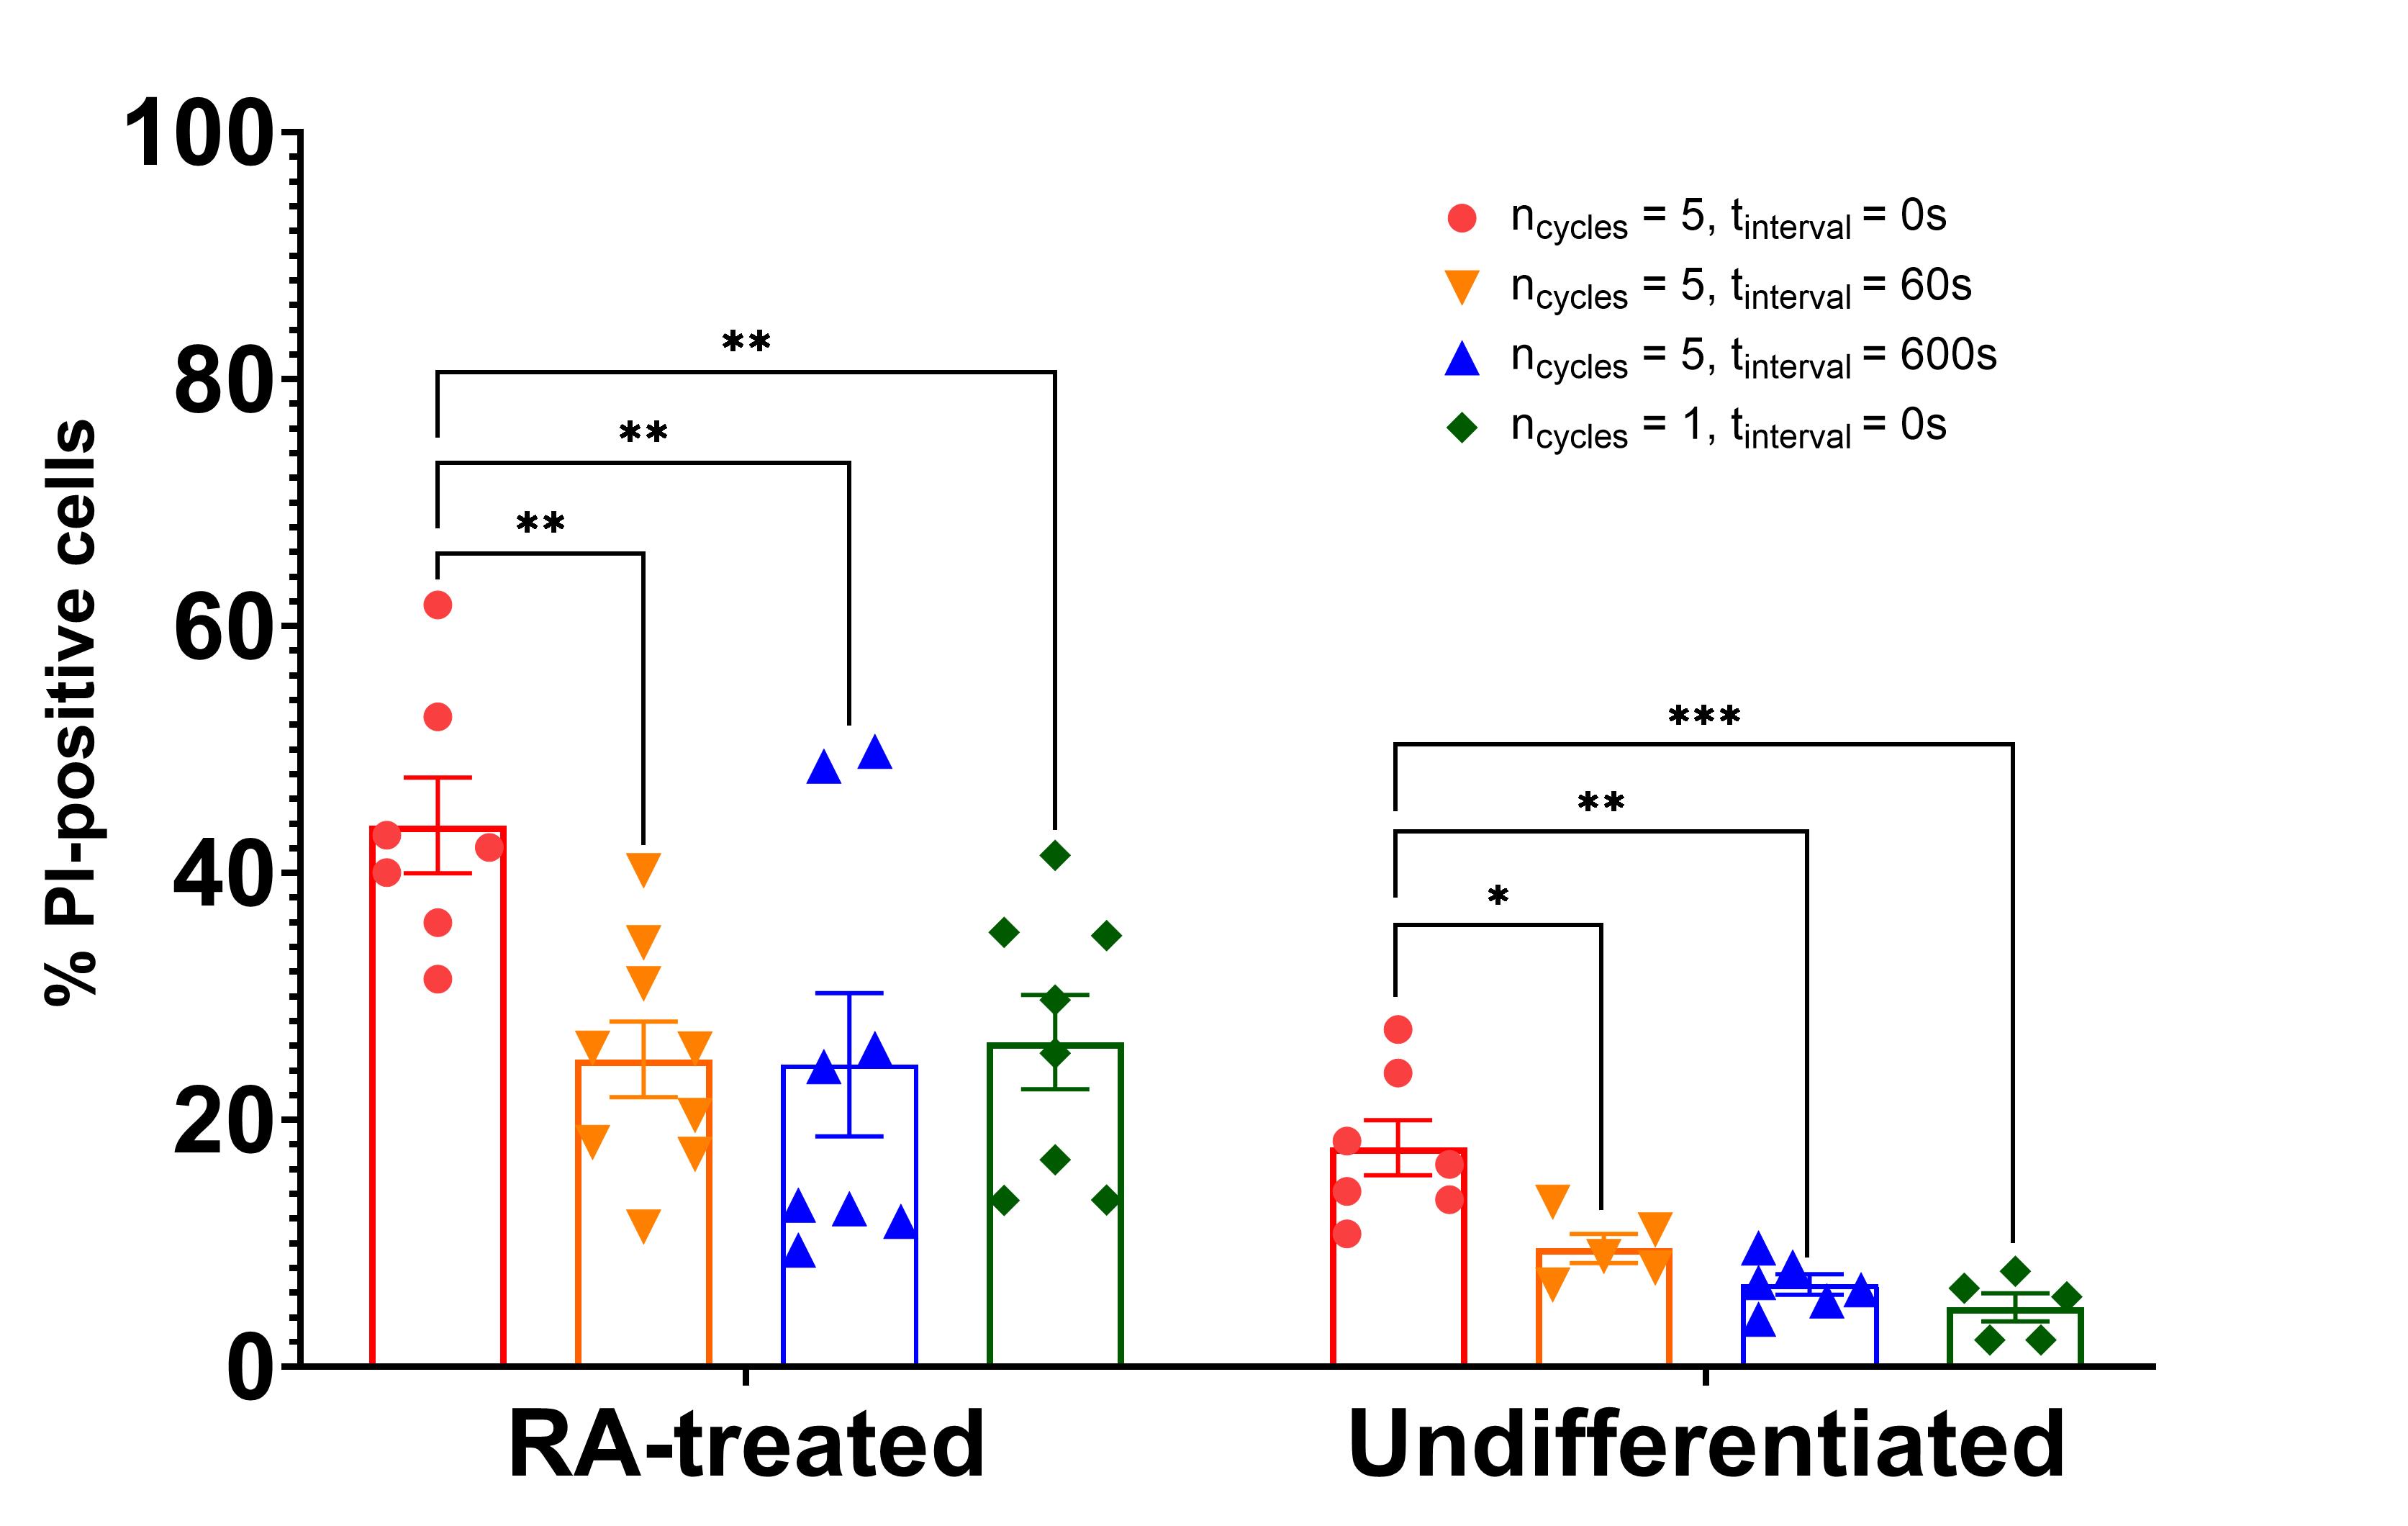
Figure 5. Effect of cyclic mechanical loading and rest intervals on membrane permeability in SH-SY5Y cells. Quantification of propidium iodide-positive (%PI) SH-SY5Y cells following uniaxial stretch at 30% strain and 10 s-1 strain rate under various cyclic loading conditions. Cells were either undifferentiated or RA-treated for 3 days prior to loading. Data are presented as mean ± SEM from a minimum of 5 independent replicates. Statistical significance was determined using two-way ANOVA followed by Tukey’s post hoc test. Allowing recovery intervals between stretch cycles significantly reduced membrane permeability, suggesting that mechanical recovery mechanisms mitigate cumulative damage during repeated deformation.
General notes and troubleshooting
General notes
1. RA is light-sensitive and unstable; always prepare fresh solutions immediately before use.
2. Differentiation efficiency may vary between cell lines and passages; maintain consistent culture conditions.
3. PDA coating enhances hydrophilicity and adhesion, but surfaces should be used within 12 h of coating for optimal performance.
4. Mechanical stretch parameters (strain magnitude, rate, duration) should be optimized for specific experimental goals.
5. Other adherent mammalian cell lines may be seeded onto PDMS using the procedure outlined in this protocol. Both NIH 3T3 cells and HEK293-derived cells have been tested and confirmed to adhere, spread, and grow robustly under these conditions. Users are encouraged to optimize cell seeding density and adhesion conditions for other cell types.
Troubleshooting
| Problem | Possible cause | Solution |
|---|---|---|
| Poor SH-SY5Y attachment on PDMS | Incomplete PDA coating or surface contamination | Ensure PDA solution is freshly prepared and chambers are fully coated; maintain sterility |
| Uneven PDMS surface or bubbles | Inadequate degassing or pouring technique | Degas PDMS properly and pour slowly in a circular motion to avoid bubbles |
| Low differentiation efficiency | High cell passage number or incorrect RA preparation | Use low-passage cells (< 20), prepare RA fresh, and protect from light |
| Substrate slippage during stretch | Improper PDMS mounting or insufficient bonding | Check clamps and ensure PDMS is firmly adhered; remove any firm backing layers |
| PDMS breakage | Excessive strain magnitude or rapid strain rate | Reduce strain percentage or apply more gradual stretching to prevent detachment |
Supplementary information
The following supporting information can be downloaded here:
1. Figure S1. Alternative configurations for the cell stretcher system.
2. Figure S2. Calibrating the Zaber voice-coil actuator for controlled strain rates.
3. Figure S3. Technical drawing of the custom-built cell stretcher system.
Acknowledgments
All authors contributed to the writing and preparation of the manuscript. This protocol is adapted from the original work by Kang et al. [12]. Research in [12] was sponsored by the U.S. Army Research Office and was accomplished under Grant Number W911NF-23-1-0390. The views and conclusions contained in this document are those of the authors and should not be interpreted as representing the official policies, either expressed or implied, of the Army Research Office or the U.S. Government. The U.S. Government is authorized to reproduce and distribute reprints for Government purposes, notwithstanding any copyright notation herein.
Competing interests
The authors declare no conflicts of interest.
References
- Taylor, C. A., Bell, J. M., Breiding, M. J. and Xu, L. (2017). Traumatic Brain Injury–Related Emergency Department Visits, Hospitalizations, and Deaths — United States, 2007 and 2013. MMWR Surveill Summ. 66(9): 1–16. https://doi.org/10.15585/mmwr.ss6609a1
- Akhtaruzzaman, R., Awad, K., Koster, A., Varanasi, V., Brotto, M. and Adnan, A. (2025). A mechanical model for lateral and axial impacts and quantification of effect on viability of SHSY5Y neuroblastoma cells. Sci Rep. 15(1): 19353. https://doi.org/10.1038/s41598-025-02165-x
- Bell, M. and Zempel, H. (2021). SH-SY5Y-derived neurons: a human neuronal model system for investigating TAU sorting and neuronal subtype-specific TAU vulnerability. Rev Neurosci. 33(1): 1–15. https://doi.org/10.1515/revneuro-2020-0152
- Skotak, M., Wang, F. and Chandra, N. (2012). An in vitro injury model for SH-SY5Y neuroblastoma cells: Effect of strain and strain rate. J Neurosci Methods. 205(1): 159–168. https://doi.org/10.1016/j.jneumeth.2012.01.001
- Xu, Z., Liu, Y., Yang, D., Yuan, F., Ding, J., Chen, H. and Tian, H. (2017). Sesamin protects SH-SY5Y cells against mechanical stretch injury and promoting cell survival. BMC Neurosci. 18(1): 57. https://doi.org/10.1186/s12868-017-0378-8
- Miranda, I., Souza, A., Sousa, P., Ribeiro, J., Castanheira, E. M. S., Lima, R. and Minas, G. (2021). Properties and Applications of PDMS for Biomedical Engineering: A Review. J Funct Biomater. 13(1): 2. https://doi.org/10.3390/jfb13010002
- Gokaltun, A., Yarmush, M. L., Asatekin, A. and Usta, O. B. (2017). Recent advances in nonbiofouling PDMS surface modification strategies applicable to microfluidic technology. Technology. 5(1): 1–12. https://doi.org/10.1142/s2339547817300013
- Chuah, Y. J., Koh, Y. T., Lim, K., Menon, N. V., Wu, Y. and Kang, Y. (2015). Simple surface engineering of polydimethylsiloxane with polydopamine for stabilized mesenchymal stem cell adhesion and multipotency. Sci Rep. 5(1): e1038/srep18162. https://doi.org/10.1038/srep18162
- Lee, H., Dellatore, S. M., Miller, W. M. and Messersmith, P. B. (2007). Mussel-Inspired Surface Chemistry for Multifunctional Coatings. Science. 318(5849): 426–430. https://doi.org/10.1126/science.1147241
- SH-SY5Y. CRL-2266 | ATCC. [accessed 2025 Oct 28]. https://www.atcc.org/products/crl-2266
- Blaber, J., Adair, B. and Antoniou, A. (2015). Ncorr: Open-Source 2D Digital Image Correlation Matlab Software. Exp Mech. 55(6): 1105–1122. https://doi.org/10.1007/s11340-015-0009-1
- Kang, G., Webster, E., Delgado, D., Holahan, M. R., Banton, R., Petel, O. E. and Harris, A. R.(2025). Stabilizing microtubules increases acute cellular injury at high strain rates. Biophys J. 124(23): 4321–4334. https://doi.org/10.1016/j.bpj.2025.10.024
Article Information
Publication history
Received: Nov 9, 2025
Accepted: Dec 18, 2025
Available online: Jan 7, 2026
Published: Feb 5, 2026
Copyright
© 2026 The Author(s); This is an open access article under the CC BY-NC license (https://creativecommons.org/licenses/by-nc/4.0/).
How to cite
Kang, G., Delgado, D., Petel, O. E. and Harris, A. R. (2026). Quantifying Mechanical Strain–Induced Membrane Damage in Early Neuronal Cells Using an In Vitro Traumatic Brain Injury Model. Bio-protocol 16(3): e5580. DOI: 10.21769/BioProtoc.5580.
Category
Mechanobiology
Neuroscience > Nervous system disorders > Animal model
Cell Biology > Tissue analysis > Injury model
Do you have any questions about this protocol?
Post your question to gather feedback from the community. We will also invite the authors of this article to respond.