- Protocols

- Articles and Issues
- For Authors
- About
- Become a Reviewer

Correcting Image Distortion in Expansion Microscopy Using 3D-Aligner
Published: Vol 16, Iss 2, Jan 20, 2026 DOI: 10.21769/BioProtoc.5568 Views: 756
Reviewed by: Olga KopachAnonymous reviewer(s)
Original research article
The authors used this protocol in:

Oct 2024
Advertisement


Protocol Collections
Comprehensive collections of detailed, peer-reviewed protocols focusing on specific topics


Related protocols

Abstract
Expansion microscopy (ExM) is an innovative and cost-effective super-resolution imaging technique that enables nanoscale visualization of biological structures using conventional fluorescence microscopes. By physically enlarging biological specimens, ExM circumvents the diffraction limit and has become an indispensable tool in cell biology. Ongoing methodological advances have further enhanced its spatial resolution, labeling versatility, and compatibility with diverse sample types. However, ExM imaging is often hindered by sample drift during image acquisition, caused by subtle movements of the expanded hydrogel. This drift can distort three-dimensional reconstruction, compromising both visualization accuracy and quantitative analysis. To overcome this limitation, we developed 3D-Aligner, an advanced and user-friendly image analysis software that computationally corrects sample drift in fluorescence microscopy datasets, including but not limited to those acquired using ExM. The algorithm accurately determines drift trajectories across image stacks by detecting and matching stable background features, enabling nanometer-scale alignment to restore structural fidelity. We demonstrate that 3D-Aligner robustly corrects drift across ExM datasets with varying expansion factors and fluorescent labels. This protocol provides a comprehensive, step-by-step workflow for implementing drift correction in ExM datasets, ensuring reliable three-dimensional imaging and quantitative assessment.
Key features
• 3D-Aligner precisely corrects sample drift in expansion microscopy (ExM) datasets, enabling reliable 3D reconstruction and robust quantitative analysis.
• Utilizes background feature detection and feature matching across z-planes to achieve nanoscale-precision drift correction.
• 3D-Speckler, which is a MATLAB-based software platform, offers a customizable and user-friendly interface.
• Outperforms conventional registration tools across varying expansion factors and labeling conditions and is equally applicable to non-ExM datasets.
Keywords: Expansion microscopy (ExM)Background
Fluorescence microscopy has become a cornerstone technique in biological research, enabling visualization of molecular structures and dynamic processes within cells and tissues. However, its optical resolution is fundamentally limited to approximately 250 nm laterally and 500 axially [1,2], leaving many subcellular structures unsolved. Although advanced super-resolution methods such as STED, SIM, STORM, and PALM have been developed to overcome this limitation, they often require specialized instrumentation, complex sample preparation, and intensive computational processing [1,3–5].
Expansion microscopy (ExM) provides a cost-effective and accessible alternative by physically enlarging biological specimens embedded in a swellable polyacrylamide-based hydrogel [5–7]. ExM improves the effective resolution in proportion to the expansion factor, enabling nanoscale visualization of cellular and tissue architecture using standard fluorescence microscopes [6,8–10]. Despite its simplicity and versatility, ExM imaging remains challenged by sample drift, primarily caused by subtle movements of the soft, water-rich hydrogel during three-dimensional (3D) image acquisition. Such drift introduces spatial distortions that degrade image quality and compromise the accuracy of quantitative analyses, particularly in large or highly expanded samples [7,11–13].
A variety of experimental approaches, such as poly-L-lysine coating, agarose embedding, and mechanical stabilization, have been explored to minimize drift. However, these methods often yield inconsistent results or introduce undesirable artifacts, including sample shrinkage or fluorescence loss [11–14]. Consequently, post-acquisition drift correction has emerged as a more reliable and noninvasive strategy to ensure accurate 3D reconstruction and quantitative measurement.
Existing software tools, including several ImageJ plugins [15,16], provide limited functionality for drift or distortion correction in ExM datasets. Most were originally designed for time-lapse image registration rather than z-stack alignment, and thus often require metadata modification, manual parameter tuning, or correlation-based alignment methods that lack the precision needed for quantitative ExM analysis.
To address this gap, we developed 3D-Aligner, a dedicated computational tool optimized for drift correction in 3D fluorescence microscopy datasets, and validated its performance, particularly using ExM images [14]. 3D-Aligner is fully integrated into our previously developed 3D-Speckler platform, designed for nanometer-scale particle analysis in fluorescence microscopy [2,17]. The 3D-Aligner software detects faint, nonspecific background fluorescence signals and applies a nearest-neighbor matching algorithm between adjacent z-planes to determine drift trajectories with nanometer precision. By relying on background features rather than biological structures, 3D-Aligner minimizes correction-induced artifacts and ensures unbiased alignment.
The tool offers a streamlined, user-friendly interface with customizable parameters for feature size, expected drift range, and channel selection. Users can visualize drift trajectories and corrected image stacks to facilitate downstream quantitative analysis. Benchmarking results demonstrate that the 3D-Aligner outperforms existing registration programs in both correction accuracy and reconstruction fidelity across diverse expansion factors and labeling conditions [14].
Beyond ExM, the 3D-Aligner can be applied to particle tracking, motion analysis, or distortion correction in other fluorescence microscope methods. We also demonstrated its capability to perform nanoscale particle tracking in live-cell imaging datasets. Overall, the 3D-Aligner provides a robust, accessible, and precise solution for drift correction, significantly enhancing the reliability of quantitative 3D imaging in expansion microscopy and related super-resolution methods. In this protocol, we present a detailed, step-by-step guide for configuring and using 3D-Aligner, illustrated with example drifted datasets from 4-fold expanded samples using the 4×3D-ExM method, which represents one of the most commonly used ExM approaches in a wide range of research fields [6].
Software and datasets
1. MATLAB (MathWorks, R2019-b and above, 10/1/2018, license required)
Note: For users who do not have access to a MATLAB license, we provide a standalone, executable application made through MATLAB compiler. The standalone 3D-Speckler (including the 3D-Aligner module) and user manual are available at the following website (Windows: https://drive.google.com/drive/folders/1om5kwV7qFZvelzwLzCHVQVjJ2BhD6Gts?usp=sharing and Mac: https://drive.google.com/drive/folders/1gaFIiaPas6SSCpkxSLYmIKGqqWjl1fpI?usp=sharing).
2. 3D-Speckler (including the 3D-Aligner module) (https://github.com/suzukilabmcardle/3D-Speckler or https://drive.google.com/drive/folders/15_nXhPmW60pvuuSI_lxOB-VsXEWtwGwD) (07/20/2024, publicly available) (see General note 1)
Procedure
This protocol describes a step-by-step operating workflow to the 3D-Aligner interface for correcting image distortion in expansion microscopy.
A. Installing 3D-Aligner
Install MATLAB (MathWorks, R2019-b and above), download 3D-Speckler, and add it to MATLAB path.
Note: If a MATLAB license is unavailable, use the standalone installer for Windows or Mac.
B. Workflow of 3D-Aligner
1. Open the 3D-Speckler program.
2. A File Explorer dialog will open, prompting the user to select an image stack for correction (see General note 2).
3. Once the image is loaded, 3D-Aligner will display a Channel Setup dialog where users can specify the color channel information. For most images, 3D-Aligner will automatically detect and import the lateral (XY) and axial (Z) scales. Verify the XY and Z scales for accurate drift correction. Manually enter them if metadata is not present in the images (see Figure 1).
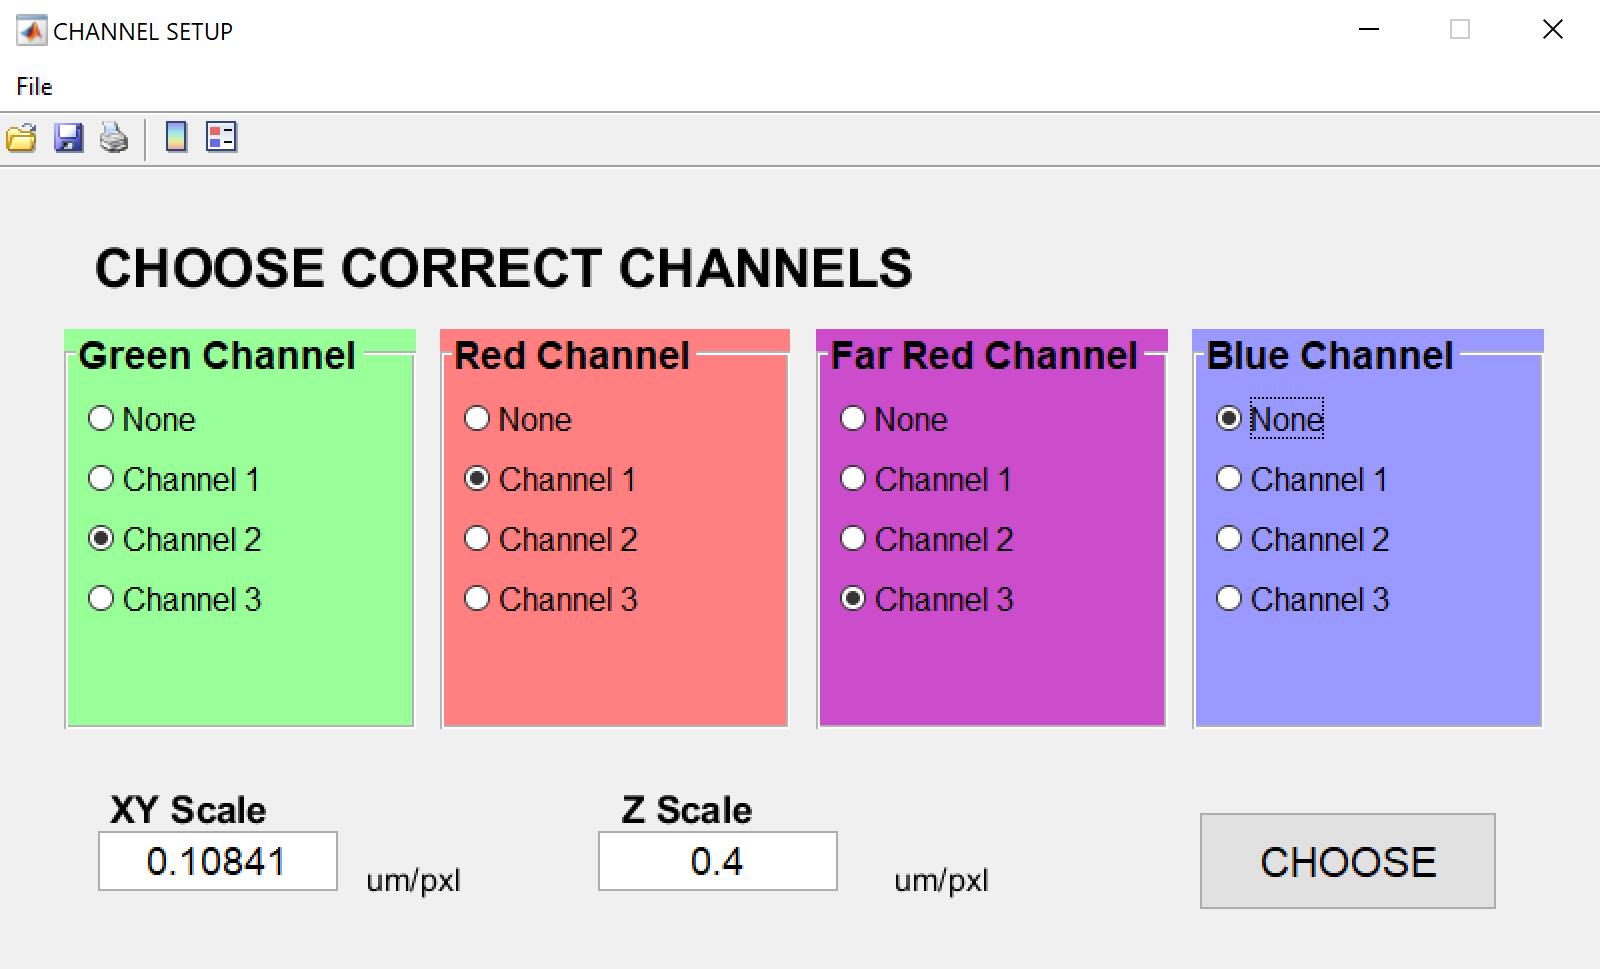
Figure 1. Channel setup dialog. After opening an image file, it will be displayed in the main window. The user should then review the wavelength information as well as the lateral and axial scales.
4. The program will proceed to the Main interface (see Figure 2), displaying the selected image stack. A detailed description of the user interface elements is provided below (see Figure 2a–g):
a. Open file: Allows users to import new image files for analysis.
b. Import Data: Enables users to load previously analyzed data for visualization (supported formats: *.xlsx, *.xls).
c. Import CA (chromatic aberration) Calibration: Allows users to import polynomial calibration surfaces or affine transformation calibrations to correct chromatic aberrations.
d. Channel Choice: Enables users to select specific channels to analyze or visualize.
e. Contrast Adjustment: Opens a pop-up window that allows users to adjust contrast for enhanced visualization.
f. Reset view: Resets the image zoom to its default (fully zoomed-out) level.
g. Package Option: Provides options for selecting an analysis pipeline, such as 3D-Aligner Drift Correction (see General note 3).
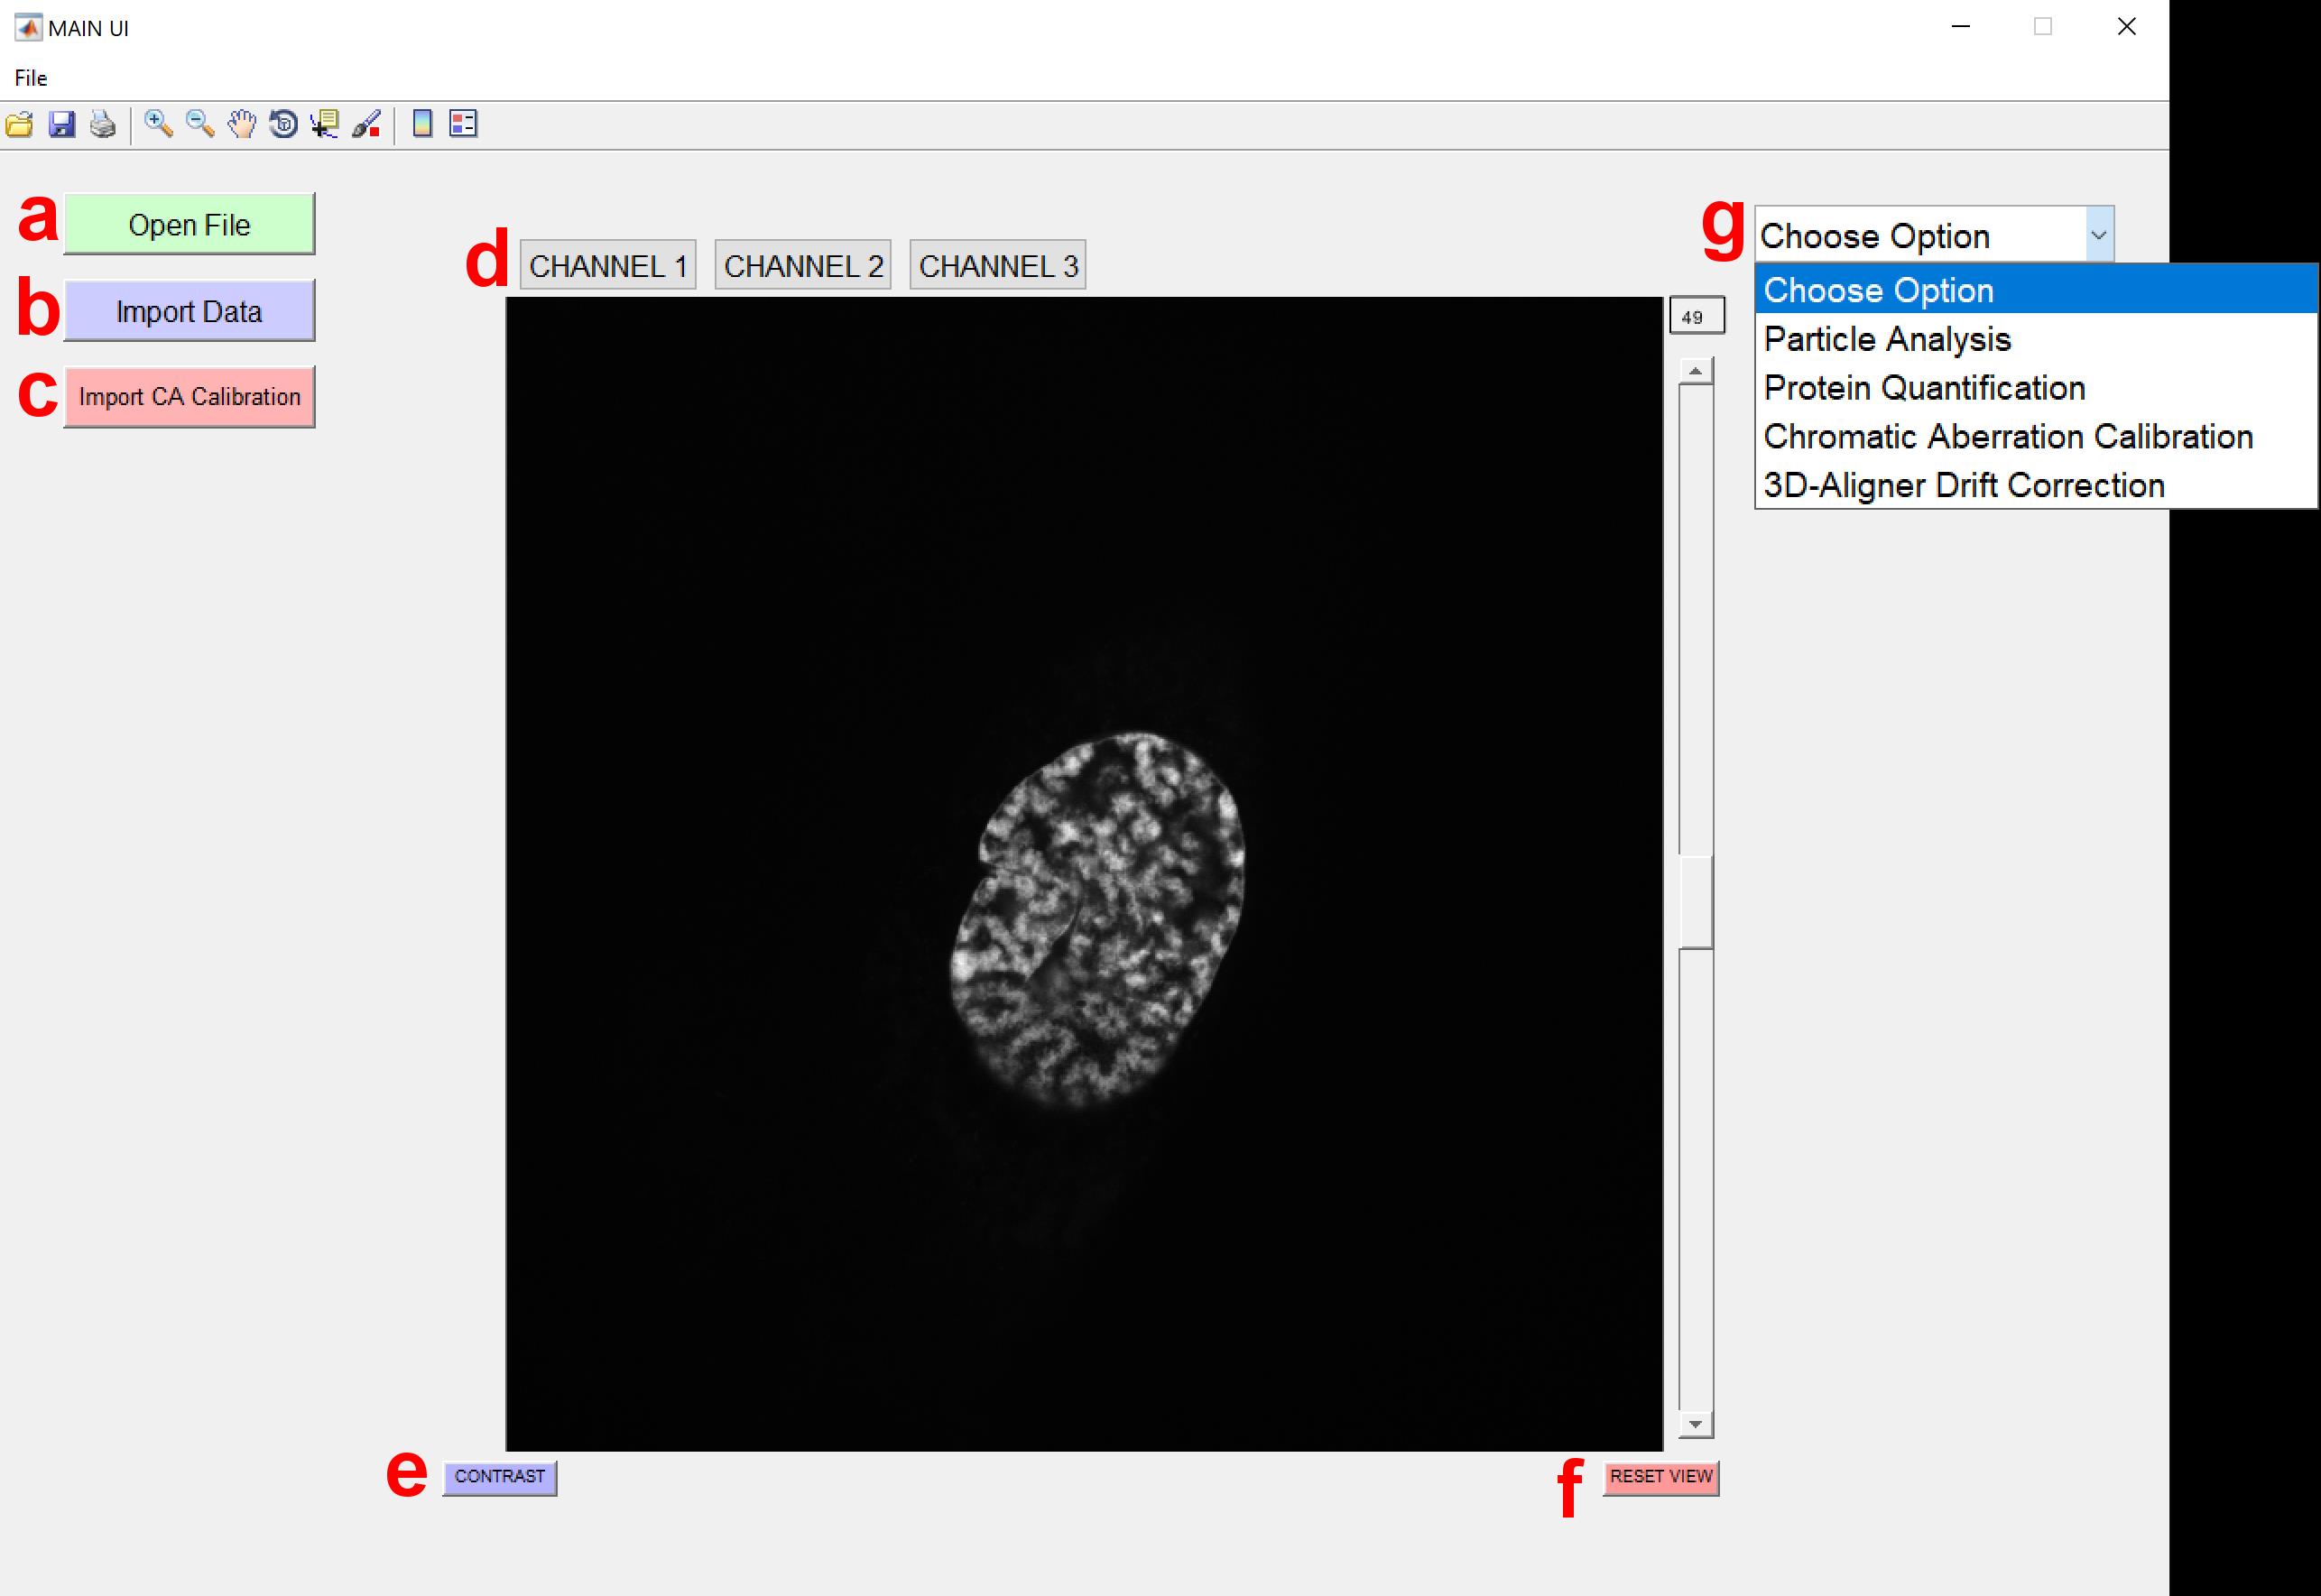
Figure 2. Main interface of the 3D-Speckler. This figure shows the primary user interface of the 3D-Speckler software with key elements labeled (a–g). The 3D-Aligner module can be selected from the Package Options.
5. Users can select the 3D-Aligner Drift Correction function from the Package Option dropdown menu on the top right (see Figure 2g). After selection of the 3D-Aligner Drift Correction package, new options and parameters will appear in the interface (see Figure 3a, b).
a. Feature Size Filter allows the user to specify which signals are considered features for drift determination based on their size.
Note: It is recommended to use a range of 10–60 px for most ExM images at the beginning of the analysis.
b. Selecting Determine Drift initiates drift calculation (see General note 4).
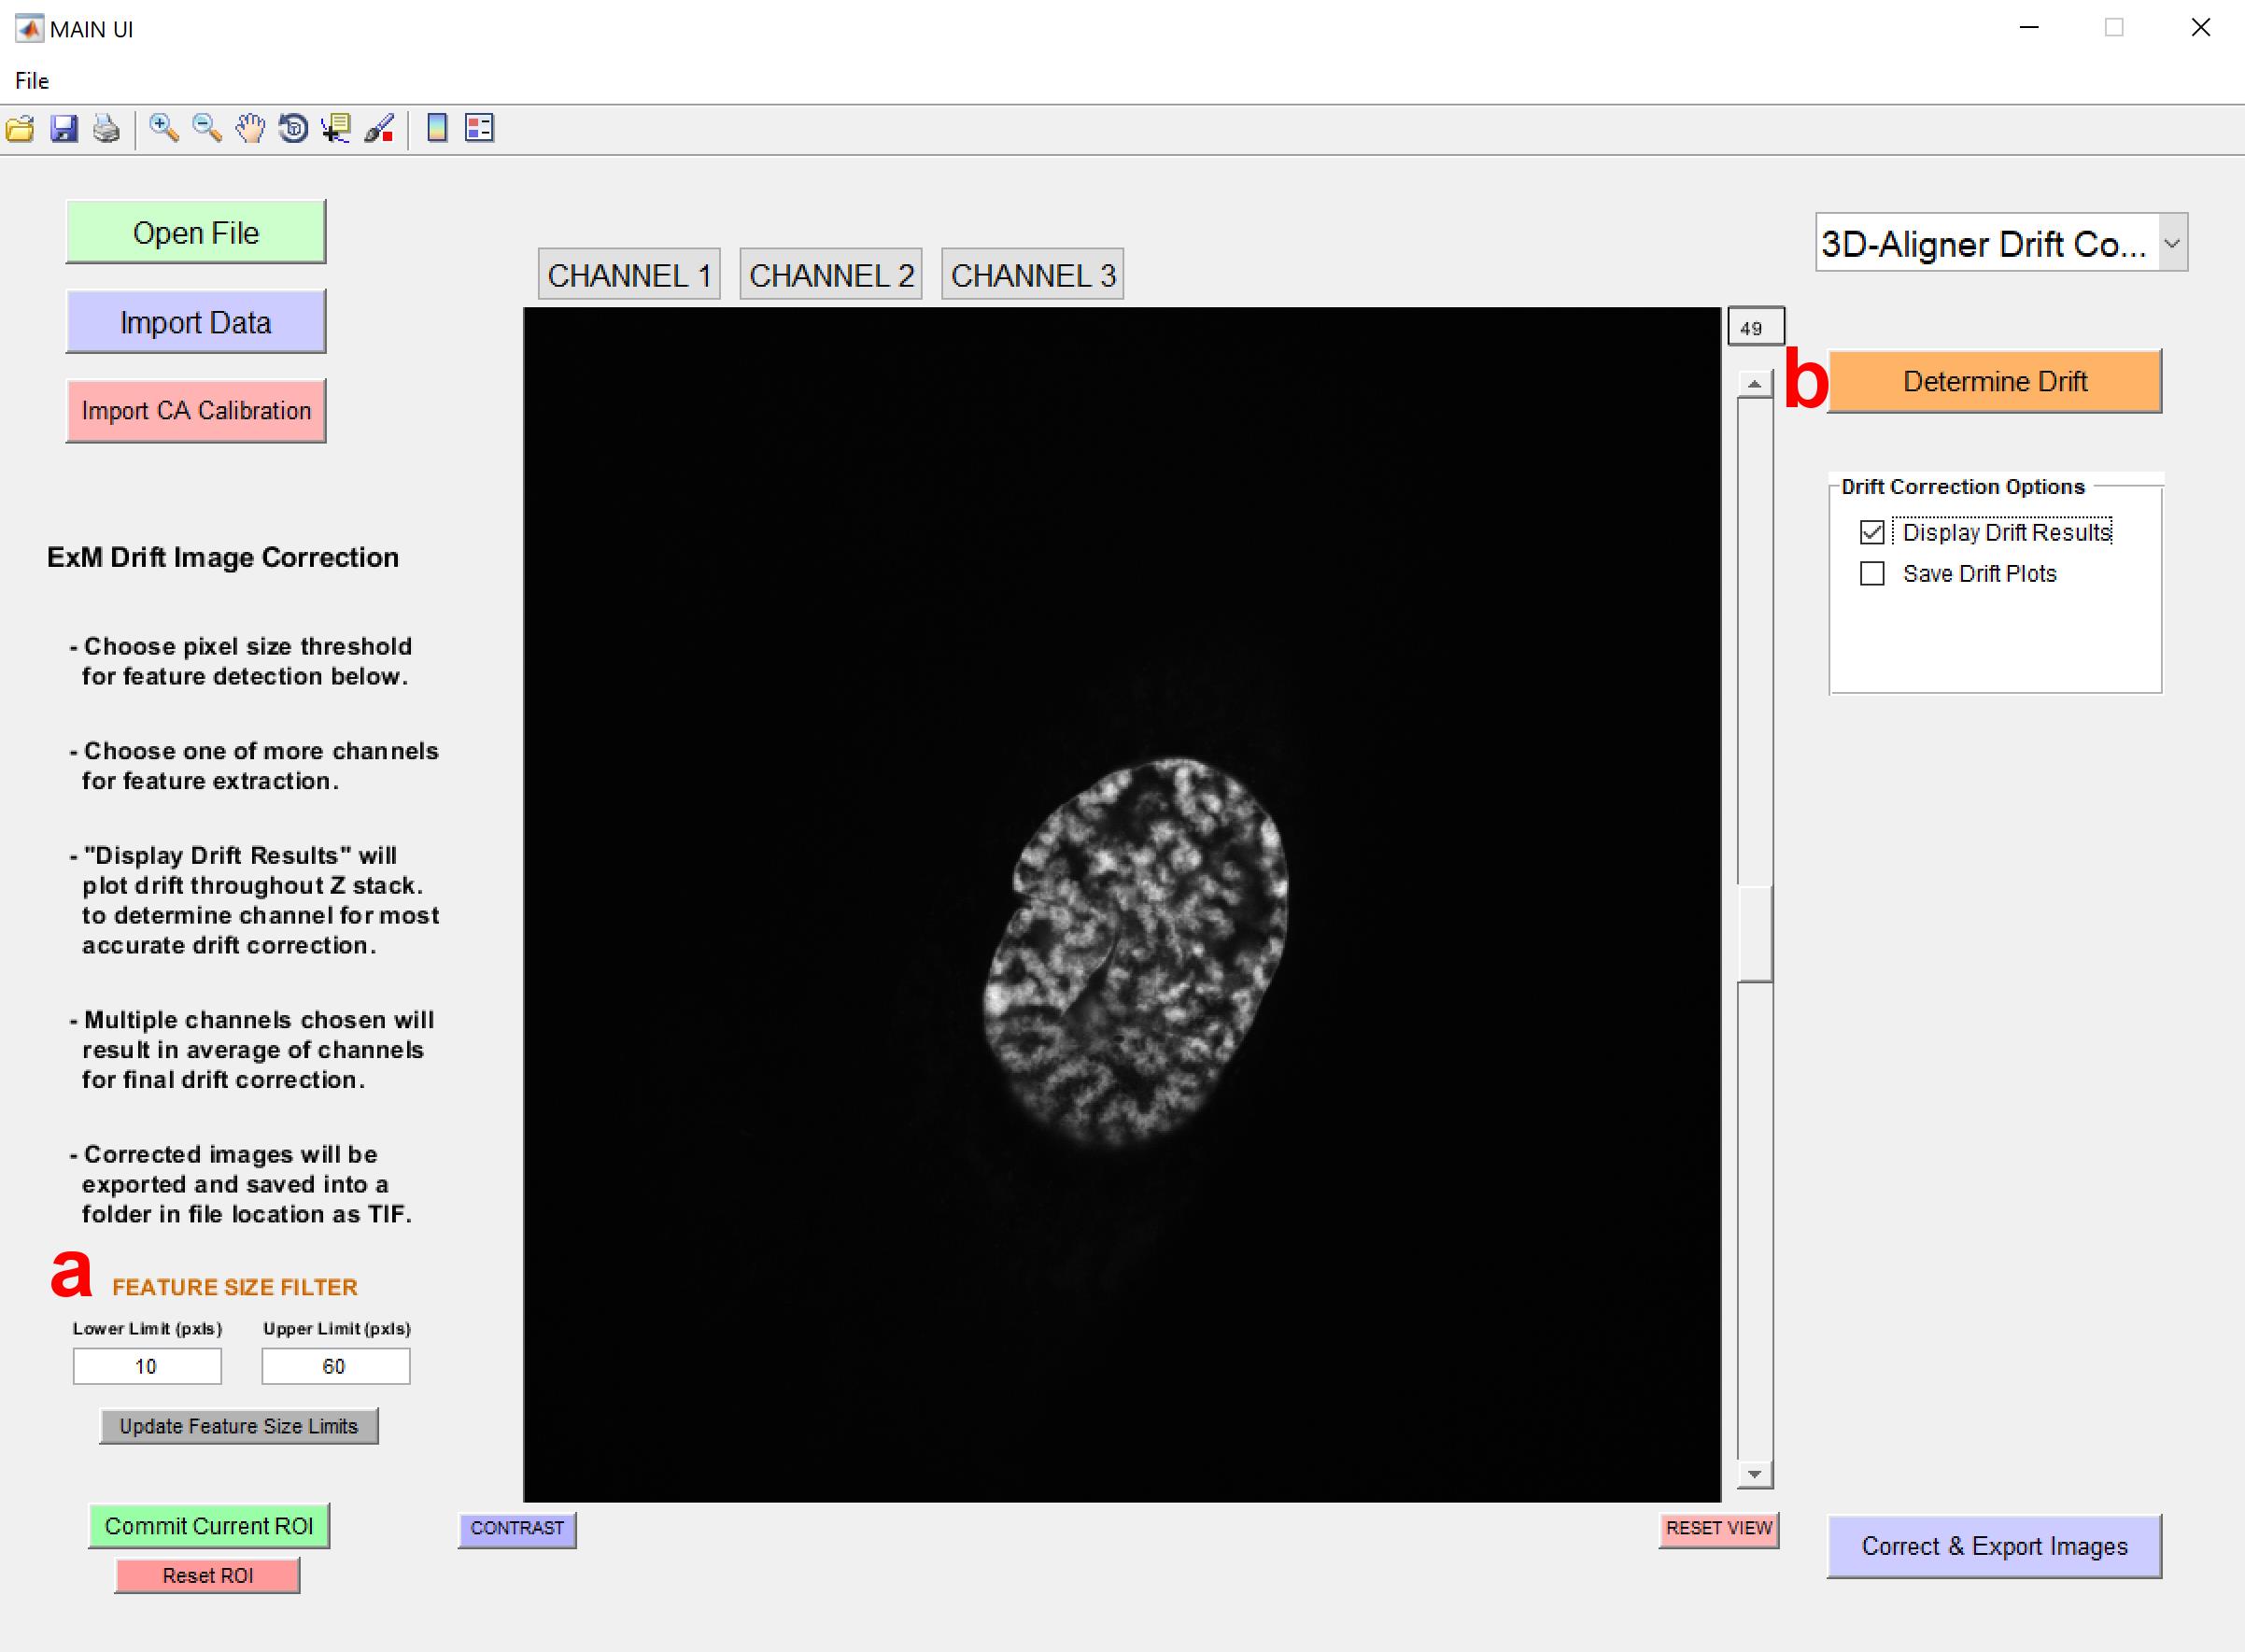
Figure 3. Main interface of the 3D-Aligner. After selecting the 3D-Aligner, the drift determination settings interface will appear. The user should then select the Feature Size Filter and Determine Drift options.
6. Before performing image correction, the program must first measure the drift present in the image. To do this, select Determine Drift. Optionally, enable the Display Drift Results checkbox to visualize the drift across z-slices in the form of a plot. The user may also enable the Save Drift Plots checkbox to store the generated drift visualization after the final export.
7. After clicking Determine Drift, a new dialog box will appear (see Figure 4), prompting the user to select the channel(s) to be used for drift determination. At least one channel must be selected.
Note: Since drift is determined based on the background signal, channels with background staining are preferred. Multiple channels can be selected; in this case, the drift values from all selected channels will be averaged (see General note 5).
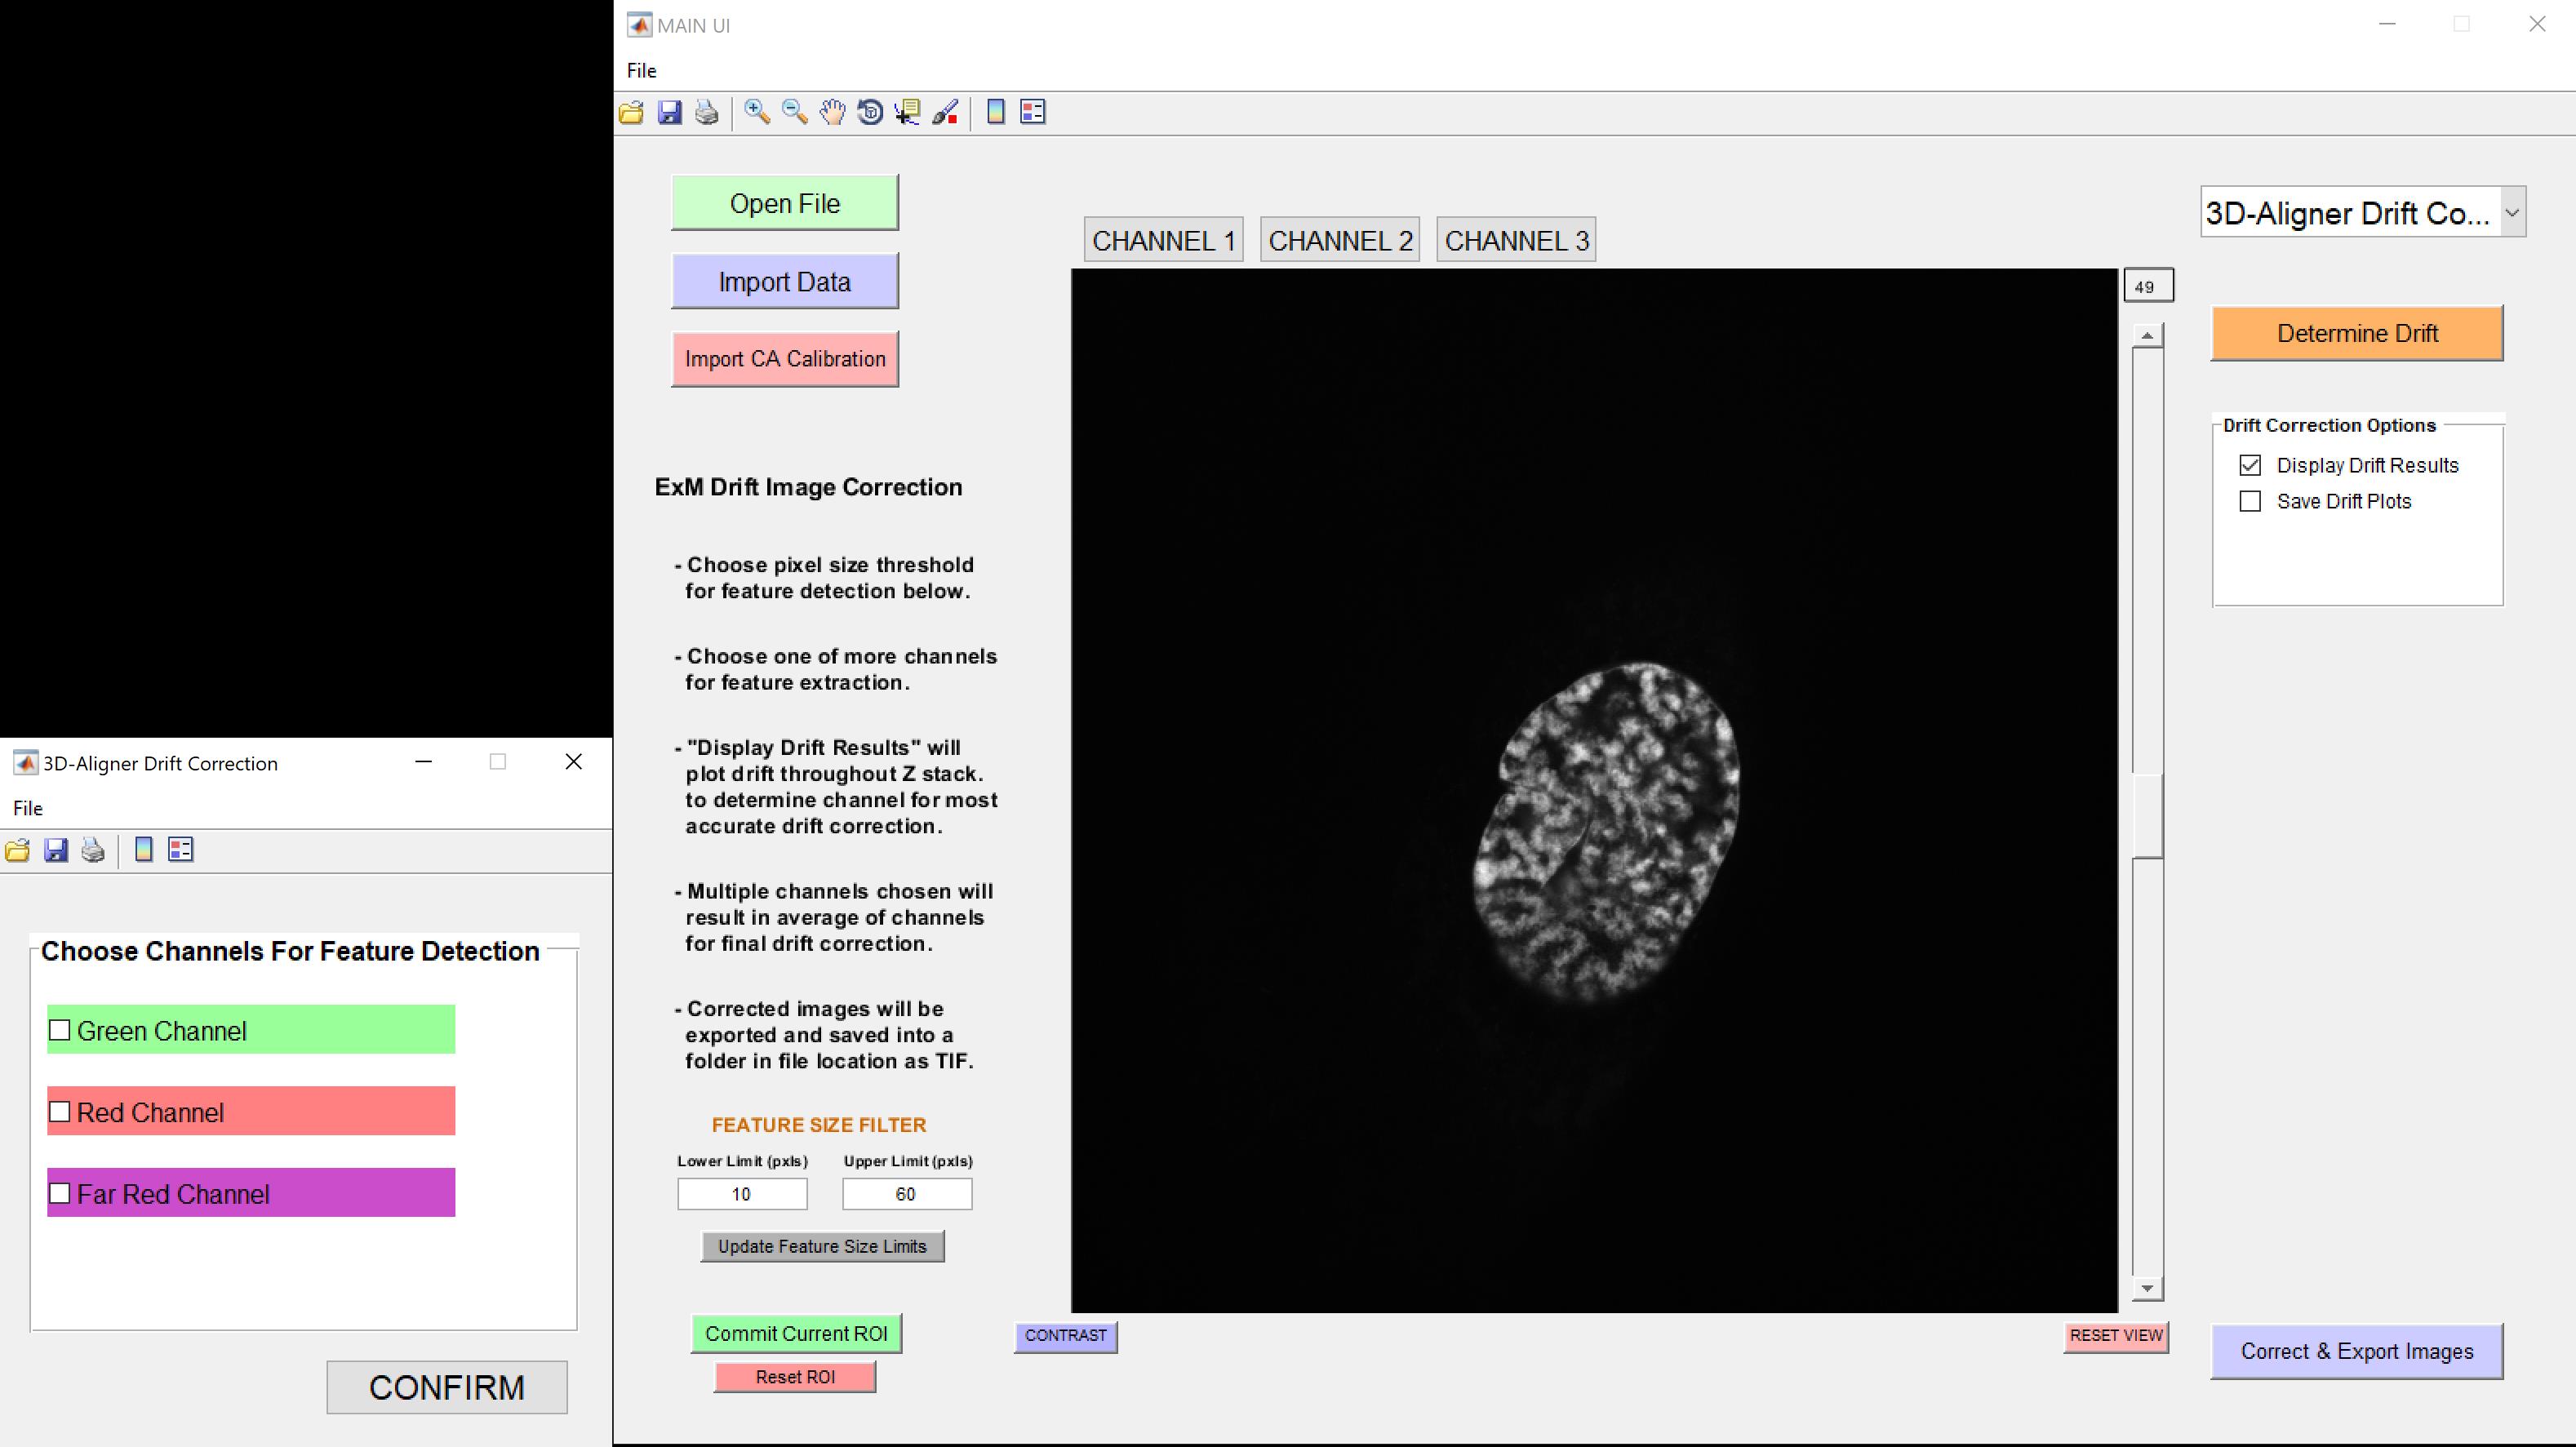
Figure 4. Choose channels for feature detection. Allows the user to select the channel(s) used for drift determination.
8. After selecting the channel for drift determination, a new dialog box will appear, prompting the user to specify the expected feature-matching distance between z-planes. Click OK to proceed.
Note: The default value is set to 10 px.
9. All pop-up windows will close, and the 3D-Aligner will begin processing in the background. If the Display Drift Result option was selected, a drift plot will appear once processing is complete (see Figure 5, top left). Review the plot, then close the window to continue.
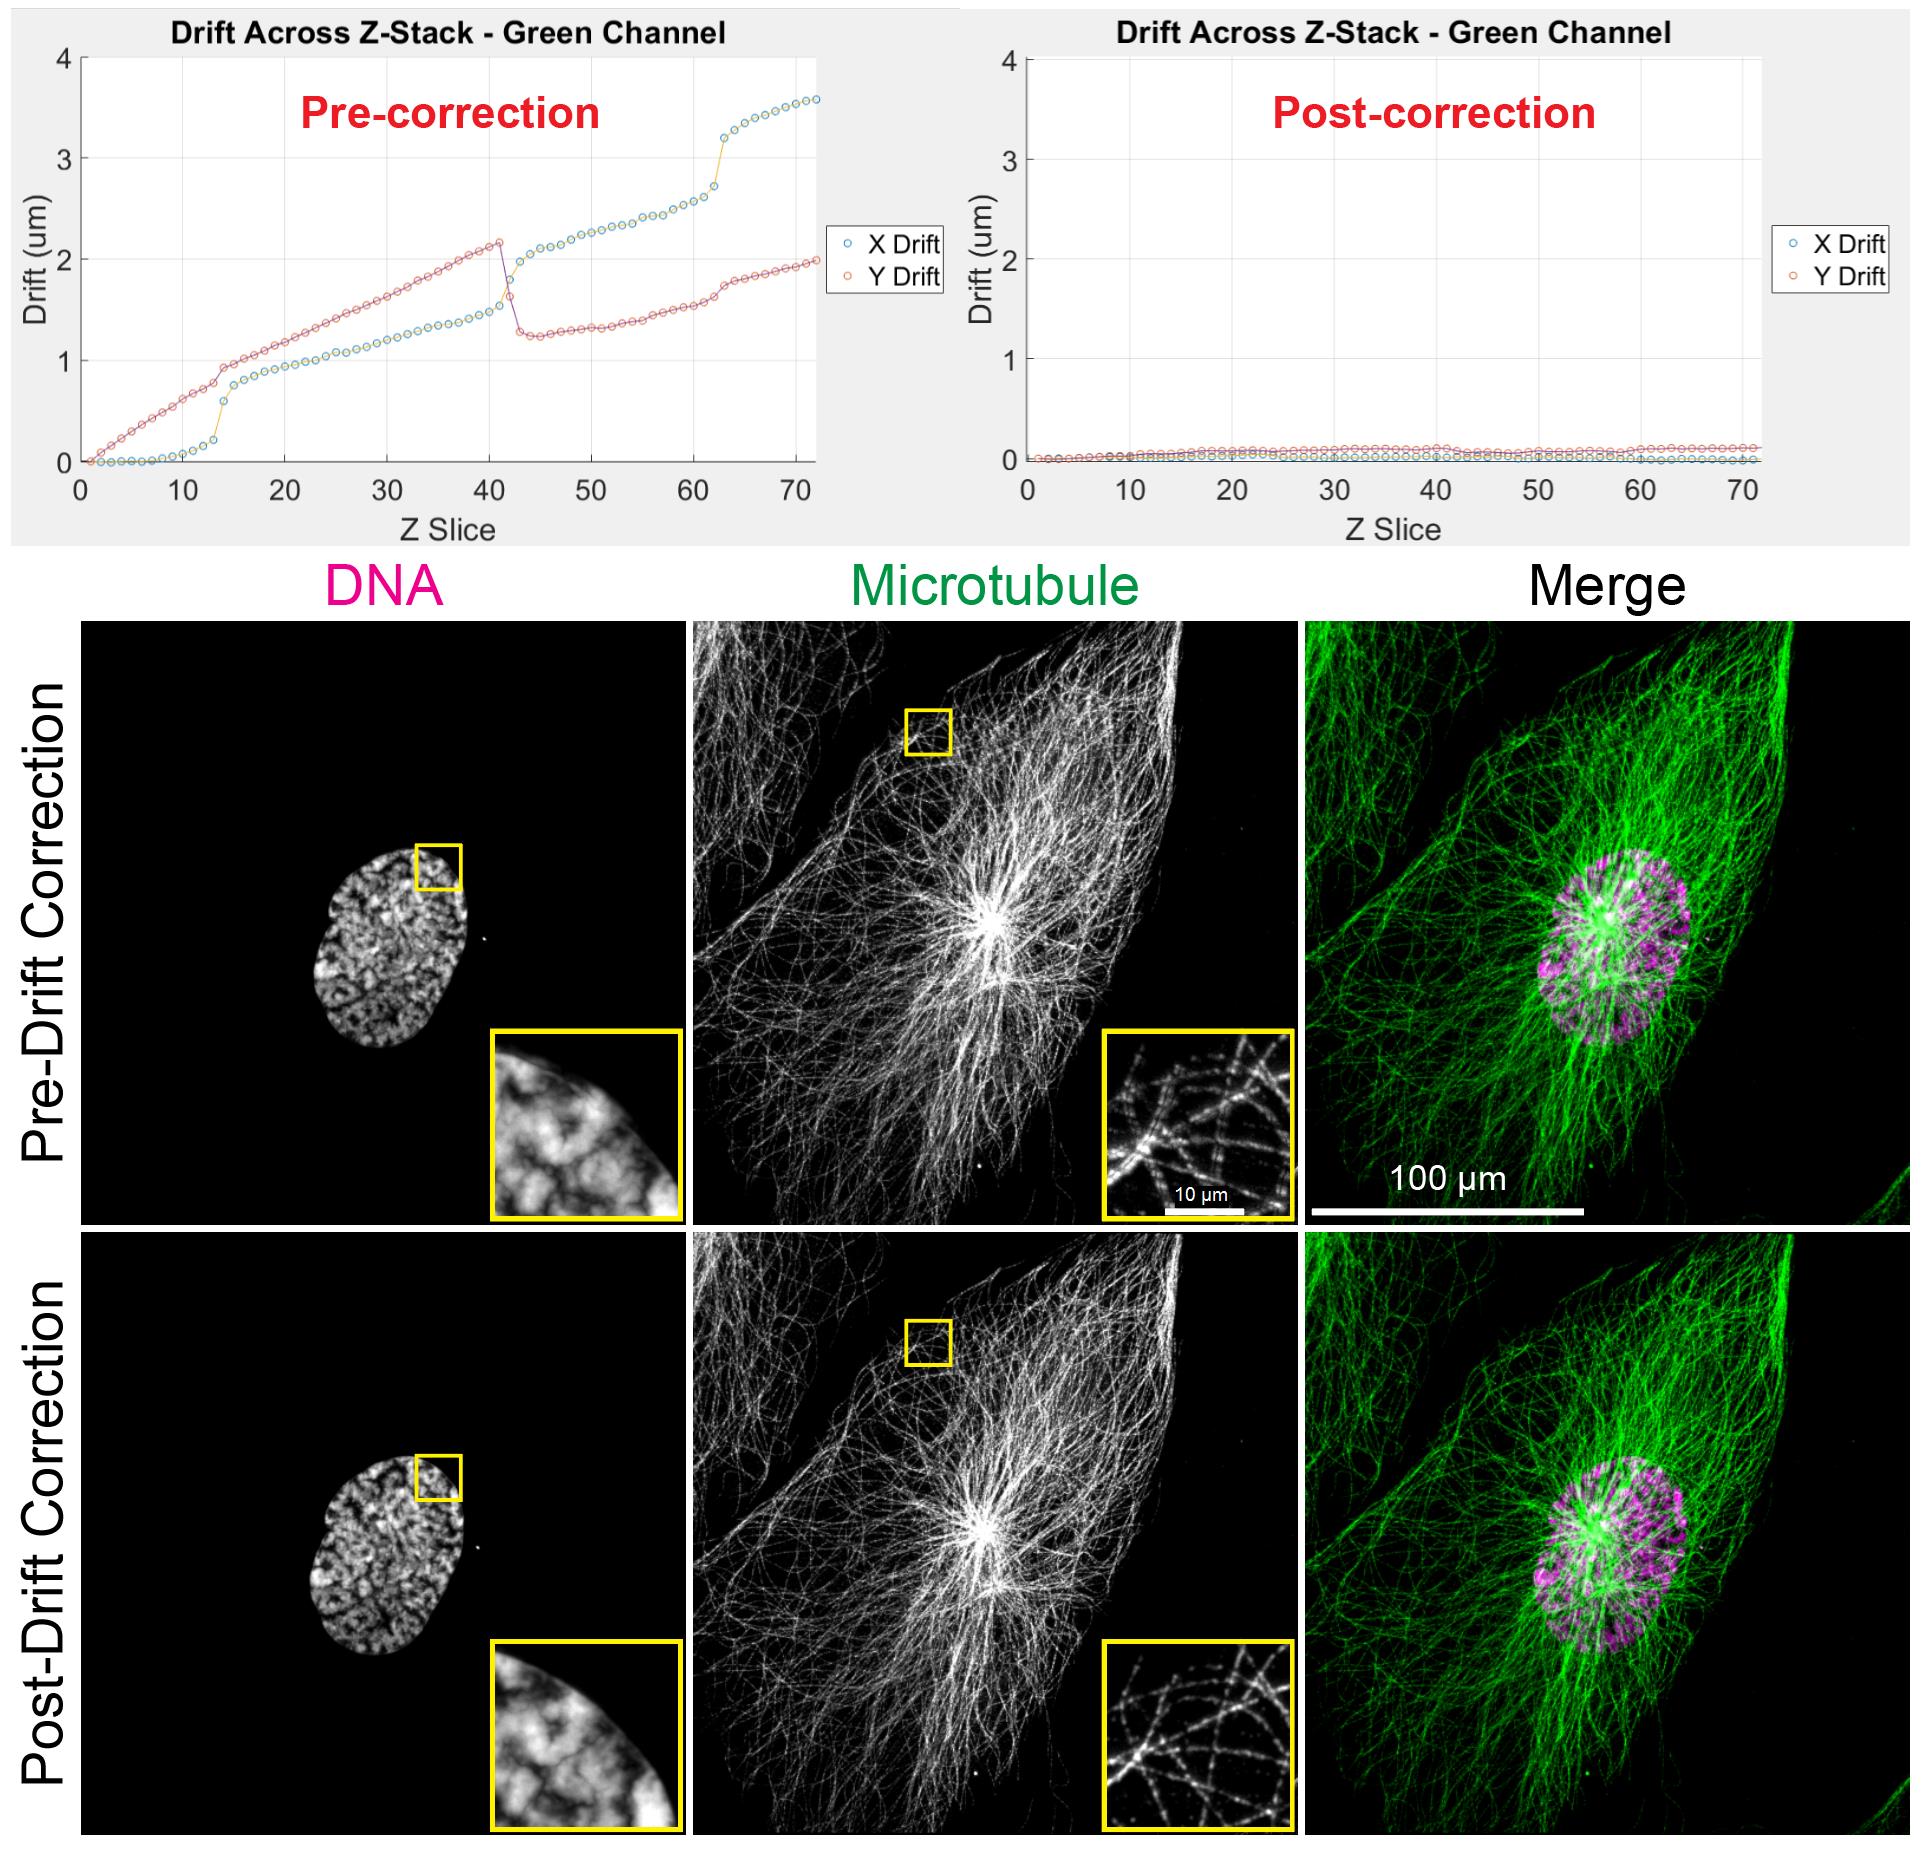
Figure 5. 3D-Aligner corrected image drift. Top: Drift determined before (left) and after (right) application of 3D-Aligner showing the correction of drift. Bottom: Maximum z-projection of 4×3D-ExM images before and after drift correction shows the correction of artifacts induced by the drifting sample.
10. After determining the drift, click the Correct and Export Images button in the bottom right corner of the 3D-Aligner main window to apply drift correction and save the processed images. The program will prompt the user to select the channel to be used for correction.
11. Next, the program will prompt the user to choose a location to save the corrected images. Examples of pre- and post-correction images are shown in Figure 5 (bottom).
Note: The corrected images will be saved as separate TIFF files for each color channel.
12. Once the images have been exported, you may close the 3D-Aligner application.
13. Users can perform drift detection using the corrected image stacks to evaluate distortion correction quality (see Figure 5, top right).
Validation of protocol
The 3D-Aligner software and its underlying 3D-Speckler platform have been used and validated in the following research articles:
Loi et al. [14]. 3D-Aligner: advanced computational tool for correcting image distortion in expansion microscopy. Communications Biology. (Figures 1–4).
Loi et al. [2]. Semi-automated 3D fluorescence speckle analyzer (3D-Speckler) for microscope calibration and nanoscale measurement. Journal of Cell Biology. (Figures 1–9).
Lin et al. [17]. Calibrating Fluorescence Microscopy With 3D-Speckler (3D Fluorescence Speckle Analyzer). Bio-protocol. (Figures 1–6)
General notes and troubleshooting
General notes
1. The Google Drive link includes an example drifted image stack from a 12-fold expanded sample using the 12× 3D-ExM method [6], which can be freely downloaded and used to test 3D-Aligner.
2. The user may need to shorten image file names before importing into 3D-Aligner. The permitted file name length depends on the total image size. Most image formats can be opened in 3D-Aligner, as it utilizes Bio-Formats [18]; however, if a file cannot be opened, please convert the images to TIFF format.
3. There are other analysis options (Particle Analysis and CA correction) that can be used, and detailed information can be seen in previous manuscripts [2,17].
4. Accurate feature matching may fail when the spacing between features within a z-slice is smaller than the drift displacement. To mitigate this issue, users may adjust the feature-size filter to isolate an appropriate subset of background features. As a starting point, we recommend a feature-size range of 10–45 for 4× ExM images and 10–60 for higher expansion factors (e.g., 12× ExM).
5. The 3D-Aligner is not inherently constrained by pixel size, total z-depth, step size, or dataset types (including but not limited to non-ExM images, ExM images, and live-imaging datasets). The only essential prerequisite is the presence of background staining or other stable structural features that can be detected and used as correspondence across adjacent z-slices; this requirement may impose practical limitations on some imaging parameters. Channels with minimal background signal, such as those labeled with DNA dye, may have difficulty providing accurate drift estimation. In contrast, channels with immunofluorescent labeling generally perform well, as they tend to produce nonspecific background signals across entire cells, facilitating reliable feature matching. Therefore, we recommend including at least one immunofluorescently labeled channel when possible, as drift determined from this channel can then be applied to all other channels, in cases where those channels lack the adequate background signal for accurate drift detection.
Acknowledgments
1) Author contributions: Conceptualization, A.S.; Investigation, WY.H. and D.G.; Writing—Original Draft, WY.H. and A.S.; Writing—Review & Editing, WY.H., D.G., and A.S.; Funding acquisition, A.S.; Supervision, A.S. 2) Funding: Part of this work was supported by the Wisconsin Partnership Program, Research Forward initiative from the University of Wisconsin-Madison, Office of the Vice Chancellor for Research with funding from the Wisconsin Alumni Research Foundation, Big Data Challenge from the Wisconsin Alumni Research Foundation, start-up funding from University of Wisconsin-Madison SMPH, UW Carbone Cancer Center, and McArdle Laboratory for Cancer Research, and NIH grant R35GM147525 (to A.S.). 3) Original research paper: Loi et al., Communications Biology, 2024 [14]. 4) Additional acknowledgements: We would like to thank Dr. Jonathan Loi for his contribution to the development of the original 3D-Aligner software package.
Competing interests
The authors declare no conflicts of interest within this work.
References
- Hell, S. W. and Wichmann, J. (1994). Breaking the diffraction resolution limit by stimulated emission: stimulated-emission-depletion fluorescence microscopy. Opt Lett. 19(11): 780. https://doi.org/10.1364/ol.19.000780
- Loi, J., Qu, X. and Suzuki, A. (2023). Semi-automated 3D fluorescence speckle analyzer (3D-Speckler) for microscope calibration and nanoscale measurement. J Cell Biol. 222(4): e202202078. https://doi.org/10.1083/jcb.202202078
- Davidovits, P. and Egger, M. D. (1971). Scanning Laser Microscope for Biological Investigations. Appl Opt. 10(7): 1615. https://doi.org/10.1364/ao.10.001615
- Fish, K. N. (2009). Total Internal Reflection Fluorescence (TIRF) Microscopy. Curr Protoc Cytom. Chapter 12, Unit12.18. https://doi.org/10.1002/0471142956.cy1218s50
- Wassie, A. T., Zhao, Y. and Boyden, E. S. (2019). Expansion microscopy: principles and uses in biological research. Nat Methods. 16(1): 33–41. https://doi.org/10.1038/s41592-018-0219-4
- Norman, R. X., Chen, Y. C., Recchia, E. E., Loi, J., Rosemarie, Q., Lesko, S. L., Patel, S., Sherer, N., Takaku, M., Burkard, M. E., et al. (2024). One step 4× and 12× 3D-ExM enables robust super-resolution microscopy of nanoscale cellular structures. J Cell Biol. 224(2): e202407116. https://doi.org/10.1083/jcb.202407116
- Zwettler, F. U., Reinhard, S., Gambarotto, D., Bell, T. D. M., Hamel, V., Guichard, P. and Sauer, M. (2020). Molecular resolution imaging by post-labeling expansion single-molecule localization microscopy (Ex-SMLM). Nat Commun. 11(1): 3388. https://doi.org/10.1038/s41467-020-17086-8
- Chen, F., Wassie, A. T., Cote, A. J., Sinha, A., Alon, S., Asano, S., Daugharthy, E. R., Chang, J. B., Marblestone, A., Church, G. M., et al. (2016). Nanoscale imaging of RNA with expansion microscopy. Nat Methods. 13(8): 679–684. https://doi.org/10.1038/nmeth.3899
- Ku, T., Swaney, J., Park, J. Y., Albanese, A., Murray, E., Cho, J. H., Park, Y. G., Mangena, V., Chen, J., Chung, K., et al. (2016). Multiplexed and scalable super-resolution imaging of three-dimensional protein localization in size-adjustable tissues. Nat Biotechnol. 34(9): 973–981. https://doi.org/10.1038/nbt.3641
- Tsanov, N., Samacoits, A., Chouaib, R., Traboulsi, A. M., Gostan, T., Weber, C., Zimmer, C., Zibara, K., Walter, T., Peter, M., et al. (2016). smiFISH and FISH-quant – a flexible single RNA detection approach with super-resolution capability. Nucleic Acids Res. 44(22): e165–e165. https://doi.org/10.1093/nar/gkw784
- Asano, S. M., Gao, R., Wassie, A. T., Tillberg, P. W., Chen, F. and Boyden, E. S. (2018). Expansion Microscopy: Protocols for Imaging Proteins and RNA in Cells and Tissues. Curr Protoc Cell Biol. 80(1): e56. https://doi.org/10.1002/cpcb.56
- Bissen, D., Kracht, M. K., Foss, F. and Acker-Palmer, A. (2022). Expansion microscopy of mouse brain organotypic slice cultures to study protein distribution. STAR Protoc. 3(3): 101507. https://doi.org/10.1016/j.xpro.2022.101507
- Gao, R., Asano, S. M. and Boyden, E. S. (2017). Q&A: Expansion microscopy. BMC Biol. 15: 50. https://doi.org/10.1186/s12915-017-0393-3
- Loi, J., Ghone, D., Qu, X. and Suzuki, A. (2024). 3D-Aligner: advanced computational tool for correcting image distortion in expansion microscopy. Commun Biol. 7(1): 1325. https://doi.org/10.1038/s42003-024-07035-2
- Parslow, A., Cardona, A. and Bryson-Richardson, R. J. (2014). Sample Drift Correction Following 4D Confocal Time-lapse Imaging. J Visualized Exp.: e51086. https://doi.org/10.3791/51086
- Thevenaz, P., Ruttimann, U. and Unser, M. (1998). A pyramid approach to subpixel registration based on intensity. IEEE Trans Image Process. 7(1): 27–41. https://doi.org/10.1109/83.650848
- Lin, C. C. and Suzuki, A. (2024). Calibrating Fluorescence Microscopy With 3D-Speckler (3D Fluorescence Speckle Analyzer). Bio Protoc. 14(1351): e5051. https://doi.org/10.21769/bioprotoc.5051
- Linkert, M., Rueden, C. T., Allan, C., Burel, J. M., Moore, W., Patterson, A., Loranger, B., Moore, J., Neves, C., MacDonald, D., et al. (2010). Metadata matters: access to image data in the real world. J Cell Biol. 189(5): 777–782. https://doi.org/10.1083/jcb.201004104
Article Information
Publication history
Received: Nov 6, 2025
Accepted: Dec 11, 2025
Available online: Dec 25, 2025
Published: Jan 20, 2026
Copyright
© 2026 The Author(s); This is an open access article under the CC BY-NC license (https://creativecommons.org/licenses/by-nc/4.0/).
How to cite
Hsiao, W. Y., Ghone, D. and Suzuki, A. (2026). Correcting Image Distortion in Expansion Microscopy Using 3D-Aligner. Bio-protocol 16(2): e5568. DOI: 10.21769/BioProtoc.5568.
Category
Cell Biology > Cell imaging > Super resolution imaging
Bioinformatics and Computational Biology
Biophysics > Microscopy
Do you have any questions about this protocol?
Post your question to gather feedback from the community. We will also invite the authors of this article to respond.