- Protocols

- Articles and Issues
- For Authors
- About
- Become a Reviewer

Optimized Method for High-Quality Isolation of Single-Nuclei From Mosquito Fat Body for RNA Sequencing
(§Technical contact: stephanie.serafimdecarvalho@nih.gov) Published: Vol 16, Iss 1, Jan 5, 2026 DOI: 10.21769/BioProtoc.5564 Views: 295
Reviewed by: Anonymous reviewer(s)
Original research article
The authors used this protocol in:

Jul 2025

Protocol Collections
Comprehensive collections of detailed, peer-reviewed protocols focusing on specific topics


Related protocols
Abstract
Single-cell and single-nucleus RNA sequencing are revolutionizing our understanding of cellular biology. The identification of molecular markers, single-cell transcriptomic profiling, and differential gene expression at the cellular level has revealed key functional differences between cells within the same tissue. However, tissue dissociation remains challenging for non-model organisms and for tissues with unique biochemical properties. For example, the mosquito fat body, which serves functions analogous to mammalian adipose and liver tissues, consists of trophocytes—large, adipocyte-like cells whose cytoplasm is filled with lipid droplets. Conventional enzymatic dissociation methods are often too harsh for these fragile cells, and their high lipid content can interfere with reagents required for single-cell transcriptomic analysis. Single-nucleus RNA sequencing (snRNA-seq) offers an alternative strategy when intact cells with high-quality RNA cannot be obtained by enzymatic or mechanical dissociation. Here, we present an optimized reproducible methodology for nuclei isolation from the fat body of Anopheles gambiae mosquitoes, enabling high-quality snRNA-seq. Our approach involves tissue fixation and lipid removal, followed by cell lysis and nuclei purification using a sucrose cushion. We validated this protocol on both sugar-fed and blood-fed samples, established quality metrics to remove potential ambient RNA contamination, and demonstrated that snRNA-seq using this method yields high-quality sequencing results.
Key features
• Optimized nuclei isolation using methanol fixation and lipid removal enables efficient nuclei extraction from the fragile, lipid-rich fat body tissue of Anopheles gambiae.
• We validated this procedure in sugar-fed and blood-fed samples, yielding high-quality single-nucleus RNA sequencing data with high gene counts and low mitochondrial RNA content.
• Robust quality metrics allow effective filtering of ambient RNA, enhancing transcriptomic accuracy across different physiological states.
Keywords: MosquitoGraphical overview
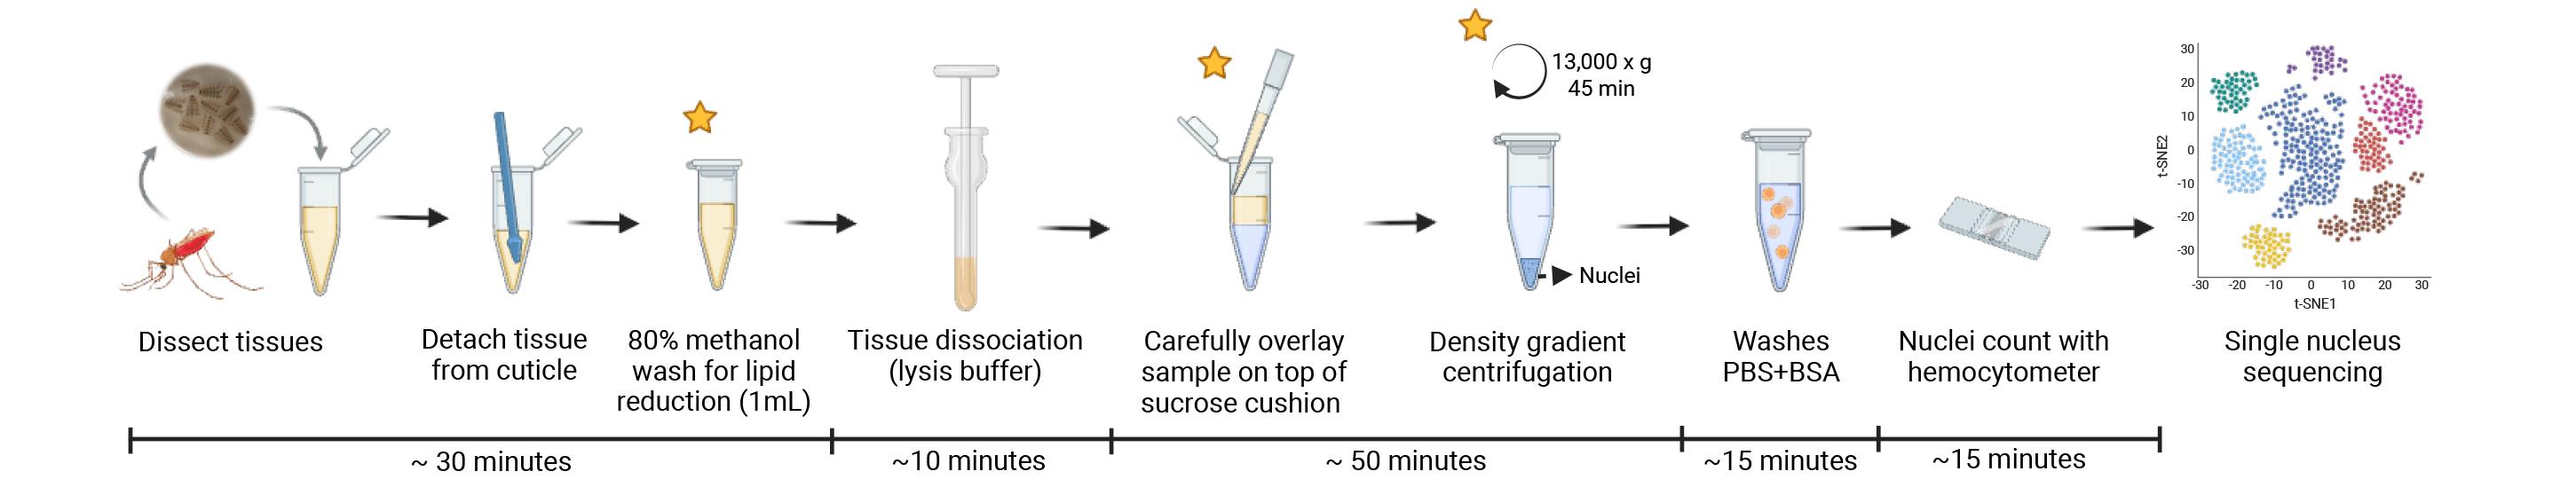
Tissue dissociation and nucleus isolation from mosquito fat body and associated tissues for single-nucleus RNA sequencing applications. Stars represent the critical steps of the protocol.
Background
Single-cell RNA sequencing (scRNA-seq) has transformed our understanding of cellular heterogeneity by enabling high-resolution molecular profiling at the level of individual cells. While conventional bulk RNA sequencing offers deep insights into transcription regulation, it only captures the average gene expression across a population of cells, masking potential cell-to-cell variability. In contrast, single-cell omics allow for the analysis of transcriptomes from individual cells, generating distinct gene expression profiles that reveal cell-specific functions and dynamic states within complex tissues.
Mosquitoes are the main vectors of arboviruses and parasites, impacting millions of people each year. Blood feeding is a critical behavior in female mosquitoes, as it provides the nutrients necessary for egg development; however, it also enables the transmission of pathogens when mosquitoes feed on infected hosts. The ingestion of a blood meal triggers profound physiological changes, particularly in the fat body, a central metabolic and reproductive tissue in mosquitoes [1–3]. Functionally similar to the liver and adipose tissue in mammals, the fat body rapidly shifts its gene expression after a blood meal, including the production of yolk proteins like vitellogenin that are essential for reproduction. Trophocytes—large cells with the cytoplasm filled with extensive lipid droplets—constitute the main cell type of the fat body [1–4]. These are adipocyte-like cells with high lipid content and a fragile structure, which makes dissociation and single-cell isolation very difficult, leading to poor cell recovery, low viability, and reduced RNA integrity when using standard single-cell isolation procedures.
A critical step in scRNA-seq is an efficient dissociation of tissues into a high-quality single-cell suspension. However, certain tissue types—such as adipose tissue—pose a significant technical challenge due to their large size (20–300 μm) [5], structural fragility, and high lipid content [6]. Enzymatic dissociation methods (e.g., collagenase or trypsin digestion) are often used to dissociate tissues, but they can introduce technical artifacts, damage fragile cells, and reduce RNA integrity, especially in lipid-rich tissues [6–8]. These limitations may result in poor cell viability and biased transcriptomic profiles, making conventional scRNA-seq challenging for these tissues. Single-nucleus RNA sequencing (snRNA-seq) offers several advantages for challenging tissues, including those that are fragile, lipid-rich, or difficult to dissociate. snRNA-seq avoids dissociation-induced transcriptional artifacts, preserves representation of large or fragile cell types, and is compatible with frozen or archived tissues [9,10]. However, because nuclear RNA is enriched for pre-mRNAs and lacks some cytoplasmic transcripts, snRNA-seq typically detects fewer genes per nucleus and may underestimate transcripts with strong cytoplasmic localization [11,12]. Thus, while snRNA-seq provides a powerful alternative when whole-cell isolation is not feasible, it also requires accounting for nuclear-specific transcriptional features during data analysis.
Prior studies have explored single-nucleus transcriptomic approaches in insects. In Aedes aegypti, single-nucleus RNA sequencing has been applied to both brain and midgut tissues, demonstrating the feasibility of nuclear profiling in mosquitoes [13,14]. However, quality metrics such as nuclei yield, ambient RNA contamination, and percentage of mitochondrial transcripts are poorly reported. Additionally, snRNA-seq has been performed in the fruit fly Drosophila melanogaster and the Bombyx mori moth fat body tissues, profiling cell-type diversity and functional heterogeneity [15,16]. An optimized Drosophila nuclei isolation protocol reported the recovery of ~106 nuclei from 40 fat body tissues, with improved levels of mitochondrial contamination (<20%) and unique transcripts (>200) compared to enzymatic methods [17]. Despite these advances, isolating intact cells from the mosquito fat body remains technically challenging. To date, no standardized or optimized nuclei isolation protocol has been developed for Anopheles gambiae fat body. Here, we present a reproducible nuclei-based method that yields high-quality, intact nuclei from Anopheles gambiae fat body with consistent recovery across samples. Our protocol recovers approximately 1 × 10⁶ nuclei from 25 body wall tissues, maintains nuclear membrane integrity, and supports low levels of ambient RNA contamination, enabling robust snRNA-seq profiling. In addition, the workflow is compatible with both fresh and methanol-stabilized tissues and is completed rapidly without enzymatic digestion. These features collectively provide a practical and reliable approach for high-quality transcriptomic analysis of this metabolically and immunologically important tissue.
Materials and reagents
Biological materials
1. Anopheles gambiae (G3, CDC strain) dissected body walls (25 tissues) from adult females
Reagents
1. Calcium chloride (CaCl2) (Sigma-Aldrich, catalog number: C1016-500G)
Caution: Irritant to the eyes.
2. 2 M potassium chloride (KCl) (Thermo Fisher Scientific, catalog number: AM9640G, 100 mL)
3. 1 M HEPES, pH 7.4 (Teknova, catalog number: H1030, 1,000 mL)
4. Magnesium chloride (MgCl2) (Sigma-Aldrich, catalog number: M8266-100G)
5. 5 M sodium chloride (NaCl) (KD Medical, catalog number: RGF-3270, 1,000 mL)
6. Sodium bicarbonate (NAHCO3) (Sigma-Aldrich, catalog number: S6297-250G)
7. Sodium phosphate monobasic (NaH2PO4) (Sigma-Aldrich, catalog number: S3139-250G)
8. Sucrose (Sigma-Aldrich, catalog number: S0389-500G)
9. D-(+)-Trehalose dihydrate (Sigma-Aldrich, catalog number: T0167-25G)
10. Methanol (Thermo Fisher Scientific, catalog number: A412P-4, 4 L)
Caution: Flammable liquid and vapor. Toxic by inhalation, in contact with skin, and if swallowed. Handle inside of a safety cabinet.
11. Nuclease-free water (NFW), no DEPC (Thermo Fisher Scientific, catalog number: AM9938)
12. Nuclei Isolation kit, Nuclei PURE Prep (Sigma-Aldrich, catalog number: NUC201-1KT)
13. Dithiothreitol (DTT) (Thermo Fisher Scientific, catalog number: D1532, 1 g)
Caution: Irritant to skin and eyes. Harmful if swallowed.
14. Phosphate buffer saline (PBS) 10× (90 g NaCl, 1.44 g KH2PO4, 7.95 g NaHPO4 in 1 L of water), pH 7.4 (KD-Medical, catalog number: RGF-3210)
15. RNASE inhibitor, protector RNASE inhibitor 10,000 units (Sigma-Aldrich, catalog number: 3335402001)
16. Ultrapure BSA 50 mg/mL (Thermo Fisher Scientific, catalog number: AM2618)
17. RNase Away (Molecular Bioproducts, catalog number: 7000)
18. Trypan blue stain, 0.4% (Gibco, catalog number: 15250061, 100 mL)
19. Triton X-100, molecular biology (Millipore, catalog number: 648466, 50 mL)
Solutions
1. Hemolymph-like saline (HLS buffer) (see Recipes)
2. 80% methanol solution (see Recipes)
3. Lysis buffer (see Recipes)
4. 1.8 M sucrose cushion solution (see Recipes)
5. Washing buffer 1× (see Recipes)
6. Resuspension buffer 1× (see Recipes)
Recipes
Note: Keep all solutions on ice at all times to maintain RNA integrity during the procedure. Prepare solutions fresh before nucleus isolation. Storage is not recommended, except for the HLS buffer.
1. HLS buffer
| Reagent | Final concentration | Quantity or volume |
|---|---|---|
| CaCl2 0.5 M | 2 mM | 0.4 mL |
| KCl 2 M | 5 mM | 0.25 mL |
| HEPES 1 M, pH 7.4 | 5 mM | 0.5 mL |
| MgCl2 0.5 M | 8.2 mM | 1.64 mL |
| NaCl 5 M | 108 mM | 2.16 mL |
| NaHCO3 0.5 M | 4 mM | 0.8 mL |
| NaH2PO4 0.5 M | 1 mM | 0.2 mL |
| Sucrose 0.5 M | 10 mM | 2 mL |
| Trehalose 1 M | 5 mM | 0.5 mL |
| Nuclease-free water | n/a | 91.55 mL |
| Total | n/a | 100 mL |
Notes:
1. Adjust the pH to 7.5, filter, and store aliquots at 4 °C.
2. Use solutions of CaCl2 and MgCl2 instead of powders to avoid precipitation in the saline.
3. This buffer was previously proposed by Singleton and Woodruff [18] to mimic Drosophila hemolymph osmolarity.
2. 80% methanol solution
| Reagent | Final concentration | Quantity or volume |
|---|---|---|
| Methanol | 80% | 8 mL |
| HLS buffer | n/a | 2 mL |
| Total | n/a | 10 mL |
Notes:
1. Each sample requires the use of 1 mL of 80% methanol solution.
2. This solution, used on step C1, is important to remove excess lipids.
Caution: Prepare and handle this solution inside a safety cabinet.
3. Lysis buffer
| Reagent | Final concentration | Quantity or volume |
|---|---|---|
| Nuclei PURE lysis buffer (from Nuclei PURE Prep kit) | n/a | 989 μL |
| DTT 1 M | 1 mM | 1 μL |
| Triton X-100 10% | 0.1% | 10 μL |
| Total | n/a | 1 mL |
Note: Each sample requires the use of 0.5 mL of lysis buffer.
4. 1.8 M sucrose cushion solution
| Reagent | Final concentration | Quantity or volume |
|---|---|---|
| Nuclei PURE 2 M Sucrose cushion solution (from Nuclei PURE Prep kit) | 1.8 M | 5.4 mL |
| Nuclei PURE sucrose cushion buffer (from Nuclei PURE Prep kit) | n/a | 0.6 mL |
| Total | n/a | 6 mL |
Notes:
1. Each sample requires the use of 2.8 mL of 1.8 M sucrose cushion solution.
2. Mix with a pipette or vortex until the solution looks clear and homogeneous. This solution is viscous due to the high sucrose concentration.
5. Washing buffer 1×
| Reagent | Final concentration | Quantity or volume |
|---|---|---|
| PBS | 1× (150 mM, 1 mM KH2PO4, 5.5 mM NaHPO4) | 100 μL |
| Ultrapure BSA (50 mg/mL) | 10 mg/mL or 1% | 200 μL |
| RNase inhibitor (40 U/μL) | 0.2 U/μL | 5 μL |
| Nuclease-free water | n/a | 695 μL |
| Total | n/a | 1 mL |
Note: Each sample requires the use of 2 mL of washing buffer.
6. Resuspension buffer 1×
| Reagent | Final concentration | Quantity or volume |
|---|---|---|
| PBS | 1× (150 mM, 1 mM KH2PO4, 5.5 mM NaHPO4) | 100 μL |
| Ultrapure BSA (50 mg/mL) | 2 mg/mL or 0.2% | 40 μL |
| RNase inhibitor (40 U/μL) | 0.2 U/μL | 5 μL |
| Nuclease-free water | n/a | 855 μL |
| Total | n/a | 1 mL |
Laboratory supplies
1. 1.5 mL microtubes (Axygen, catalog number: MCT-150-C-S)
2. 10 μL micropipette tips (TipOne 10 μL, graduated filter tips) (USA Scientific, catalog number: 1180-3810)
3. 200 μL micropipette tips (TipOne 200 μL graduated filter tips) (USA Scientific, catalog number: 1180-8810)
4. 1,250 μL micropipette tips (Purepoint barrier tips FT1250) (Alkali Scientific, catalog number: FT1250)
5. C-Chip disposable hemocytometer (iNCYTO, catalog number: DHC-N01-5 NI, Neubauer Improved)
6. Laboratory pipettes (10, 20, 200, and 1,000 μL)
7. Transfer pipette, sterile, polyethylene (Millipore Sigma, catalog number: Z350818-500EA)
8. WHEATON Dounce tissue grinder (WHEATON, catalog number: 357538, 1 mL)
9. Pellet pestles (Fisher Scientific, catalog number: 12-141-363)
10. 40 μm filter (Pluriselect, catalog number: 43-10040-40)
11. 20 μm filter (Pluriselect, catalog number: 43-10020-40)
Equipment
1. Refrigerated centrifuge (Eppendorf, model: 5417 R)
2. Rotor (Eppendorf, catalog number: F45-30-11)
3. Transmitted light and epifluorescence microscopes
Software and datasets
1. Cell ranger (10X genomics, version 7.0.0)
2. Seurat R package (Satija Lab, version 4.2.1)
3. DecontX R package (Campbell Lab, version 1.6.0)
4. All data have been deposited to the SRA database under BioProject accession number PRJNA1288431 (https://dataview.ncbi.nlm.nih.gov/object/PRJNA1288431?reviewer=he84ttfsjqcmttfp3ccg035vi8)
Procedure
A. General material setup
1. Before starting the protocol:
a. Prepare the solutions and place them on ice.
Note: If you have multiple samples at a time, you can prepare a larger mix respecting the proportions above.
b. Clean Dounce homogenizers and place them on ice.
Note: RNase Away may be used to avoid RNase activity. Rinse thoroughly with nuclease-free water.
c. Pre-chill the centrifuge to 4 °C.
d. Prepare 1.5 mL microcentrifuge tubes with 200 μL of HLS buffer and place them on ice. Prepare one tube per sample.
e. Prepare microcentrifuge tubes with 800 μL of methanol and put them on ice. Prepare one tube per sample.
B. Body wall dissection and tissue dehydration
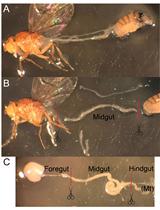
1. Anesthetize the mosquitoes on ice. Pick a mosquito using fine forceps and pull the last segment of the abdomen to remove the ovaries, gut, and Malpighian tubules. Keep the body wall, with the fat body and associated tissues attached to the cuticle (Figure 1).
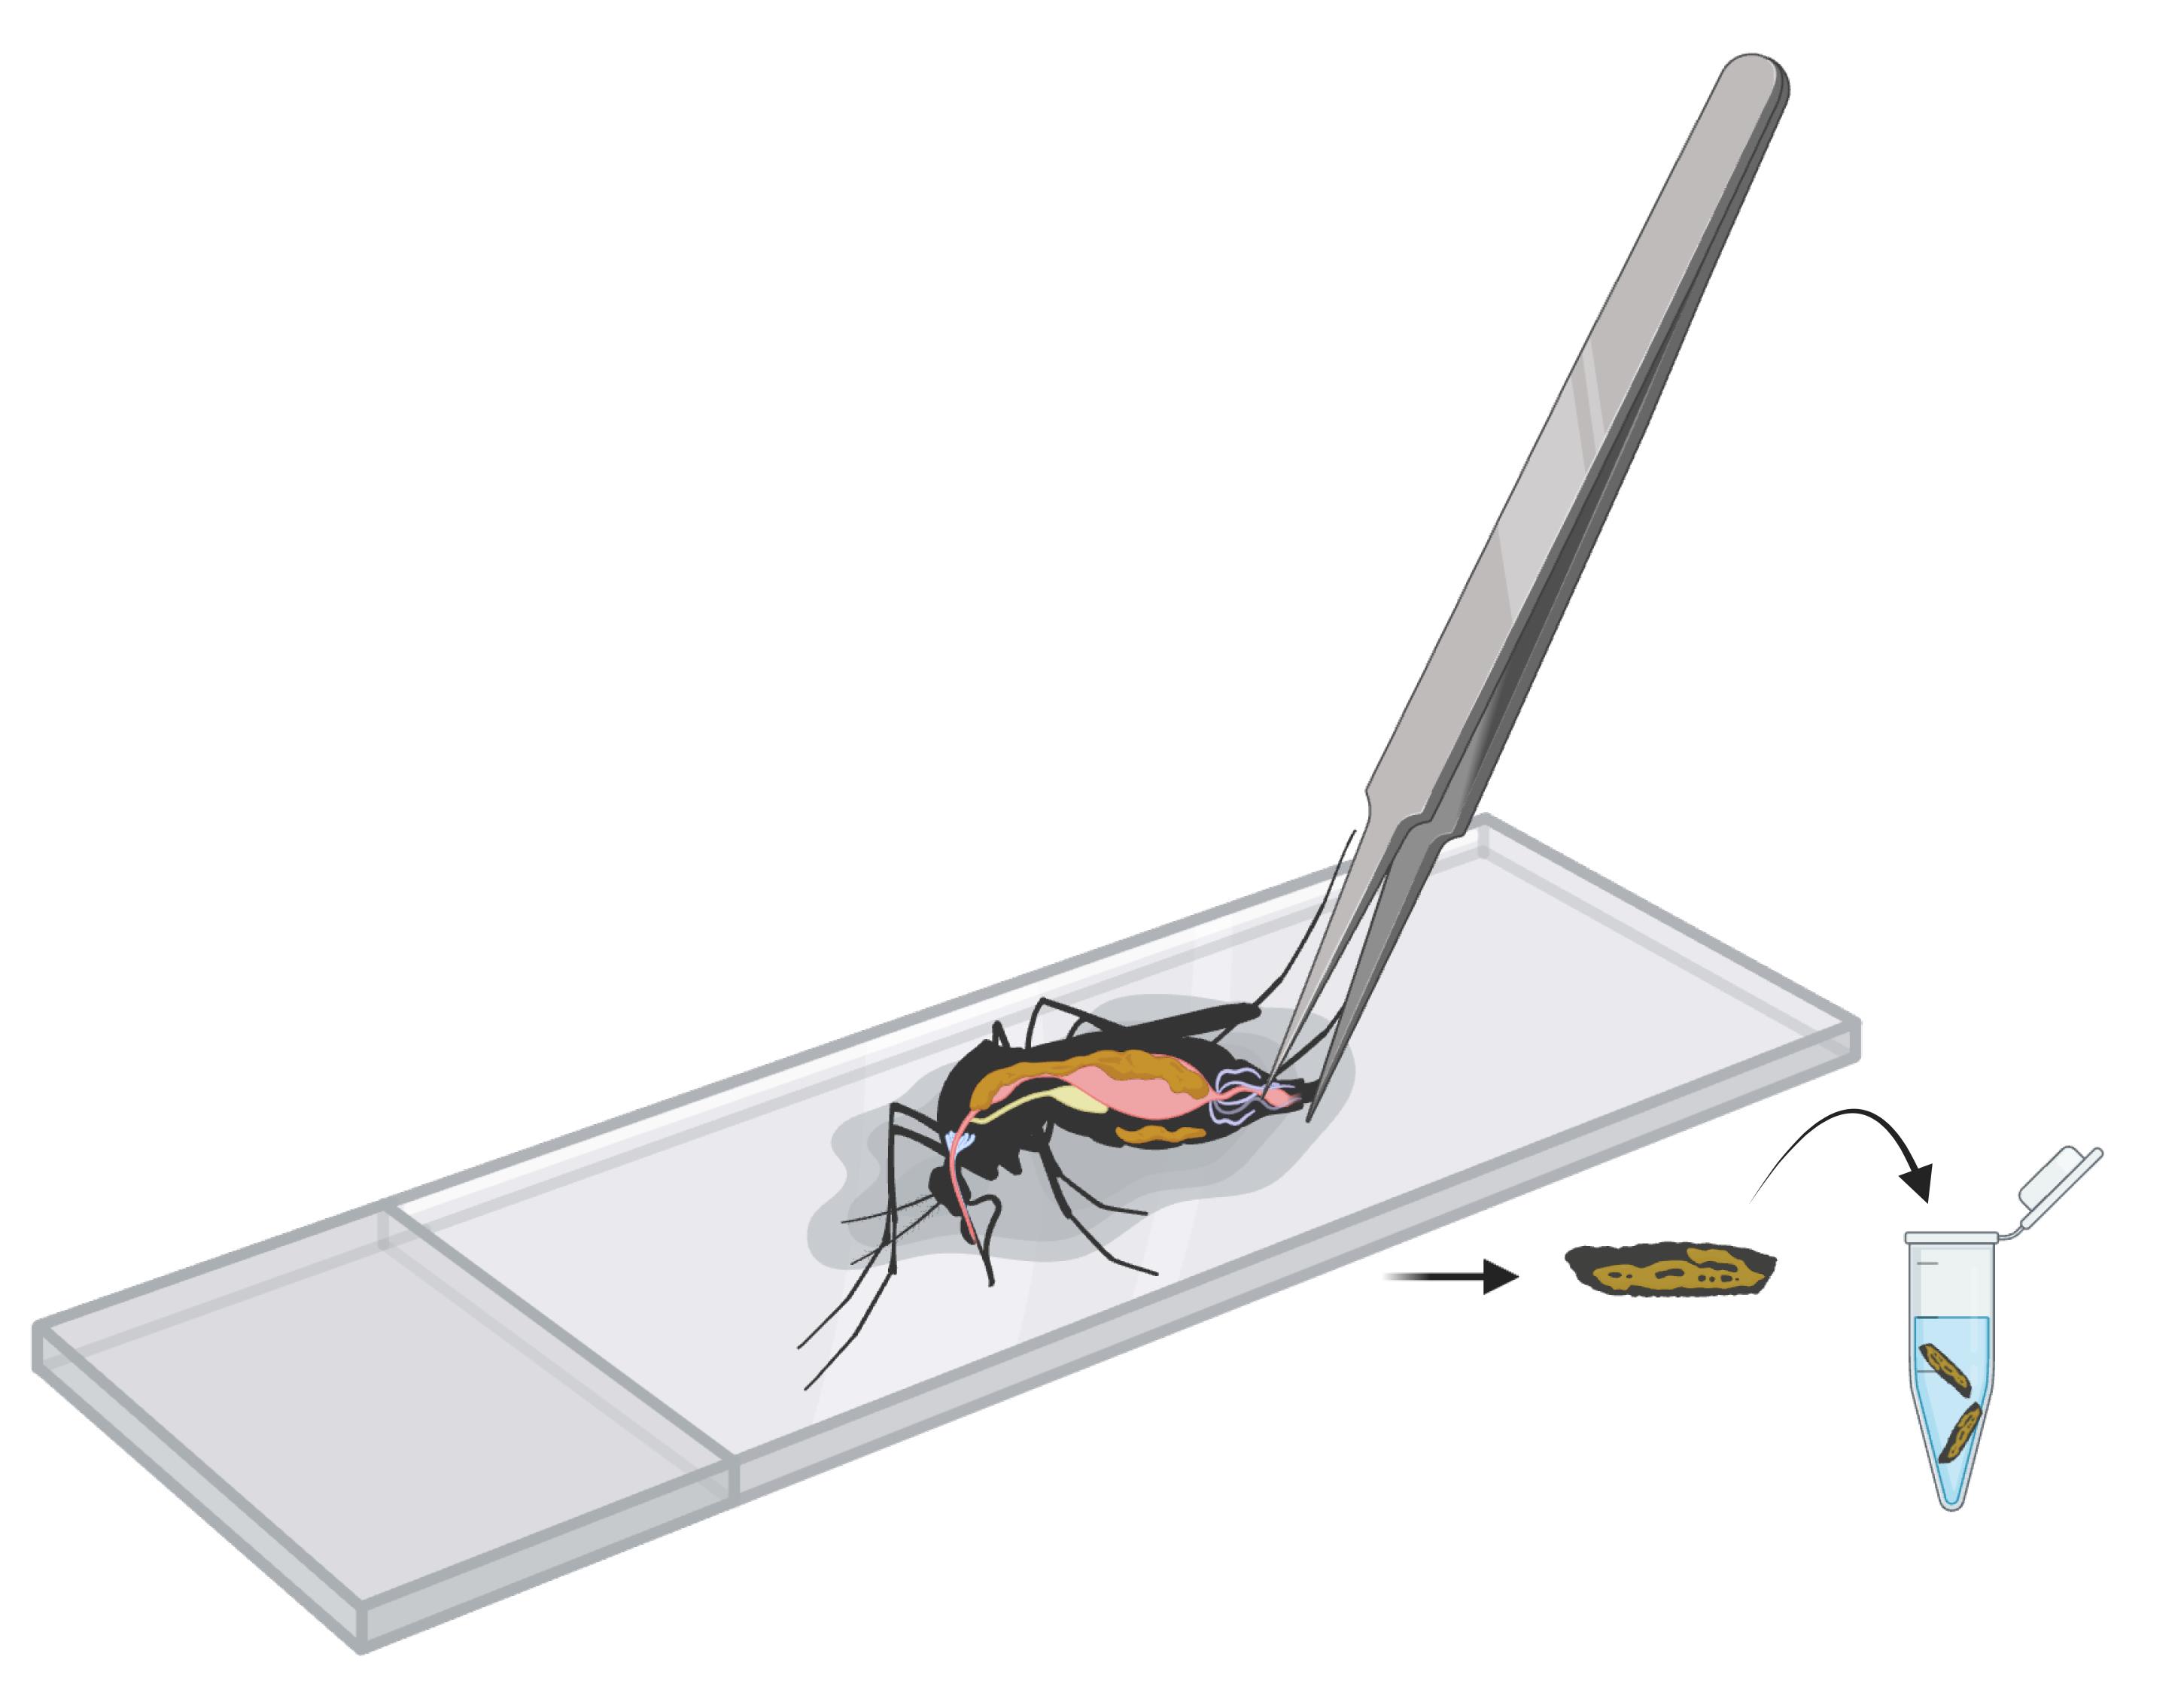
Figure 1. Graphical representation of mosquito body wall dissection
2. Dissect 25 body walls in HLS buffer and place them directly into 200 μL of HLS buffer in a single 1.5 mL microcentrifuge tube placed on ice.
Note: The optimal input consists of a pool of 25 body wall tissues per sample, yielding approximately 1 × 10⁶ nuclei.
3. Gently press the body wall tissue against the microcentrifuge tube in HLS buffer with a plastic pestle 4 times (Figure 2A).
Critical: The HLS buffer will get turbid. Do not squeeze the tissue too much or too hard to avoid cuticle pieces in the next steps of the protocol.
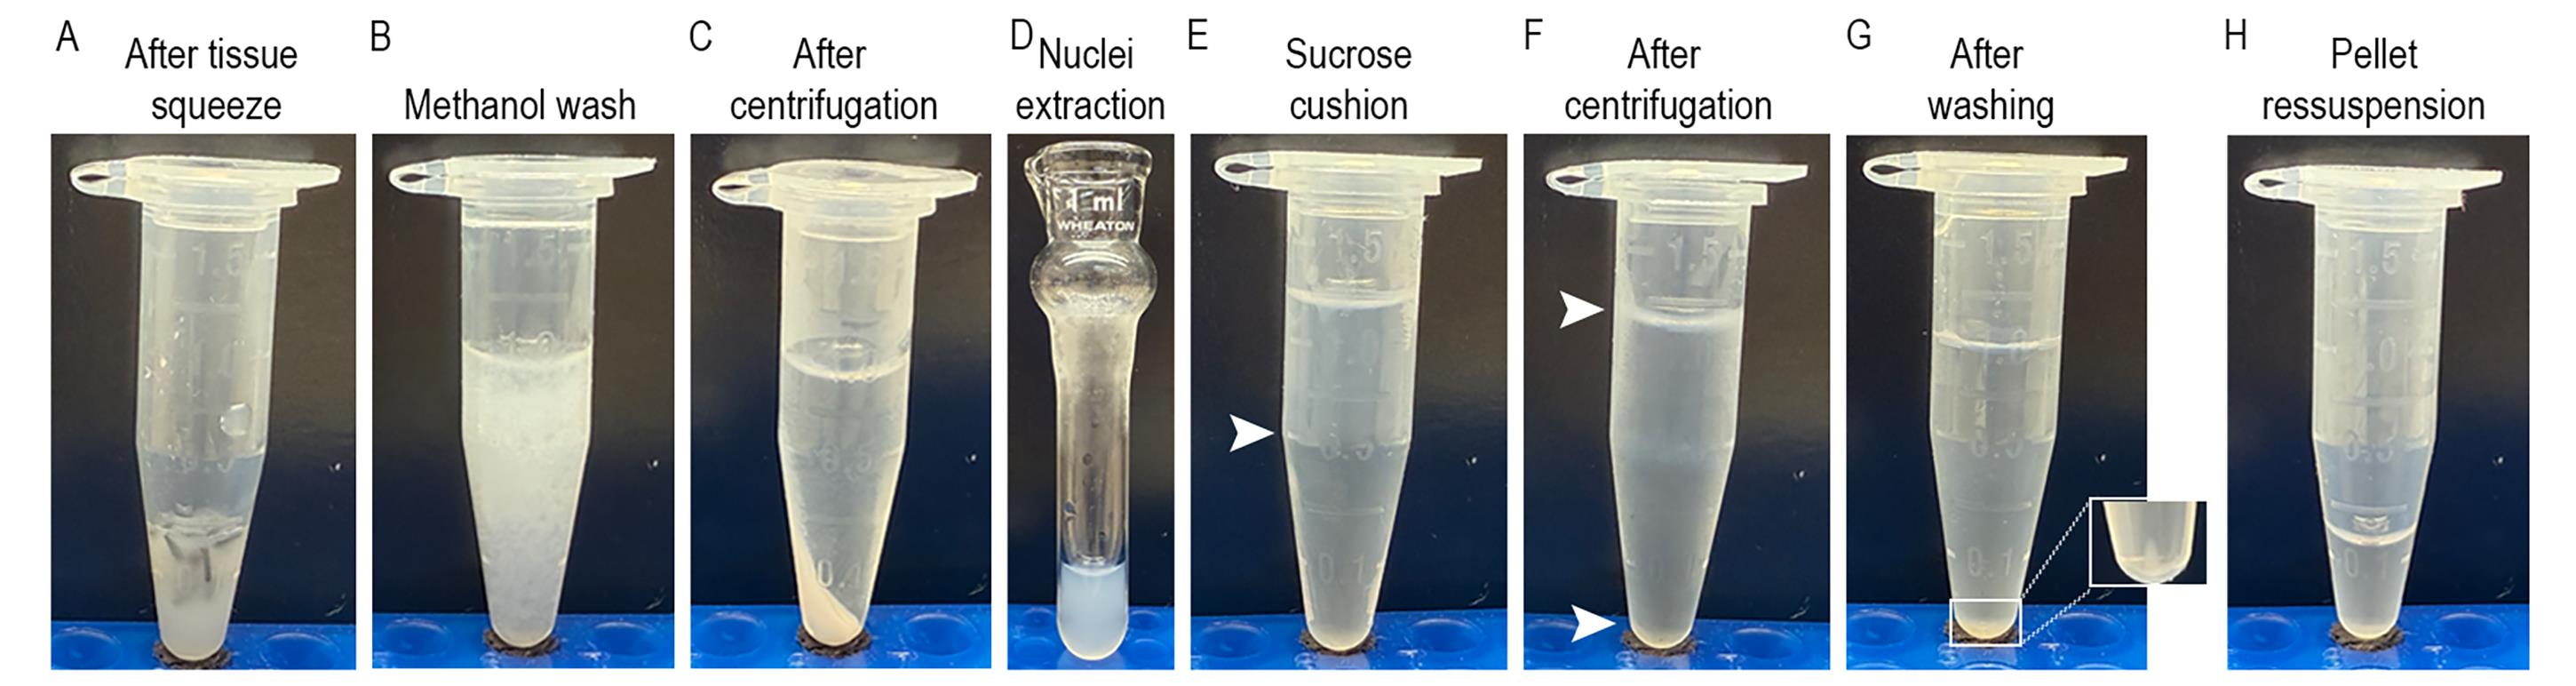
Figure 2. Nuclei isolation. (A) Fat body tissue after a gentle squeeze with a plastic pestle. (B, C) Tissue homogenate after methanol wash and centrifugation. (D) Nuclei extraction with lysis buffer and tissue Dounce homogenizer. (E) Sample homogenate laid on top of the sucrose cushion. The white arrow indicates the separation between the sample and the sucrose cushion. (F) After centrifugation, debris is found on the top layer and on the lateral of the tube (top white arrow), and nuclei are on the pellet on the bottom of the tube (bottom white arrow). (G) Nuclei pellet after washing the sample. (H) Nuclei on resuspension buffer.
4. Transfer the tissue homogenate to a tube with 800 μL of ice-cold methanol. Do not transfer the cuticle. Mix gently by inversion 3–4 times.
Note: If possible, use wide-bore tips or cut the tip with clean scissors to prevent cell damage at this point. You may clean the scissors with RNASE Away.
5. Repeat steps B1–5 until the desired number of samples is acquired.
Note: Keep samples in 80% methanol/HLS on ice until all samples are collected.
C. Nuclei isolation
1. Lipid removal
a. Centrifuge at 500× g for 5 min at 4 °C. Remove the supernatant without disrupting the pellet.
b. Wash with 1 mL of ice-cold 80% methanol solution. Pipette gently to resuspend the pellet (Figure 2B).
Critical: The mosquito fat body has a large amount of lipids. This methanol wash fixes the tissue and significantly reduces the lipid content in the sample, which is crucial for downstream processing.
c. Centrifuge at 500× g for 5 min at 4 °C. Remove the supernatant without disrupting the pellet (Figure 2C).
2. Tissue dissociation
a. Add 500 μL of ice-cold lysis buffer and mix gently with a pipette. Pipette gently to resuspend the pellet.
Notes:
1. If possible, use a wide-bore pipette tip or cut the tip with clean scissors. You may clean the scissors with RNASE Away.
2. It is not recommended to keep the tissues for longer than 10 min in lysis buffer. Longer exposure to the lysis buffer may cause loss of nuclei quality.
b. Transfer the sample to the pre-chilled 1 mL Dounce homogenizer. Use the loose pestle to perform 15 gentle strokes. Repeat this step and perform 15 gentle strokes but with the tight pestle (~2–3 min). At this point, the sample should look turbid and with little to no foam (Figure 2D).
Notes:
1. Perform the strokes gently. Keep the pestle submerged the entire time to avoid foam or bubble formation.
2. Keep the sample on ice the entire time to avoid RNA degradation.
c. Add 900 μL of 1.8 M sucrose cushion solution and mix gently with a transfer pipette.
Critical: The 1.8 M sucrose cushion solution will dilute the lysis buffer, minimizing its action on the sample. It also adjusts the concentration of sucrose in the sample to be used as an overlay in the sucrose cushion step.
Note: If processing multiple samples, it is recommended to dilute the lysis buffer and remove it by centrifugation until you finish processing all the samples.
3. Sucrose cushion
Note: If processing blood-fed mosquitoes, split the sample into four microcentrifuge tubes with sucrose cushion. Blood-fed mosquitoes generate more cellular debris, and splitting the sample into more tubes improves the efficiency of the sucrose cushion cleanup.
a. Add 500 μL of 1.8 M sucrose cushion solution to a new microcentrifuge tube and centrifuge at 1,000× g for 30 s. Prepare two microcentrifuge tubes per sample. Keep it on ice.
b. Carefully overlay 700 μL of the sample homogenate on top of the sucrose cushion prepared in the previous step in each microcentrifuge tube (Figure 2E).
Critical: The sample should be gently applied along the tube wall without disrupting the sucrose cushion. A distinct layer should be visible above the sucrose cushion.
c. Without disturbing the layers, transfer the microcentrifuge tubes to a pre-chilled microcentrifuge. Centrifuge samples at 13,000× g for 45 min at 4 °C.
d. Carefully remove the tube from the centrifuge and place it on ice. The nuclei should be pelleted at the bottom of the tube. Cellular debris may appear on top of the supernatant, along the tube wall, and/or at the interface between the tissue homogenate and the sucrose cushion. Gently remove the entire supernatant, including both the homogenate layer and the sucrose cushion, without disturbing the pellet (Figure 2F).
Notes:
1. If using a fixed-angled rotor, beware of the debris on the wall of the microcentrifuge tube.
2. If possible, use a swinging bucket rotor to improve the efficiency of the sucrose cushion and yield of the final sample with less debris.
e. Wash the pellet twice with 1 mL of washing buffer. Centrifuge at 500× g for 5 min at 4 °C. Remove the supernatant without disrupting the pellet (Figure 2G).
Notes:
1. Increasing wash volumes and using a swing bucket rotor during centrifugation may improve the removal of leftover debris, lipids, and other contaminants.
2. Cell strainers of 20–40 μm may be used to remove large debris remaining on the sample after two washes. Attach the strainer to a microcentrifuge tube and filter the sample in washing buffer. Note that filtering can trap some nuclei and may reduce yield.
3. Increase BSA concentration in the resuspension buffer up to 2% if nuclei aggregates are >5%.
f. Resuspend the pellet with gentle taps on the microcentrifuge tubes. Add 100 μL of resuspension buffer to the first tube. Gently mix by pipetting and then transfer all contents of the first tube into the second tube to combine them. The final volume will be approximately 100 μL per sample (Figure 2H).
Note: Adjust the final resuspension volume according to the number of tissues used and nuclei yield. Do not use less than 50 μL to resuspend the sample, as per the recommendations of 10× protocols. Nuclei yield is optimal between 700 and 1,200 nuclei/μL.
4. Counting and visualizing the nucleus
a. Perform nucleus manual counting using the Neubauer improved chamber under the microscope. Use filtered trypan blue (0.1%) to observe and count the nuclei easily. Use light microscopy and Hoechst (1:10,000) staining to assess the quality of nuclei extraction.
Note: Good quality nuclei should have an intact or undamaged nuclei membrane, without blebs.
Data analysis
Cell lysis is necessary to extract nuclei for single-nuclei library preparation; however, it can introduce ambient RNA contamination into the samples. Although cell washing helps, it often fails to fully eliminate this contamination. Ambient RNA can negatively impact data quality by introducing noise, leading to poor-quality cells and cofounding gene expression patterns during clustering and integration analysis. To address this, computational methods like R packages DecontX [19] and SoupX [20] use Bayesian frameworks to estimate contamination across all cells. These tools can either filter out low-quality cells [19] or adjust their expression profiles to correct for contamination [20]. More recently, complementary approaches have emerged. For example, scCDC [21] identifies globally contaminating genes and performs decontamination by adjusting the expression counts of the specific genes within each cell, rather than modeling contamination at the cell level. These approaches, whether used alone or in combination, enhance the accuracy and interpretability of single-nucleus RNA-seq data by effectively mitigating the impact of ambient RNA.
In this study, we generated a single-nucleus gene matrix by aligning raw sequence reads from the Anopheles gambiae PEST (AgamP4.14, v59) reference genome using the Cell Ranger pipeline (version 7.0.0, 10X Genomics, Pleasanton, CA). Alignment and quantification were performed with the “cellranger count” function, using the parameters “--include-introns=true” and “--expect-cells=10000” to generate both raw and filtered gene-barcode matrices. Correction was performed using the decontX algorithm from the celda R package [19], which models and removes contamination from ambient background RNA in snRNA-seq data. Additional quality filtering was performed based on the number of features, with thresholds set at 200–1,500 for the sugar-fed sample and 200–2,000 features for the blood-fed sample. Cells were also filtered based on mitochondrial and ribosomal gene expression, as a proxy of ambient RNA contamination, with maximum allowable percentages set at 15% for mitochondrial genes and 15%–25% for ribosomal genes on sugar-fed and blood-fed samples, respectively.
Validation of protocol
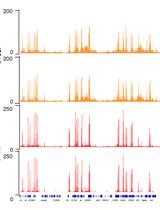
The protocol described here was tested on sugar-fed and blood-fed mosquitoes and yielded reproducible results. Nuclei isolation consistently yielded optimal nuclei concentration for 10X genomics kits, ranging from 700 to 1,200 nuclei/μL. Nuclei quality was assessed using light and fluorescent microscopy with Hoechst staining. High-quality nuclei with varying sizes were observed, characterized by intact nuclear membranes (Figure 3A, B). High-quality nuclei are characterized by an intact nuclear membrane (Figure 3A’, B’), whereas poor-quality nuclei show membrane blebbing or disruption (Figure 3C, D). cDNA libraries were generated using the Chromium Next GEM Single Cell 3′ Reagent Kit v3.1. cDNA and library quality and quantification were evaluated using capillary electrophoresis with the Agilent TapeStation system (Figure 3E–H). Ambient RNA removal and filtering thresholds were applied to ensure that only high-quality cells were retained in the sugar-fed and blood-fed datasets (Table 1). Violin plots show the data distribution before and after quality cutoffs were applied (Figure 4A, B). Notably, these distributions differ between sugar-fed and blood-fed samples, likely reflecting the extensive transcriptional reprogramming that occurs in the mosquito fat body following a blood meal.
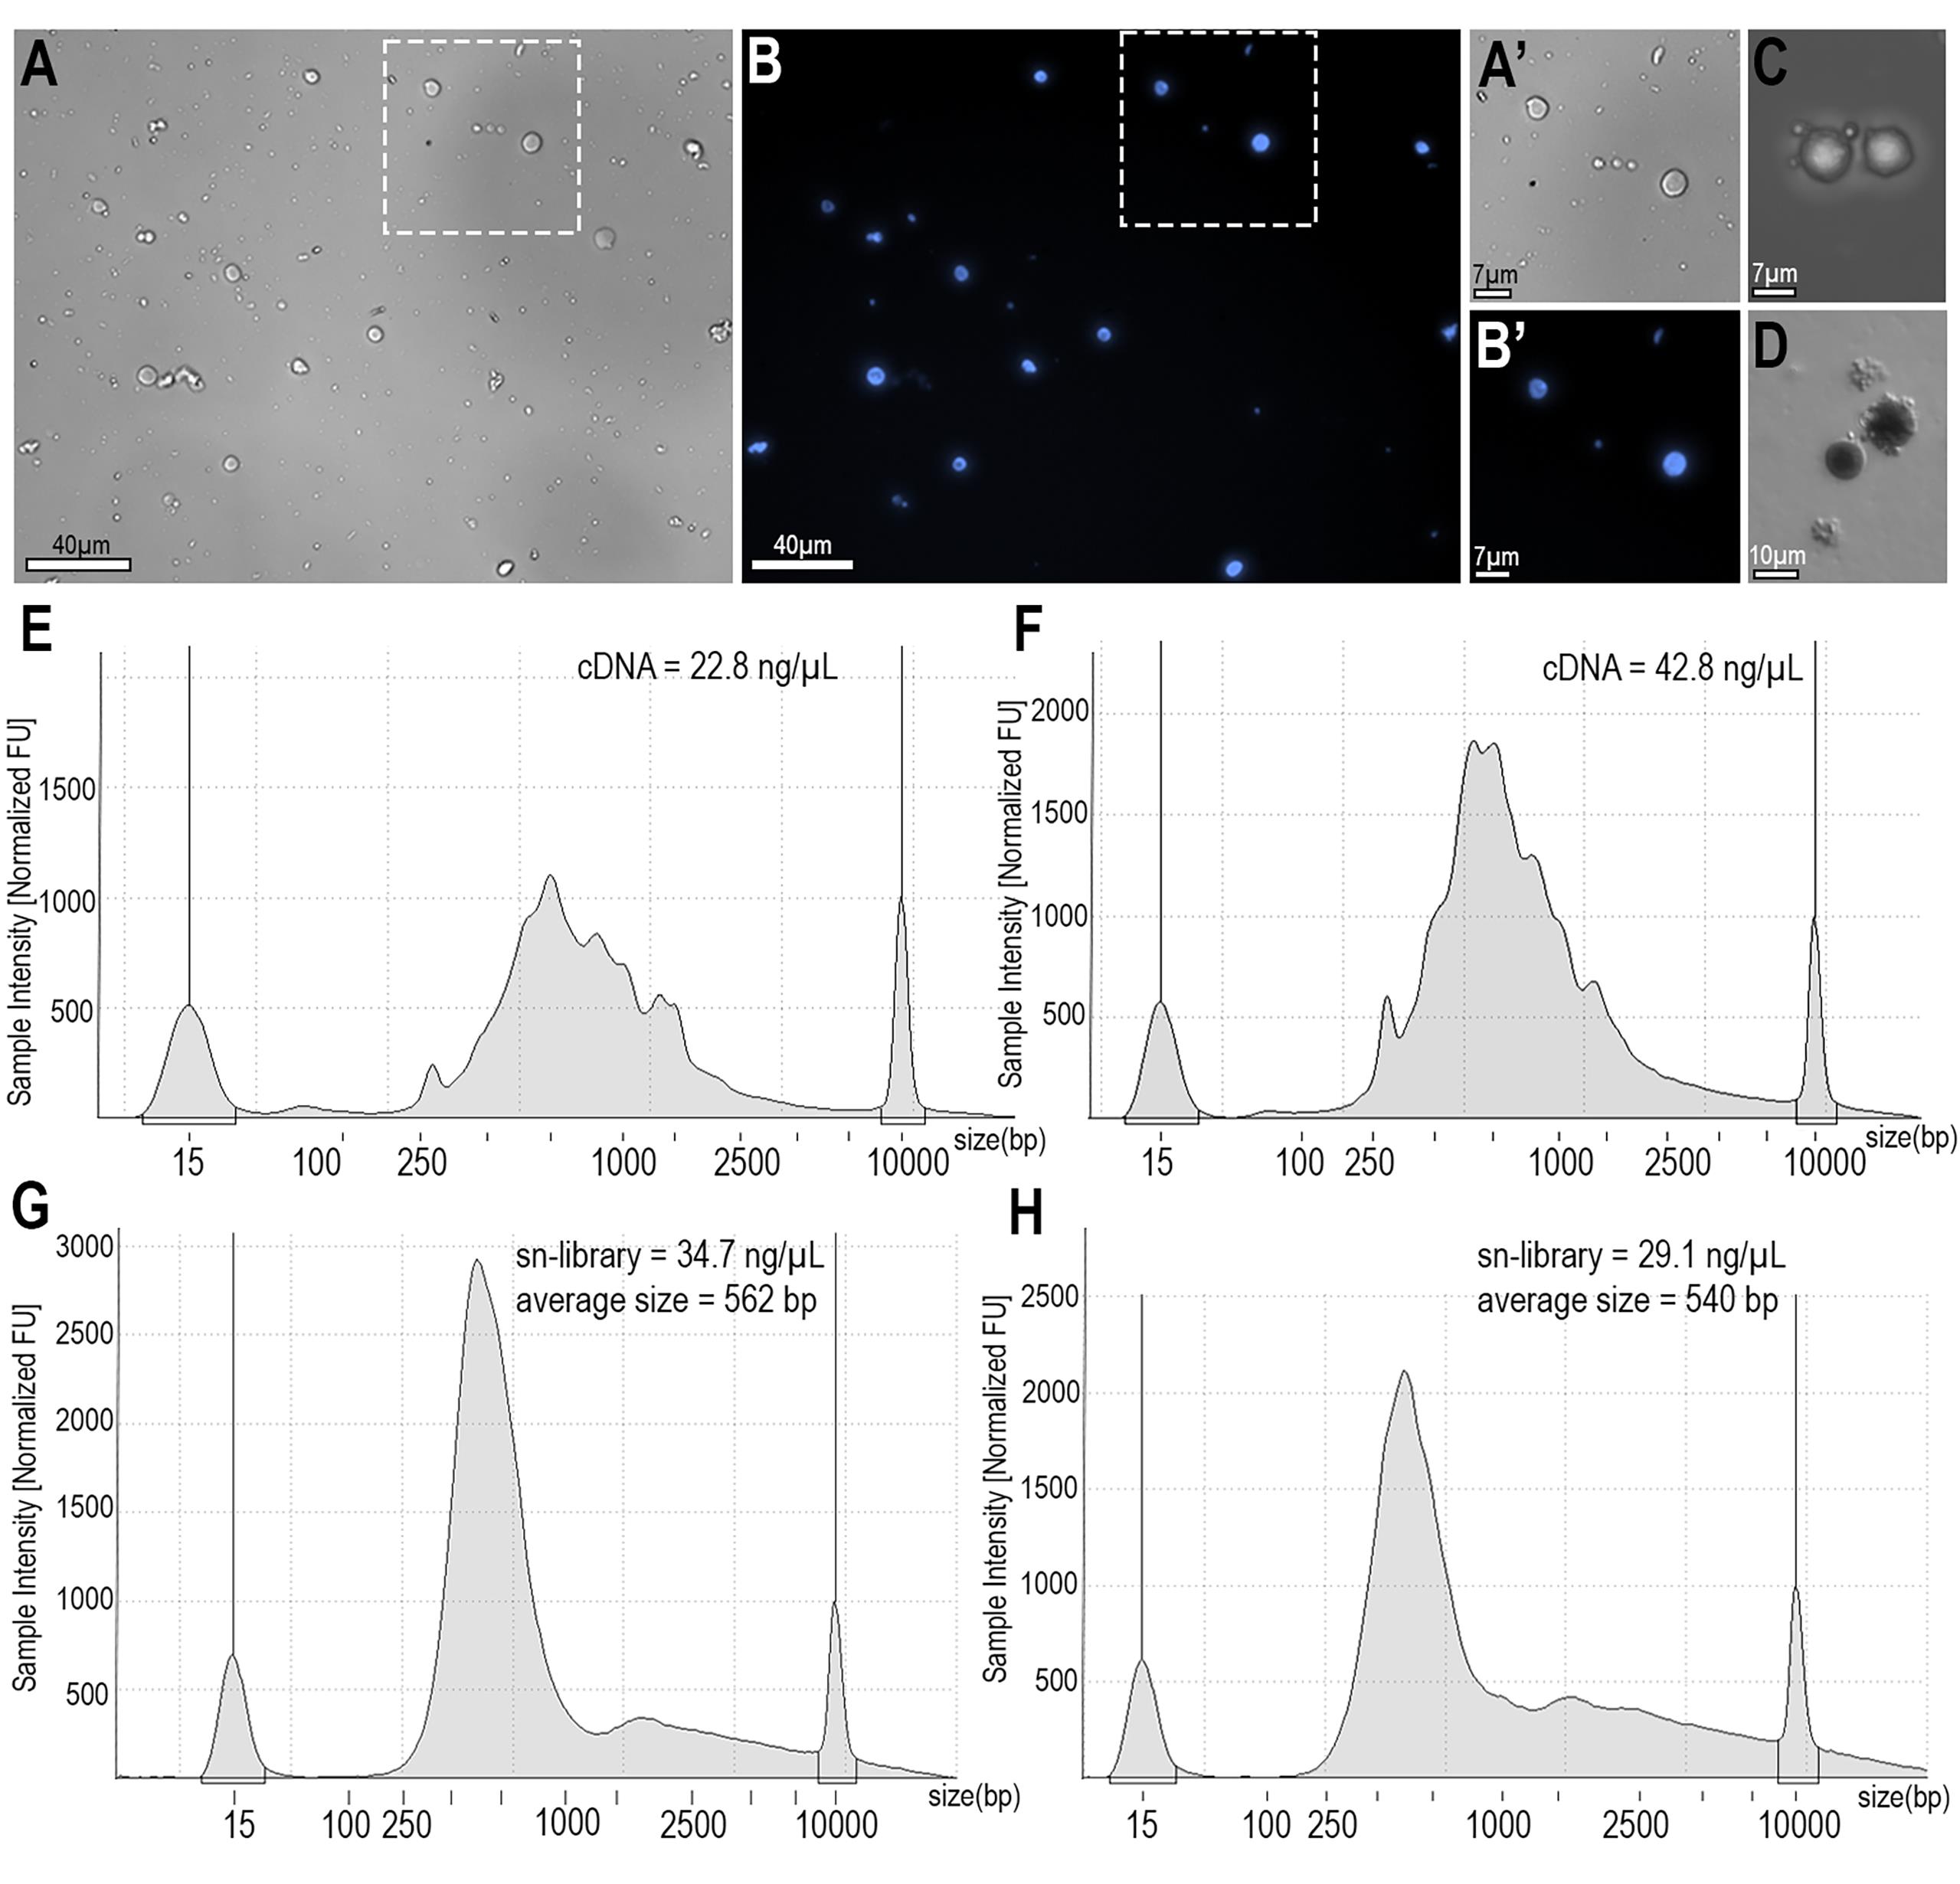
Figure 3. Isolated nuclei from Anopheles gambiae fat body. (A) Bright field and (B) nuclei staining (blue). Scale bar: 40 μm. (A’, B’) Zoom-in showing good-quality nuclei of different sizes. Scale bar: 7 μm. (C) Bright field showing poor-quality nuclei, with blebbing. Scale bar: 7 μm. (D) Bright field of the Newbauer chamber showing good (right) and poor (left) nuclei. Scale bar: 10 μm. (E, F) cDNA sample intensity normalized and acquired with TapeStation for sugar-fed (E) and blood-fed (F) samples. (E, F) Library sample intensity normalized and acquired with TapeStation for sugar-fed (G) and blood-fed (H) samples.
Table 1. Summary of parameters before and after quality control (QC) metrics were applied to the single-nucleus RNA sequencing data from sugar-fed and blood-fed dissociated tissues.
| Parameters | Before QC | After QC | ||
| Sample | Sugar-fed | Blood-fed | Sugar-fed | Blood-fed |
| Loaded nuclei | 10,000 cells | 10,000 cells | 10,000 cells | 10,000 cells |
| Recovered nuclei | 19,004 cells** | 20,331 cells** | 7,843 cells | 11,714 cells |
| Mean reads/nucleus* | 11,663 | 15,148 | 28,186 | 26,292 |
| Median genes/nuclei | 877 | 886 | 578 | 589.5 |
| Average DecontX contamination | 0.76 | 0.71 | 0.58 | 0.6 |
| Average % mitochondria | 3.4% | 5.6% | 4.1% | 5.1% |
| Average % ribosome | 8.1% | 16.4% | 8.9% | 15.4% |
| Fraction reads in nuclei | 46.3%*** | 72.4% | N/A | N/A |
*Mean reads per cell after setting quality thresholds were estimated based on the total number of reads and the recovered number of nuclei after QC analysis.
**The number of recovered cells is higher than the number of loaded cells before QC. That is a common observation in single-nuclei RNA-seq that may be caused by ambient RNA contamination.
***Low fraction reads in nuclei indicate that many reads were not assigned to nuclei-associated barcodes, which could mean contamination with ambient RNA or cells with low RNA content.
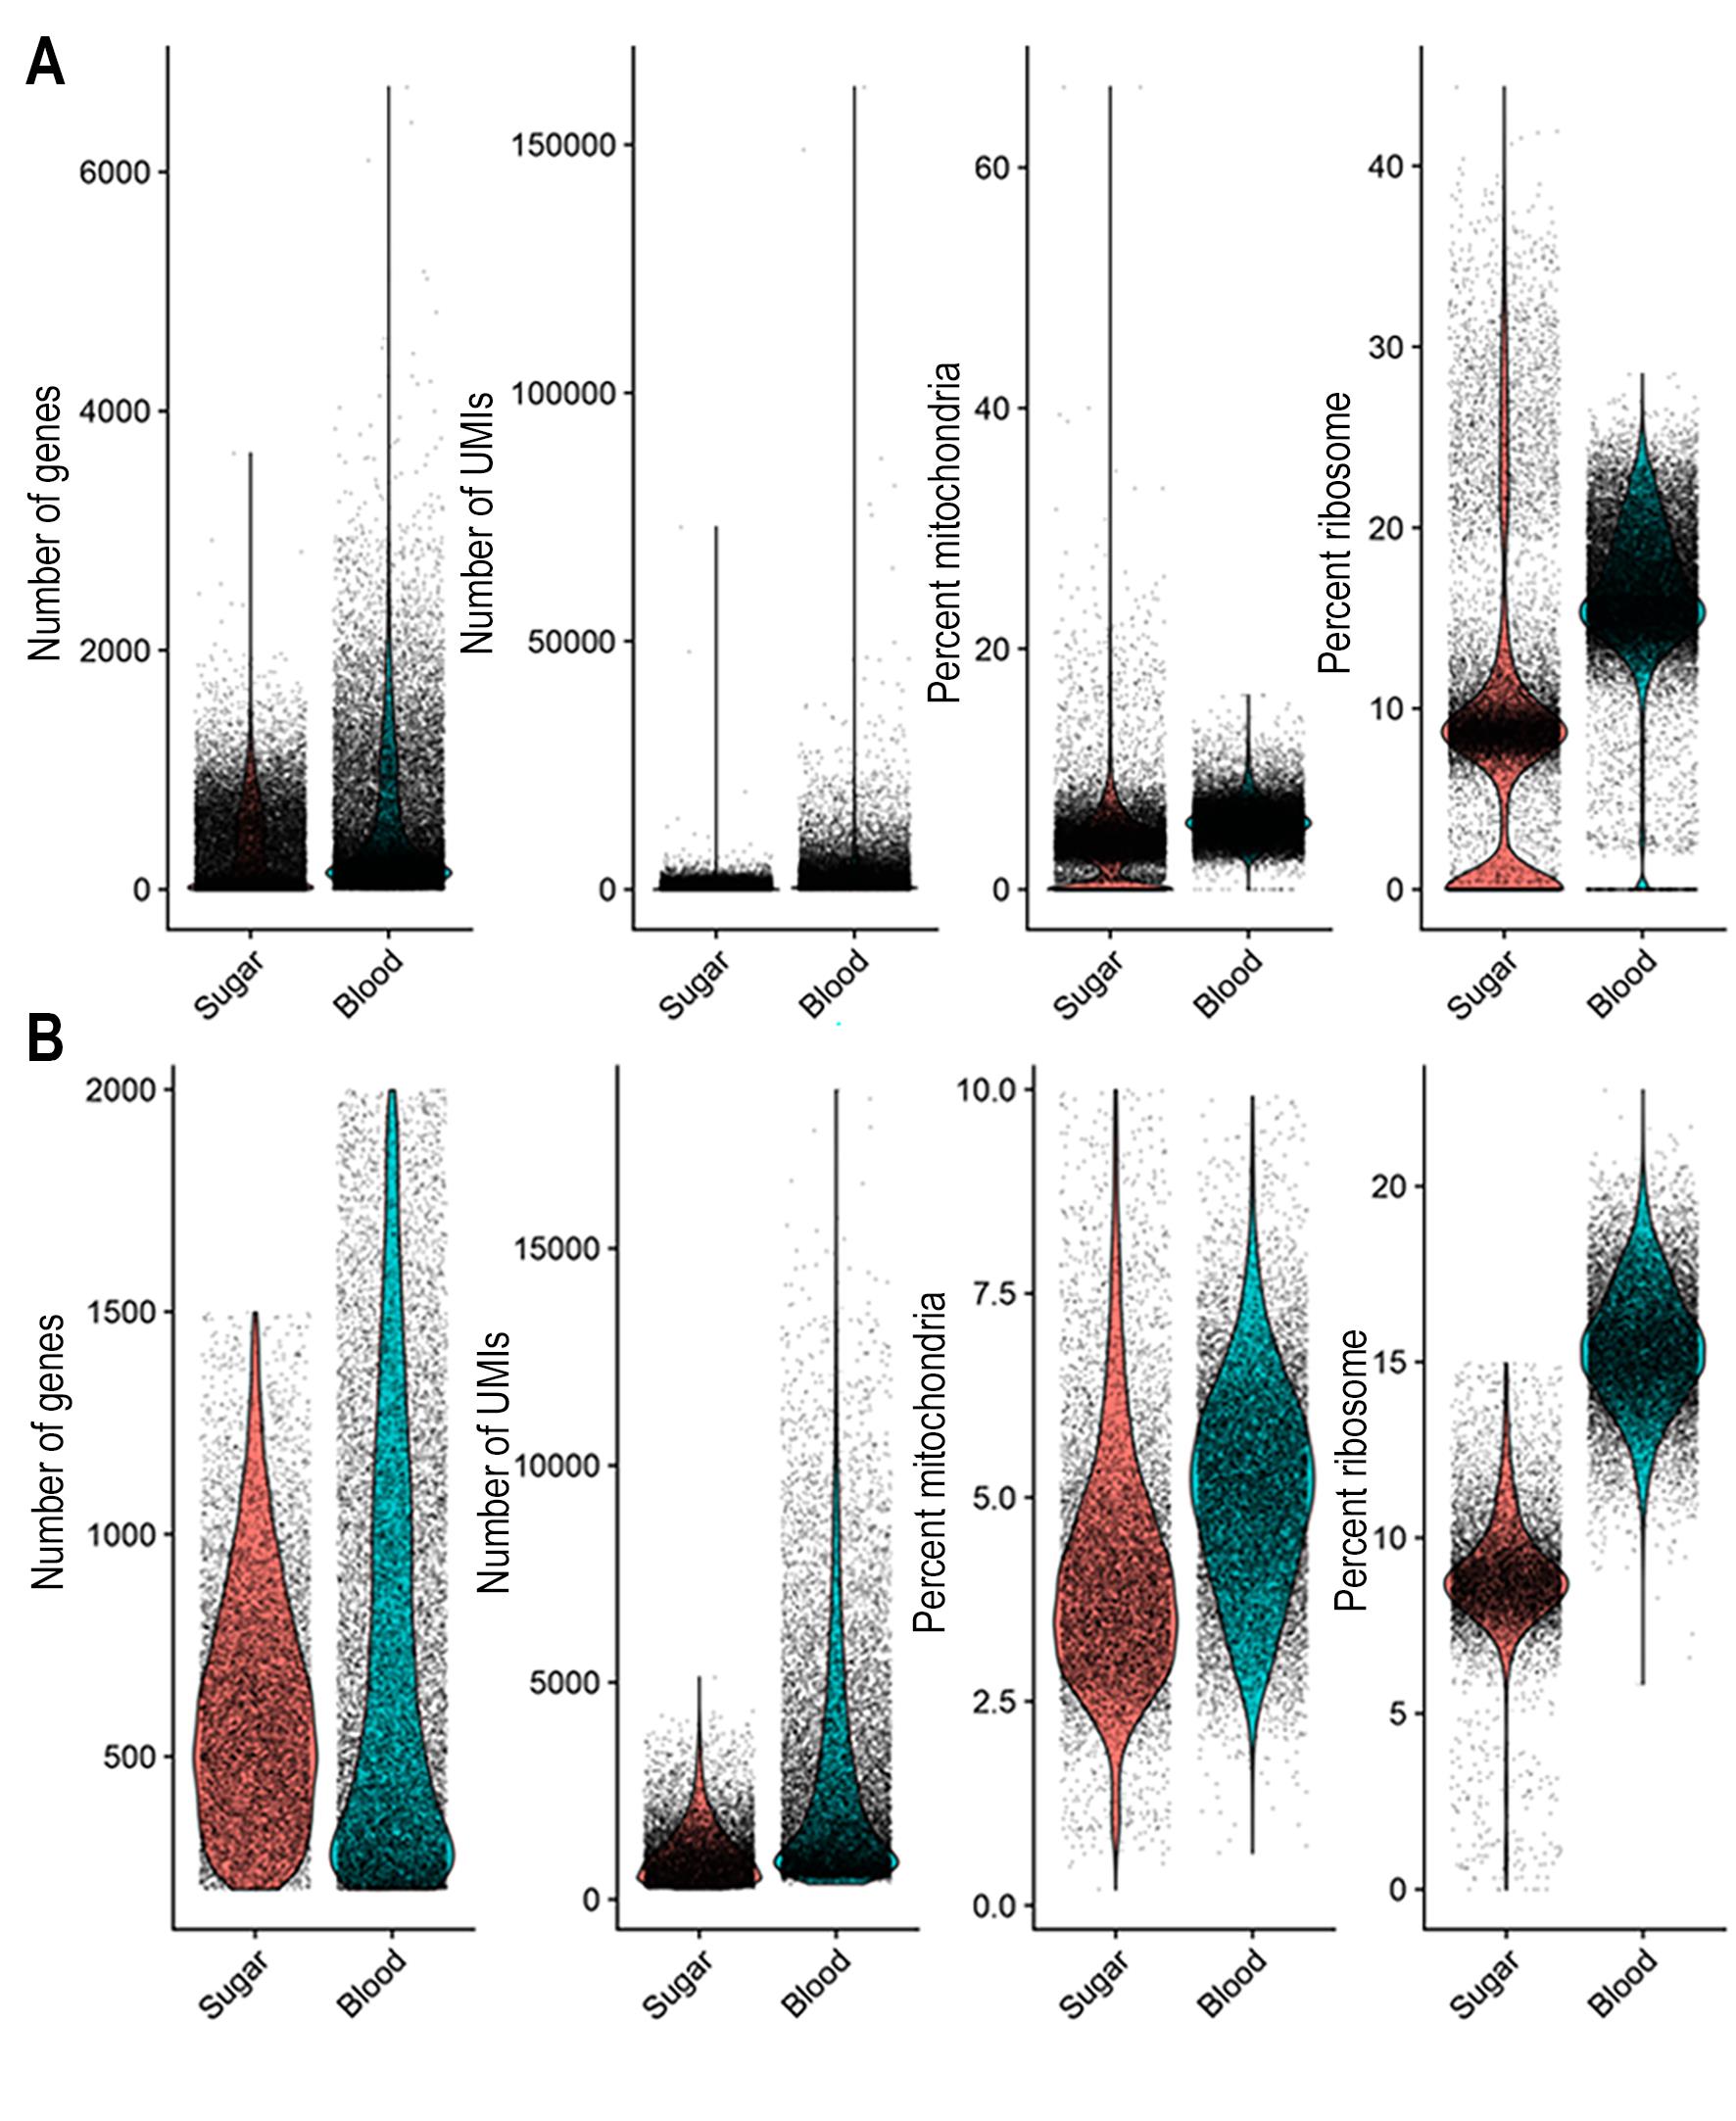
Figure 4. Data distribution before and after quality filtering. (A, B) Distribution of the number of genes (nFeature), number of UMIs (nCount), percent of mitochondrial gene expression, and percentage of ribosome gene expression contamination score in sugar-fed and blood-fed samples, before (A) and after (B) quality filtering.
This protocol (or parts of it) has been used and validated in the following research article(s):
• de Carvalho et al. [22]. Cell-specific responses of Anopheles gambiae fat body to blood feeding and infection at a single nuclei resolution. bioRxiv 2025.07.29.667437; doi: https://doi.org/10.1101/2025.07.29.667437
General notes and troubleshooting
Libraries were constructed using the Chromium Single Cell 3′ Kit v3.1 (Dual Index) (10X Genomics) following the manufacturer’s standard protocol. In the Chromium workflow, gel bead-in-emulsion (GEM) formation is a critical initial step, and the quality of the nuclei suspension can influence emulsion integrity. Samples with excessive lipids or residual debris can interfere with stable GEM formation or the microfluidic capillary system. Biphasic or heterogeneous GEM formation may lead to library prep failure. For this reason, a clean, low-debris nuclei preparation is essential for reliable library generation.
The 10X Chromium protocol has a correlation table to adjust cDNA and library amplification cycles based on the measured DNA mass of each sample, ensuring appropriate amplification while minimizing technical artifacts during sequencing. In cases where libraries exhibit an over-representation of short fragments (<200 bp), the manufacturer recommends an additional cleanup step. Although this may reduce yield, it improves downstream sequencing performance by reducing the contribution of nonspecific low fragments.
Sequencing was performed on an Illumina NextSeq 2000 platform using paired-end 150 bp reads. The targeted sequencing depth was approximately 20,000 reads per nucleus, or until library saturation was achieved, consistent with standard recommendations for single-nucleus 3′ gene expression profiling.
Troubleshooting (Table 2)
Table 2. Summary of main issues and suggested solutions for fat body nuclei isolation.
| Step/problem | Possible cause | Suggested solution | Notes |
|---|---|---|---|
| Poor pellet formation after sucrose spin | Incorrect sucrose concentration or low centrifugation force. | Ensure the sucrose cushion is homogeneous. Carefully overlay the sample on top of the cushion without mixing. Verify centrifuge settings. | Make sure the tube is balanced. Gently handle to avoid disturbing the gradient. |
| Excess debris or lipids | Harsh tissue dissociation or prolonged exposure to lysis buffer (>10 min). | Perform additional washes. Pass the sample through 20–40 μm filters if needed. | Filtering might reduce nuclei yield. Use a swing rotor during washes. |
| Low nuclei concentration | Loss during sucrose cushion or wash steps; low starting material (<20 tissues). | Pool multiple samples to increase yield. Avoid removing all supernatant during washes to minimize loss. | Use gentle pipetting to preserve nuclei. |
| High ambient RNA | Harsh homogenization or extended time on lysis buffer (>10 min). | Minimize processing time; keep samples on ice; check for nuclei integrity before proceeding. | Increasing BSA concentration in the resuspension buffer (up to 2%) can reduce aggregation and RNA leakage. |
Acknowledgments
S.S.D.C and C.B.-M. conceptualized and planned the study. S.S.D.C. performed test trials and troubleshooting. S.S.D.C. performed immunofluorescence and image analysis. S.S.D.C. and C.B.-M. wrote the manuscript. S.S.D.C., C.M., and C.B.-M. edited the manuscript. S.S.D.C. and C.M. performed data analysis. We thank Kevin Lee, Yonas Gebremicale, Andre Laughinghouse, and Claudio Meneses for insectary support. This work was supported by the Intramural Research Program of the Division of Intramural Research Z01AI000947, NIAID. The graphical overview was created in https://BioRender.com.
This research was supported by the Intramural Research Program of the National Institutes of Health (NIH). The contributions of the NIH author(s) were made as part of their official duties as NIH federal employees, are in compliance with agency policy requirements, and are considered Works of the United States Government. However, the findings and conclusions presented in this paper are those of the author(s) and do not necessarily reflect the views of the NIH or the U.S. Department of Health and Human Services. This protocol was used in de Carvalho et al. [22]. Cell-specific responses of Anopheles gambiae fat body to blood feeding and infection at a single nuclei resolution. bioRxiv 2025.07.29.667437; doi: https://doi.org/10.1101/2025.07.29.667437.
Competing interests
The authors declare no conflicts of interest.
Ethical considerations
Public Health Service Animal Welfare Assurance #A4149-01 guidelines were followed according to the National Institutes of Health (NIH) Office of Animal Care and Use (OACU). These studies were done according to the NIH animal study protocol (ASP) approved by the NIH Animal Care and User Committee (ACUC), with approval ID ASP-LMVR5.
References
- Arrese, E. L. and Soulages, J. L. (2010). Insect Fat Body: Energy, Metabolism, and Regulation. Annu Rev Entomol. 55(1): 207–225. https://doi.org/10.1146/annurev-ento-112408-085356
- Attardo, G. M., Hansen, I. A. and Raikhel, A. S. (2005). Nutritional regulation of vitellogenesis in mosquitoes: Implications for anautogeny. Insect Biochem Mol Biol. 35(7): 661–675. https://doi.org/10.1016/j.ibmb.2005.02.013
- Li, M., Zhou, Y., Cheng, J., Wang, Y., Lan, C. and Shen, Y. (2024). Response of the mosquito immune system and symbiotic bacteria to pathogen infection. Parasit Vectors. 17(1): e1186/s13071–024–06161–4. https://doi.org/10.1186/s13071-024-06161-4
- Raikhel, A. S. and Lea, A. O. (1983). Previtellogenic development and vitellogenin synthesis in the fat body of a mosquito: An ultrastructural and immunocytochemical study. Tissue Cell. 15(2): 281–299. https://doi.org/10.1016/0040-8166(83)90023-x
- Stenkula, K. G. and Erlanson-Albertsson, C. (2018). Adipose cell size: importance in health and disease. Am J Physiol Regul Integr Comp Physiol. 315(2): R284–R295. https://doi.org/10.1152/ajpregu.00257.2017
- Maniyadath, B., Zhang, Q., Gupta, R. K. and Mandrup, S. (2023). Adipose tissue at single-cell resolution. Cell Metab. 35(3): 386–413. https://doi.org/10.1016/j.cmet.2023.02.002
- Mattei, D., Ivanov, A., van Oostrum, M., Pantelyushin, S., Richetto, J., Mueller, F., Beffinger, M., Schellhammer, L., vom Berg, J., Wollscheid, B., et al. (2020). Enzymatic Dissociation Induces Transcriptional and Proteotype Bias in Brain Cell Populations. Int J Mol Sci. 21(21): 7944. https://doi.org/10.3390/ijms21217944
- O’Flanagan, C. H., Campbell, K. R., Zhang, A. W., Kabeer, F., Lim, J. L. P., Biele, J., Eirew, P., Lai, D., McPherson, A., et al. (2019). Dissociation of solid tumor tissues with cold active protease for single-cell RNA-seq minimizes conserved collagenase-associated stress responses. Genome Biol. 20(1): e1186/s13059–019–1830–0. https://doi.org/10.1186/s13059-019-1830-0
- Habib, N., Avraham-Davidi, I., Basu, A., Burks, T., Shekhar, K., Hofree, M., Choudhury, S. R., Aguet, F., Gelfand, E., Ardlie, K., et al. (2017). Massively parallel single-nucleus RNA-seq with DroNc-seq. Nat Methods. 14(10): 955–958. https://doi.org/10.1038/nmeth.4407
- Krishnaswami, S. R., Grindberg, R. V., Novotny, M., Venepally, P., Lacar, B., Bhutani, K., Linker, S. B., Pham, S., Erwin, J. A., Miller, J. A., et al. (2016). Using single nuclei for RNA-seq to capture the transcriptome of postmortem neurons. Nat Protoc. 11(3): 499–524. https://doi.org/10.1038/nprot.2016.015
- Bakken, T. E., Hodge, R. D., Miller, J. A., Yao, Z., Nguyen, T. N., Aevermann, B., Barkan, E., Bertagnolli, D., Casper, T., Dee, N., et al. (2018). Single-nucleus and single-cell transcriptomes compared in matched cortical cell types. PLoS One. 13(12): e0209648. https://doi.org/10.1371/journal.pone.0209648
- Wu, H., Kirita, Y., Donnelly, E. L. and Humphreys, B. D. (2019). Advantages of Single-Nucleus over Single-Cell RNA Sequencing of Adult Kidney: Rare Cell Types and Novel Cell States Revealed in Fibrosis. J Am Soc Nephrol. 30(1): 23–32. https://doi.org/10.1681/asn.2018090912
- Cui, Y., Behura, S. K. and Franz, A. W. E. (2022). Cellular diversity and gene expression profiles in the male and female brain of Aedes aegypti. BMC Genomics. 23(1): e1186/s12864–022–08327–9. https://doi.org/10.1186/s12864-022-08327-9
- Cui, Y. and Franz, A. W. (2020). Heterogeneity of midgut cells and their differential responses to blood meal ingestion by the mosquito, Aedes aegypti. Insect Biochem Mol Biol. 127: 103496. https://doi.org/10.1016/j.ibmb.2020.103496
- Feng, M., Xia, J., Fei, S., Huang, Y., Lai, W., Swevers, L. and Sun, J. (2023). Single-Nucleus Sequencing of Fat Body Reveals Distinct Metabolic and Immune Response Landscapes in Silkworm Larvae after Bombyx mori Nucleopolyhedrovirus Infection. J Immunol. 211(1): 140–153. https://doi.org/10.4049/jimmunol.2300007
- Gupta, V., Frank, A. M., Matolka, N. and Lazzaro, B. P. (2022). Inherent constraints on a polyfunctional tissue lead to a reproduction-immunity tradeoff. BMC Biol. 20(1): e1186/s12915–022–01328–w. https://doi.org/10.1186/s12915-022-01328-w
- Gupta, V. and Lazzaro, B. P. (2021). A robust method to isolate Drosophila fat body nuclei for transcriptomic analysis. Fly (Austin). 16(1): 62–67. https://doi.org/10.1080/19336934.2021.1978776
- Singleton, K. and Woodruff, R. I. (1994). The Osmolarity of Adult Drosophila Hemolymph and Its Effect on Oocyte-Nurse Cell Electrical Polarity. Dev Biol. 161(1): 154–167. https://doi.org/10.1006/dbio.1994.1017
- Yang, S., Corbett, S. E., Koga, Y., Wang, Z., Johnson, W. E., Yajima, M. and Campbell, J. D. (2020). Decontamination of ambient RNA in single-cell RNA-seq with DecontX. Genome Biol. 21(1): e1186/s13059–020–1950–6. https://doi.org/10.1186/s13059-020-1950-6
- Young, M. D. and Behjati, S. (2020). SoupX removes ambient RNA contamination from droplet-based single-cell RNA sequencing data. GigaScience. 9(12): e1093/gigascience/giaa151. https://doi.org/10.1093/gigascience/giaa151
- Wang, W., Cen, Y., Lu, Z., Xu, Y., Sun, T., Xiao, Y., Liu, W., Li, J. J. and Wang, C. (2024). scCDC: a computational method for gene-specific contamination detection and correction in single-cell and single-nucleus RNA-seq data. Genome Biol. 25(1): e1186/s13059–024–03284–w. https://doi.org/10.1186/s13059-024-03284-w
- de Carvalho, S. S., McNinch, C., Barletta, A. B. and Barillas-Mury, C. (2025). Cell-specific responses of Anopheles gambiae fat body to blood feeding and infection at a single nuclei resolution. bioRxiv: e667437. https://doi.org/10.1101/2025.07.29.667437
Article Information
Publication history
Received: Oct 27, 2025
Accepted: Dec 7, 2025
Available online: Dec 16, 2025
Published: Jan 5, 2026
Copyright
© 2026 The Author(s); This is an open access article under the CC BY-NC license (https://creativecommons.org/licenses/by-nc/4.0/).
How to cite
de Carvalho, S. S., McNinch, C. and Barillas-Mury, C. (2026). Optimized Method for High-Quality Isolation of Single-Nuclei From Mosquito Fat Body for RNA Sequencing. Bio-protocol 16(1): e5564. DOI: 10.21769/BioProtoc.5564.
Category
Molecular Biology > RNA > RNA sequencing
Cell Biology > Organelle isolation > Nuclei
Cell Biology > Single cell analysis
Do you have any questions about this protocol?
Post your question to gather feedback from the community. We will also invite the authors of this article to respond.