- Protocols

- Articles and Issues
- For Authors
- About
- Become a Reviewer

Generating ER-TRG and CA-ER-TRG Knock-in Mice and Quantitative In Vivo Imaging of ER-phagy
(*contributed equally to this work) Published: Vol 16, Iss 1, Jan 5, 2026 DOI: 10.21769/BioProtoc.5559 Views: 434
Reviewed by: David PaulKeisuke TabataAnonymous reviewer(s)
Original research article
The authors used this protocol in:
Nov 2024
Advertisement


Protocol Collections
Comprehensive collections of detailed, peer-reviewed protocols focusing on specific topics


Related protocols
Abstract
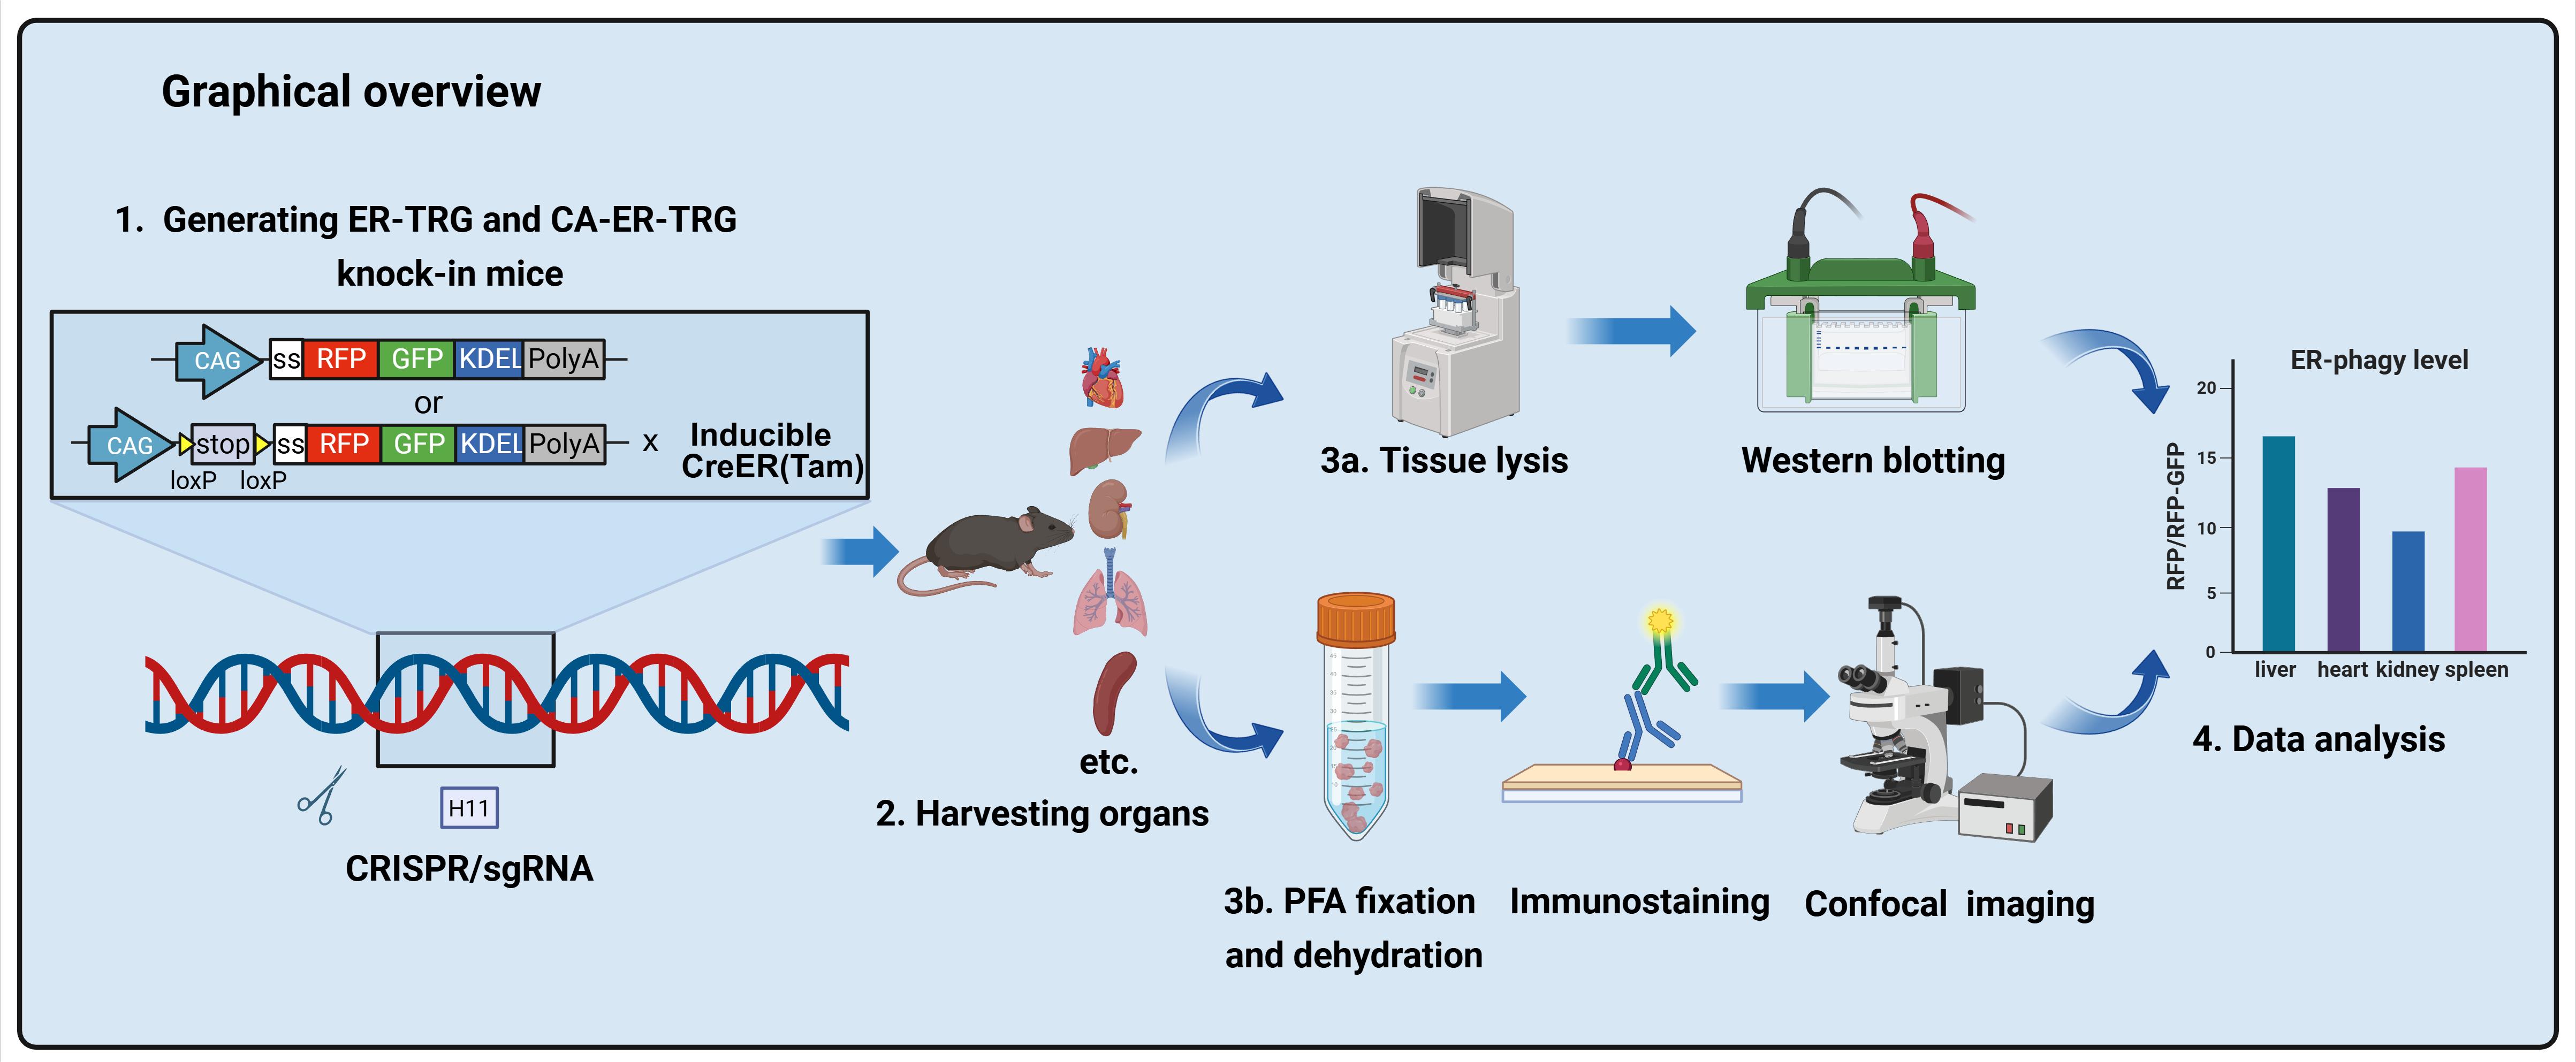
ER-phagy, a selective autophagy process crucial for maintaining cellular homeostasis by targeting the endoplasmic reticulum (ER), has been challenging to study in vivo due to the lack of suitable spatiotemporal quantification tools. Existing methods like electron microscopy, biochemical assays, and in vitro reporters lack resolution, scalability, or physiological relevance. Here, we present a detailed protocol for generating two transgenic mouse models: ER-TRG (constitutively expressing an ER lumen-targeting tandem RFP-GFP tag) and CA-ER-TRG (Cre-recombinase-activated ER-TRG). Additionally, we outline procedures for quantitative imaging of ER-phagy in vivo, covering tissue preparation, confocal microscopy, and signal analysis. This protocol offers a robust and reproducible tool for investigating ER-phagy dynamics across various tissues, developmental stages, and pathophysiological conditions, facilitating both fundamental and translational research.
Key features
• Enables live, single-cell resolution imaging of ER-phagy dynamics across intact tissues in mice.
• Features a Cre-recombinase-activated knock-in model (CA-ER-TRG) for spatiotemporally controlled ER-phagy studies in specific cell types.
• Quantifies ER-phagy flux via pH-sensitive RFP-GFP signal ratiometry and lysosomal co-localization in vivo.
Keywords: ER-phagyGraphical overview
Background
The endoplasmic reticulum (ER) plays a pivotal role in multiple cellular functions, including protein synthesis, lipid metabolism, and calcium homeostasis [1]. To maintain its proper function, excess or damaged ER is degraded via ER-phagy, a conserved selective autophagy pathway [2,3]. Dysregulation of ER-phagy has been implicated in numerous diseases, such as cancer, neurodegeneration, and metabolic disorders, highlighting the importance of studying its in vivo dynamics [4].
Current methods for assessing ER-phagy, such as electron microscopy, biochemical assays, or in vitro fluorescent reporters, present significant limitations. Electron microscopy is labor-intensive and not well-suited for large-scale tissue analysis. Biochemical assays lack cellular-level detail, and in vitro reporters cannot recapitulate the complexity of in vivo tissues.
To address these limitations, we engineered ER-TRG and CA-ER-TRG knock-in mice. The ER-TRG model constitutively expresses a KDEL-tagged tandem RFP-GFP reporter that localizes to the ER lumen. This established reporter strategy leverages the distinct pH-dependent fluorescence properties of RFP and GFP to quantify autophagic flux. As the reporter is ubiquitously distributed throughout the ER network, it serves as an effective tool for measuring bulk ER-phagy [5].
While overexpression of ER-lumen tandem fluorescent proteins functions reliably as ER-phagy reporters in vitro, their in vivo efficacy for faithful visualization of ER-phagy and architecture without adverse effects remains uncertain. To address this, we construct the CA-ER-TRG model, a Cre-inducible variant, by integrating the Cre-loxP recombination system with the ER-TRG gene cassette. This approach allows for the insertion of the ER-TRG gene into the genome at a specific locus under the control of a Cre-responsive promoter. Upon introduction of Cre recombinase, the loxP sites are recombined, enabling the expression of ER-TRG in a spatiotemporally controlled manner. This precise genetic engineering strategy minimizes potential artifacts associated with constitutive reporter expression [6].
These tools enable the study of ER-phagy across different tissues, developmental stages, and stress conditions (starvation, injury), facilitating insights into its physiological and pathological roles.
Materials and reagents
Biological materials
1. H11-CAG-PMD18T (Synthesized by Gempharmatech)
2. pCW57-CMV-ssRFP-GFP-KDEL (Addgene, catalog number: 128257 [5])
3. pER-TRG (donor vector, available on request [7])
4. pCA-ER-TRG (donor vector, available on request [7])
5. AAV-PHP.eB-hSyn-Cre (commercially custom-produced, wzbio, Shandong [7])
6. C57BL/6J mice (Gempharmatech)
7. ICR mice (Charles River)
8. ER-TRG mice [7]
9. CA-ER-TRG mice (Jackson Laboratory, catalog number: 040208 [7])
10. Aldh1l1-CreERT2 mice (Gift from Prof. Tianming Gao, Sothern Medical University [8])
11. Primary hepatocytes (isolated from ER-TRG mice)
12. Liver and brain from wild-type (WT) and transgenic mice
Reagents
1. Cas9 (ACROBiosystems, catalog number: GMP-CA9S18)
2. PMSG (NSHF)
3. hCG (NSHF)
4. Hyaluronidase (AibeiBio, catalog number: M2215)
5. Mineral oil (AibeiBio, catalog number: M2470)
6. M2 culture medium (Sigma, catalog number: MR-015-D)
7. KSOM culture medium (Sigma, catalog number: MR-121-D)
8. Mouse monoclonal anti-GAPDH (Proteintech, catalog number: 60004-1-Ig)
9. Mouse monoclonal anti-RFP (Thermo Fisher Scientific, catalog number: MA5-15257)
10. Rabbit monoclonal anti-LAMP1 (Cell Signaling, catalog number: 99437S)
11. Goat anti-mouse IgG (H+L), Alexa Fluor 647 (Thermo Fisher Scientific, catalog number: A-31573)
12. HRP conjugated goat anti-rabbit IgG goat polyclonal antibody (HuaBio, catalog number: HA1001)
13. HRP conjugated goat anti-mouse IgG goat polyclonal antibody (HuaBio, catalog number: HA1006)
14. DMSO (Sigma, catalog number: D2650)
15. Agarose (Sigma, catalog number: A2576)
16. HEPES (Sigma, catalog number: 54457)
17. Potassium acetate (Sigma, catalog number: P1190)
18. DAPI (Beyotime, catalog number: C1002)
19. SAKURA Tissue-Tek® OCT compound (Sakura, catalog number: 4583)
20. Paraformaldehyde (PFA) (Aladdin, catalog number: 30525-89-4)
21. Sucrose (Aladdin, catalog number: S818049)
22. Fluoromount-G (SouthernBiotech, catalog number: 0100-01)
23. DMEM medium (high glucose) (BasalMedia, catalog number: L110KJ)
24. Fetal bovine serum (FBS) (ExCell Bio, catalog number: FSS500)
25. Penicillin-streptomycin (100×) (BasalMedia, catalog number: S110JV)
26. Collagenase Type II (Thermo Fisher Scientific, catalog number: 17101-015)
27. Collagenase Type IV (Thermo Fisher Scientific, catalog number: 17104-019)
28. Protease inhibitor cocktail (Roche, catalog number: 04693132001)
29. Phosphatase inhibitor (Selleck, catalog number: B15001)
30. Tamoxifen (MCE, catalog number: HY-13757A)
31. Corn oil (MCE, CAS number: 8001-30-7)
32. BSA (FUDE Biology, catalog number: FD0030)
33. Polyvinylidene fluoride (PVDF) membrane (Vazyme, catalog number: E801-01)
34. BCA Protein Assay kit (Beyotime, catalog number: P0012)
35. RIPA lysis buffer (Beyotime, catalog number: P0013E)
36. Tris-HCl (1 M, pH 8.0) (Sangon Biotech, catalog number: B548127-0500)
37. NaOH (Sangon Biotech, catalog number: A100583-0500)
Solutions
1. Perfusion buffer I (see Recipes)
2. Perfusion buffer II (see Recipes)
3. 4% PFA (pH 7.0) (see Recipes)
4. Permeabilization buffer (see Recipes)
5. Blocking buffer (see Recipes)
6. Tamoxifen (see Recipes)
Recipes
1. Perfusion buffer I
| Reagent | Final concentration | Quantity or volume |
|---|---|---|
| NaHCO3 | 0.075% | 300 μL |
| EDTA | 0.5 mM | 30 μL |
| HANKS (no Ca/Mg) | 100% | 30 mL |
| Total | n/a | 30 mL |
Dissolve 3.75 g of NaHCO3 in distilled water, fill up to 50 mL, and filter-sterilize with a 0.22 μm filter. Dissolve 9.306 g of EDTA·2Na·2H2O in distilled water, fill up to 50 mL, adjust pH to 8.0 with NaOH, and filter-sterilize with a 0.22 μm filter. For 30 mL of perfusion buffer I, mix 30 mL of HANKS (no Ca/Mg), 300 μL of 7.5% NaHCO3, and 30 μL of 0.5 M EDTA (pH = 8.0), and filter-sterilize with a 0.22 μm filter. Store at 4 °C and prewarm to 37 °C before use.
2. Perfusion buffer II
| Reagent | Final concentration | Quantity or volume |
|---|---|---|
| CaCl2 | 5 mM | 20 μL |
| NaHCO3 | 0.075% | 100 μL |
| Collagenase Type II | 0.5–1 mg/mL | 5–10 mg |
| Collagenase Type IV | 0.5–1 mg/mL | 5–10 mg |
| HANKS (Ca/Mg) | 100% | 10 mL |
| Total | n/a | 10 mL |
Dissolve 13.8725 g of CaCl2 in distilled water, fill up to 50 mL, and filter-sterilize with a 0.22 μm filter. Prepare fresh immediately before use. Dissolve 3.75 g of NaHCO3 in distilled water, fill up to 50 mL, and filter-sterilize with a 0.22 μm filter. For 10 mL of perfusion buffer II, mix 10 mL of HANKS (Ca/Mg), 100 μL of 7.5% NaHCO3, 20 μL of 2.5 M CaCl2, and 0.5–1 mg/mL Collagenase Type II and IV. Prepare the solution, which should appear light brown, and filter-sterilize with a 0.22 μm filter. Store at 4 °C and prewarm to 37 °C before use.
3. 4% PFA (pH 7.0)
| Reagent | Final concentration | Quantity or volume |
|---|---|---|
| PFA | 4% | 40 g |
| PBS | 100% | 1 L |
| Total | n/a | 1 L |
Dissolve 40 g of paraformaldehyde in sterile PBS and fill up to 1 L. Adjust pH to 7.0 with NaOH or HCl. Store at 4 °C.
4. Permeabilization buffer
| Reagent | Final concentration | Quantity or volume |
|---|---|---|
| Triton X-100 | 0.3% | 30 μL |
| BSA | 3% | 300 mg |
| PBS | 100% | 10 mL |
| Total | n/a | 10 mL |
Dissolve 30 μL of Triton X-100 and 300 mg of BSA in sterile PBS and fill up to 10 mL. Prepare fresh immediately before use.
5. Blocking buffer
| Reagent | Final concentration | Quantity or volume |
|---|---|---|
| Goat serum | 5% | 500 μL |
| PBS | 100% | 10 mL |
| Total | n/a | 10 mL |
Dissolve 500 μL of goat serum in sterile PBS and fill up to 10 mL. Store at 4 °C.
6. Tamoxifen
| Reagent | Final concentration | Quantity or volume |
|---|---|---|
| Tamoxifen | 2% | 200 mg |
| Corn oil | 100% | 10 mL |
| Total | n/a | 10 mL |
Dissolve 200 mg of tamoxifen in corn oil by ultrasonication and fill up to 10 mL. Store at -20 °C under light-protected conditions.
Laboratory supplies
1. 100 mm cell culture dish (Vazyme, catalog number: CCD10150)
2. Cell culture plate, 12 well (Vazyme, catalog number: CCP01012)
3. Centrifuge tubes, 15 mL (Vazyme, catalog number: TCF0015A-02B)
4. Centrifuge tubes, 50 mL (Vazyme, catalog number: TCF0050A-02B)
5. Disposable serological pipette, 10 mL (Vazyme, catalog number: CPP00010)
6. 10 μL pipette tips (Kedichen, catalog number: KDC-T-10)
7. 200 μL pipette tips (Kedichen, catalog number: KDC-T-200)
8. 1,250 μL pipette tips (Kedichen, catalog number: KDC-T-1250-B)
9. 0.22 μm filter (Jetbiofil, catalog number: FPE204030)
10. 70 μm cell strainer (Jetbiofil, catalog number: CSS013070)
11. Adhesive slides (SHITAI, catalog number: 158105W)
12. Millipore centrifugal columns (Millipore, UFC501024)
13. Capillary glass tubes GC-1 (Narishige, catalog number: GC-1)
14. Capillary glass tubes G-100 (Narishige, catalog number: G-100)
Equipment
1. Transjector (Eppendorf, model: 5246)
2. Micromanipulator (Narishige, model: NT-88NE)
3. Inverted microscope (Nikon, model: Diaphot 300)
4. Micropipette puller (Narishige, model: PN-30)
5. Stereomicroscope (Nikon, model: MZ800N)
6. Micropipette grinder (Narishige, model: EG-400)
7. Microforge (Narishige, model: MF-900)
8. Confocal microscope (ZEISS, model: LSM 800 with Airyscan)
9. 37 °C Incubator (Heal Force, model: HF90)
10. Cryostat (Thermo Fisher Scientific, model: NX50)
11. Imaging scanning system (Tanon, model: 5200)
Software and datasets
1. LSM 800 Browser (for controlling the laser confocal microscope LSM 800 for image acquisition and processing, ZEISS)
2. Imaris 9.3.1 (3D and 4D biomedical image analysis software, Bitplane)
3. SPSS 17 Measurement data analysis (advanced statistical analysis software, IBM company)
4. GraphPad Prism 8.0.2 (biostatistical analysis software, GraphPad Software Inc.)
5. ImageJ (free and open-source image processing software, available at https://imagej.net)
Procedure
A. Generating ER-TRG knock-in mice
1. Clone the ssRFP-GFP-KDEL ORF from pCW57-CMV-ssRFP-GFP-KDEL as ER-phagy reporter sequence into a donor vector for CRISPR/Cas9-mediated knock-in at the Hipp11 (H11) locus on chromosome 11. The donor vector (pER-TRG) was based on an H11-CAG-PMD18T backbone, a proprietary vector system provided by GemPharmatech. The expression cassettes, consisting of the CAG promoter (CMV enhancer/chicken β-actin), Kozak sequence (GCCACC), the ssRFP-GFP-KDEL ORF, and a polyA signal, were flanked by homology arms targeting the murine H11 locus (Figure 1). Both the 5′ and 3′ homology arms were approximately 1,100 base pairs (bp) in length, corresponding to the genomic sequences immediately upstream and downstream of the intended H11 cleavage site. The complete plasmid sequences are provided in Supplementary Data 1.
Notes:
1. ssRFP stands for a fusion construct consisting of the signal sequence of the ER chaperone BIP (hereafter referred to as ss) fused to red fluorescent protein (ssRFP), to serve as a marker for protein secretion and ER localization.
2. The plasmid pH11-CAG-PMD18T was designed and constructed by Gempharmatech. Detailed information on the construction and sequence of this proprietary vector can be obtained directly from Gempharmatech.
2. Generation of genome-edited mice via zygote microinjection
a. For the preparation of CRISPR-Cas9 microinjection solution, mix commercially synthesized H11-specifc gRNA, donor vector, and Cas9 protein. The final concentrations of CRISPR-Cas9 components in 0.6 mM HEPES (pH 7.5) and 2 mM potassium acetate microinjection buffer were as follows: gRNA (2 pmol/μL), Cas9 protein (25 ng/μL), and donor vector (from 0.01 to 0.05 pmol/μL). Filter the final injection solution through Millipore centrifugal columns and spin at 20,000× g for 10 min at room temperature (RT) [9,10].
Note: H11-specifc gRNA: CTGAGCCAACAGTGGTAGTA
b. Obtain fertilized oocytes (zygotes) at the pronuclear stage from superovulated C57BL/6J female mice. In brief, inject intraperitoneally 8–10-week-old females with 5 IU of pregnant mare serum gonadotropin (PMSG), followed by 5 IU of human chorionic gonadotropin (hCG) 48 h later. Immediately after hCG administration, mate the females with C57BL/6J stud males. Check for the presence of a vaginal plug the following morning. Collect zygotes from the oviducts of plugged females approximately 20–22 h post-hCG injection. Remove cumulus cells by brief incubation in M2 medium containing 300 μg/mL hyaluronidase. Wash the zygotes and culture them in KSOM medium covered with mineral oil at 37 °C in a 5% CO2 atmosphere until microinjection.
c. Perform cytoplasmic microinjections in M2 media using a transjector and Narishige NT-88NE micromanipulators attached to a Nikon Diaphot 300 inverted microscope. The total injection volume was approximately 1–2 pL per zygote, which was estimated based on the volume displacement in the injection needle [9].
3. Embryo transfer
a. Mate virgin ICR female mice (8–12 weeks old) with vasectomized ICR male mice. Check for the presence of a vaginal plug the following morning. Females with a visible vaginal plug were designated as pseudo-pregnant and used as foster mothers for embryo transfer on the same day (0.5 days post-coitum, dpc).
b. Transfer oocytes that survived microinjections to the oviducts of pseudopregnant ICR foster mice and carry them to term. Identify positively targeted F0 animals by PCR and Southern blot analysis of genomic DNA isolated from tail biopsies.
4. Identify offspring with successful knock-in via polymerase chain reaction (PCR) genotyping (see ER-TRG mice genotyping). Maintain heterozygous lines to avoid homozygote weight reduction.
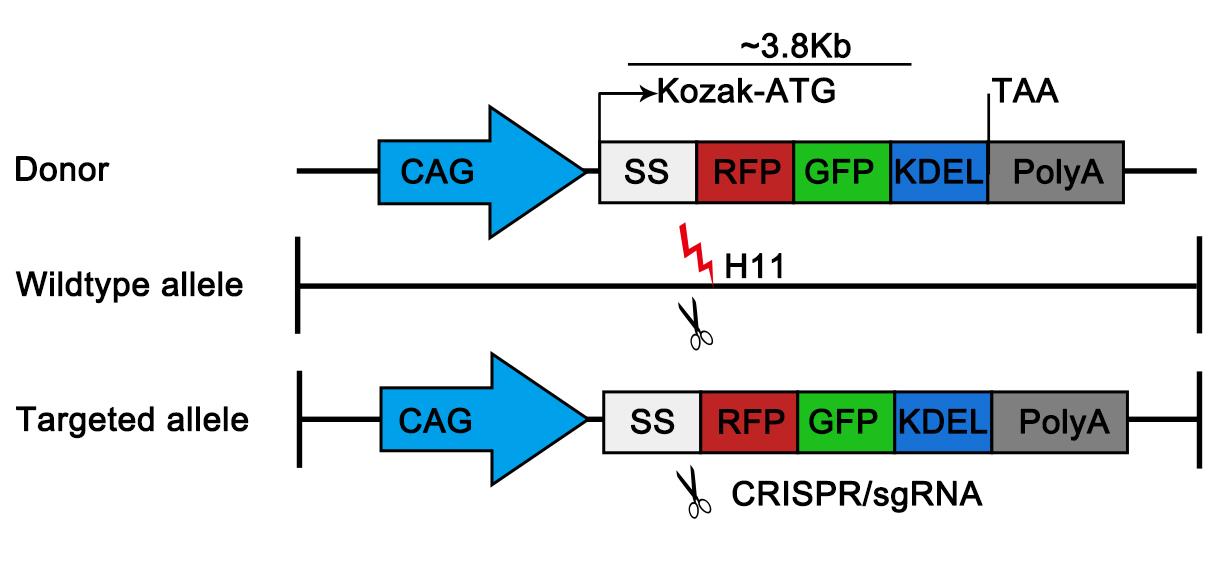
Figure 1. Generation of ER-TRG mice. Schematic diagram illustrating the gene targeting strategy for generating the ER-TRG mouse model via CRISPR–Cas9-mediated knock-in. The ssRFP–GFP–KDEL cassette, containing a Kozak sequence (GCCACC), is inserted into the H11 locus under the control of the CAG promoter (CMV immediate early enhancer/β-actin promoter).
B. ER-TRG mice genotyping
1. Tail-clip and toe-tag offspring at 5–7 days and extract genomic DNA for PCR to identify and confirm the genotype.
2. Immediately place tail or toe clip samples (~1–2 mm) in 200 μL of NaOH (50 mM) and incubate at 100 °C for 45 min to lyse cells and denature proteins.
3. Following lysis, briefly centrifuge samples at 12,000× g for 1 min to pellet insoluble debris.
4. Carefully transfer the supernatant to a new tube. Add 20 μL of Tris-HCl (1 M, pH 8.0) to neutralize the NaOH. Vortex the mixture briefly to ensure homogeneity and then centrifuge for a few seconds to collect the solution at the bottom of the tube. Use the neutralized lysate (1–5 μL, typically) directly as the template DNA source for PCR amplification.
5. Perform PCR using specific primer sets as shown in Table 1 to distinguish wild-type (WT) and knock-in alleles.
6. Resolve PCR products by agarose gel electrophoresis. Expected band sizes confirm genotype.
Table 1. Primers for ER-TRG mice genotyping
| Primer name | Sequence | Target size |
| ER-TRG WT-forward | AGTCTTTCCCTTGCCTCTGCT | WT: 825 bp Targeted: 0 bp |
| ER-TRG WT-reverse | GGGTCTTCCACCTTTCTTCAG | |
| ER-TRG KI-forward | GGGCAGTCTGGTACTTCCAAGCT | WT: 0 bp Targeted: 335 bp |
| ER-TRG KI-reverse | TGGCGTTACTATGGGAACATACGTC |
C. Primary hepatocytes isolation and cultures
1. Primary hepatocytes were isolated from the livers of adult male mice using a previously described method [11]. First, adult ER-TRG (+/−) mice were anesthetized. The inferior vena cava was then cannulated, and the liver was perfused sequentially with 10 mL of Buffer I (Ca2+-free, containing EDTA) to chelate calcium and clear blood, followed by 5 mL of Buffer II containing collagenase to dissociate the extracellular matrix at 37 °C.
2. Excise the liver and gently dissociate cells in DMEM with 10% FBS and 1% penicillin–streptomycin.
3. Filter the cell suspension through a 70 μm cell strainer.
4. Centrifuge filtrate at 100× g for 2 min and discard the supernatant. Repeat it once.
5. Resuspend hepatocytes in DMEM supplemented with 10% FBS and 1% penicillin-streptomycin. Plate cells on collagen-coated dishes and maintain at 37 °C with 5% CO2. Fluorescence images of hepatocytes from ER-TRG (+/−) mice are demonstrated in Figure 2.
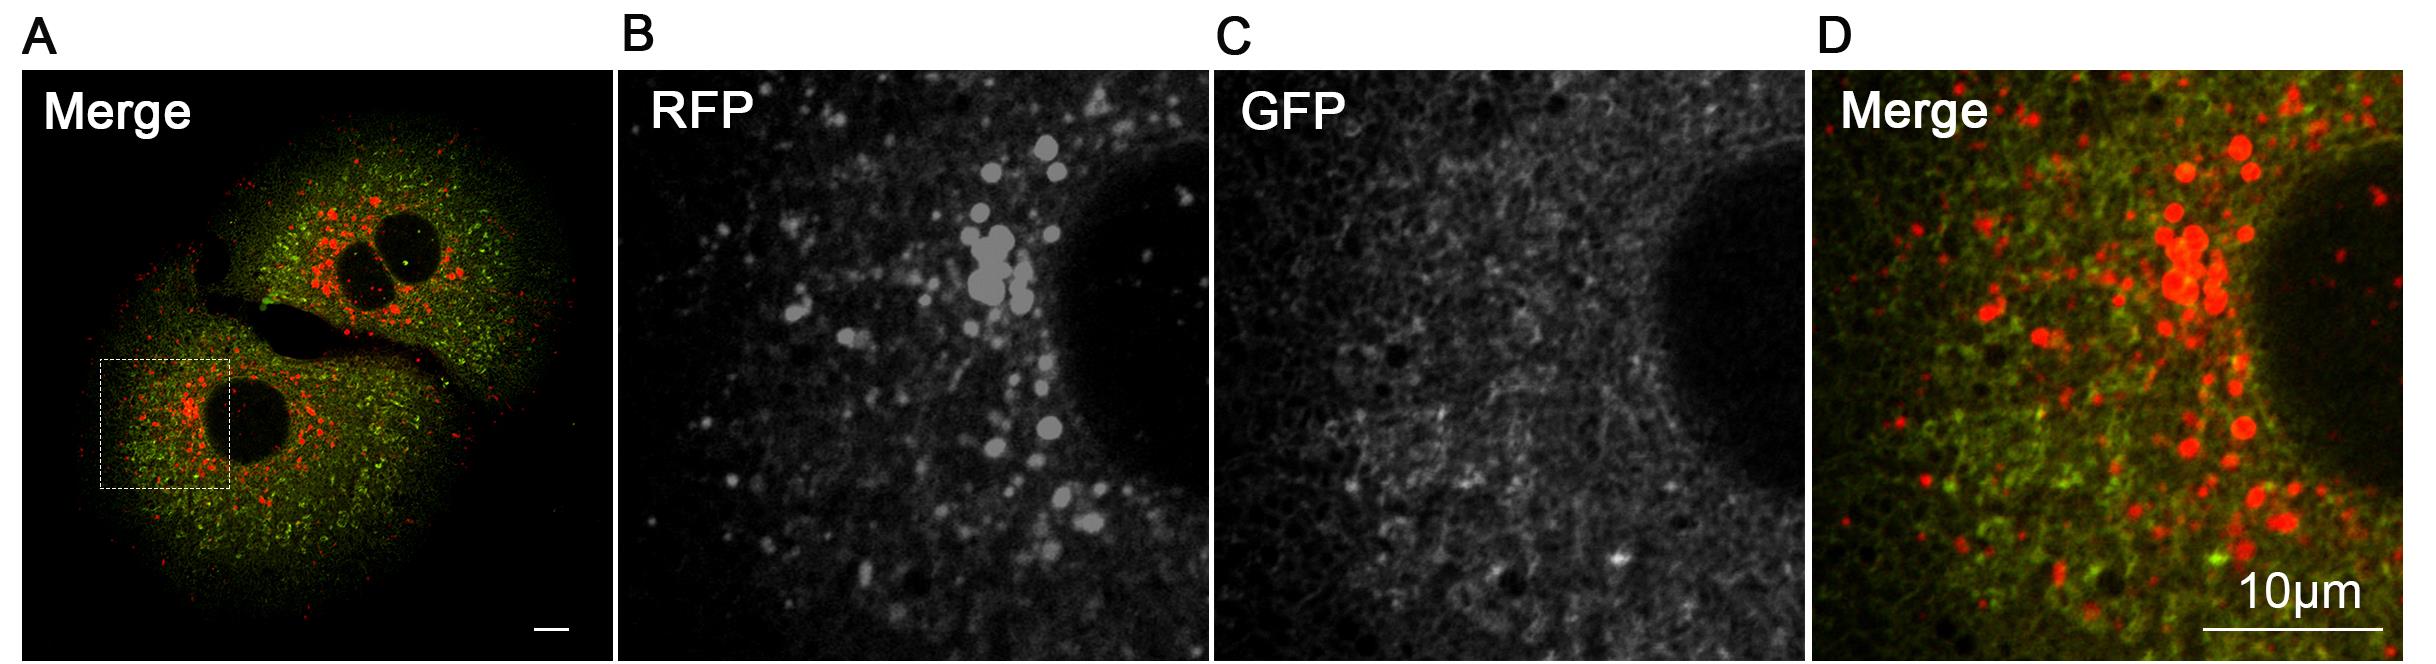
Figure 2. Fluorescence images of hepatocytes from ER-TRG (+/−) mice. Representative confocal microscopy images of RFP and GFP fluorescence in primary hepatocytes isolated from adult ER-TRG (+/−) mice. (A) Merged channel of RFP and GFP signals. (B–D) Magnified views of the region outlined by the dashed box, representing the RFP channel (B), the GFP channel (C), and their merged channel (D). Scale bar: 10 μm.
D. Tissues lysis and western blotting
1. Rapidly excise tissues from euthanized mice, snap-freeze in liquid nitrogen, and store at -80 °C.
2. Homogenize ~30 mg of tissue in a 10-fold mass ice-cold RIPA buffer containing protease and phosphatase inhibitors, using a mechanical tissue grinder on ice.
3. Centrifuge homogenates at 13,000× g for 30 min at 4 °C. Collect supernatant.
4. Determine protein concentration using a BCA kit.
5. Load 20–30 μg of denatured protein lysates onto the same SDS-PAGE gel for electrophoresis.
6. Transfer proteins to polyvinylidene fluoride (PVDF) membranes using standard wet-transfer techniques.
7. Block PVDF membrane with 5% BSA in TBST for 1 h at RT.
8. Incubate with primary antibodies diluted in blocking buffer overnight at 4 °C. Wash with TBST three times.
9. Incubate with HRP-conjugated secondary antibody (1:5,000) for 2 h at RT. Wash with TBST three times.
10. Detect signals using enhanced chemiluminescence (ECL) and image with a Tanon 5200 imaging system. Quantify band intensity using ImageJ. ER-phagy flux is indicated by the ratio of cleaved RFP band intensity to full-length RFP-GFP band intensity (Figure 3).
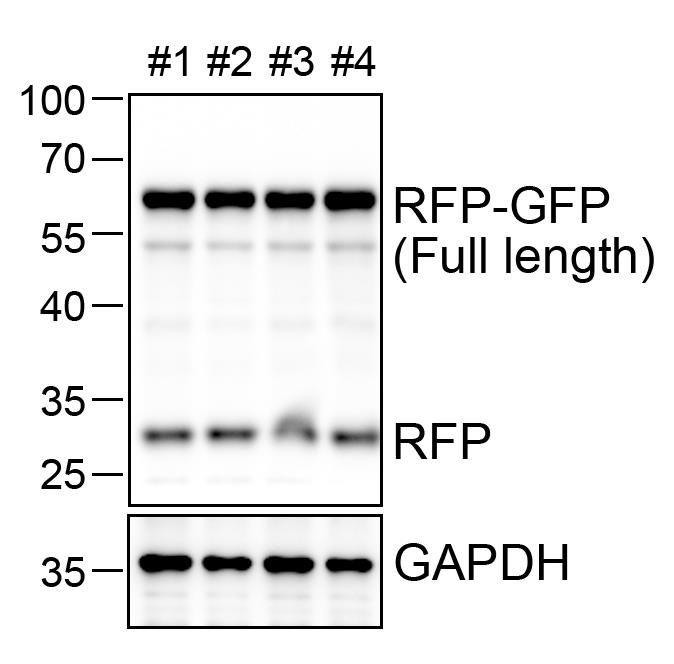
Figure 3. Immunoblot analysis of ssRFP-GFP-KDEL expression and ER-phagy activity in transgenic mouse liver. Immunoblot analysis of ssRFP-GFP-KDEL expression in liver tissues of transgenic mice. Liver homogenates from ER-TRG (+/−) transgenic mice were probed with an anti-RFP antibody, detecting both the full-length RFP-GFP protein and its cleavage fragments. GAPDH was used as a loading control. Lanes 1−4 represent individual mice.
E. Immunohistochemistry
1. Transcardially perfuse mice with PBS followed by freshly prepared 4% PFA.
2. Dissect tissues and post-fix in 4% PFA (20× tissue volume) overnight at 4 °C.
3. Wash fixed tissues in PBS. Incubate sequentially in 20% and 30% (w/v) sucrose/PBS solutions (20× tissue volume) at 4 °C until tissues sink.
4. Embed tissues in OCT compound. Section frozen tissues at 10–30 μm thickness using a cryostat. Mount sections on adhesive slides.
5. For immunostaining, rehydrate and wash sections 3× with PBS (5 min each) and then counterstain with DAPI (1 μg/mL) for 10 min. Wash sections 3× with PBS (5 min each) and mount sections using a mounting reagent for confocal imaging.
6. For staining with monoclonal antibodies, rehydrate and wash sections with PBS, permeabilize sections in permeabilization buffer for 15–20 min at RT, and then block and incubate sections in blocking buffer for 1 h at RT. Incubate sections with primary antibodies, which were diluted in blocking buffer, overnight at 4 °C. Following the wash with PBS, incubate sections with fluorophore-conjugated secondary antibodies (Alexa Fluor 647) for 1 h at RT in the dark. Counterstain sections with DAPI and mount them as described in step E5.
F. Fluorescence imaging
1. Conduct imaging on a Zeiss LSM 800 laser scanning confocal microscope equipped with a Plan-Apochromat 63×/1.4-NA oil-immersion objective, 40×/0.95-NA air-immersion objective, and photomultiplier tube detector. Set the following parameters: GFP (ex: 488 nm, em: 480–580 nm), RFP (ex: 561 nm, em: 575–700 nm), DAPI (ex: 353 nm, em: 40–495 nm), and Alexa Fluor 647 (ex: 633 nm, em: 640–710 nm). Use separate scanning tracks for each excitation and emission set.
2. Acquire images using ZEN (blue edition) software and perform 3D reconstructions with Imaris 9.3.1 software.
3. Adjust the gain for each fluorophore individually. Monomeric GFP is inherently brighter than monomeric RFP. However, RFP shows a unique behavior: when it accumulates in vesicular structures and forms multimers, its emitted signal becomes significantly brighter than in its monomeric state. As a result, the signal intensities of vesicles with multimeric RFP can exceed the “background” level of cytosolic RFP monomers. This multimer-related signal enhancement does not occur with GFP.
a. Determine the gain settings based on the RFP intensity in tissue sections. In comparative studies, keep these settings consistent across the same tissues. For quantification, optimize gain settings by averaging the gain of six sections for each channel using the gain/offset histogram tool in Zen Black. This ensures signal maximization below saturation and prevents undersaturation, allowing clear visualization of unsaturated, separate RFP puncta in cells.
b. Subsequently, adjust the GFP fluorescence intensity. The goal is to clearly highlight RFP-only puncta and minimize the diffuse RFP+GFP+ signal. In most images, slightly increase the GFP signal to better delineate cell and tissue contours. Set the gains and offsets for the LAMP1 channel using the same criteria when applicable.
4. Representative fluorescence images of liver tissue from ER-TRG (+/−) mice, acquired using a Zeiss LSM 800 laser scanning confocal microscope, are shown in Figure 4. Ensure that each image represents a minimum of four to five animals.
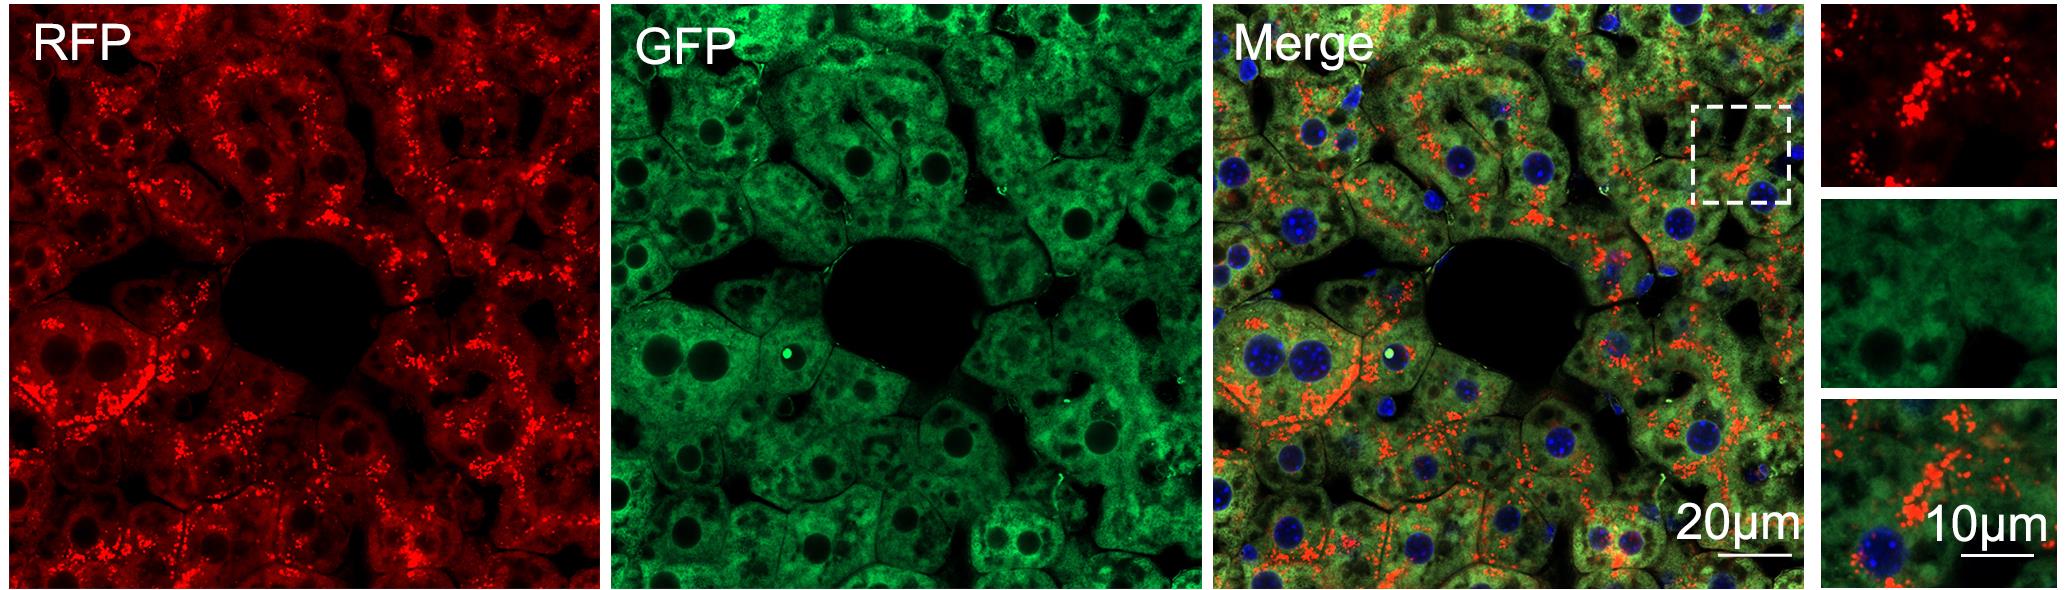
Figure 4. Fluorescence image of liver tissue from ER-TRG (+/−) mice. Representative confocal microscopy images of RFP and GFP fluorescence in liver tissue from adult ER-TRG (+/−) mice, acquired with a Zeiss LSM 800 laser scanning confocal microscope. The “Merge” panel represents merged channels of RFP, GFP, and DAPI, and the insets shown an enlarged image of the area indicated by the dashed frame. Scale bars: 20 μm (main panels) and 10 μm (insets).
G. Generating CA-ER-TRG knock-in mice
1. Insert a loxP-stop-loxP (LSL) cassette between the CAG promoter and the ORF of the ssRFP-GFP-KDEL fusion protein, with a Kozak sequence (GCCACC) upstream of the ORF start codon.
Note: The donor vector (pCA-ER-TRG) was based on an H11-CAG-PMD18T backbone, a proprietary vector system provided by GemPharmatech. The expression cassettes, consisting of the CAG promoter, an LSL cassette, Kozak sequence, the ssRFP-GFP-KDEL ORF, and a polyA signal, were flanked by homology arms targeting the murine H11 locus (Figure 5). Both the 5′ and 3′ homology arms were approximately 1,100 bp in length, corresponding to the genomic sequences immediately upstream and downstream of the intended H11 cleavage site. The complete plasmid sequences are provided in Supplementary Data 2.
2. The subsequent procedures are described in steps A2–4.
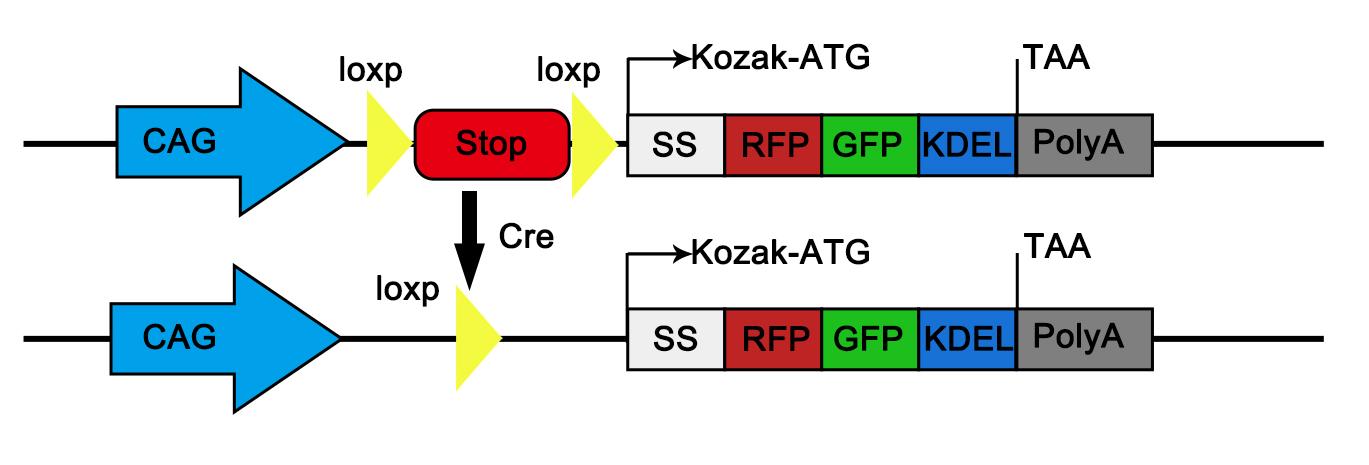
Figure 5. Generation of CA-ER-TRG mice. Schematic diagram illustrating the gene targeting strategy for generating the CA-ER-TRG mouse model. The ssRFP–GFP–KDEL cassette, containing a Kozak sequence (GCCACC), was inserted into the H11 locus under the control of the CAG promoter. A loxP-stop-loxP cassette was placed between the CAG promoter and the ssRFP–GFP–KDEL cassette.
H. CA-ER-TRG mice genotyping
1. Perform PCR using specific primer sets. See Table 2 for the distinction between wild-type (WT) and knock-in (KI) alleles.
2. The subsequent procedures are described in steps B1–6.
Table 2. Primers for CA-ER-TRG mice genotyping
| Primer name | Sequence | Target size |
| CA-ER-TRG WT-forward | AGTCTTTCCCTTGCCTCTGCT | WT: 825 bp Targeted: 5,982 bp |
| CA-ER-TRG WT-reverse | GGGTCTTCCACCTTTCTTCAG | |
| CA-ER-TRG KI-forward | AGTCTTTCCCTTGCCTCTGCT | WT: 0 bp Targeted: 628 bp |
| CA-ER-TRG KI-reverse | AGGCGGGCCATTTACCGTAAGTTA |
I. AAV-based Cre recombinase delivery to CA-ER-TRG mice
1. Recombinant AAV serotypes (e.g., AAV-PHP.eB for the central nervous system and AAV2/8 for the liver; the production method is given in [12]) expressing Cre recombinase under a cell type–specific promoter (e.g., hSyn1 for neurons, GFAP for astrocytes, TBG for hepatocytes) were obtained or produced. The viral titer was adjusted to ≥1 × 10¹³ vg/mL.
Note: The recombinant adeno-associated virus (rAAV) used in this study was custom-produced by Wzbio (Shandong, China). It is an AAV-PHP.eB serotype vector encoding Cre recombinase under the control of the human synapsin (hSyn) promoter. The virus was purified by iodixanol gradient centrifugation, and the final titer was determined by qPCR to be 5.0 × 10¹² vector genomes (vg) per milliliter.
2. Intravenously inject each CA-ER-TRG (+/−) mouse with 1 × 10¹¹–1 × 10¹² vg of AAV-Cre via the tail vein.
3. Three to four weeks post-injection, anesthetize mice and subject them to transcardial perfusion. Following perfusion, promptly harvest target tissues for subsequent fixation, sectioning, and confocal imaging analysis (Figure 6).
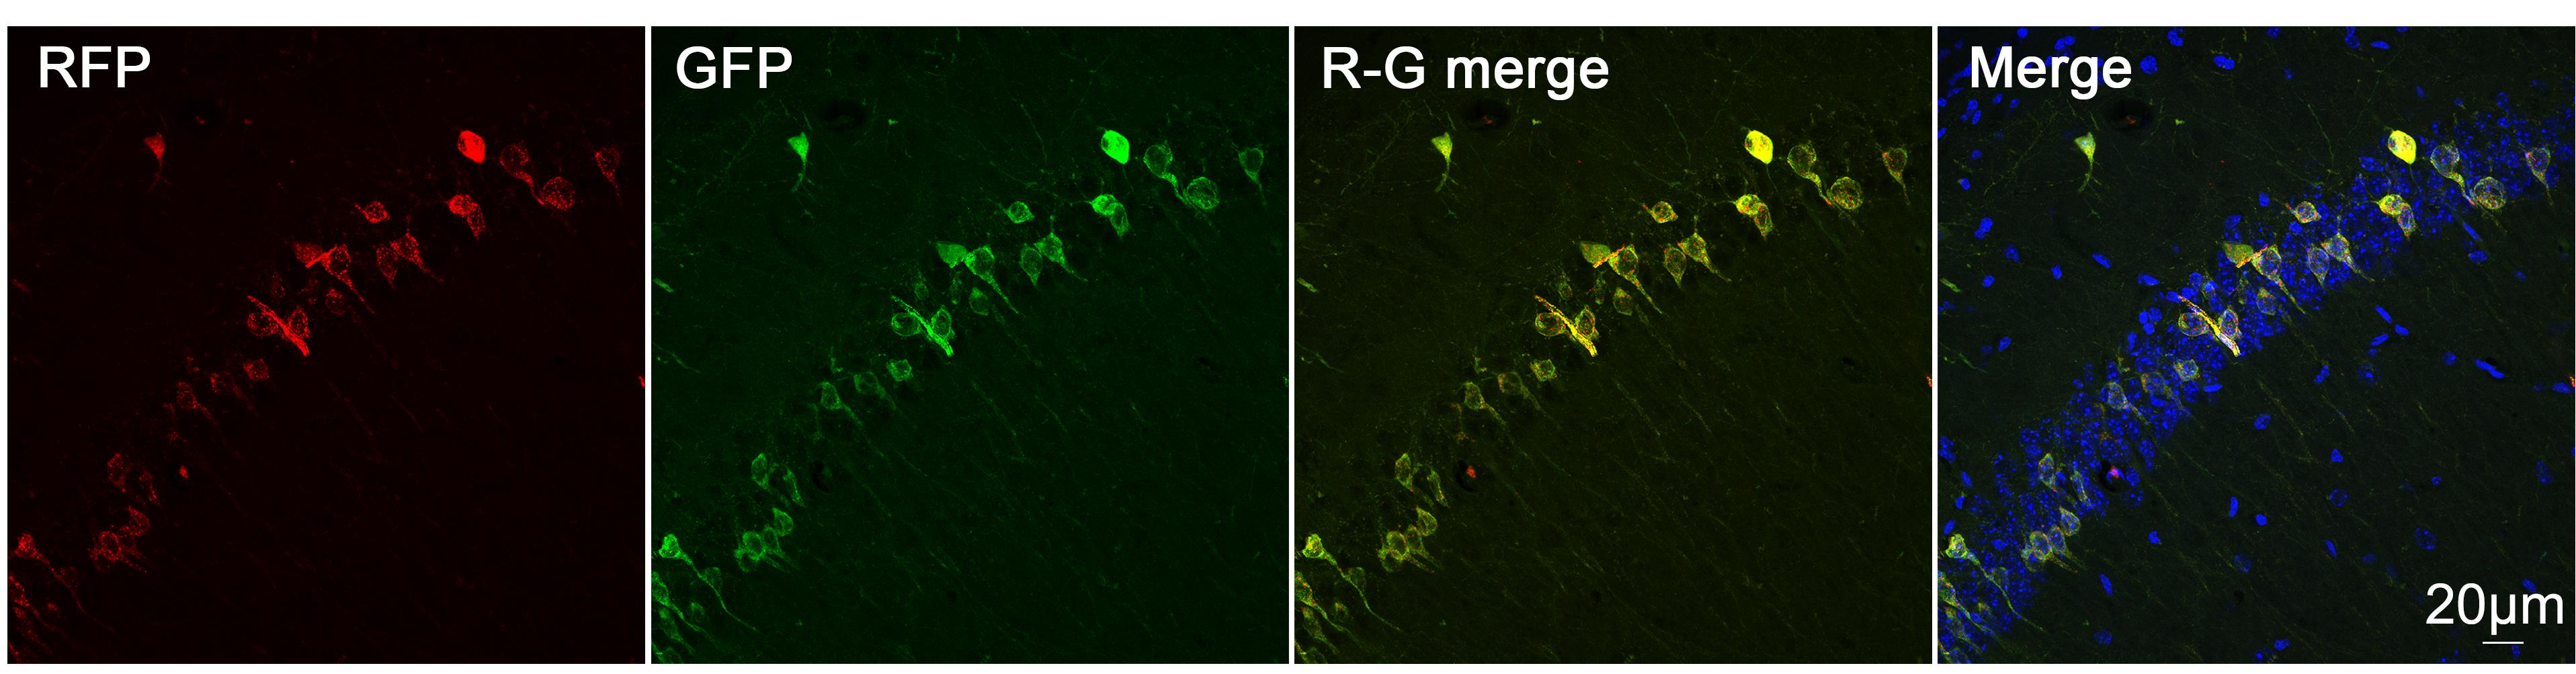
Figure 6. Induction and validation of cell type–specific ER-phagy in CA-ER-TRG mice. Representative confocal microscopy images of RFP and GFP fluorescence in hippocampal CA1 region neurons of CA-ER-TRG (+/−) mice after AAV-hSyn-Cre infection. The “R-G merge” panel represents the merged channels of RFP and GFP, while the “Merge” panel shows the merged channels of RFP, GFP, and DAPI. Scale bar: 20 μm.
J. Generating inducible ER-TRG (Aldh1l1-CreERT2+/−; CA-ER-TRG+/−) mice
1. CA-ER-TRG mice were crossed with Aldh1l1-CreERT2 mice. The ERT2 domain is a modified estrogen receptor ligand-binding domain that renders the Cre recombinase activity tamoxifen-inducible. In the absence of tamoxifen, the ERT2-Cre fusion protein is sequestered in the cytoplasm. Upon tamoxifen administration, it translocates to the nucleus to induce recombination.
Note: The Aldh1l1-CreERT2 mouse model is a knock-in line engineered to enable inducible genetic manipulation in astrocytes with high selectivity and efficiency. It was generated using the CRISPR/Cas9 system to insert a T2A-CreERT2 fragment immediately before the stop codon of the endogenous Aldh1l1 gene. The expression of the inducible Cre recombinase (CreERT2) is under the control of the native Aldh1l1 promoter, ensuring astrocyte-specific expression [8]. Genotyping of the mice was performed by PCR, with amplicon sizes of 2,126 bp for the 5′ homology arm, 1,457 bp for the 3′ homology arm, and 452 bp for the wild-type allele, confirming precise genomic integration.
2. Genotype offspring to identify double heterozygous mice (Aldh1l1-CreERT2+/−; CA-ER-TRG+/−). Primers for Aldh1l1-CreERT2 mice genotyping are listed in Table 3.
Table 3. Primers for Aldh1l1-CreERT2 mice genotyping
| Primer name | Sequence | Target size |
| Aldh1l1-WT-forward | TGTACTTGCTGAGACAGCAGTGGA | WT: 452 bp Targeted: 0 bp |
| Aldh1l1-WT-reverse | CACTCCCTGAGGTCAACAGGGTA | |
| Cre-forward | GCTAAACATGCTTCATCGTCGG | WT: 0 bp Targeted: 650 bp |
| Cre-reverse | GATCTCCGGTATTGAAACTCCAGC |
3. Administer tamoxifen (e.g., 75 mg/kg body weight) dissolved in corn oil intraperitoneally for two consecutive days to induce Cre-mediated excision of the STOP cassette, thereby activating ER-TRG expression.
4. Analyze tissues 7 days after the final injection.
5. Representative fluorescence images of brain tissue from inducible ER-TRG (Aldh1l1-CreERT2+/−; CA-ER-TRG+/−) after tamoxifen treatment are shown in Figure 7.
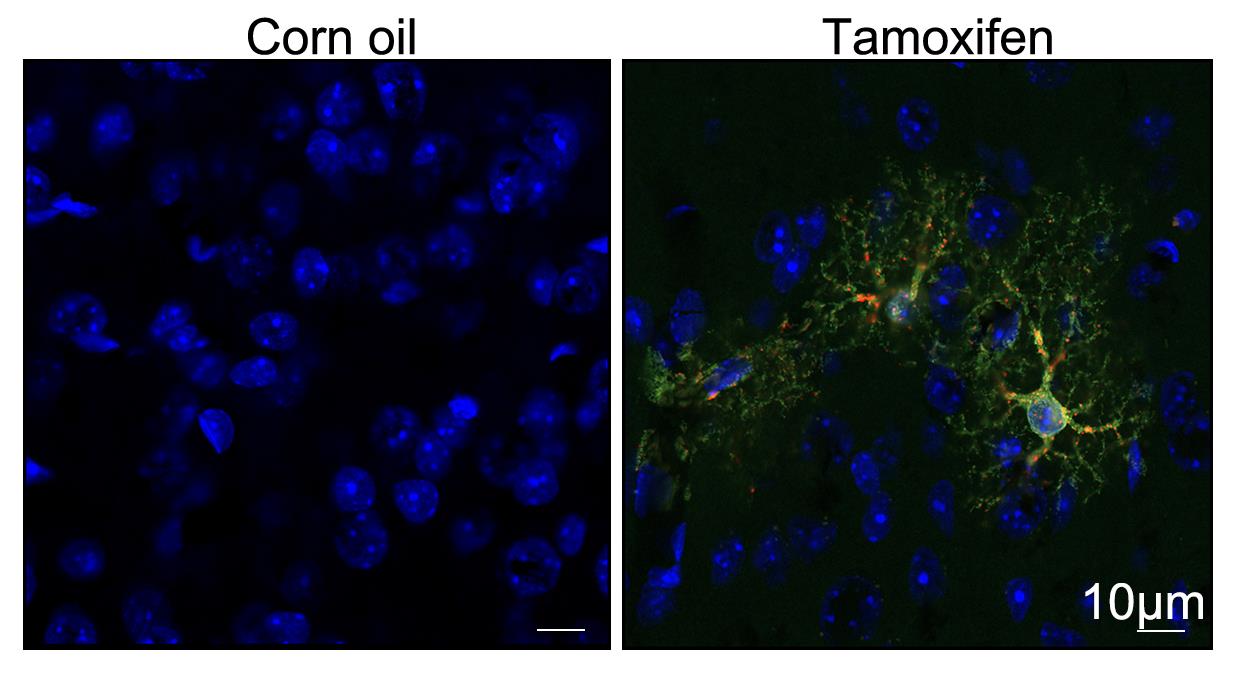
Figure 7. Assessment of ER-phagy activity in inducible ER-TRG mice. Inducible ER-TRG (Aldh1l1-CreERT2+/−; CA-ER-TRG+/−) mice were treated with tamoxifen for 2 days, and fluorescence images were acquired 7 days after treatment. Representative fluorescence images of astrocytes in the cerebral cortex of inducible ER-TRG mice are presented. Mice without tamoxifen treatment were used as controls. Tamoxifen is dissolved in corn oil for intraperitoneal injection in mice due to its lipophilic nature, which ensures both effective dissolution and sustained release of the drug. Scale bar: 10 μm.
Data analysis
A. Fluorescence quantification of ER-phagy
1. Generate merged (RFP + GFP) images.
a. Export RFP and GFP channel images in JPG format from ZEN software (Figure 8A).
b. Generate merged (RFP + GFP) images using ImageJ (Figure 8B), which helps delineate the spatial distribution of ER and ER-phagy signals in cells or tissues, especially in cases where the sectional images do not fully occupy the field of view.
c. Open the merged images in ImageJ and convert them to 8-bit. Navigate to Image → Adjust → Threshold. Select the Mean algorithm and Red option, check Dark background, and adjust the lower and upper threshold levels (typically using the Auto function). Click Apply to outline regions corresponding to ER and ER-phagy signals (Figure 8C).
d. Navigate to Edit → Selection → Create Selection to generate a selection of the merge (RFP + GFP) area. Open Analyze → Tools → ROI Manager and click Add to save the selected merge (RFP + GFP) region as an ROI (Figure 8D).
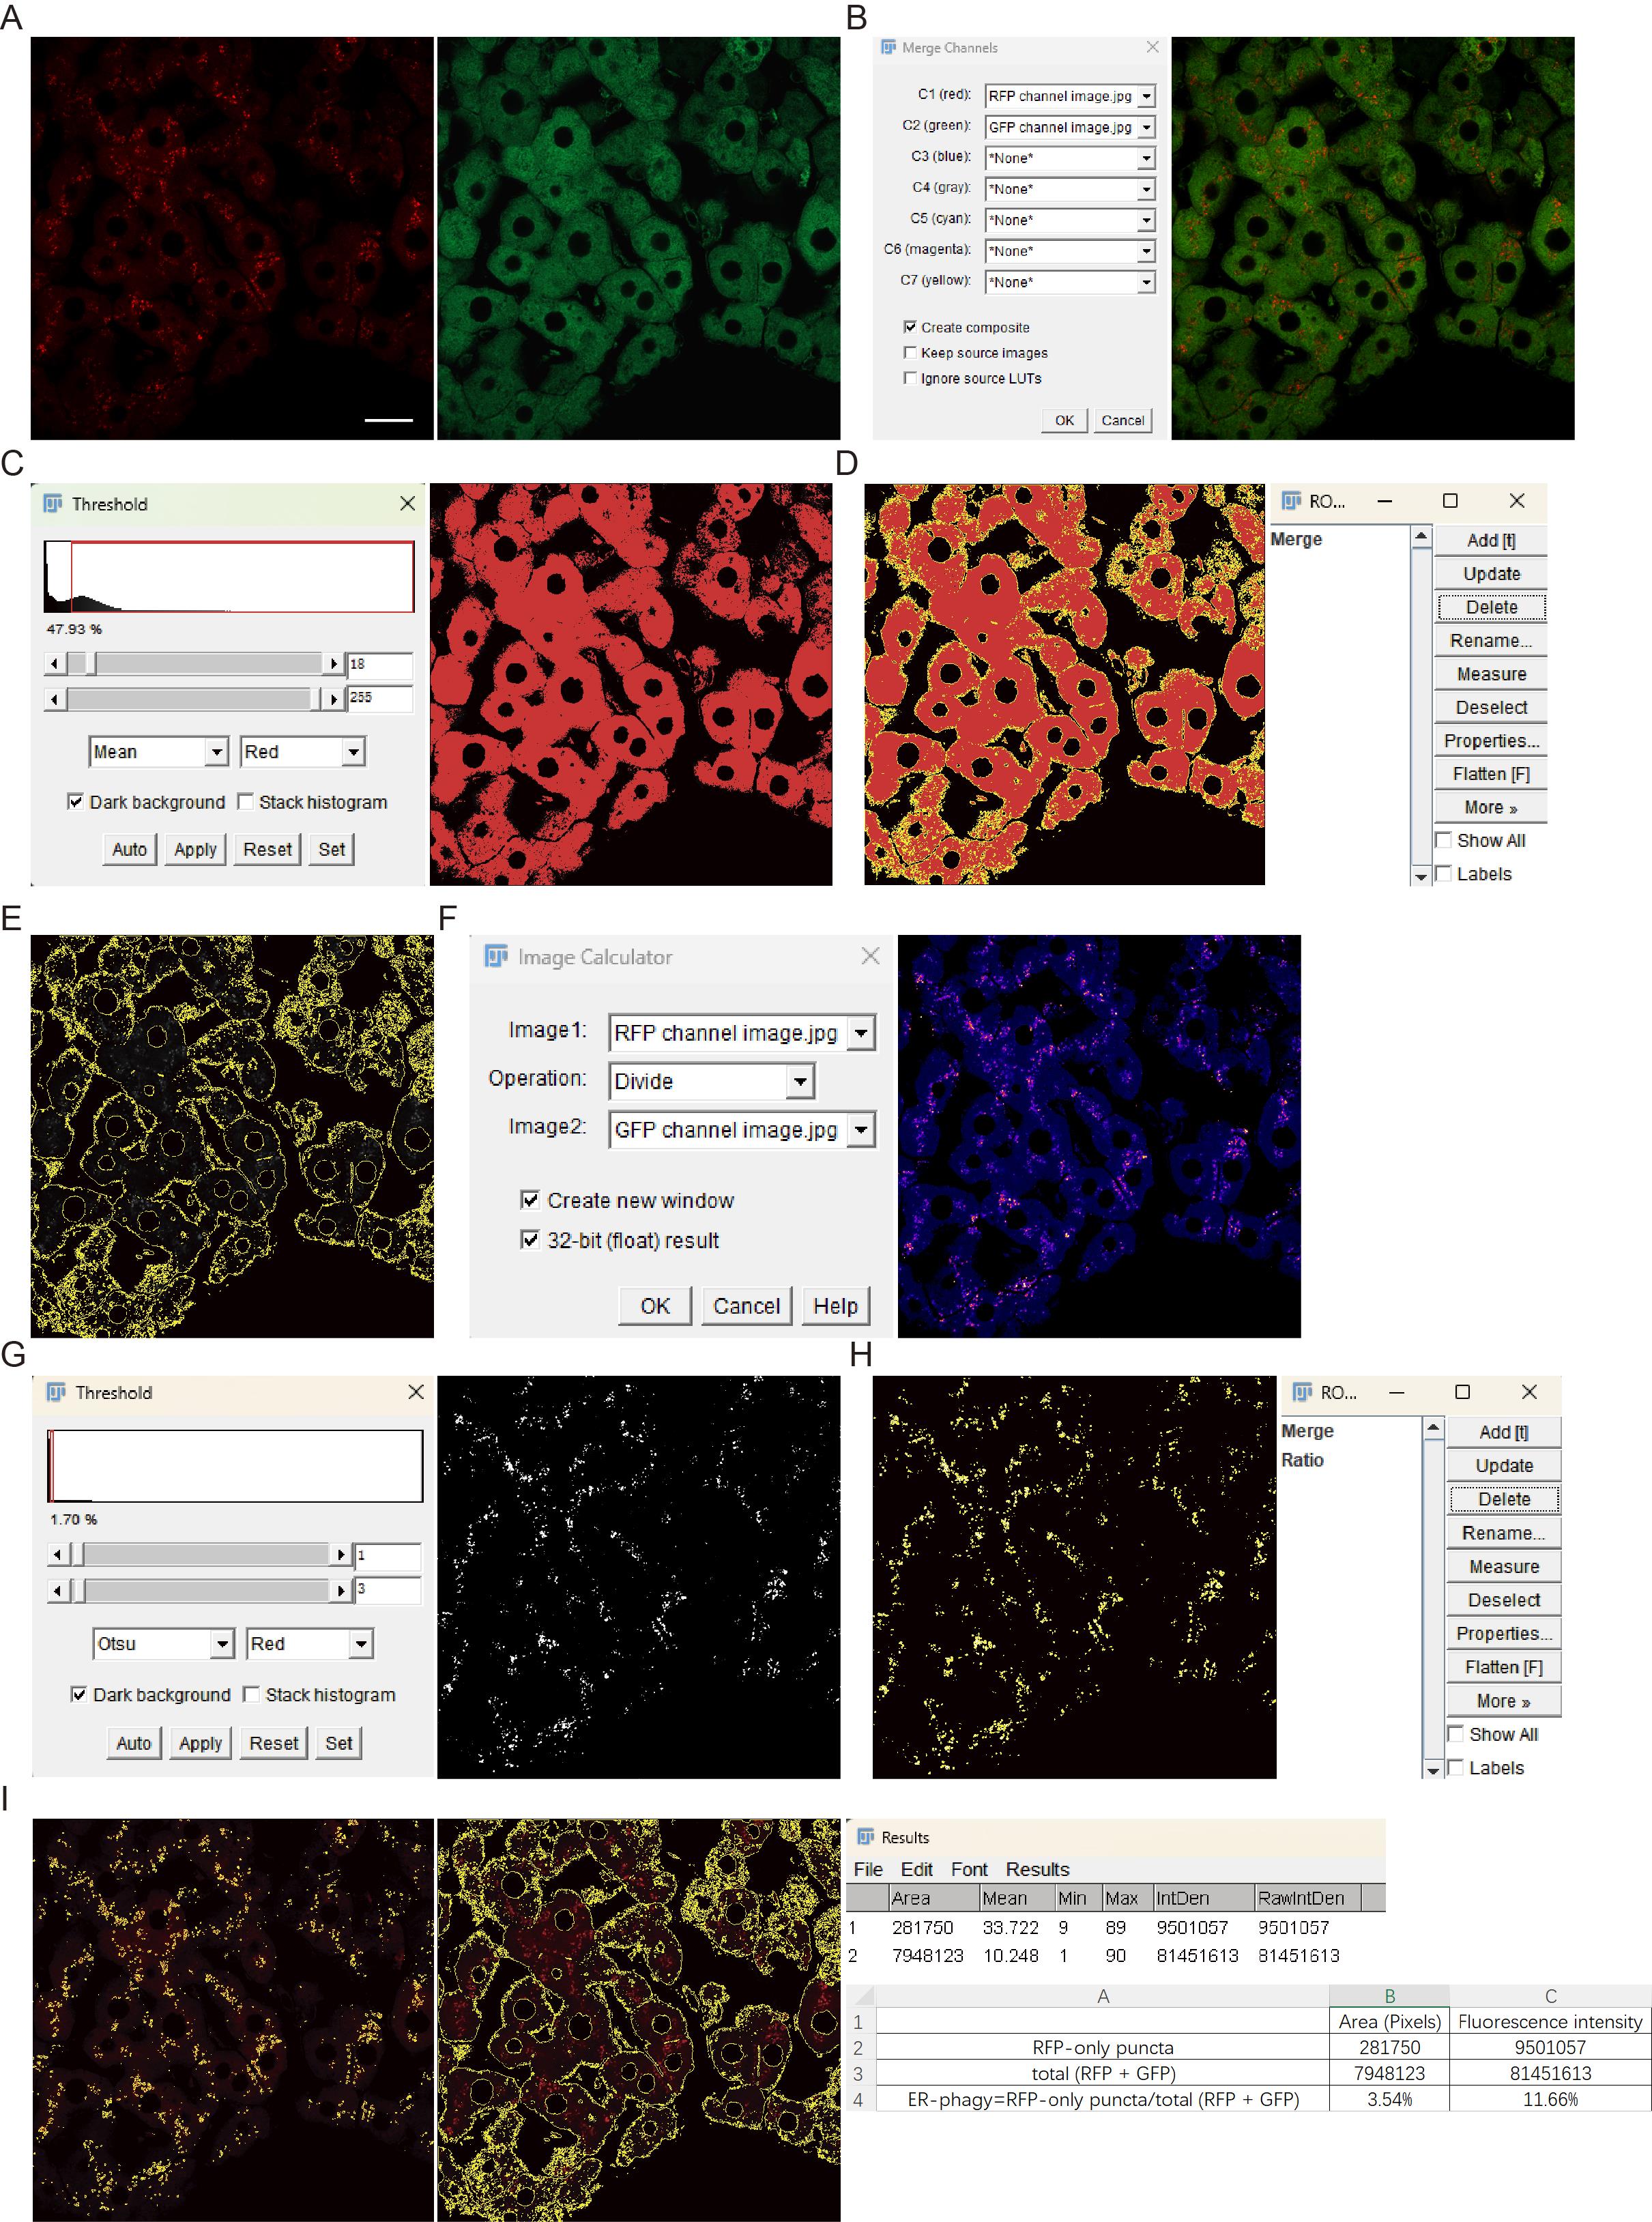
Figure 8. Image processing workflow for fluorescence quantification of ER-phagy. (A) Images of RFP and GFP channels. (B) Generation of merged (RFP + GFP) image: C1 corresponds to the RFP channel and C2 to the GFP channel. (C) Threshold interface and image outlining the merged (RFP + GFP) signal region. (D) Selection of the merged (RFP + GFP) signal region and the ROI Manager with the saved corresponding ROI. (E) Result of applying the merged (RFP + GFP) ROI to the RFP or GFP channel images. (F) Image Calculator interface and the resulting ratiometric (RFP/GFP) image pseudocolored with the Rainbow RGB LUT. (G) Threshold interface and binarized image derived from the ratio (RFP/GFP) image. (H) Creation of a ratio area in the ROI manager by outlining the RFP-only signal. (I) ROI masks, generated based on the ratio (RFP/GFP) and merged (RFP + GFP) signals, were applied to the RFP channel to measure area and fluorescence intensity. ER-phagy levels are quantified from these measurements. Scale bar = 20 μm.
2. Generate ratio (RFP/GFP) images.
a. Open the RFP and GFP channel images in ImageJ and convert both to 8-bit. Apply the ROI obtained from the merged (RFP + GFP) image to both channels and then navigate to Edit → Clear Outside to remove areas outside the ROI (Figure 8E).
b. Select Process → Image Calculator and set Image1 as the RFP channel and Image2 as the GFP channel. Select Divide operation, check Create new window and 32bit (float) result, then click OK to generate the ratio (RFP/GFP) image. Apply LUT (e.g., Rainbow RGB) to visualize the ratiometric images (Figure 8F), in which red indicates a high RFP/GFP ratio (high ER-phagy flux), and blue represents a low ratio (low ER-phagy flux).
c. Adjust the threshold using Otsu’s method [13] with the Red and Dark background options selected. Manually fine-tune lower and upper threshold levels, if necessary. Then, click Apply to generate binarized images that approximate RFP-only puncta. Convert binarized images to 8-bit (Figure 8G).
d. Create a selection from the binarized images area, add it to the ROI Manager, and save as the ratio (RFP/GFP) ROI (Figure 8H).
3. Quantification of ER-phagy levels.
a. Apply both the ratio (RFP/GFP) ROI and the merged (RFP + GFP) ROI to the RFP channel image to get RFP-only puncta and total RFP signals (Figure 8I). Use Analyze → Measure to quantify:
i. Pixels (area) of RFP-only puncta and total RFP signals.
ii. Fluorescence intensity of RFP-only puncta and total RFP signals.
b. ER-phagy activity is assessed based on two parameters:
i. The ratio of RFP-only puncta pixels to total RFP pixels.
ii. The ratio of RFP-only puncta fluorescence intensity to total RFP fluorescence intensity.
4. Assess ER-phagy induction upon starvation.
Note: As shown in Figure 9, ER-phagy in the liver was assessed using the dual-fluorescence reporter in inducible ER-TRG mice. Upon starvation, a marked increase in RFP-positive, GFP-quenched puncta was observed, indicative of ER fragments delivered to acidic lysosomes. Quantitative analysis of these puncta (e.g., relative intensity or area) confirmed a significant increase, demonstrating elevated ER-phagy flux during starvation.
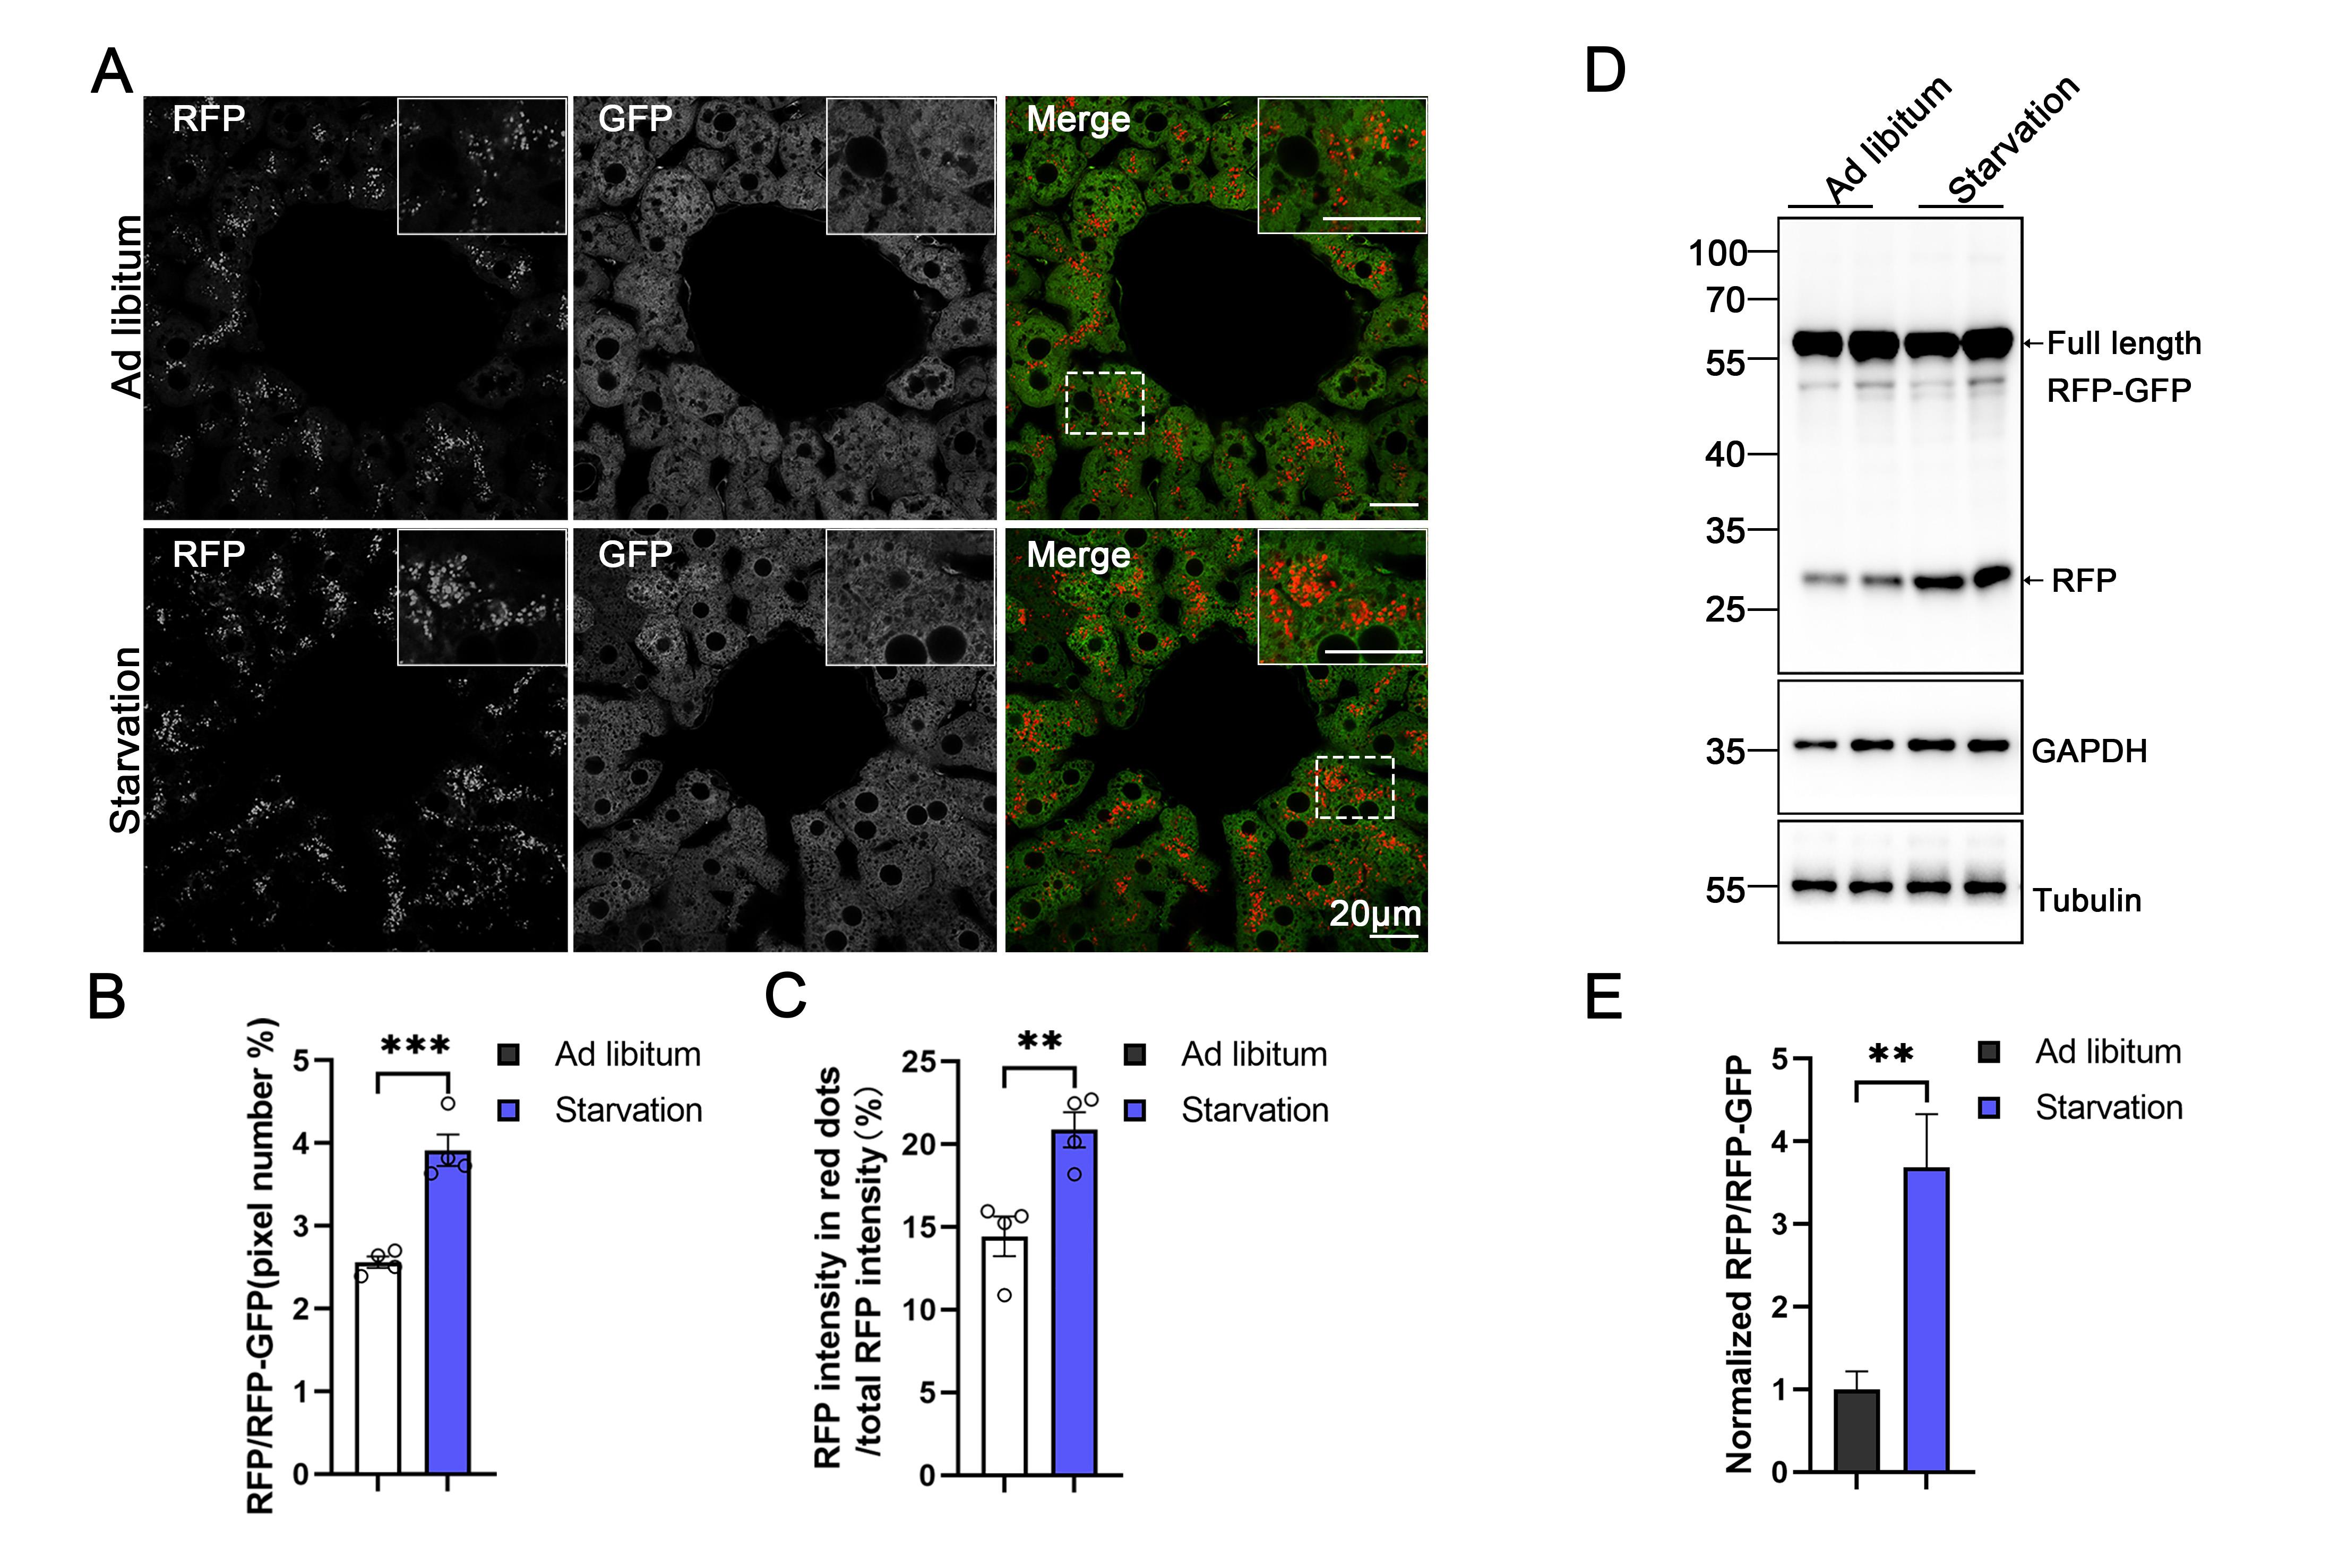
Figure 9. Monitoring ER-phagy induction in the liver upon starvation by an increase in the RFP/GFP ratio. (A–C) Representative confocal images and quantitative analysis in the liver of inducible ER-TRG (Rosa CreERT2+/−; LSL-RFP-GFP-KDEL+/−) mice under starvation. Quantitative analysis revealed the ratio of RFP to total area (RFP+GFP) and the fluorescence ratio of RFP to total RFP intensity by ImageJ on a pixel-by-pixel basis. Values were stated as mean ± SEM (n = 4 per condition). Statistical differences were evaluated using Student’s t-test. **P < 0.01, ***P < 0.001. Scale bar: 20 μm. (D–E) Analysis of ER-phagy levels in the liver of inducible ER-TRG (Rosa CreERT2+/−; LSL-RFP-GFP-KDEL+/−) mice by immunoblotting under ad libitum feeding and starvation conditions. Mice underwent a 16-h fasting process with free access to water, while control mice had ad libitum access to both food and water. Mice were treated with tamoxifen for 2 or 3 days, and samples were analyzed after 5 or 7 days. The immunoblots are quantified in panel D. Values were stated as mean ± SEM (n = 4 per group). Statistical differences were evaluated using Student’s t-test. **P < 0.01. Scale bar: 20 μm.
Source: This figure is adapted from our previous work (Figure S5, “Assessment of ER-phagy activity in different tissues in inducible ER-TRG mice and in different CA-ER-TRG mice” in [7]), which is distributed under the terms of an Attribution–Noncommercial–Share Alike–No Mirror Sites license for the first six months after publication, and thereafter under a Creative Commons (CC BY-NC-SA 4.0) license.
B. Fluorescence quantification of ER-phagy with lysosomal marker signals
1. Generate merged (RFP + GFP) images and ratio (RFP/GFP) images.
a. Export RFP, GFP, and lysosomal marker (e.g., LAMP1, as shown in Figure 10A) channel images in JPG format from ZEN software.
b. Repeat steps 2 and 3 (Data analysis section A) to generate merged (RFP + GFP) and ratio (RFP/GFP) images and their corresponding ROIs.
2. Generate LAMP1-positive images.
a. Open the LAMP1 image in ImageJ and convert it to 8-bit.
b. Navigate to threshold using Otsu’s method [13] with the Red and Dark background option selected. Click Apply to delineate LAMP1-positive regions (Figure 10B).
c. Create a selection of LAMP1-positive regions and add it to the ROI Manager as the LAMP1 ROI.
d. Select both the ratio (RFP/GFP) ROI and LAMP1 ROI and click More → And to generate a combined ROI representing RFP-only+LAMP1+ puncta regions (Figure 10C).
3. Quantification of ER-phagy levels.
a. Apply the RFP-only+LAMP1+ ROI and the merged (RFP + GFP) ROI to the RFP channel image to get RFP-only+LAMP1+ puncta and total RFP signals (Figure 10D). Use Analyze → Measure to obtain:
i. Pixels (area) of RFP-only+LAMP1+ puncta and total RFP signals.
ii. Fluorescence intensity of RFP-only+LAMP1+ puncta and total RFP signals.
b. ER-phagy activity is assessed based on two parameters:
i. The ratio of RFP-only+LAMP1+ puncta pixels to total RFP pixels.
ii. The ratio of RFP-only+LAMP1+ fluorescence intensity to total RFP fluorescence intensity.
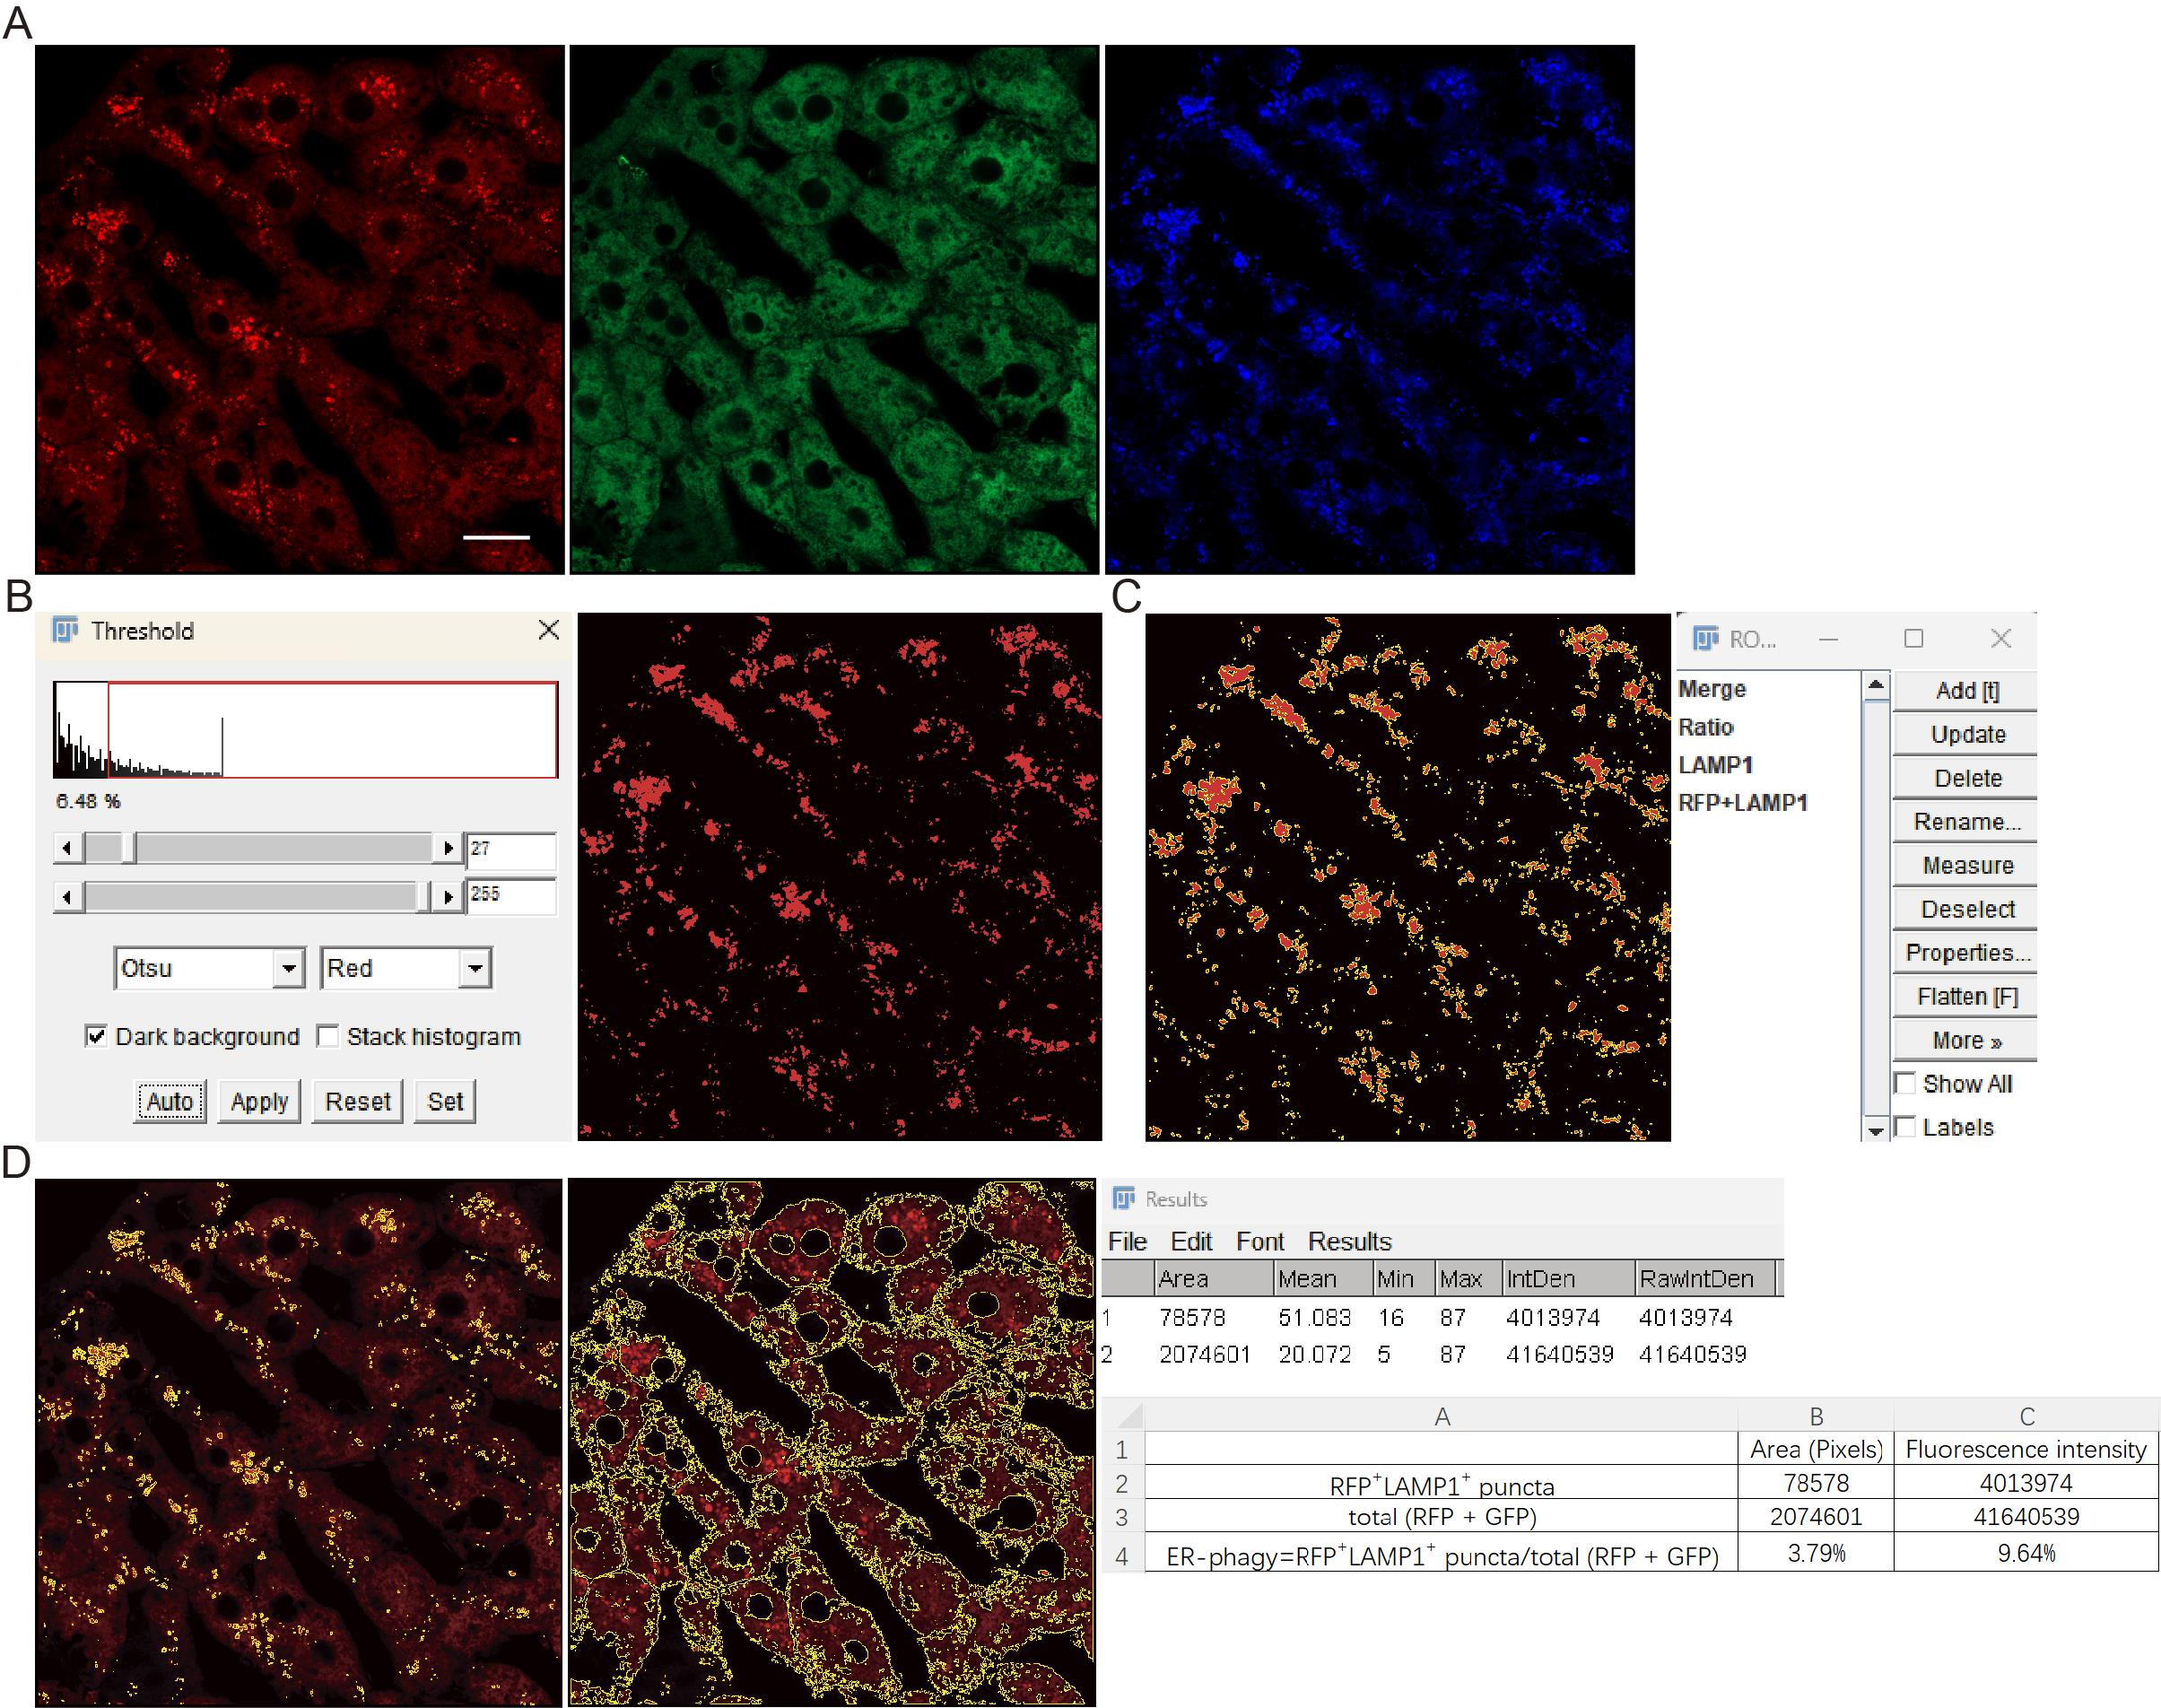
Figure 10. Image processing workflow for fluorescence quantification of ER-phagy with lysosomal marker signals. (A) Images of RFP, GFP, and lysosomal marker (e.g., LAMP1) channels. (B, C) Thresholding and ROI generation. Panel B shows the thresholding interface used to outline the LAMP1-positive signal region. Panel C displays the resulting combined ROI (RFP + LAMP1) in the ROI Manager from the intersection of the ratio (RFP/GFP) and LAMP1 ROIs. (D) The combined ROI and the merged (RFP + GFP) ROI were applied to the RFP channel image. The pixel area and fluorescence intensity within these ROIs were subsequently measured. Scale bar = 20 μm.
Validation of protocol
All experiments were independently repeated at least three times. For each tissue type, a minimum of four fluorescence images were acquired from the ER-TRG and CA-ER-TRG mice. Fluorescence images from wild-type mouse tissues served as controls, and the fluorescence intensity from the ER-TRG and CA-ER-TRG mice was calculated and normalized to the average intensity of the control group. All images of the same tissue type were captured using identical fluorescence parameter settings. Statistical significance was assessed using Student’s t-test. The data are shown as mean ± SEM (with error bars in some figures representing SD), and a p-value of less than 0.05 was considered statistically significant.
This protocol has been used and validated in the following research articles:
• Sang et al. [7]. Visualizing ER-phagy and ER architecture in vivo. J. Cell Biol.
• Li et al. [14]. Cholesterol sensing by the SCAP–FAM134B complex regulates ER-phagy and STING innate immunity. Nat Cell Biol (Figure 1a–c).
General notes and troubleshooting
General notes
1. During tissue lysis, both the tissue and tissue lysis buffer should be kept at a low temperature to prevent protein degradation in the tissue; otherwise, it will lead to the weakening of the full-length RFP-GFP band and the enhancement of the cleaved RFP band. Fresh tissue samples are recommended for this experiment.
2. For tissue fixation, the volume of PFA should be 20 times that of the tissue to ensure thorough fixation. Prolonged fixation time should be avoided.
3. In immunohistochemistry, permeabilization should be carefully controlled, as over-permeabilization can compromise the observation of RFP-only signals.
4. In confocal imaging, areas with high ER-phagy can be much brighter than those without. To avoid overexposure, make sure the entire image is not overexposed.
5. Inducible ER-TRG mice are recommended for experiments, as they allow for flexible control of probe expression timing to avoid potential adverse effects.
6. Homozygous ER-TRG mice exhibit a slight weight reduction, suggesting potential in vivo toxicity from the inserted construct. Since heterozygous mice are healthy and show robust fluorescence, we recommend using only heterozygotes for all ER-phagy experiments to ensure optimal animal health and reliable data.
7. This protocol is recommended for researchers with prior experience in mouse genetics and advanced imaging techniques. It is not suitable for entry-level scientists without relevant training.
8. Material availability: Inquiries regarding the availability of the unique biological materials described in this work should be addressed to the lead contact, Q. Sun, at qmsun@zju.edu.cn. Provision of biological materials will be subject to a completed Materials Transfer Agreement. In addition, CA-ER-TRG mice have been made available to the Jackson Laboratory and can be purchased by other investigators through the Jackson Laboratory. All other standard reagents and materials were obtained from commercial suppliers.
Troubleshooting
Problem 1: The outlined LAMP1 signal region is too large during fluorescence quantification.
Possible cause: High background intensity in the LAMP1 channel image.
Solution: In ImageJ, navigate to Image → Adjust → Brightness/Contrast and adjust the contrast of the LAMP1 image to reduce unnecessary background signal.
Supplementary information
The following supporting information can be downloaded here:
1. Supplementary Data 1
2. Supplementary Data 2
Acknowledgments
This study was supported by the National Natural Science Foundation of China (Grants 32025012, 92254307, 31970695, 31771525, and 91754113 to Q. Sun; Grant 32400612 to Y. Sang) and the Ministry of Science and Technology of the People's Republic of China (Grant 2021YFC2700901 and 2024YFA1803003 to Q. Sun). The protocol has been adapted from Sang et al. [7], J Cell Biol 223(12): e202408061. We thank Qin Han and Hangjun Wu from the Core Facilities, Zhejiang University School of Medicine for their technical support.
The following figure was created using BioRender: Graphical overview, Boran, L. (2025) https://BioRender.com/h42lrci.
Competing interests
The authors declare that there are no competing interests.
Ethical considerations
All animal procedures were conducted under Project License No. IACUC-ZJU20220256, approved by the Zhejiang University Ethical Review Committee. In parallel, all experiments were conducted in accordance with the guidelines of institutional and national animal care and ethical standards and require appropriate expertise in handling and imaging transgenic mice.
References
- Joshi, A. S., Zhang, H. and Prinz, W. A. (2017). Organelle biogenesis in the endoplasmic reticulum. Nat Cell Biol. 19(8): 876–882. https://doi.org/10.1038/ncb3579
- Bernales, S., McDonald, K. L. and Walter, P. (2006). Autophagy Counterbalances Endoplasmic Reticulum Expansion during the Unfolded Protein Response. PLoS Biol. 4(12): e423. https://doi.org/10.1371/journal.pbio.0040423
- Bernales, S., Schuck, S. and Walter, P. (2007). ER-Phagy: Selective Autophagy of the Endoplasmic Reticulum. Autophagy. 3(3): 285–287. https://doi.org/10.4161/auto.3930
- Hübner, C. A. and Dikic, I. (2019). ER-phagy and human diseases. Cell Death Differ. 27(3): 833–842. https://doi.org/10.1038/s41418-019-0444-0
- Chino, H., Hatta, T., Natsume, T. and Mizushima, N. (2019). Intrinsically Disordered Protein TEX264 Mediates ER-phagy. Mol Cell. 74(5): 909–921.e6. https://doi.org/10.1016/j.molcel.2019.03.033
- Birling, M. C., Gofflot, F. and Warot, X. (2009). Site-Specific Recombinases for Manipulation of the Mouse Genome. Methods Mol Biol. 561: 245–263. https://doi.org/10.1007/978-1-60327-019-9_16
- Sang, Y., Li, B., Su, T., Zhan, H., Xiong, Y., Huang, Z., Wang, C., Cong, X., Du, M., Wu, Y., et al. (2024). Visualizing ER-phagy and ER architecture in vivo. J Cell Biol. 223(12): e202408061. https://doi.org/10.1083/jcb.202408061
- Hu, N. Y., Chen, Y. T., Wang, Q., Jie, W., Liu, Y. S., You, Q. L., Li, Z. L., Li, X. W., Reibel, S., Pfrieger, F. W., et al. (2019). Expression Patterns of Inducible Cre Recombinase Driven by Differential Astrocyte-Specific Promoters in Transgenic Mouse Lines. Neurosci Bull. 36(5): 530–544. https://doi.org/10.1007/s12264-019-00451-z
- Skryabin, B. V., Kummerfeld, D. M., Gubar, L., Seeger, B., Kaiser, H., Stegemann, A., Roth, J., Meuth, S. G., Pavenstädt, H., Sherwood, J., et al. (2020). Pervasive head-to-tail insertions of DNA templates mask desired CRISPR-Cas9–mediated genome editing events. Sci Adv. 6(7): eaax2941. https://doi.org/10.1126/sciadv.aax2941
- Shen, B., Zhang, J., Wu, H., Wang, J., Ma, K., Li, Z., Zhang, X., Zhang, P. and Huang, X. (2013). Generation of gene-modified mice via Cas9/RNA-mediated gene targeting. Cell Res. 23(5): 720–723. https://doi.org/10.1038/cr.2013.46
- Charni-Natan, M. and Goldstein, I. (2020). Protocol for Primary Mouse Hepatocyte Isolation. STAR Protoc. 1(2): 100086. https://doi.org/10.1016/j.xpro.2020.100086
- Ohba, K. and Mizukami, H. (2023). Protocol for producing an adeno-associated virus vector by controlling capsid expression timing. STAR Protoc. 4(4): 102542. https://doi.org/10.1016/j.xpro.2023.102542
- Otsu, N. (1979). A Threshold Selection Method from Gray-Level Histograms. IEEE Trans Syst Man Cybern. 9(1): 62–66. https://doi.org/10.1109/tsmc.1979.4310076
- Li, B., Zhou, D., Wang, X., Jiang, X., Sang, Y., Dai, Y., Yao, Y., Zhang, Y., Chen, C., Li, S., et al. (2025). Cholesterol sensing by the SCAP–FAM134B complex regulates ER-phagy and STING innate immunity. Nat Cell Biol. 27(10): 1739–1756. https://doi.org/10.1038/s41556-025-01766-y
Article Information
Publication history
Received: Sep 3, 2025
Accepted: Nov 20, 2025
Available online: Dec 14, 2025
Published: Jan 5, 2026
Copyright
© 2026 The Author(s); This is an open access article under the CC BY-NC license (https://creativecommons.org/licenses/by-nc/4.0/).
How to cite
Readers should cite both the Bio-protocol article and the original research article where this protocol was used:
- Zhang, M., Zhang, Y., Sang, Y. and Sun, Q. (2026). Generating ER-TRG and CA-ER-TRG Knock-in Mice and Quantitative In Vivo Imaging of ER-phagy. Bio-protocol 16(1): e5559. DOI: 10.21769/BioProtoc.5559.
- Sang, Y., Li, B., Su, T., Zhan, H., Xiong, Y., Huang, Z., Wang, C., Cong, X., Du, M., Wu, Y., et al. (2024). Visualizing ER-phagy and ER architecture in vivo. J Cell Biol. 223(12): e202408061. https://doi.org/10.1083/jcb.202408061
Category
Cell Biology > Cell structure > Cell organelle
Do you have any questions about this protocol?
Post your question to gather feedback from the community. We will also invite the authors of this article to respond.